Abstract
Stimulated emission depletion (STED) can achieve optical superresolution, with the optical diffraction limit broken by the suppression on the periphery of the fluorescent focal spot. Previously, it is generally experimentally accepted that there exists an inverse square root relationship with the STED power and the resolution, but with arbitrary coefficients in expression. In this paper, we have removed the arbitrary coefficients by exploring the relationship between the STED power and the achievable resolution from vector optical theory for the widely used 0–2π vortex phase modulation. Electromagnetic fields of the focal region of a high numerical aperture objective are calculated and approximated into polynomials of radius in the focal plane, and analytical expression of resolution as a function of the STED intensity has been derived. As a result, the resolution can be estimated directly from the measurement of the saturation power of the dye and the STED power applied in the region of high STED power.
1. INTRODUCTION
In 1873, Ernst Abbe derived the diffraction limit of conventional microscopy as dAbbe = λ/2 NA, which is also regarded as the resolution limit for optical microscopy [1]. It was not until the past few decades with the development of superresolution microscopy techniques that this limit has been surpassed [2]. One of these techniques, stimulated emission depletion (STED), belongs to the optical nanoscopy family of reversible saturable optical fluorescence transitions (RESOLFT) [3], in which the point spread function (PSF) of the fluorescence is engineered to obtain a higher resolution that breaks the optical diffraction limit [4]. In particular, a spatially modulated depletion beam is spatially overlapped on the excitation focal spot to effectively remove the peripheral fluorescence distribution with either STED [5], or by exciting the electron to a triplet state (ground state depletion) [6], or through excitation state absorption to excite the electron to a higher energy level [7]. To achieve superresolution in the lateral plane, a widely used method is to place a 0–2π vortex phase modulator in the optical path of the circular polarized depletion beam [8-11].
To estimate the theoretical superresolution power of STED, the most widely used expression is the square root law, in which the full-width at half-maximum , which was first developed by Westphal and Hell [12]. Here, h0 denotes the half-width full-maximum of confocal PSF. Harke et al. has derived , with a modulation factor C to the intensity [13,14]. It explains the experimental results well, but the arbitrary constant in expression varies on different systems, which makes it difficult to calculate resolution before the system is set up. The scalar solution to the depletion intensity of a 0–2π phase plate has been derived by Watanabe et al. [15]. Yet, without considering the vectorial nature of light, application of this theory is limited to an objective with a small incident angle, where the paraxial approximation is applicable. As a result, this theory fails for objectives with large incident angles. On the other hand, it is possible to numerically simulate the intensity distribution at the focal spot without analytical expression [16,17]. So far, despite the huge progress in the experimental instrumentation and application of STED in optical nanoscopy, accurate estimation of the performance of a STED system under a known depletion power is still lacking. It is therefore useful to establish a new formula describing the maximum achievable resolution of STED optical nanoscopy based on the relationship between actual depletion power and the saturation depletion power with half-original fluorescence.
In this paper, we use a vectorial theory to investigate the laser field in the neighborhood of focus. We present the diffraction analysis, where analytical excitation and depletion light intensity distributions are given, and then expanded with polynomials. Under high-resolution power conditions, expressions of FWHM on focal planes are derived from system parameters in both continuous wave (CW)-STED and pulsed-STED, with a second-order approximation of radius. We derived the origin of the coefficients in the formula and removed the need for arbitrary coefficients in the previous resolution law, . Then, we numerically simulate the electromagnetic fields, compare the results with our analytical results, and discuss the error induced by small-radius approximations.
2. DIFFRACTION OF A HIGH NUMERICAL APERTURE OBJECTIVE WITH VECTORIAL THEORY
Wolf et al. derived the vectorial theory of diffraction under the asymptotic and optical rays approximation [18,19]. For a linear polarized excitation laser beam, the electric beam in objective space can be written as
| (1) |
The coordinates are illustrated in Fig. 1. In an idealistic Gaussian image system, the above expression yields
where A1x = k1 f e1x/2, k1 = 2π/λex and e1x is the linear excitation electric field along the x axis, and on the focal plane integration, I0, I1, and I2 are given by (note that the number subscripts of I indicate integrations distinguished from intensity where subscripts are letters)
where . In STED, a 0–2π phase mask is generally used, as it can generate the most efficient inhibition pattern for fluorescence depletion [3]. The electric field of a depletion beam with distinct polarization states can be calculated [16]. Notice , and substitute exp (ikrp cos ε) = eikzp cos θ eikρp sin θ cos (ϕ − ϕp) eik Φ (θ, ϕ) into Eq. (1), where the phase function of 0–2π phase plate is eikΦ (θ, ϕ) = eiϕ, then we derive
| (2) |
Here, A2x = k2 f e2x/2 is proportional to linear depletion of the electric field and k2 = 2π/λde. The angular integrations I1 − I5 are defined as
Fig. 1.
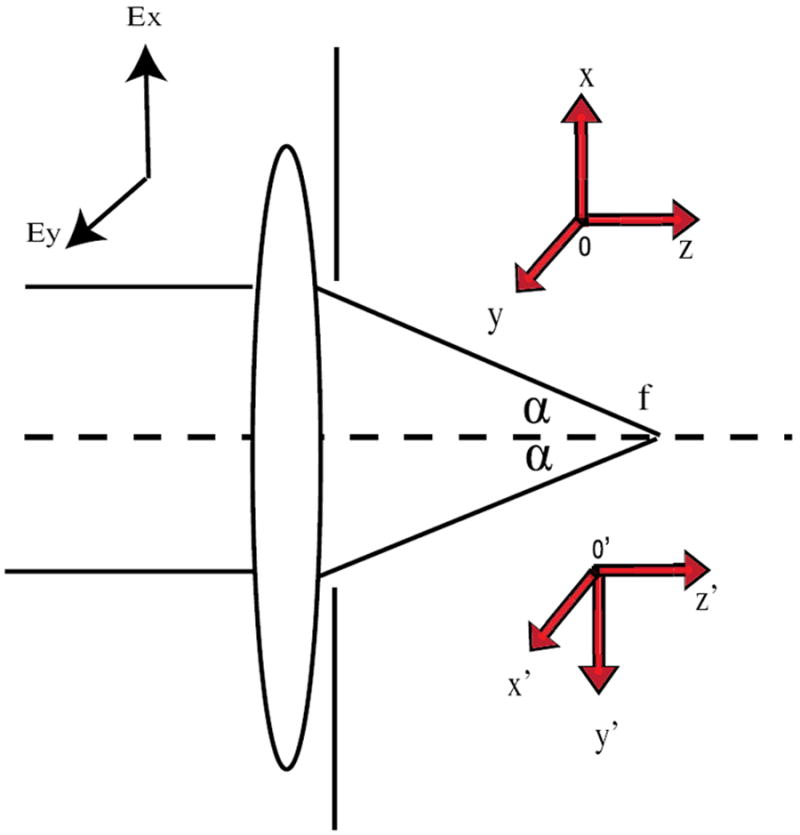
Diagram of the diffraction of a high-NA microscopic objective illustrating the coordinate systems.
We used STED3D, a home-built Matlab code to simulate the EM field of the excitation and depletion beams [20]. The parameters we used are listed as follows: numerical aperture (NA) of the objective lens, NA = 1.4; refractive index of the objective space, n = 1.5; focus length of the lens, f = 1.8 mm; excitation wavelength, λex = 635 nm; depletion wavelength, λde = 760 nm; and the incident excitation beam was set to be circularly polarized. To verify our simulation, we first plotted the excitation intensity on the x–y and x–z plane in Fig. 2. The FWHMs are 256.8 and 605.7 nm, respectively, which is in good agreement with results obtained from PSF Lab [21].
Fig. 2.
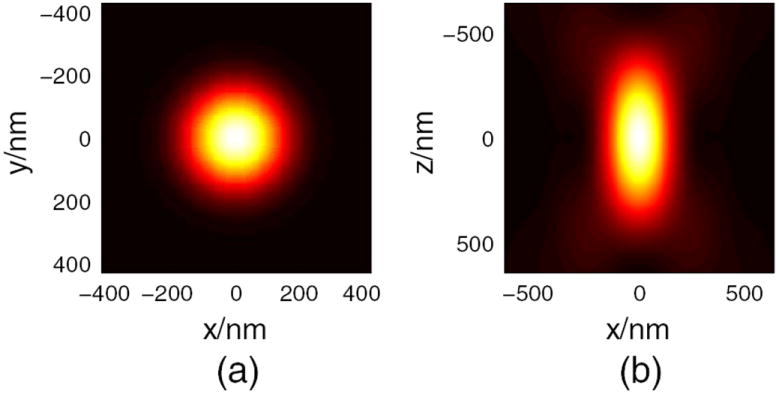
Excitation intensity on (a) x–y plane and (b) x–z plane.
For circular polarization incidence, the electric field can be obtained by coordinate rotation [22]. The electromagnetic field now consists of contributions of two linear polarized incident fields along the x and y axis:
| (3) |
where , , . Then, intensity of the laser field could be calculated by for both the excitation and depletion beams, and residual intensity is Iresidual = Iex * η(Ide), where η(Ide) = 1/(1 + Ide/Is) for continuous beams, and η(Ide) = exp[− (ln 2)Ide/Is] for pulsed STED [23].
Now consider the light intensity distribution on focal plane zp = 0. Since , the second-order approximation can be used: J0 (x) = 1 − (x2/4), J1 (x) = (x/2), and J2 (x) = (x2/8). Define s = sin2 α and , which is the incomplete Beta function, and we can express I1 − I5 as polynomials of ρp, with their coefficients given by a01 − b5, and their coefficients are incomplete Beta functions of s, as shown in Appendix A. For a linear or elliptically polarized laser, it is always possible to rotate coordinates to make the polarization a standard ellipse with A1x = C1, A1y = iC2, A2x = D1, and A2y = iD2, where C1, C2, D1, and D2 are real. When the radius of area is much smaller than λ/2π, higher-order terms in Eq. (2) are insignificant. We substitute approximated expressions of Bessel functions into Eq. (2), and use the resulting electric field to calculate light intensity. Then, the excitation and STED doughnut intensities can be expressed as
| (4) |
This expression gives an analytical description of the excitation and depletion intensities in the vicinity of the focus. A special case is that the depletion beam is left-circular polarized (the same as the direction of the vortex direction) with and , which indicates that the center of donut has zero intensity. Then and . For an elliptically polarized laser or linearly polarized laser [24], D1 ≠ D2 leads to Ide ≠ 0 at the focus. This is derived from second-order approximation, but still holds true for a strict analytical solution because all of the higher-orders annihilate at r = 0. The results obtained with our methods can also be validated with [17], as shown in Fig. 3. The FWHM of STED PSF could be estimated accordingly, with the decay functions for CW or pulse cases described in Appendix A.
Fig. 3.
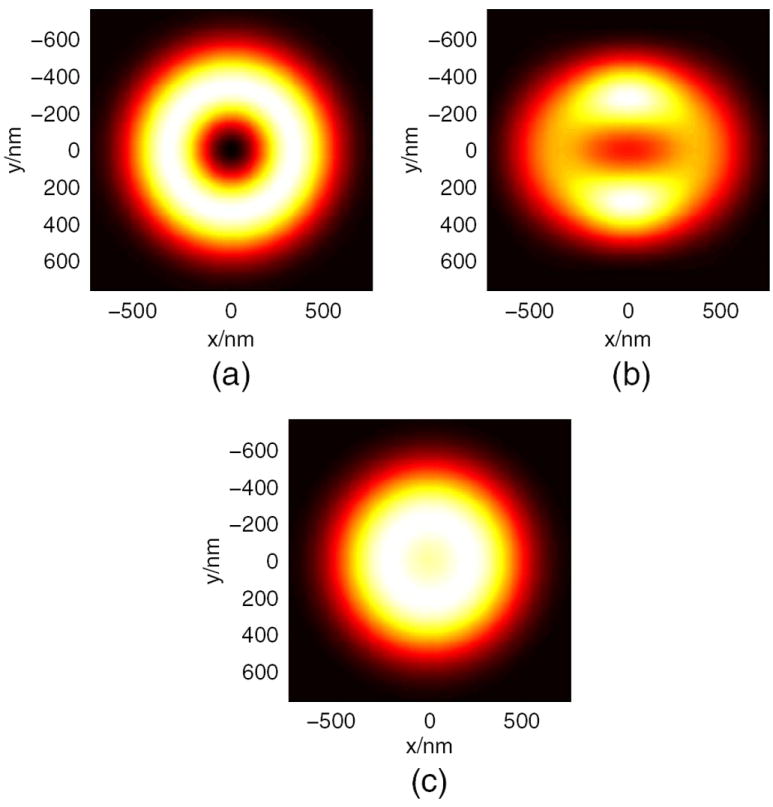
Intensity on the x–y plane of focus for the depletion laser with a (a) left-circular polarized, (b) linear polarized, and (c) right-circular polarized laser.
3. SIMULATIONS
A. Resolution and Depletion of Intensity
Stimulated emission intensity Is could be defined as the intensity of fluorescence dropped into its half [13,23,25]. The intensity Is could be measured as the following procedures:
Measure the peak fluorescence intensity of excitation beam by scanning the focus across a fluorophore (here the size of the fluorophore is assumed to be very small, i.e., a delta function).
Introduce the depletion beam without phase modulation, whose PSF should be overlapped with the PSF of the excitation.
Adjust the depletion power until the peak fluorescence intensity is depleted to its half [13].
As a result, such peak depletion intensity is defined as Is. When the CW saturation function η(I) = 1/(1 + I/Is) is considered to its second-order [23]
| (5) |
where Idep is the nonmodulated peak intensity of the depletion beam focus, and
| (6) |
For NA = 1.4 and n = 1.5, λex = 635 nm, and λde = 760 nm, this expression yields . For pulsed-STED with the saturation function η(I) = exp (− ln 2I/Is), it is more convenient to rewrite excitation into an exponential function [23], and thus
| (7) |
With the same system parameters, this expression yields FWHM = λex (1 = 0.233Idep/Is)−1/2/1.83NA. We found the inverse root law still holds in vectorial theory except for modification factors α and β, which are incomplete Beta functions with aperture angles as their parameters. In brief, there should be a 0.233 or 0.168 correcting factor (roughly 1/4 and 1/6) for pulsed- or CW-STED, respectively, when calculating the resolution with respect to the depletion intensity. This is the main conclusion of this paper.
We plotted in Fig. 4 the simulated FWHM (red) and the calculated results in Eq. (5) (blue). Figure 4(a) is the CW case with fraction saturation function, and Fig. 4(b) is the pulsed case with exponential saturation function [23]. In both figures the two curves overlap well, which validates Eq. (5).
Fig. 4.
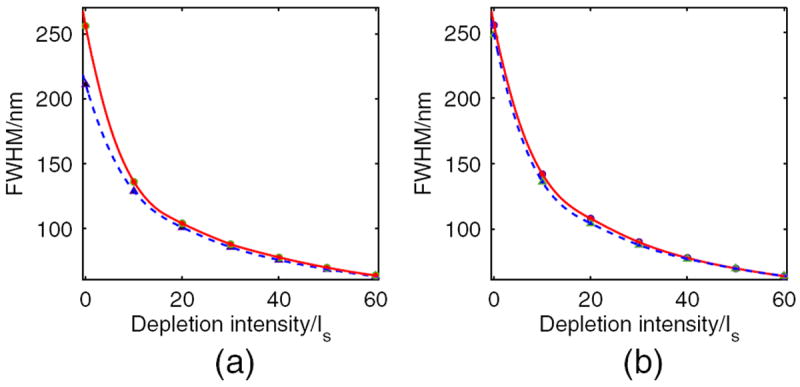
Relationship between the depletion intensity and its resulting resolution. Simulation results are plotted as a red solid line for CWSTED (a) and pulsed-STED (b). Predicted resolutions of Eq. (5) are plotted as a blue dashed line in (a) and (b).
When considering that the integrated fluorescence intensity dropped by half, the required depletion intensity has to be increased. Here, the relationship between the depletion intensity ratio I/Is and the fluorescence intensity ratio Pdet/P0 is shown in Fig. 5. As can be seen, the saturation power Ps corresponds to about twice the saturation intensity Is.
Fig. 5.
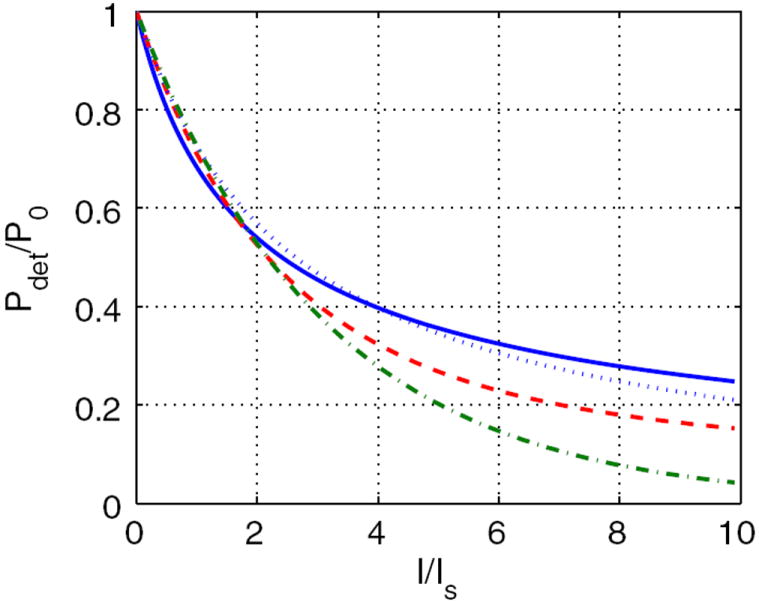
Integration-depleted fluorescence efficiency and depletion intensity. Simulation results are plotted as a blue solid line for CW-STED and a red dashed line for pulsed-STED. The fractal (blue dotted line) and exponential (green dashed and dotted line) fits are performed for CW-STED and pulsed-STED, respectively.
B. Resolution and Depletion of Laser Power
Experimentally, the measurement of intensity is often replaced with measuring the laser power, as the power is easier to be measured. Then, the intensity distribution for modulated and unmodulated STED PSFs can be calculated accordingly [26]. To avoid the disturbance from sample photobleaching, a fluorescent solution is used instead of an ultrasmall fluorescent nanosphere.
Measure the average fluorescence intensity of the excitation beam by scanning the focus across the fluorescent solution (a uniform function) [13,26].
Introduce the depletion beam without phase modulation, whose PSF should be overlapped with the PSF of the excitation.
Adjust the depletion power until the total fluorescence intensity is depleted to its half [13,26].
Therefore, it is more convenient to express the resolution of STED with the relationship of P/Ps, where P is the depletion power and Ps is defined by the depletion power when the detected integrated fluorescence intensity (scanning across solution) is reduced by half. Numerical evaluation of the factor reveals P = Ps approximately corresponds to I = 2Is. Then, the resolution versus STED-power relationship becomes [26,27]
| (8) |
where P is the depletion power; Ps is the saturation power when the fluorescence is reduced by half. Our representation of resolution then becomes and for CW-STED and pulsed-STED, respectively. As an example, typical values of parameter χ for different dyes in both CWand pulsed-STED situations are listed in Table 1.
Table 1. Typical Values of χ for Different STED Systemsa.
| Dye | Wavelengths (nm)
|
Pulsed-STED χ |
CW-STED χ |
|
|---|---|---|---|---|
| Excitation Depletion | ||||
| ATTO 532 | 470 | 603 | 0.31 | 0.40 |
| Alexa Fluor 488, Chromeo 488, | 488 | 592 | 0.36 | 0.45 |
| FITC, DY-495, Citrine GFP | 490 | 575 | 0.42 | 0.53 |
| Citrine, YFP | 490 | 600 | 0.35 | 0.44 |
| Pyridine 2, RH414 | 554 | 745 | 0.26 | 0.33 |
| Alexa 594, Daylight 594, ATTO 594 | 570 | 690 | 0.36 | 0.45 |
| ATTO 633, ATTO 647N, Abberior STAR635 | 635 | 750 | 0.42 | 0.52 |
Dates of excitation and depletion wavelengths are from [30]. Numerical aperture of the lens is set to be NA = 1.4, and α = 2.15 for pulsed-STED, α = 1.82 for CW-STED.
4. CONCLUSION AND DISCUSSION
In this paper, we applied a polynomial approximation of the Bessel integrals to yield an analytical expression of STED with vectorial waves. We derived the origin of the coefficients in the formula and removed the need for arbitrary coefficients in the previous expression, . We have given new sets of resolution estimation equations to predict the resolution achievable for a STED system: the expression of resolution, incident depletion intensity, and half-peak-fluorescence depletion intensity are analytically derived with incomplete Beta functions, and the relationship of half-peakfluorescence depletion intensity and half-total-fluorescence depletion power was established by simulation. The result can be extended to other RESOLFT-type superresolution techniques where the fluorescence PSF is modulated with another doughnut shape PSF through 0–2π phase modulation.
We used STED 3D to simulate the electromagnetic field distributions around the focus. In Fig. 6, we plotted the excitation (a) and depletion (b) intensities on the x axis of the focal plane. In Fig. 6(a), the simulation intensity was plotted in red, the polynomial approximation of Eq. (4) was plotted in blue, and the exponential approximation was plotted in green. In Fig. 6(b) the numerical solution to the rigid EM field intensity was plotted in red, and the polynomial approximation of Eq. (4) was plotted in blue. As expected, approximations agreed well with the numerical solution of the EM field in the vicinity of focus. This is because in the derivation of Eq. (5), asymptotic expansion at r = 0 makes the approximation only available in the vicinity of the focus. In Fig. 6, we found that the curves of analytical and simulation laser intensity overlap well when r was small, but diverged with the increase of r. In Fig. 6, we also found that when r < 80 nm, the approximated excitation and depletion intensities will induce errors of 5% and 8%, respectively. As a result, our theory applies to highaperture objective lenses with NA > 1, or those with high depletion intensity, roughly when the FWHM is less than λ/3. For smaller aperture objective lenses in which the incident angle is small, Watanabe’s theory [15] along with scalar diffraction theory [28,29] can provide an acceptable estimation. For the same reason, in Fig. 4, the analytical FWHM curves better predicts results with an error less than 5% when I > 10Is. With the development of the high-efficiency fluorescent dye, and through application of larger STED power, STED resolution of 6 nm has been demonstrated [4], and typical STED system resolution is <80 nm. Because the best STED nanoscopy resolution at a certain depletion power is usually concerned, rather than the resolution at moderate power, our result has a wide scope of applications in the accurate estimation of the STED (or RESOLFT) system performance.
Fig. 6.
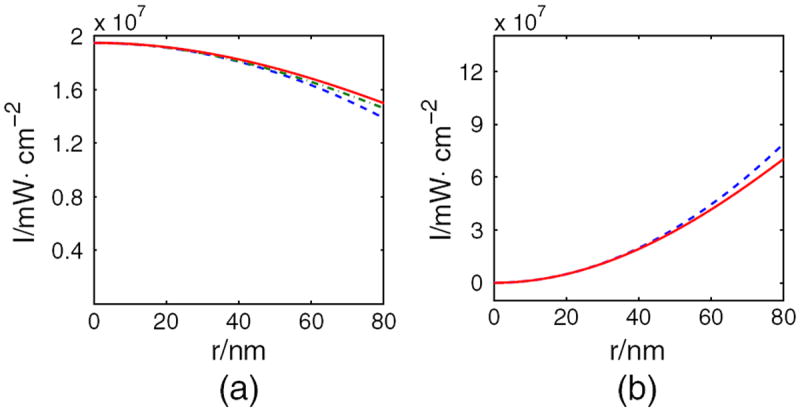
Intensity profile of (a) excitation and (b) depletion beams on the x axis of the focal plane. Simulation intensities are plotted in red, the polynomial approximation of Eq. (4) is plotted in blue, and the exponential approximation is plotted in green in (a).
There are several improvements that can be made in the future. One is introducing the Gaussian spatial distribution of the incident lasers, which can be done by inserting a Gaussian factor in the integration of I0 − I5. Since the beam is generally expanded for overfilling the back aperture of the objective, the planar wave can serve as a very good approximation to the experimental situation. Another possible improvement would result from retaining higher orders in the Bessel summation. It may reduce the error when the radius increases at the cost of much complexity in the expression.
Acknowledgments
Xi thanks Stefan W. Hell for mentoring and training on STED nanoscopy instrumentation. We thank Thomas Lawson for critical proofreading of the manuscript. This research is supported by the “973” Major State Basic Research Development Program of China (Grant Nos. 2011CB809101, 2010CB933901, and 2011CB707502) and the National Natural Science Foundation of China (Grant No. 61178076).
APPENDIX A: DERIVATIONS AND VALIDATIONS
To analytically derive the field of a circular-polarized incident laser, it is necessary to note that in the rotated coordinations, Eq. (1) still holds with the phase mask function eikΦ (θ′, ϕ′) = 1 for the excitation beam, and eikΦ (θ′, ϕ′) = ei(ϕ′ + (π//2)) for the depletion beam. It yields
for excitation, and
for depletion.
In Eq. (4) the parameters are defined as
| (A1) |
where a01 = [B(s, 1,3/4) + B(s, 1,5/4)]/2; a02 = [B(s, 2,3/4 + B(s, 2,5/4)]/8; a1 = B(s, 2,3/4)/4; a2 = B(s, 2,3/4)B(s, 2,5/4)]/16; b1 = [B(s, 3/2, 3/4 + B(s,3/2, 5/4)]/4; b2 = [B (s, 3/2, 3/4) − B (s, 3/2, 5/4)]/4; b41 = B(s, 3/2, 3/4); b42 = B(s, 5/2, 3/4)/4; and b5 [ B(s, 5/2, 3/4)/8.
To obtain Eq. (5), it is important to keep in mind that without phase plate, . If we defined the depletion power as when peak fluoresce intensity is half, we also have . So, depletion laser power in Eq. (4) is equivalent to the peak intensity ratio Idep/Is in Eq. (5). For a continuous wave, Iex (ρ) η (Idep (ρ)) = Iex (0)/2,η(Idep) = 1/(1 + Idep/Is), , and yield
| (A2) |
And for continuous wave, Iex(ρ)η(Idep(ρ)) = Iex(0)/2, η(Idep) = exp(−ln 2Idep/Is), , and yield
| (A3) |
Then, in Eq. (5), the factors α and β can be obtained.
References
- 1.Abbe E. Beiträge zur Theorie des Mikroskops und der mikroskopischen Wahrnehmung. Archiv für Mikroskopische Anatomie. 1873;9:413–418. [Google Scholar]
- 2.Ding Y, Xi P, Ren Q. Hacking the optical diffraction limit: review on recent developments of fluorescence nanoscopy. Chin Sci Bull. 2011;56:1857–1876. [Google Scholar]
- 3.Keller J, Schönle A, Hell S. Efficient fluorescence inhibition patterns for RESOLFT microscopy. Opt Express. 2007;15:3361–3371. doi: 10.1364/oe.15.003361. [DOI] [PubMed] [Google Scholar]
- 4.Rittweger E, Han K, Irvine S, Eggeling C, Hell S. STED microscopy reveals crystal colour centres with nanometric resolution. Nat Photonics. 2009;3:144–147. [Google Scholar]
- 5.Hell S, Wichmann J. Breaking the diffraction resolution limit by stimulated emission: stimulated-emission-depletion fluorescence microscopy. Opt Lett. 1994;19:780–782. doi: 10.1364/ol.19.000780. [DOI] [PubMed] [Google Scholar]
- 6.Fölling J, Bossi M, Bock H, Medda R, Wurm C, Hein B, Jakobs S, Eggeling C, Hell S. Fluorescence nanoscopy by ground-state depletion and single-molecule return. Nat Methods. 2008;5:943–945. doi: 10.1038/nmeth.1257. [DOI] [PubMed] [Google Scholar]
- 7.Irvine S, Staudt T, Rittweger E, Engelhardt J, Hell S. Direct light-driven modulation of luminescence from mn-doped znse quantum dots. Angew Chem. 2008;120:2725–2728. doi: 10.1002/anie.200705111. [DOI] [PubMed] [Google Scholar]
- 8.Galiani S, Harke B, Vicidomini G, Lignani G, Benfenati F, Diaspro A, Bianchini P. Strategies to maximize the performance of a STED microscope. Opt Express. 2012;20:7362–7374. doi: 10.1364/OE.20.007362. [DOI] [PubMed] [Google Scholar]
- 9.Liu Y, Ding Y, Alonas E, Zhao W, Santangelo P, Jin D, Piper J, Teng J, Ren Q, Xi P. Achieving λ/10 resolution CW STED nanoscopy with a Ti:sapphire oscillator. PLoS ONE. 2012;7:e40003. doi: 10.1371/journal.pone.0040003. [DOI] [PMC free article] [PubMed] [Google Scholar]
- 10.Tzeng Y, Faklaris O, Chang B, Kuo Y, Hsu J, Chang H. Superresolution imaging of albumin-conjugated fluorescent nanodiamonds in cells by stimulated emission depletion. Angew Chem Int Ed. 2011;50:2262–2265. doi: 10.1002/anie.201007215. [DOI] [PubMed] [Google Scholar]
- 11.Vicidomini G, Schönle A, Ta H, Han KY, Moneron G, Eggeling C, Hell SW. STED nanoscopy with time-gated detection: theoretical and experimental aspects. PLoS ONE. 2013;8:e54421. doi: 10.1371/journal.pone.0054421. [DOI] [PMC free article] [PubMed] [Google Scholar]
- 12.Westphal V, Hell S. Nanoscale resolution in the focal plane of an optical microscope. Phys Rev Lett. 2005;94:143903. doi: 10.1103/PhysRevLett.94.143903. [DOI] [PubMed] [Google Scholar]
- 13.Harke B, Keller J, Ullal C, Westphal V, Schönle A, Hell S. Resolution scaling in STED microscopy. Opt Express. 2008;16:4154–4162. doi: 10.1364/oe.16.004154. [DOI] [PubMed] [Google Scholar]
- 14.Han KY, Willig KI, Rittweger E, Jelezko F, Eggeling C, Hell SW. Three-dimensional stimulated emission depletion microscopy of nitrogen-vacancy centers in diamond using continuous-wave light. Nano Lett. 2009;9:3323–3329. doi: 10.1021/nl901597v. [DOI] [PubMed] [Google Scholar]
- 15.Watanabe T, Igasaki Y, Fukuchi N, Sakai M, Ishiuchi S, Fujii M, Omatsu T, Yamamoto K, Iketaki Y. Formation of a doughnut laser beam for super-resolving microscopy using a phase spatial light modulator. Opt Eng. 2004;43:1136. [Google Scholar]
- 16.Deng S, Liu L, Cheng Y, Li R, Xu Z. Effects of primary aberrations on the fluorescence depletion patterns of sted microscopy. Opt Express. 2010;18:1657–1666. doi: 10.1364/OE.18.001657. [DOI] [PubMed] [Google Scholar]
- 17.Hao X, Kuang C, Wang T, Liu X. Effects of polarization on the de-excitation dark focal spot in STED microscopy. J Opt. 2010;12:115707. [Google Scholar]
- 18.Wolf E. Electromagnetic diffraction in optical systems. I. an integral representation of the image field. Proc R Soc Edinburgh, Sect A. 1959;253:349–357. [Google Scholar]
- 19.Richards B, Wolf E. Electromagnetic diffraction in optical systems. II. Structure of the image field in an aplanatic system. Proc R Soc London, Ser A. 1959;253:358–379. [Google Scholar]
- 20.STED3D: PSF simulation and resolution estimation for STED. http://code.google.com/p/sted3d/
- 21.Nasse M, Woehl J. Realistic modeling of the illumination point spread function in confocal scanning optical microscopy. J Opt Soc Am A. 2010;27:295–302. doi: 10.1364/JOSAA.27.000295. [DOI] [PubMed] [Google Scholar]
- 22.Voort H, Brakenhoff G. 3-D image formation in high-aperture fluorescence confocal microscopy: a numerical analysis. J Microsc. 1990;158:43–54. [Google Scholar]
- 23.Leutenegger M, Eggeling C, Hell S. Analytical description of STED microscopy performance. Opt Express. 2010;18:26417–26429. doi: 10.1364/OE.18.026417. [DOI] [PubMed] [Google Scholar]
- 24.Chu K, Mertz J. Single-exposure complementary aperture phase microscopy with polarization encoding. Opt Lett. 2012;37:3798–3800. doi: 10.1364/ol.37.003798. [DOI] [PubMed] [Google Scholar]
- 25.Donnert G, Keller J, Medda R, Andrei M, Rizzoli S, Lührmann R, Jahn R, Eggeling C, Hell S. Macromolecular-scale resolution in biological fluorescence microscopy. Proc Natl Acad Sci USA. 2006;103:11440–11445. doi: 10.1073/pnas.0604965103. [DOI] [PMC free article] [PubMed] [Google Scholar]
- 26.Willig K, Harke B, Medda R, Hell S. STED microscopy with continuous wave beams. Nat Methods. 2007;4:915–918. doi: 10.1038/nmeth1108. [DOI] [PubMed] [Google Scholar]
- 27.Hell S, Stelzer E. Properties of a 4pi confocal fluorescence microscope. J Opt Soc Am A. 1992;9:2159–2166. [Google Scholar]
- 28.Born M, Wolf E, Bhatia A. Principles of Optics: Electro-magnetic Theory of Propagation, Interference and Diffraction of Light. Cambridge University; 1999. [Google Scholar]
- 29.Goodman JW. Introduction to Fourier Optics. Roberts & Company; 2005. [Google Scholar]
- 30.Fluorescent dyes used in STED microscopy. 2013 Feb; http://nanobiophotonics.mpibpc.mpg.de/old/dyes/


