Abstract
Purpose
Deformable image registration (DIR) is an integral component for adaptive radiation therapy. However, accurate registration between daily cone-beam computed tomography (CBCT) and treatment planning CT is challenging, due to significant daily variations in rectal and bladder fillings as well as the increased noise levels in CBCT images. Another significant challenge is the lack of “ground-truth” registrations in the clinical setting, which is necessary for quantitative evaluation of various registration algorithms. The aim of this study is to establish benchmark registrations of clinical patient data.
Materials/Methods
Three pairs of CT/CBCT datasets were chosen for this IRB-approved retrospective study. On each image, in order to reduce the contouring uncertainty, ten independent sets of organs were manually delineated by five physicians. The mean contour set for each image was derived from the ten contours. A set of distinctive points (round natural calcifications and 3 implanted prostate fiducial markers) were also manually identified. The mean contours and point features were then incorporated as constraints into a B-spline based DIR algorithm. Further, a rigidity penalty was imposed on the femurs and pelvic bones to preserve their rigidity. A piecewise-rigid registration approach was adapted to account for the differences in femur pose and the sliding motion between bones. For each registration, the magnitude of the spatial Jacobian (|JAC|) was calculated to quantify the tissue compression and expansion. Deformation grids and finite-element-model-based unbalanced energy maps were also reviewed visually to evaluate the physical soundness of the resultant deformations. Organ DICE indices (indicating the degree of overlap between registered organs) and residual misalignments of the fiducial landmarks were quantified.
Results
Manual organ delineation on CBCT images varied significantly among physicians with overall mean DICE index of only 0.7 among redundant contours. Seminal vesicle contours were found to have the lowest correlation amongst physicians (DICE=0.5). After DIR, the organ surfaces between CBCT and planning CT were in good alignment with mean DICE indices of 0.9 for prostate, rectum, and bladder, and 0.8 for seminal vesicles. The Jacobian magnitudes |JAC| in the prostate, rectum, and seminal vesicles were in the range of 0.4–1.5, indicating mild compression/expansion. The bladder volume differences were larger between CBCT and CT images with mean |JAC| values of 2.2, 0.7, and 1.0 for three respective patients. Bone deformation was negligible (|JAC|=~1.0). The difference between corresponding landmark points between CBCT and CT was less than 1.0 mm after DIR.
Conclusions
We have presented a novel method of establishing benchmark deformable image registration accuracy between CT and CBCT images in the pelvic region. The method incorporates manually delineated organ surfaces and landmark points as well as pixel similarity in the optimization, while ensuring bone rigidity and avoiding excessive deformation in soft tissue organs. Redundant contouring is necessary to reduce the overall registration uncertainty.
Keywords: deformable image registration, finite element method, adaptive radiation therapy
I. Introduction
Prostate cancer is the second leading cause of cancer death among men in the United States (Siegel et al., 2012). Intensity modulated radiation therapy (IMRT) has become the primary modality in external beam radiotherapy for treating localized prostate cancers due to its ability to conform radiation to the target while limiting the dose to nearby normal organs, such as rectum and bladder. However, a population-based conventional margin is still necessary around the clinical target volume for proper target coverage, in order to take into account the inter- and intra- fraction prostate motions (Langen and Jones, 2001; Langen et al., 2008; Frank et al., 2008; Ghilezan et al., 2005; Deurloo et al., 2005; Schiffner et al., 2007). Such a margin, however, may increase radiation toxicity to neighboring organs at risk at the same time.
Knowledge of the target location prior to or during treatment may allow one to reduce the treatment target margins for reduced normal organ toxicity or to escalate the target dose while maintaining the same normal tissue complication. There have been many efforts toward localizing the prostate for accurate delivery, using for instance, urethral catheters (Bergstrom et al., 1998), implanted fiducial markers (Nederveen et al., 2000; Schiffner et al., 2007; Kitamura et al., 2002), ultrasound imaging (Orton et al., 2006; Fuss et al., 2003; Serago et al., 2002; Trichter and Ennis, 2003), and two-dimensional (2D) x-ray or three-dimensional (3D) computational tomography (CT) imaging (Hua et al., 2003; Smitsmans et al., 2004; Smitsmans et al., 2005; Court and Dong, 2003; Paskalev et al., 2004).
Among these prostate localization approaches, 3D CT in-room imaging is becoming more common place in clinics. One of the primary advantages, in comparison to others, is the soft tissue visibility. Fully automatic rigid-body image registration algorithms have been proposed for on-line patient setup, aiming at precise alignment of the prostate to deliver the planned radiation more accurately (Smitsmans et al., 2004; Smitsmans et al., 2005; Court and Dong, 2003). Furthermore, soft tissue visibility allows one to track the dosimetric and geometric organ changes over the course of radiotherapy and adjust the original plan accordingly if necessary, which is known as adaptive radiation therapy (ART)(Yan et al., 1997).
Deformable image registration (DIR) is an integral component of ART-based schemes. It makes possible to warp contours and dose distributions from one image to another. However, despite the large number of medical image registration algorithms developed over the two decades (Maintz and Viergever, 1998; Hill et al., 2001), there have not been many studies published on the subject of deformably registering CT and cone-beam CT (CBCT) images for prostate cancer radiotherapy (Lu et al., 2010a; Lu et al., 2010b; Paquin et al., 2009; Greene et al., 2009; Chao et al., 2008; Lawson et al., 2007; Zhong et al., 2007). Primary challenges, associated with kV-cone-beam imaging of the prostate, include poor signal-to-noise ratio of CBCT images, significant daily rectum and bladder changes, as well as lower abdominal motion artifacts.
Another significant challenge is the lack of “ground-truth” registrations in the clinical setting, which are necessary for quantitative accuracy assessment of algorithms. Physical phantoms or synthetically generated deformations have been utilized in the previous studies (Lawson et al., 2007; Zhong et al., 2010; Paquin et al., 2009; Zhong et al., 2007), but artificial objects differ from real patients. Utilizing manually delineated corresponding features, such as organ contours and distinct points, is another common method employed (Greene et al., 2009; Chao et al., 2008), but validation is limited to these localized features. Furthermore, it has been reported that the inter-user variation of manual delineations was high on CBCT images among clinicians (Lütgendorf-Caucig et al., 2011).
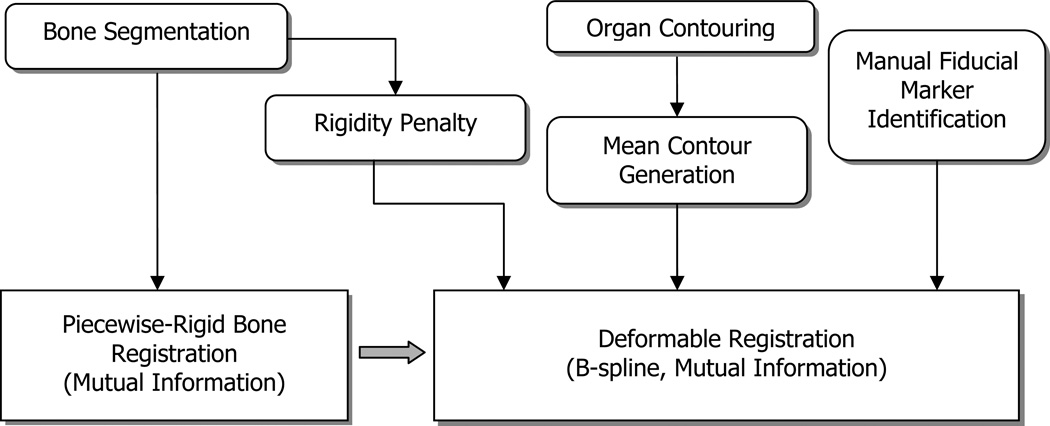
In this study, we present a novel approach for establishing benchmark CT-CBCT deformable registrations from clinical patient datasets. Figure 1 shows the overall flow diagram of the approach, and the technique is summarized as follows: A piecewise-rigid registration method is employed for the femoral and pelvic bone registrations, followed by a B-spline based DIR algorithm (Elastix, Klein et al., 2010) for soft tissue registration. To help constrain the registration, manually delineated organ contours and distinct points were incorporated in the optimization routine, along with a rigidity penalty imposed for bony regions. Soft tissue deformation was quantified and excessive deformations in organs were avoided.
Figure 1.
Overall flow diagram of registrations (input images and pre-processing blocks are omitted).
II. Materials and Methods
Dataset
The planning CT and CBCT (CT/CBCT) image pairs of three patients were chosen for retrospective analysis under an institutional review board (IRB) approved protocol. The patients had three electromagnetic transponder beacons (Calypso/Varian Medical Systems, Palo Alto, CA) transrectally implanted into the prostate; one at the prostate apex and two in the base. Simulation CT images were acquired using Brilliance Big Bore CT scanner (Philips Healthcare, Andover, MA); 140 kVp, 500 mAs, 60 cm FOV, helical mode, and software version 2.3.5. The in-plane resolution was 1.4×1.4 mm2 and the slice thickness/spacing was 2 mm. The CBCT images were acquired using On-Board Imager (Varian Medical System, Palo Alto, CA); 125 kV, 80 mA, 45 cm FOV, 360° rotation, ~650 projection images, half-bowtie filter, 150 cm SID, 14.6 cm lateral detector shift, 27.2 × 18.6 cm2 blade opening, and software version 2.1.5.2.
Organ contour and fiducial point delineation
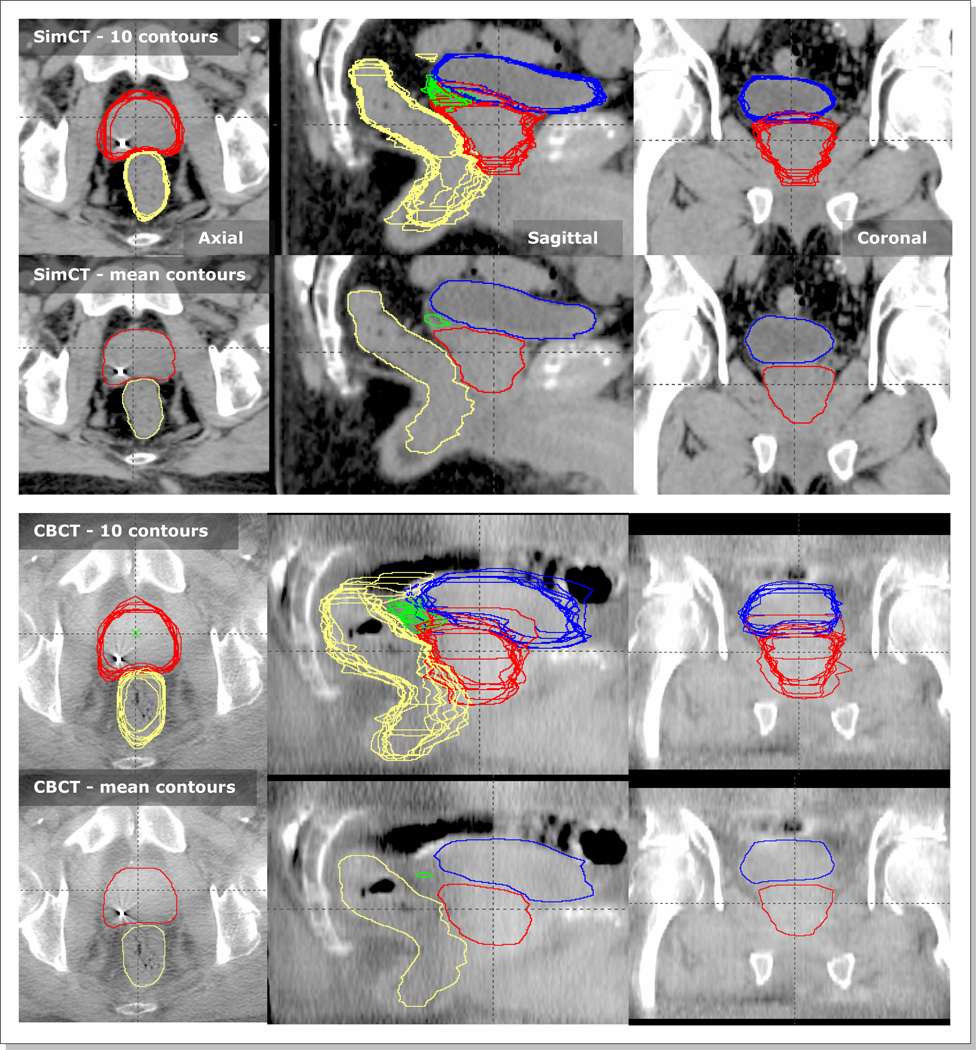
Five physicians manually contoured organs of prostate, bladder, rectum, and seminal vesicles (SV) twice on each image (i.e., ten contour sets per image). The first and second rows of Figure 2 show an example pair of CT and CBCT images with contoured organs. The separation in time was kept large (~ two months) between the two contouring sessions per physician for reduced inter-dependency. Our clinical treatment planning system (Eclipse Varian Medical Systems, Palo Alto, CA) was used for contouring. After the ten sets of independent contours were generated, they were merged into one mean contour set (the second and fourth rows of Figure 2). For merging, a particular pixel was considered part of an organ if it was classified as such in greater than 5 contour sets, which was achieved by adding ten contour mask images pixel by pixel followed by thresholding with a value of 5.5.
Figure 2.
Ten physician delineated contours of prostate (red), bladder (blue), rectum (yellow), and seminal vesicles (green), and their corresponding mean contours on a pair of SimCT and CBCT images. The first two rows are contours on SimCT and the following two rows are those on CBCT.
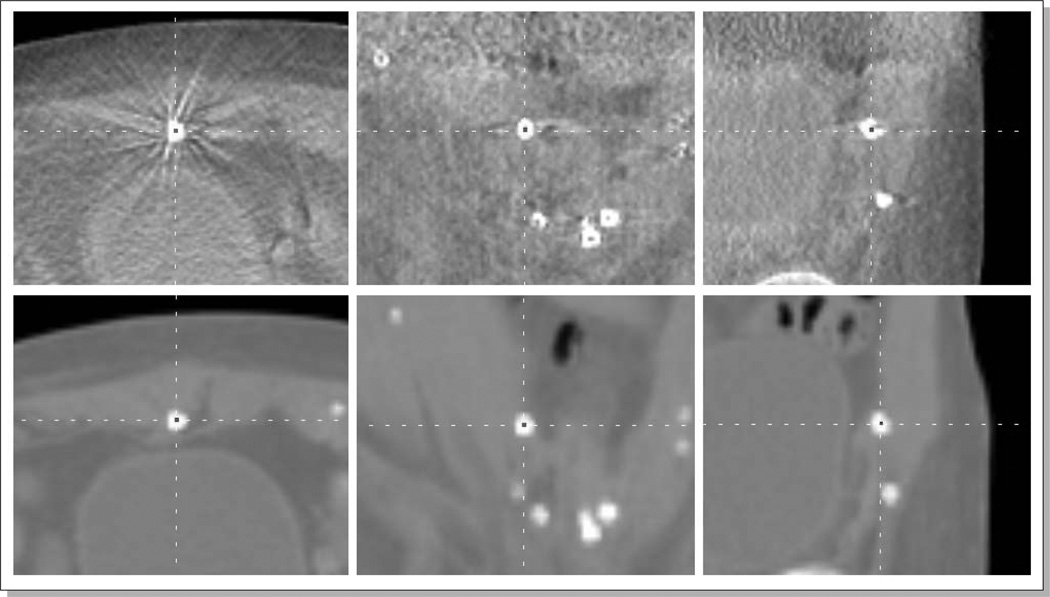
In addition to the organ contouring, a set of distinctive points (round natural calcifications and implanted Calypso markers) were manually identified on both CT/CBCT image pairs. The number of identified points was approximately 20 per image pair. Figure 3 shows an example manual identification of a round natural calcification on a pair of CBCT (top) and CT (bottom) images. An in-house-developed software was used for efficient delineation.
Figure 3.
An example manual identification of a natural calcification on a CBCT (top) and CT (bottom) images.
Image pre-processing
All CT/CBCT images were enhanced using the adaptive histogram equalization (AHE) algorithm (Stark, 2000). The aim was to reduce the pixel value differences between the CT and CBCT image pairs, and to reduce the non-uniform intensity distributions across the rectum, bladder, and prostate on CBCT images (Kim et al., 2010).
Piecewise bone registration
In order to model body deformation, we chose to use a uniform cubic B-spline grid model (Elastix, Klein et al., 2010). One of the benefits of such a model is that it inherently produces a smoothly varying deformation over the image, especially when the number of B-spline nodes is reduced. However, the B-spline model is not suitable for characterizing abrupt changes in deformation, i.e. high frequency components of deformation field, such as the sliding motion between organ boundaries. In the pelvic area, sliding motion can occur between the femoral heads and their corresponding pelvic bone sockets. In order to tackle this problem, we segmented the left/right femoral and pelvic bones on both input images, and registered them separately with rigid-body transformations using the segmentations as regions of interests (ROI). The three rigid-body registrations were combined into one by a distance weighted interpolation. The combined transformation Tbone at a point x was calculated as follows:
where Tleft-femoral-bone, Tright-femoral-bone, and Tpelvis were the rigid-body transformations of the left and right femoral bones and the pelvis respectively. The parameters wi were the corresponding weights, which decrease as the point x is further away from the closest bone surface. The three weights were calculated as follows:
The distance from a point x to the corresponding bone surface, di(x), was calculated using Maurer's Euclidean distance transformation algorithm (Maurer Jr et al., 2003). The negative distances inside the bone ROIs were truncated to zero.
Deformable soft tissue registration
With all bones registered, the soft tissue regions were registered using a uniform cubic B-spline-based deformable registration algorithm (Elastix, Klein et al., 2010). A gradient descent optimization algorithm was employed with a cost function as follows:
| (Eq. 1) |
The cost function C(T) was a weighted summation of four terms, which incorporates image pixel intensities, delineated mean contours, fiducial points, and the bone rigidity constraints. The superscript T denotes a transformation applied to an object; i.e., represents a CT image transformed by T. The gradient descent algorithm is a minimization optimizer. Therefore, the three negative (−) signs were used to maximize the mutual information metrics and rigidity penalty term, while a positive (+) sign to minimize the point distances.
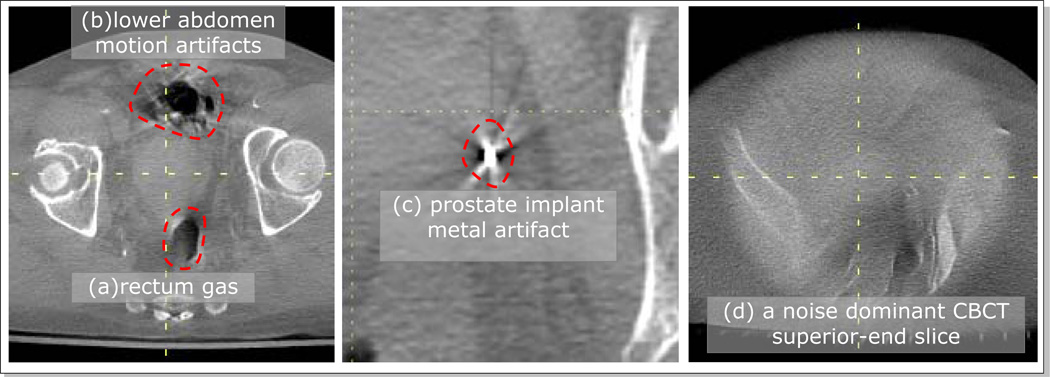
The first term is the mutual information (MI) of the pixel intensities of CBCT and deformed CT images. The regions of inconsistent image contents between two input images were manually drawn on the input images using a contouring tool, and excluded from MI evaluation. Such regions included the areas of rectum gas, lower abdominal motion artifacts, and metal artifacts around the prostate implant markers (Figure 4). Furthermore, the superior and inferior end CBCT slices were excluded because the reconstruction noise was dominant over anatomical information (Figure 4c).
Figure 4.
Example inconsistent regions on CBCT images (Pt #2) that were excluded from MI calculations; (a) rectum gas, (b) lower abdominal motion artifacts, (c) metal artifacts around the prostate implant markers, and (d) one of the noisy superior/anterior end slices.
The second term is the MI of the mean contour images on the CBCT and deformed CT images, denoted as SOrgan,CBCT and STOrgan,CT respectively. The mean contour images were composited from the corresponding mean contours such that each organ was represented with a unique uniform pixel intensity (prostate=200, SVs=150, rectum=100, bladder=50, and background=0). Although SOrgan,CBCT and SOrgan,CT had same intensity levels for the same organs, we used MI instead to avoid possible intensity dependent weighting of mono-modal similarity metrics.
The third term of the cost function is the mean distance of the two manually delineated point sets on the CBCT and deformed CT images, denoted as PCBCT and PTCT respectively.
Finally, the last term R(T, SBone,CBCT, SBone,CT) is a rigidity penalty term applied on the segmented bony regions (SBone,CBCT and SBone,CT). The purpose of this term is to maintain the rigidity of the bones. In order to be rigid within the bones, the transformation needs to meet the conditions of affinity, orthonormality, and properness (Staring et al., 2007). The affinity term ensures the transformation to be locally affine, i.e. linear. The orthonormality and properness term respectively enforces the transformation to be locally orthonormal and unit-determinant, which are the qualifications of a rotation matrix. The weights among these three sub-penalty terms were chosen such that the level of their contributions to the total cost function became equivalent.
Deformable registration parameter selection
The overall goal of the parameter selection scheme employed in this study was to find a set of parameters that produce registrations with good anatomical alignments while maintaining the lowest possible degree of freedom (DOF) of the transformation T to ensure smooth organ deformation.
Deformable registrations with three B-spline grid spacings (10 mm, 20 mm, 30 mm) and with five maximum number of iterations (100, 200, …, 500) were conducted. For each registration, the following quantities were recorded to evaluate the registration quality: 1) organ DICE indices, 2) misalignment of corresponding points, 3) histograms of the Jacobian determinant (|JAC|) in soft organs, bones, and the entire body, and 4) bone registration errors with piecewise bone registrations as the benchmark. The DICE index is a measure of two volume overlaps, calculated as 2 (|V1∩V2|)/ (|V1|+|V2|). The numerator is the volume of the intersection, and the denominator is the sum of two individual volumes V1 and V2. The value of |JAC| at a point represents the compression (|JAC|<1.0) or expansion (|JAC|>1.0) of deformation at the point. For each patient, a registration that had the smallest organ deformation while still maintaining good organ boundary alignment was chosen. The organ deformations were evaluated based on the quantities of |JAC| distributions and bone registration errors, and the organ alignments were assessed based on the organ DICE indices and the misalignment residual of corresponding points.
Starting from the chosen registrations, the weights of cost function in Eq 1. were further adjusted to fine-tune the registrations. For example, μs was increased if the surface alignment needed to be further improved based on DICE index as well as visual evaluation, and the rigidity penalty weight μr was increased if the bone deformation needed to be reduced based on |JAC| distributions. The point distance weight μd was increased only if any of the point pair distances was greater than 1 mm. The weights are relative to each other and choosing values that are too large causes divergence from the optimal solution.
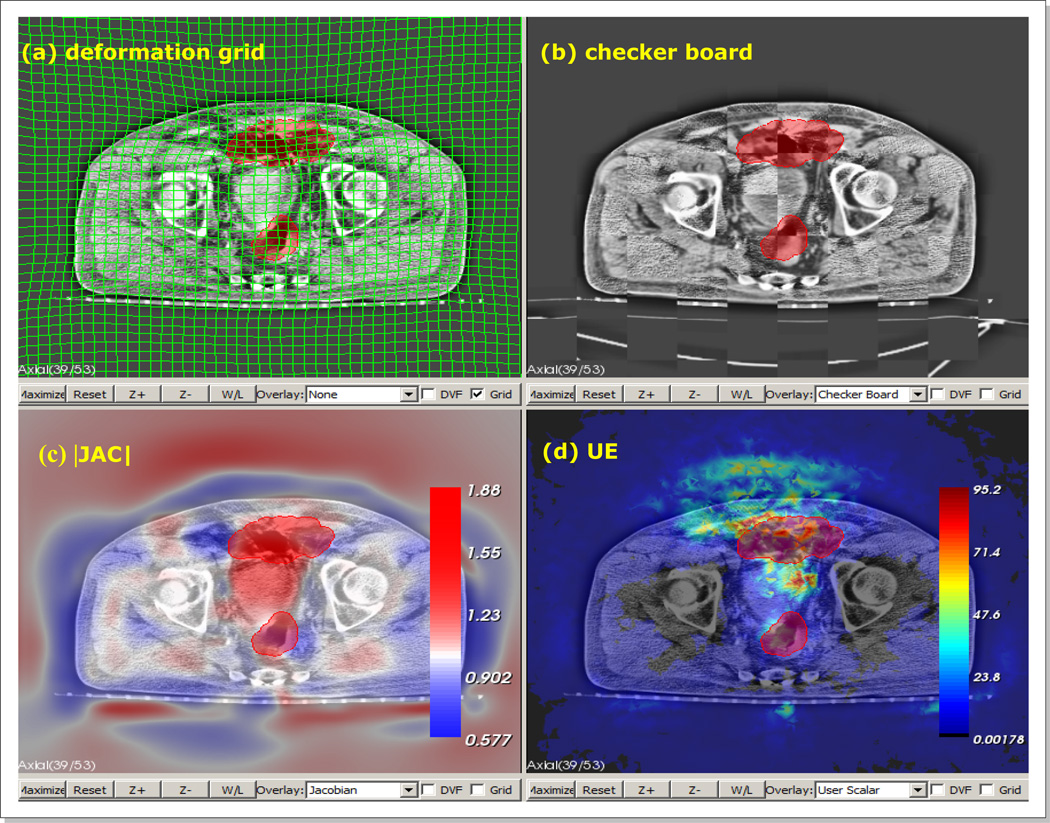
Finally, the final registrations were qualitatively reviewed by five independent reviewers, and marked the regions where they felt the registration should be corrected. The average maps of defined misregistration regions were normalized such that the intensity at each pixel represents the registration uncertainty in the range of [0.0, 1.0]. Therefore, an uncertainty value of 1.0 at a particular pixel means that all reviewers classified the registration as erroneous at the pixel, and an uncertain value of 0.0 as the opposite. In order to facilitate the review process, we developed a custom software, in-house, that allows users to evaluate registrations using the following two metrics; 1) the image intensity similarity of two registered images as well as 2) the physical soundness of the underlying deformation. For the image intensity evaluation, the software provided three interactive blending tools; color blending, checker-board rendering, and spy glass rendering. For the evaluation of the underlying deformation, the software rendered the overlays of the grid deformation, deformation vector flow, |JAC|, and unbalanced energy (UE) (Zhong et al., 2007; Zhong et al., 2010) on the input images. Figure 5 shows an example view of the software panels displaying the various metrics.
Figure 5.
An example view of our “in-house” developed registration review software, with panels of (a) deformation grid overlay, (b) check-board blending, (c) |JAC| overlay, and (d) UE overlay. |JAC| - determinant of spatial Jacobian. UE - FEM based unbalanced energy. The red blob is a region of interest being painted.
Software tools and libraries
The piecewise rigid-body registrations and deformable image registrations were implemented using Elastix (Klein et al., 2010) and the National Library of Medicine Insight Segmentation and Registration Toolkit (ITK, http://www.itk.org/). All regions of interest, excluding the physician organ delineations, were segmented using the interactive tools in Seg3D (http://http://scirundocwiki.sci.utah.edu). The graphical user interfaces for registration review and manual point identification were implemented using the software libraries of Visualization toolkit (VTK, http://www.vtk.org/), Qt (http://qt-project.org/), and OpenGL (http://www.opengl.org/). The objects of Digital Imaging and Communications in Medicine (DICOM, http://medical.nema.org/) were handled using Grassroots DICOM library (http://gdcm.sourceforge.net/).
III. Results
Organ and distinctive point delineation
The first and third row of Figure 2 show the manually delineated 10 sets of organ contours for a CT/CBCT pair. It is observed that the organ delineations on CT were more consistent among physicians than those on CBCT. The mean (±1SD) DICE values between two contours on CBCT images were 0.7(±0.1) for prostate, 0.9(±0.1) for bladder, 0.7(±0.1) for rectum, and 0.5(±0.2) for seminal vesicles (SV), while the corresponding values were 0.8(±0.0), 0.9(±0.0), 0.8(±1.0), and 0.7(±0.1) on CT images. The most challenging organ to contour was the seminal vesicles on CBCT (mean DICE=0.5). Eighteen (13%) out of total 135 (=10/(28) × 3) possible seminal vesicle pairs had no overlap (DICE=0.0). The second and fourth row of Figure 2 show the corresponding mean contours. Table 1 lists the organ volumes of mean contours as well as their differences and ratios between CT and CBCT images. The prostate volume changes were relatively small (diff: 1~4 cm3, ratios: 0.9~1.0). The bladder showed the largest variation (ratios: 0.9~2.2). The SV volumes were larger on CT, most likely because they were more clearly observed on CT relative to CBCT.
Table 1.
Organ mean contour volumes on CT and CBCT images and their differences and ratios. [unit: cm3]
| Prostate | Bladder | |||||||
| CT | CBCT | CT-CBCT | CT/CBCT | CT | CBCT | CT-CBCT | CT/CBCT | |
| Pt #1 | 60 | 61 | −1 | 1.0 | 178 | 81 | 97 | 2.2 |
| Pt #2 | 43 | 47 | −4 | 0.9 | 80 | 94 | −14 | 0.9 |
| Pt #3 | 38 | 37 | 1 | 1.0 | 371 | 390 | −19 | 1.0 |
| Rectum | SV | |||||||
| CT | CBCT | CT-CBCT | CT/CBCT | CT | CBCT | CT-CBCT | CT/CBCT | |
| Pt #1 | 77 | 85 | −8 | 0.9 | 9 | 7 | 2 | 1.3 |
| Pt #2 | 58 | 60 | −2 | 1.0 | 8 | 7 | 1 | 1.1 |
| Pt #3 | 59 | 62 | −3 | 1.0 | 26 | 16 | 10 | 1.6 |
Registration parameters
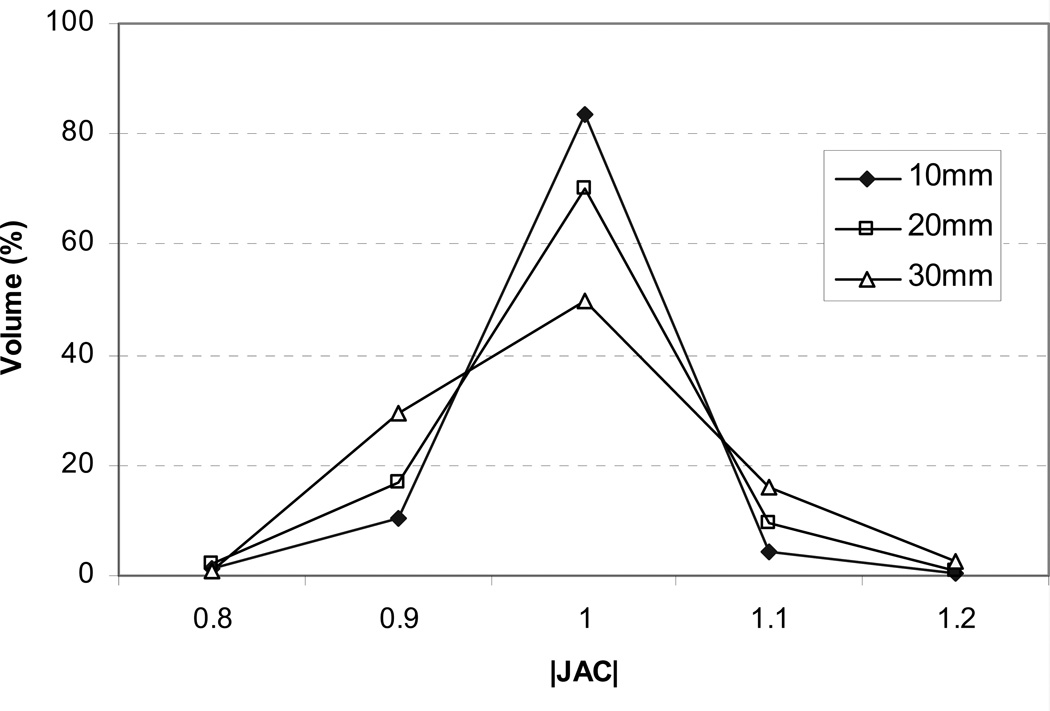
The selected registration parameters are listed in Table 2. For all registrations, the B-spline grid spacing was chosen to be 10 mm. From visual evaluations, the larger grid spacings of 20 mm and 30 mm were found to cause excessive compression/expansion in nearby bones from insufficient DOF. Figure 6 shows the histograms of spatial Jacobian (|JAC|) within the pelvic bone for Pt #2. As demonstrated in the figure, the amount of bone compression (|JAC|<1.0) and expansion(|JAC|>1.0) gradually increased as the B-spline grid spacing increased. With the 30 mm B-spline grid spacing, only 50% of the pelvic bone maintained complete rigidity (|JAC|=1.0). The chosen number of iterations ranged from 100 to 300 with corresponding registration times of 30 to 80 minutes on a personal computer (Intel Xeon CPU 2.4 GHz × 2, 6GB RAM). The selected cost function weights μi and μd were respectively 0.5 and 0.005 for all cases, and μs and μr ranged from 1 to 5.
Table 2.
Registration parameters selected for registrations
| Pt #1 | Pt #2 | Pt #3 | ||
|---|---|---|---|---|
| B Spline grid spacing [mm] | 10 | 10 | 10 | |
| # of Iterations | 300 | 100 | 200 | |
| Reg. time [min] | 80 | 30 | 50 | |
| Cost function weights (Eq. 1) | μi | 0.5 | 0.5 | 0.5 |
| μs | 5 | 1 | 2 | |
| μd | 0.005 | 0.05 | 0.005 | |
| μr | 2 | 1 | 1 | |
Figure 6.
Spatial |JAC| histograms in the pelvic bone for Pt #2 with B-spline grid spacings of 10, 20, and 30 mm.
Example registration
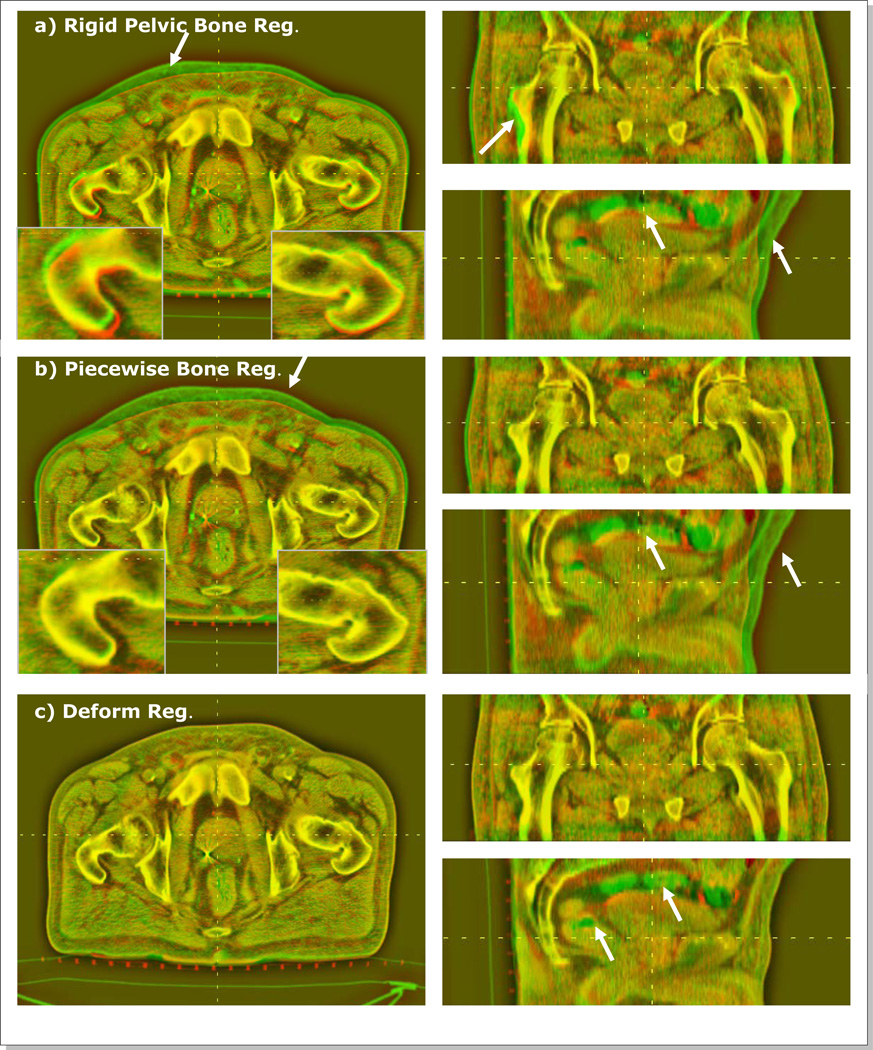
Figure 7 shows the CBCT/CT color blending views after rigid pelvic bone registration, piecewise-rigid bone registration, and deformable registration for a patient (Pt #2). In the red/green blending views, the pixel intensity differences stand out in the red or green colors as marked by arrows in the figure. The result of pelvic bone registration (Figure 7a) shows misalignments in the anterior skin surfaces and near the femoral bones. The femoral bone differences were resolved after the piecewise bone registration (insets of Figure 7a and Figure 7b). Finally, the deformable registration corrected the differences in skin, soft tissue organs, and muscles (Figure 7c). The inherent content differences in the rectum and bowel remained unmatched (green) after DIR.
Figure 7.
Red/green CBCT/CT blending views for Pt #2 after (a) rigid pelvic bone registration, (b) piecewise rigid bone registration, and (c) deformable registration. The arrows indicates the areas of relatively large misalignments.
Registration Evaluation
a) Organ alignments
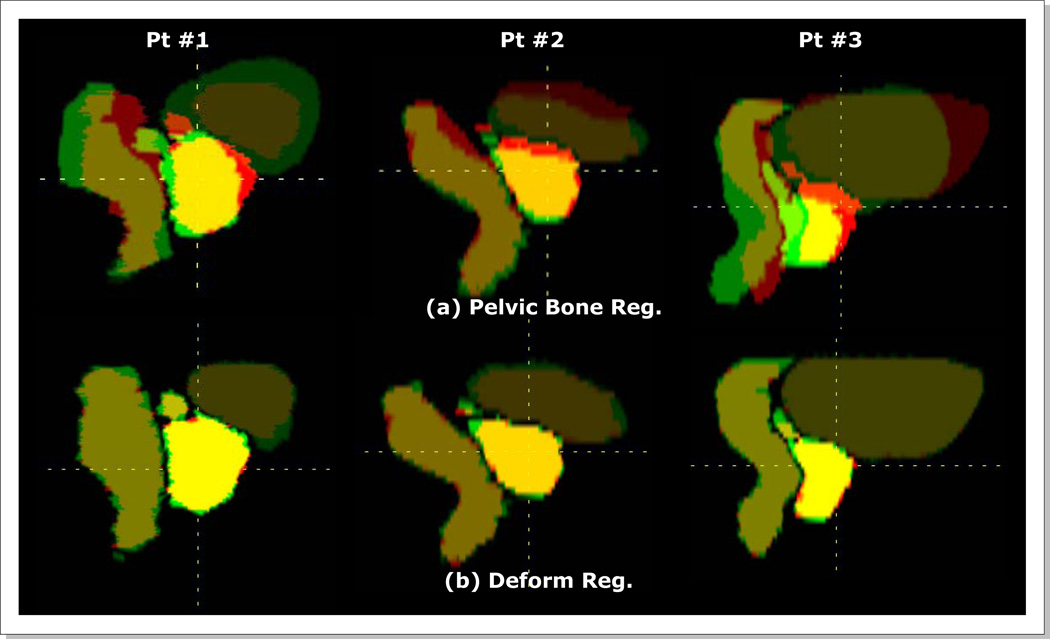
Figure 8 shows the organ alignments after rigid-body pelvic bone and deformable registrations for three patients. The corresponding DICE indices are listed in Table 3. As shown in Figure 8a, the organ misalignments were large with the pelvic bone registrations only. The mean DICE indices were 0.7 for prostate, rectum, and bladder, and 0.2 for SVs. The SV misalignments were largest with DICE indices of only 0.0, 0.4 and 0.1 for three respective patients. After deformable registrations the mean DICE indices became 0.9 for prostate, rectum, and bladder, and to 0.8 for SVs.
Figure 8.
Organ alignments (a) with pelvic bone registrations and (b) with deformable registrations.
Table 3.
Organ DICE indices with rigid pelvic bone registrations and deformable registrations.
| Pt #1 | Pt #2 | Pt #3 | Mean | |||||
|---|---|---|---|---|---|---|---|---|
| Rigid | Deform | Rigid | Deform | Rigid | Deform | Rigid | Deform | |
| Prostate | 0.8 | 0.9 | 0.8 | 0.9 | 0.5 | 0.9 | 0.7 | 0.9 |
| Rectum | 0.7 | 0.9 | 0.8 | 0.9 | 0.5 | 0.9 | 0.7 | 0.9 |
| Bladder | 0.6 | 0.9 | 0.7 | 0.9 | 0.8 | 1.0 | 0.7 | 0.9 |
| SVs | 0.0 | 0.8 | 0.4 | 0.8 | 0.1 | 0.7 | 0.2 | 0.8 |
b) Distinctive point alignments
The mean misalignments between two corresponding sets of manually delineated points was 7.7 mm [3.2 ~ 17.4 mm] with rigid-body pelvic bone registrations only. The discrepancy reduced below 1 mm after deformable registrations.
c) Determinant of spatial Jacobian
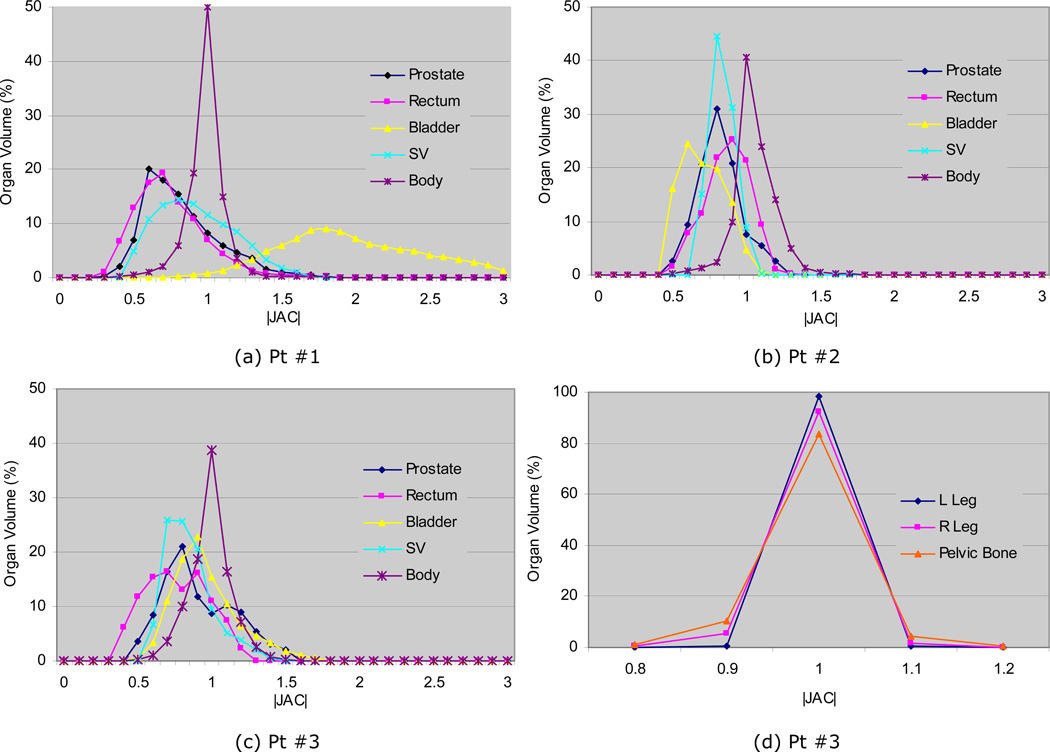
Figure 9a–c shows the histograms of the determinant of the Jacobian |JAC| for prostate, rectum, bladder, SVs, and body. Their corresponding statistical quantities (μ±σ, mininum, and maximum) are listed in the first half of Table 4. In this study, a value of >1 represents an organ expansion on CT with respect to the corresponding organ on CBCT. As shown in the Figure 9a–c, the |JAC| values were in the range of 0.4–1.5 for most soft organs. The mean values for prostate, rectum, and seminal were in the range of 0.8~1.0. However, the bladder had larger variations; 2.2 for Pt #1, 0.7 for Pt #2, and 1.0 for Pt #3, which agrees with the volume ratios in Table 1 as well as in Figure 8. The mean |JAC| values of SVs (1.0, 0.9, and 0.9) were smaller than the volume ratios in Table 1. This was primarily due to inconsistency in contouring between CT and CBCT images as discussed in the section Organ and distinctive point delineation and the smooth underlying deformation, which resulted in leaving portions of the SVs not overlapped (Figure 8b, Pt #3).
Figure 9.
Histograms of determinant of Jacobian |JAC| for (a–c) prostate, rectum, bladder, SVs, and body for three patients, and (d) bones for Pt #3.
Table 4.
Determinant of Jacobian |JAC| statistics (mean±std [min.,max.])
| Pt | Pt #1 | Pt #2 | Pt #3 |
|---|---|---|---|
| Prostate | 0.9±0.3 [0.3,1.8] | 0.8±0.2 [0.5,1.2] | 1.0±0.3 [0.5,1.6] |
| Rectum | 0.8±0.3 [0.3,1.9] | 0.9±0.2 [0.5,1.4] | 0.8±0.2 [0.4,1.3] |
| Bladder | 2.2±0.6 [0.7,3.2] | 0.7±0.2 [0.4,1.1] | 1.0±0.2 [0.5,1.7] |
| SVs | 1.0±0.3 [0.4,1.7] | 0.9±0.1 [0.7,1.1] | 0.9±0.2 [0.6,1.4] |
| Body | 1.1±0.2 [0.2,3.2] | 1.1±0.2 [0.4,1.8] | 1.0±0.2 [0.4,1.7] |
| L Femur | 1.0±0.0 [0.9,1.2] | 1.0±0.0 [0.9,1.1] | 1.0±0.0 [0.9,1.1] |
| R Femur | 1.0±0.0 [0.9,1.1] | 1.0±0.0 [1.0,1.1] | 1.0±0.0 [0.8,1.2] |
| Pelvis | 1.0±0.0 [0.9,1.1] | 1.0±0.0 [0.8,1.2] | 1.0±0.1 [0.7,1.4] |
The last three rows of Table 4 shows |JAC| values of ~1.0 for all bony anatomies, which indicates that bone rigidity was well preserved by the rigidity penalty term of the cost function (Eq. 1). Figure 9d shows the |JAC| histogram for Patient #3, which shows minor spread beyond the range 0.9–1.1.
d) Effects of bone rigidity penalty
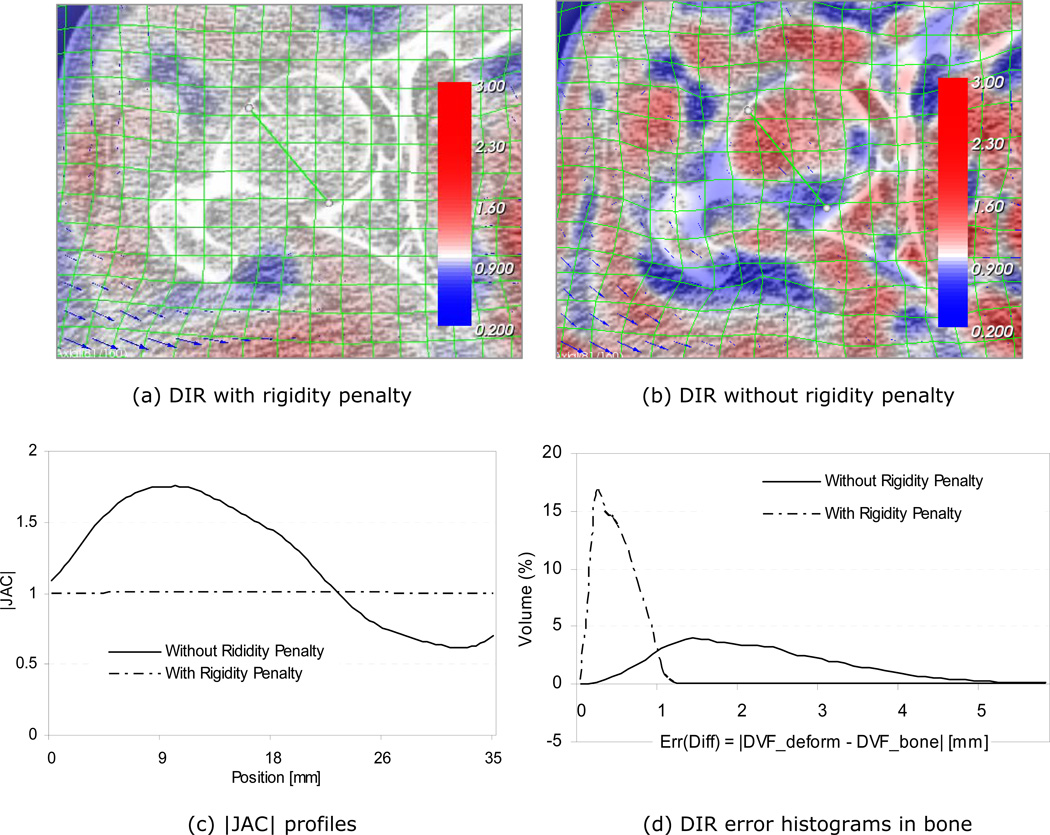
Figure 10 demonstrates the effectiveness of the rigidity penalty term imposed on the bony anatomies. The sub-figures a) and b) show registration results with and without penalty terms, respectively. With the rigidity penalty imposed, the deformation grid lines (green) are straight within the bones, while bone deformations are quite evident without the penalty term (Figure 10b). The determinant of the spatial Jacobian |JAC| information is also overlaid on the same figures in color. The compressed (|JAC|<1) and expanded (|JAC|>1) areas are represented in the blue and red colors respectively. The bony area in Figure 10a is neither blue nor red, which implies that the bones are rigid, neither compressed nor expanded. On the other hand, the corresponding |JAC| overlay in Figure 10b indicates large bone deformations. The |JAC| profiles along the green diagonal line inside the femoral head are shown in Figure 10c. The |JAC| values in the bone are approximately 1.0 with the rigidity penalty. However, the variation was much larger without penalty, ranging from 0.6 to 1.8. Figure 10d shows the registration error distributions with and without the rigidity penalty, where the error is defined as the absolute difference from the corresponding piecewise bone registration. As shown, the deformable registration error without the rigidity penalty was over 5 mm for some area, while it was mostly <1 mm with the rigidity penalty imposed. Therefore, maintaining bone rigidity is an important factor in reducing errors when registering bones. The main cause of the errors was the non-uniform differences in pixel intensities between the CT and CBCT images even after the adaptive histogram equalization image pre-processing.
Figure 10.
Effects of bone rigidity penalty; registrations (a) with and (b) without rigidity penalty, (c) |JAC| profiles, and (d) registration error histograms in the right femur. The error in (d) is defined as the difference between the deformable registration result (DVF_deform) and that of the piecewise rigid registration (DVF_bone).
e) Effects of piecewise-rigid bone registrations
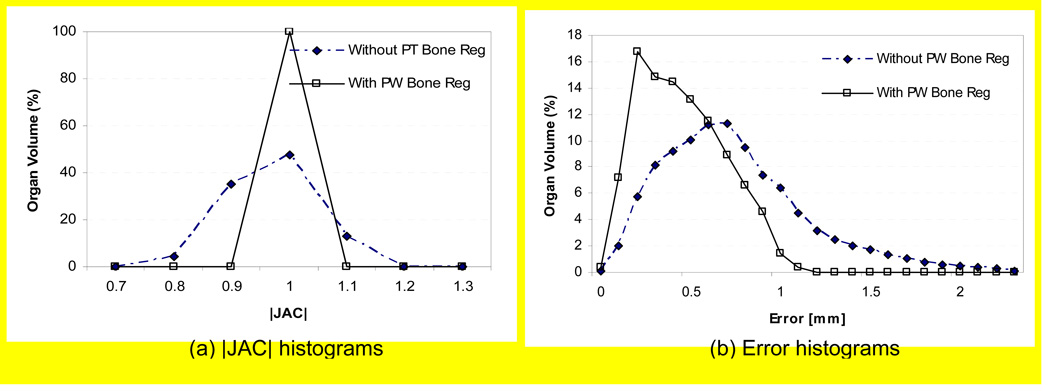
Figure 11 shows the histograms of |JAC| and registration errors in the right femoral bone of Pt #1 with and without using the piecewise-rigid bone registrations. For the latter case, a rigid-body pelvic bone registration was used in place of the piecewise-rigid bone registration. As shown in the sub-figure (a), the amount of bone deformation was greater without using piecewise-rigid bone registration and, as a result, the registration error increased slightly as shown in the sub-figure (b). The registration errors (mean±SD) for three patients were 0.5±0.2 mm, 0.6±0.3 mm, and 0.9±0.4 mm with piecewise-rigid bone registrations, and the respective errors increased to 0.7±0.4 mm, 0.7±0.4 mm, and 1.3±0.7 mm without using piecewise-rigid bone registrations. Therefore, it is necessary to use a piecewise-rigid bone registration to account for the high frequency sliding motion between bones, prior to applying a B-spline transformation which produces smoothly varying deformation field.
Figure 11.
Effects of piecewise bone registrations (Pt #1); Histograms of (a) |JAC| and (b) registration error in the right femur of Pt #1. The error is defined as the difference between the deformable registration result and that of the piecewise rigid registration.
f) Deformation vector magnitudes in organs
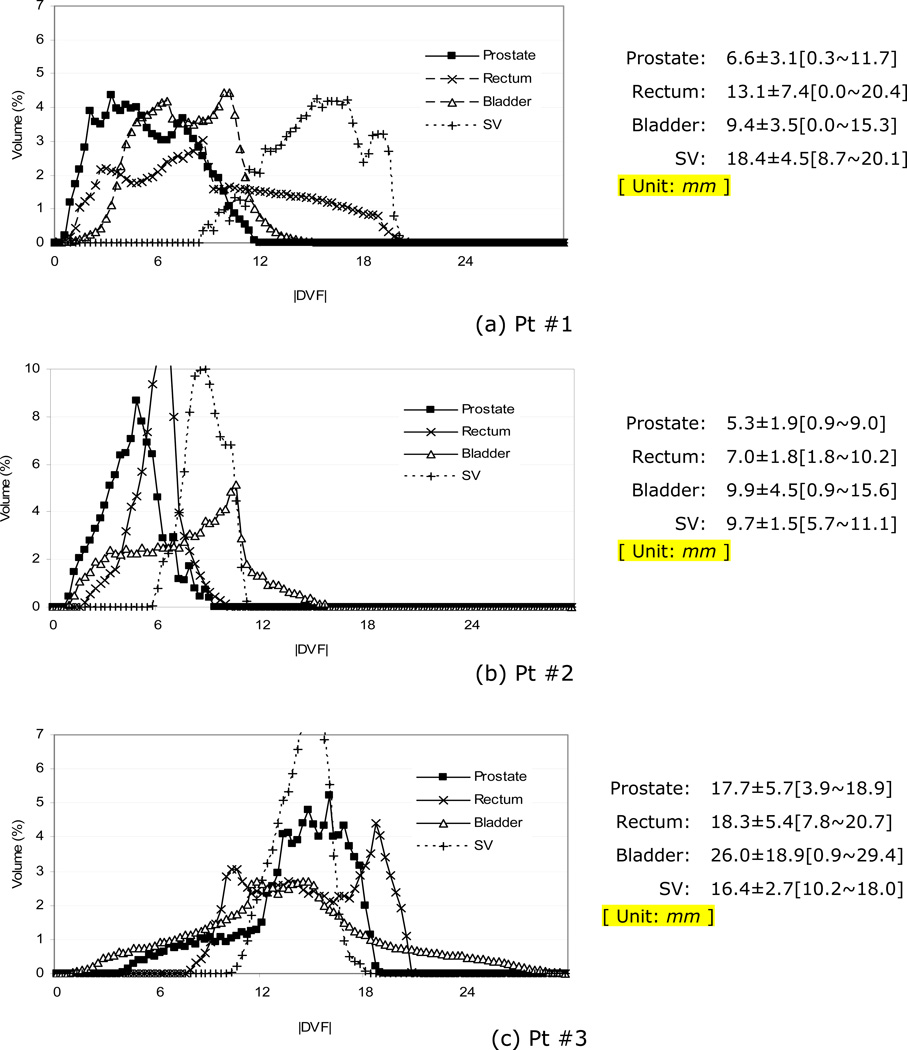
In addition to the per-organ |JAC| distributions, the likelihood of organ deformation magnitude may serve as an important constraint for registration regularization. Figure 12 shows the histograms of the displacement vector field magnitudes (|DVF|) within the organs for the three patients. The vectors represent the organ motions discovered by the deformable registration with respect to the corresponding piecewise rigid registrations. The per-organ statistics (μ±σ [min.~max.]) are also listed in the right hand side of the figure. The motion magnitudes varied among patients. The prostate motions of three patients were respectively 6.6±3.1 mm, 5.3±1.9 mm, and 17.7±5.7 mm. The mean and maximum motions were respectively 12.7 mm and 20.7 mm for rectum, 15.1 mm and 29.4 mm for bladder, and 14.8 mm and 20.1 mm for SVs. The discovered motion magnitudes qualitatively agrees with the initial misalignment shown in Figure 8. As shown in Figure 8, the prostate as well as the seminal vesicles of Pt #1 were rotated about the lateral axis as a result of motion and physiologic changes in the positions of the rectum and bladder. The relatively large |DVF| distributions of Pt #1 and #3 in Figure 12 were in part due to rotations.
Figure 12.
Histograms of deformation vector magnitudes (|DVF| in mm) in organs.
g) Qualitative registration uncertainty map
Table 5 is the histograms of registration uncertainty maps, which were built based on the qualitative definitions by five independents reviewers. The value in each cell is the percentage of the volume within body contour of a given registration uncertainty. The volumes where more than three reviewers marked as erroneous were small; 0.7 %, 1.0%, and 2.1% for three respective patients (the last column in the table). The corresponding volumes of 0.0 uncertainty, i.e. the volume where no one marked as error, were 90.0%, 90.1%, and 86.5%.
Table 5.
Histograms of registration uncertainty maps for three patient. The value in each cell is the volume percentage within body contour of a given uncertainty. Uncertainty at a pixel × is the ratio of the number of reviewers who marked the registration at × as erroneous to the total number of reviewers.
| Uncertainty | 0.0 | 0.2 | 0.4 | 0.6 | 0.8 | 1.0 | > 0.5 |
|---|---|---|---|---|---|---|---|
| Pt #1 | 90.0 | 6.9 | 2.4 | 0.6 | 0.1 | 0.0 | 0.7 |
| Pt #2 | 90.1 | 6.6 | 2.3 | 0.8 | 0.2 | 0.0 | 1.0 |
| Pt #3 | 86.5 | 8.7 | 2.8 | 1.2 | 0.6 | 0.2 | 2.1 |
IV. Discussions
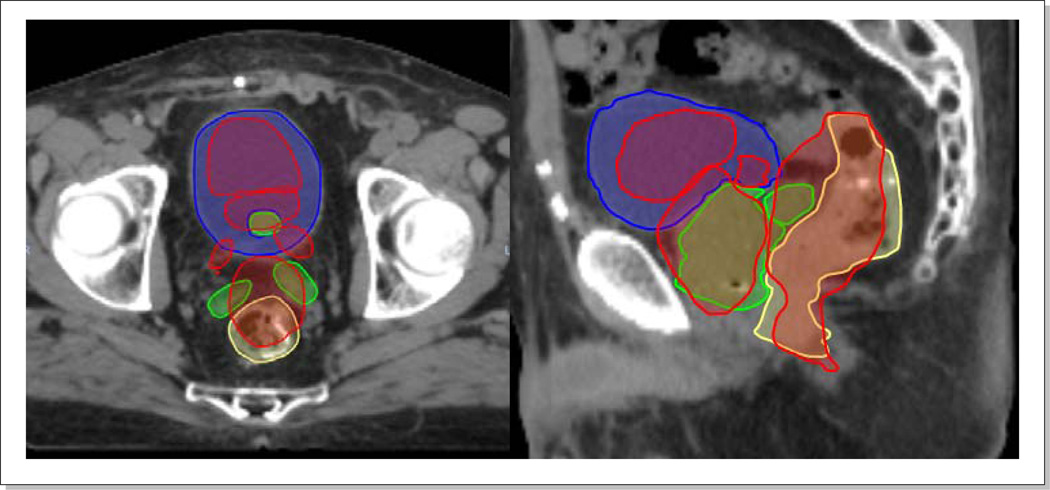
As briefly stated in the introduction section, registering a pair of CT and CBCT images deformably is extremely challenging in the pelvis. Figure 13 shows an example result of contour propagation test (Pt #1), where two sets of organ contours are overlaid on the CT image. One set is the prostate (green), bladder (blue), rectum (yellow), and SVs (green) contours delineated from the CT image. The other is the corresponding CBCT contours (red), deformably transferred to the CT image using a B-spline based DIR algorithm in a commercially available software (VelocityAI, Velocity Medical Solutions, Atlanta, GA). As shown in the figure, the contour alignments are poor. Thor et al. also tested a commercial software (MIRS, Varian Medical System, Palo Alto, CA) and concluded the contour propagation quality was clinically unacceptable for their five patient datasets {Thor, 2011 #1309}. In a separate study, we also registered over 600 CT/CBCT image pairs acquired from 17 prostate cancer patients, and our finding was similar (not published yet). Despite the use of the multi-resolution approach, where the large organ deformations are handled in the lower resolution stages, the large differences in shape/size of bladder and rectum between CT and CBCT images were not resolved well. One solution might be to use a global optimization algorithm, but it will make the registration time lengthy. Another challenge is from the daily organ content changes. Especially, the motion artifacts in the lower abdominal area near the bladder as well as the gas in the rectum make the corresponding organ registrations difficult (Figure 4). Lastly, the poor CBCT image quality, which is worse with larger patient size, is another challenge to overcome. In order to overcome these problems in this study, we used not only the image pixel intensities but only manually delineated organ contours and distinctive points in the registration optimization, together with a bone-rigidity penalty imposed. The inconsistent regions between two input images were manually delineated and excluded from the mutual information calculations (Figure 4).
Figure 13.
An example contour propagation result for Pt #1 using a DIR algorithm in a commercial software (VelocityAI, Velocity Medical Solutions, Atlanta, GA). Red - deformed CBCT organs. Other colors - prostate (green), bladder (blue), rectum (yellow), and SVs (green) on CT image. The result is based on a manual rigid body registration followed by automatic Deformable Multi-Pass algorithm.
There have been small number of related works for CBCT/CT registrations in the pelvis. Lu et al. and Greene et al. proposed constrained non-rigid deformation algorithms, using a set of manually delineated contours to guide the overall registrations (Lu et al., 2010b; Greene et al., 2009). Lu et al. also incorporated automatic level-set segmentation algorithm in the loop for non-rigid registration optimization without relying on manual segmentation (Lu et al., 2010a). Paquin et al. proposed a multi-scale non-rigid registration with a landmark-based registration for the initial alignment (Paquin et al., 2009). Chao et al. applied a non-rigid registration algorithm for automatic organ segmentation on CBCT images, where only a narrow band region around CT contours was used as regions of interest to use only the pixel information around the organ boundaries for registration (Chao et al., 2008).
Most of these studies used a smoothness constraint in the registration to avoid excessive deformation resulting from the significant pixel intensity differences between the CT and CBCT images. However, none of the studies analyzed the resultant underlying deformations, nor discussed the amount of weighting required between the intensity similarity and the regularization. Furthermore, some of these studies also used manually contoured organs either to guide the registrations or to evaluate the registration results. However, as demonstrated in this study and that of Lütgendorf-Caucig (Lütgendorf-Caucig et al., 2011), inter-user variability of organ delineations was found to be large on CBCT images. Therefore, redundant contouring is necessary to reduce the registration or evaluation uncertainty.
All of the aforementioned studies, as well as this study, used a uniform cubic B-spline algorithm to model the underlying deformation. The B-spline interpolation tends to produce a smooth deformation field with local support, and it is easier to control the deformation degrees-of-freedom. Therefore, one important parameter to choose is the B-spline node spacing. The node spacing at the final resolution stage was 0.8 cm in the Lu et al.'s study (Lu et al., 2010b) and 2.0–2.5 cm in the Greene et al. study (Greene et al., 2009). In our study, we chose 1.0 cm and found that larger node spacings of 2.0 cm and 3.0 cm were not of high enough DOF to characterize large deformations of our dataset (Figure 6). Finer resolutions of less than 1.0 cm were not evaluated in this study because the registrations with the 1.0 cm grid resolution were already satisfactory as described in the Results section and the likelihood of producing excessive deformation was expected to increase with finer grid resolutions. Another difference of our study from others is the use of piecewise rigid transformation to model the sliding motion between the femoral heads and their socket pelvic bones. Such sliding motion would not be realizable with only a smooth B-spline deformation model, without distorting nearby bones.
We maintained bone rigidity by applying rigidity penalty in the optimization routine. However, to date, the rigidity or degree of deformation is not known for other soft tissue organs. In this study, the driving forces for the soft organ registrations were the pixel similarity, organ surface similarity, and the similarity between a small number of fiducial points. Once the organ surfaces and points are aligned, the only remaining force is the pixel similarity. However, the image quality of CBCT images is degraded relative to that of diagnostic CT images due to increased noise from scatter. Relying solely on the pixel similarity between the CBCT and CT registration and "forcing" the optimization with a large number of iterations, is likely to increase registration errors in the soft tissues. Therefore, we chose the minimum number of iterations and the largest possible B-spline grid spacing, while achieving reasonable organ boundary alignments and limiting deformation within the organs. In order to limit excessive deformation in soft tissue organs, the organ |JAC| distributions were carefully compared in determining registration parameters, while reviewing slice-by-slice overlays of grid deformation, |JAC|, and UE maps.
It should be noted that there is no ground truth for evaluation of deformable registrations and subjectiveness could exist inherently in model assumption, parameter selection, or result interpretation. Exploring the entire parameter spaces of known optimization, similarity metric, and transformation algorithms and finding one optimal parameter set is practically impossible. The chosen set of registration parameters in this study might be sub-optimal because, in part, they were based on the reviewer's qualitative comparisons of pixel similarities as well as the amount of organ deformations.
The cubic B-spline transformation model produces smoothly varying deformations in general, and it is not suitable to model sliding motion between two articulated bones or between two soft-tissue organs. The sliding motion between two bones was addressed in this study by modeling each bone with a simple rigid body transformation as described in the section Piecewise bone registration. However, addressing the sliding motion between two soft tissue organs would require one to use one deformable model per organ, which would not be very straight forward to implement. Further, we are not certain how much soft-tissue sliding motions occur between the organs of interest in the pelvic area. However, they occur and not negligible, there could be associated errors in our registration results from the use of one global smoothly-varying B-spline transformation.
Despite these limitations, we claim that the quality of registrations, produced by following the method described in this study, is good enough to serve as a reference to other registration algorithms. The resultant registrations had accurate alignments of: (1) the skin, bone, muscles based on visual inspections, (2) the boundaries of the prostate, bladder, rectum, and seminal vesicles, and (3) landmarks consisting of round natural calcifications and implanted fiducial markers. The bony anatomies were maintained to be rigid, and excessive deformation was avoided in the soft tissue organs. We will be testing the feasibility of using the resultant registrations, together with the qualitatively derived uncertainty maps, for parameter optimization and quantitative accuracy assessment of various commercial and public domain registration algorithms for prostate CT-CBCT deformable image registrations.
V. Conclusions
We have demonstrated a novel method of establishing benchmark deformable image registration accuracy between CT and CBCT images in the pelvic region. The method incorporates manually delineated organ surfaces and landmark points as well as pixel similarity in the optimization, while ensuring bone rigidity and avoiding excessive deformation in soft tissue organs.
Acknowledgments
This research was supported in part by a NIH grant R01CA140341 and by a grant from Varian Medical Systems, Palo Alto, CA.
References
- Bergstrom P, Lofroth PO, Widmark A. High-precision conformal radiotherapy (HPCRT) of prostate cancer--a new technique for exact positioning of the prostate at the time of treatment. Int J Radiat Oncol Biol Phys. 1998;42:305–311. doi: 10.1016/s0360-3016(98)00229-6. [DOI] [PubMed] [Google Scholar]
- Chao M, Xie Y, Xing L. Auto-propagation of contours for adaptive prostate radiation therapy. Physics in medicine and biology. 2008;53:4533. doi: 10.1088/0031-9155/53/17/005. [DOI] [PubMed] [Google Scholar]
- Court L, Dong L. Automatic registration of the prostate for computed-tomography-guided radiotherapy. Medical Physics. 2003;30:2750–2757. doi: 10.1118/1.1608497. [DOI] [PubMed] [Google Scholar]
- Deurloo KE, Steenbakkers RJ, Zijp LJ, de Bois JA, Nowak PJ, Rasch CR, van Herk M. Quantification of shape variation of prostate and seminal vesicles during external beam radiotherapy. Int J Radiat Oncol Biol Phys. 2005;61:228–238. doi: 10.1016/j.ijrobp.2004.09.023. [DOI] [PubMed] [Google Scholar]
- Frank SJ, Dong L, Kudchadker RJ, De Crevoisier R, Lee AK, Cheung R, Choi S, O'Daniel J, Tucker SL, Wang H, Kuban DA. Quantification of Prostate and Seminal Vesicle Interfraction Variation During IMRT. Int J Radiat Oncol Biol Phys. 2008;17:17. doi: 10.1016/j.ijrobp.2007.10.028. [DOI] [PubMed] [Google Scholar]
- Fuss M, Cavanaugh SX, Fuss C, Cheek DA, Salter BJ. Daily stereotactic ultrasound prostate targeting: inter-user variability. Technol Cancer Res Treat. 2003;2:161–170. doi: 10.1177/153303460300200213. [DOI] [PubMed] [Google Scholar]
- Ghilezan MJ, Jaffray DA, Siewerdsen JH, Van Herk M, Shetty A, Sharpe MB, Zafar Jafri S, Vicini FA, Matter RC, Brabbins DS, Martinez AA. Prostate gland motion assessed with cine-magnetic resonance imaging (cine-MRI) Int J Radiat Oncol Biol Phys. 2005;62:406–417. doi: 10.1016/j.ijrobp.2003.10.017. [DOI] [PubMed] [Google Scholar]
- Greene WH, Chelikani S, Purushothaman K, Knisely J, Chen Z, Papademetris X, Staib L, Duncan J. Constrained non-rigid registration for use in image-guided adaptive radiotherapy. Medical image analysis. 2009;13:809. doi: 10.1016/j.media.2009.07.004. [DOI] [PMC free article] [PubMed] [Google Scholar]
- Hill DLG, Batchelor PG, Holden M, Hawkes DJ. Medical image registration. Physics in medicine and biology. 2001;46:R1. doi: 10.1088/0031-9155/46/3/201. [DOI] [PubMed] [Google Scholar]
- Hua C, Lovelock DM, Mageras GS, Katz MS, Mechalakos J, Lief EP, Hollister T, Lutz WR, Zelefsky MJ, Ling CC. Development of a semi-automatic alignment tool for accelerated localization of the prostate. International Journal of Radiation Oncology, Biology, Physics. 2003;55:811–824. doi: 10.1016/s0360-3016(02)04207-4. [DOI] [PubMed] [Google Scholar]
- Kim J, Hammoud R, Pradhan D, Zhong H, Jin RY, Movsas B, Chetty IJ. Prostate localization on daily cone-beam computed tomography images: accuracy assessment of similarity metrics. Int J Radiat Oncol Biol Phys. 2010;77:1257–1265. doi: 10.1016/j.ijrobp.2009.09.068. [DOI] [PubMed] [Google Scholar]
- Kitamura K, Shirato H, Shimizu S, Shinohara N, Harabayashi T, Shimizu T, Kodama Y, Endo H, Onimaru R, Nishioka S. Registration accuracy and possible migration of internal fiducial gold marker implanted in prostate and liver treated with real-time tumor-tracking radiation therapy (RTRT) Radiotherapy and Oncology. 2002;62:275–281. doi: 10.1016/s0167-8140(02)00017-8. [DOI] [PubMed] [Google Scholar]
- Klein S, Staring M, Murphy K, Viergever MA, Pluim JP. elastix: a toolbox for intensity-based medical image registration. IEEE Trans Med Imaging. 2010;29:196–205. doi: 10.1109/TMI.2009.2035616. [DOI] [PubMed] [Google Scholar]
- Langen KM, Jones DTL. Organ motion and its management. International Journal of Radiation Oncology*Biology*Physics. 2001;50:265–278. doi: 10.1016/s0360-3016(01)01453-5. [DOI] [PubMed] [Google Scholar]
- Langen KM, Willoughby TR, Meeks SL, Santhanam A, Cunningham A, Levine L, Kupelian PA. Observations on Real-Time Prostate Gland Motion Using Electromagnetic Tracking. Int J Radiat Oncol Biol Phys. 2008;13:13. doi: 10.1016/j.ijrobp.2007.11.054. [DOI] [PubMed] [Google Scholar]
- Lawson JD, Schreibmann E, Jani AB, Fox T. Quantitative evaluation of a cone-beam computed tomography-planning computed tomography deformable image registration method for adaptive radiation therapy. J Appl Clin Med Phys. 2007;8:2432. doi: 10.1120/jacmp.v8i4.2432. [DOI] [PMC free article] [PubMed] [Google Scholar]
- Lu C, Chelikani S, Chen Z, Papademetris X, Staib L, Duncan J. Integrated segmentation and nonrigid registration for application in prostate image-guided radiotherapy. Medical Image Computing and Computer-Assisted Intervention–MICCAI 2010. 2010a:53–60. doi: 10.1007/978-3-642-15705-9_7. [DOI] [PubMed] [Google Scholar]
- Lu C, Chelikani S, Papademetris X, Staib L, Duncan J. Constrained non-rigid registration using Lagrange multipliers for application in prostate radiotherapy; Computer Vision and Pattern Recognition Workshops (CVPRW), 2010 IEEE Computer Society Conference on: IEEE); 2010b. pp. 133–138. [Google Scholar]
- Lütgendorf-Caucig C, Fotina I, Stock M, Pötter R, Goldner G, Georg D. Feasibility of CBCT-based target and normal structure delineation in prostate cancer radiotherapy: multi-observer and image multi-modality study. Radiotherapy and Oncology. 2011;98:154–161. doi: 10.1016/j.radonc.2010.11.016. [DOI] [PubMed] [Google Scholar]
- Maintz JBA, Viergever MA. An overview of medical image registration methods. UUCS. 1998 [Google Scholar]
- Maurer CR, Jr, Qi R, Raghavan V. A linear time algorithm for computing exact euclidean distance transforms of binary images in arbitrary dimensions. Pattern Analysis and Machine Intelligence, IEEE Transactions on. 2003;25:265–270. [Google Scholar]
- Nederveen A, Lagendijk J, Hofman P. Detection of fiducial gold markers for automatic on-line megavoltage position verification using a marker extraction kernel (MEK) International Journal of Radiation Oncology, Biology, Physics. 2000;47:1435–1442. doi: 10.1016/s0360-3016(00)00523-x. [DOI] [PubMed] [Google Scholar]
- Orton NP, Jaradat HA, Tome WA. Clinical assessment of three-dimensional ultrasound prostate localization for external beam radiotherapy. Med Phys. 2006;33:4710–4717. doi: 10.1118/1.2388153. [DOI] [PubMed] [Google Scholar]
- Paquin D, Levy D, Xing L. Multiscale registration of planning CT and daily cone beam CT images for adaptive radiation therapy. Medical Physics. 2009;36:4. doi: 10.1118/1.3026602. [DOI] [PMC free article] [PubMed] [Google Scholar]
- Paskalev K, Ma CM, Jacob R, Price R, McNeeley S, Wang L, Movsas B, Pollack A. Daily target localization for prostate patients based on 3 D image correlation. Physics in Medicine and Biology. 2004;49:931–939. doi: 10.1088/0031-9155/49/6/005. [DOI] [PubMed] [Google Scholar]
- Schiffner DC, Gottschalk AR, Lometti M, Aubin M, Pouliot J, Speight J, Hsu IC, Shinohara K, Roach M., 3rd Daily electronic portal imaging of implanted gold seed fiducials in patients undergoing radiotherapy after radical prostatectomy. Int J Radiat Oncol Biol Phys. 2007;67:610–619. doi: 10.1016/j.ijrobp.2006.09.042. [DOI] [PubMed] [Google Scholar]
- Serago CF, Chungbin SJ, Buskirk SJ, Ezzell GA, Collie AC, Vora SA. Initial experience with ultrasound localization for positioning prostate cancer patients for external beam radiotherapy. Int J Radiat Oncol Biol Phys. 2002;53:1130–1138. doi: 10.1016/s0360-3016(02)02826-2. [DOI] [PubMed] [Google Scholar]
- Siegel R, Naishadham D, Jemal A. Cancer statistics, 2012. CA: A Cancer Journal for Clinicians. 2012;62:10–29. doi: 10.3322/caac.20138. [DOI] [PubMed] [Google Scholar]
- Smitsmans MHP, de Bois J, Sonke JJ, Betgen A, Zijp LJ, Jaffray DA, Lebesque JV, van Herk M. Automatic prostate localization on cone-beam CT scans for high precision image-guided radiotherapy. International Journal of Radiation Oncology, Biology, Physics. 2005;63:975–984. doi: 10.1016/j.ijrobp.2005.07.973. [DOI] [PubMed] [Google Scholar]
- Smitsmans MHP, Wolthaus JWH, Artignan X, de Bois J, Jaffray DA, Lebesque JV, van Herk M. Automatic localization of the prostate for on-line or off-line image-guided radiotherapy. International Journal of Radiation Oncology, Biology, Physics. 2004;60:623–635. doi: 10.1016/j.ijrobp.2004.05.027. [DOI] [PubMed] [Google Scholar]
- Staring M, Klein S, Pluim JP. A rigidity penalty term for nonrigid registration. Med Phys. 2007;34:4098–4108. doi: 10.1118/1.2776236. [DOI] [PubMed] [Google Scholar]
- Stark JA. Adaptive image contrast enhancement using generalizations of histogram equalization. Image Processing, IEEE Transactions on. 2000;9:889–896. doi: 10.1109/83.841534. [DOI] [PubMed] [Google Scholar]
- Trichter F, Ennis RD. Prostate localization using transabdominal ultrasound imaging. Int J Radiat Oncol Biol Phys. 2003;56:1225–1233. doi: 10.1016/s0360-3016(03)00269-4. [DOI] [PubMed] [Google Scholar]
- Yan D, Vicini F, Wong J, Martinez A. Adaptive radiation therapy. Phys Med Biol. 1997;42:123–132. doi: 10.1088/0031-9155/42/1/008. [DOI] [PubMed] [Google Scholar]
- Zhong H, Kim J, Chetty IJ. Analysis of deformable image registration accuracy using computational modeling. Medical Physics. 2010;37:970–979. doi: 10.1118/1.3302141. [DOI] [PMC free article] [PubMed] [Google Scholar]
- Zhong H, Peters T, Siebers JV. FEM-based evaluation of deformable image registration for radiation therapy. Phys Med Biol. 2007;52:4721–4738. doi: 10.1088/0031-9155/52/16/001. [DOI] [PubMed] [Google Scholar]


