Abstract
Patients with alcoholic cirrhosis and hepatitis have severe muscle loss. Since ethanol impairs skeletal muscle protein synthesis but does not increase ubiquitin proteasome-mediated proteolysis, we investigated whether alcohol-induced autophagy contributes to muscle loss. Autophagy induction was studied in: A) Human skeletal muscle biopsies from alcoholic cirrhotics and controls, B) Gastrocnemius muscle from ethanol and pair-fed mice, and C) Ethanol-exposed murine C2C12 myotubes, by examining the expression of autophagy markers assessed by immunoblotting and real-time PCR. Expression of autophagy genes and markers were increased in skeletal muscle from humans and ethanol-fed mice, and in myotubes following ethanol exposure. Importantly, pulse-chase experiments showed suppression of myotube proteolysis upon ethanol-treatment with the autophagy inhibitor, 3-methyladenine (3MA) and not by MG132, a proteasome inhibitor. Correspondingly, ethanol-treated C2C12 myotubes stably expressing GFP-LC3B showed increased autophagy flux as measured by accumulation of GFP-LC3B vesicles with confocal microscopy. The ethanol-induced increase in LC3B lipidation was reversed upon knockdown of Atg7, a critical autophagy gene and was associated with reversal of the ethanol-induced decrease in myotube diameter. Consistently, CT image analysis of muscle area in alcoholic cirrhotics was significantly reduced compared with control subjects. In order to determine whether ethanol per se or its metabolic product, acetaldehyde, stimulates autophagy, C2C12 myotubes were treated with ethanol in the presence of the alcohol dehydrogenase inhibitor (4-methylpyrazole) or the acetaldehyde dehydrogenase inhibitor (cyanamide). LC3B lipidation increased with acetaldehyde treatment and increased further with the addition of cyanamide. We conclude that muscle autophagy is increased by ethanol exposure and contributes to sarcopenia.
Keywords: alcohol, skeletal muscle, proteolysis, autophagy, proteasome, C2C12 myotubes
Introduction
The major component of malnutrition in liver disease is the loss of skeletal muscle mass or sarcopenia.1 Malnutrition and sarcopenia in cirrhosis worsen clinical outcomes that include survival, quality of life, and other complications associated with liver disease including gastrointestinal bleeding, infections, and encephalopathy.1-3 Patients with alcoholic hepatitis and cirrhosis have severe muscle loss that contributes to worsening outcome.4-6 A recent meta-analysis on interventions to reverse malnutrition and muscle loss in alcoholic liver disease indicates that current treatments are ineffective.7 A major reason for the lack of effective therapies is due to the paucity of knowledge about the mechanisms underlying muscle loss due to ethanol exposure.
Skeletal muscle mass and protein content are maintained by a balance between protein synthesis and breakdown but most studies on the effect of ethanol have focused on protein synthesis. In vivo animal models and cell system studies have consistently shown that ethanol inhibits skeletal muscle protein synthesis.8,9 Similarly, rats fed ethanol for longer periods of time show significant muscle loss and impaired protein synthesis10 which is thought to be mediated by increased expression of MSTN/myostatin (a TGFB/TGFβ superfamily member) and direct inhibition of MTOR, a regulator of protein synthesis.11 Despite extensive data on impaired muscle protein synthesis in response to ethanol, estimates of whole body muscle protein breakdown are either unaltered or decreased.12-19
Distinct proteolytic pathways potentially contribute to skeletal muscle loss. The ubiquitin proteasome pathway is believed to be the major skeletal muscle proteolytic pathway,20 but as ethanol inhibits ubiquitin proteasome components,21 loss in muscle mass could be associated with alternative pathways of proteolysis.22,23 Autophagy is a catabolic process that is activated during cellular stress and mediates degradation of misfolded proteins and damaged organelles to maintain cellular homeostasis.24,25 It is a multistep process that begins with the formation of a phagophore membrane that engulfs the cargo destined for degradation, which fuses with the lysosomes, degrading the contents and recycling the substrates generated.26 In mammalian cells, ULK1 and ULK 2 are involved in the induction of autophagy, sequential events involving a series of autophagy-related (ATG) proteins culminating in the formation of the autophagosome, which fuses with a lysosome to form an autolysosome. During autophagy, MAP1LC3 (LC3) the mammalian ortholog of yeast Atg8 undergoes cleavage and lipidation that allows its use as the autophagosome marker LC3B-II. A number of other proteins including ATG5, ATG7, and LAMP proteins are considered to be critical for different steps of autophagy.26 Inhibition of the ubiquitin proteasome pathway activates autophagy in conditions of cellular stress27,28 and since ethanol inhibits the ubiquitin proteasome pathway as well as MTOR,29 we postulated that autophagy is activated in skeletal muscles following ethanol exposure. Using muscle tissue from patients with alcoholic cirrhosis and mice fed with ethanol as well as ethanol-exposed myotubes, we examined the ubiquitin proteasome and autophagy pathways. Further, it is not known whether ethanol per se or its metabolite acetaldehyde mediates autophagic response in skeletal muscle to ethanol. To address this question, we used inhibitors of alcohol metabolism to assess the role of ethanol metabolism in inducing autophagy.
Results
Alcoholic cirrhotics have lower skeletal muscle mass associated with increase in autophagy markers
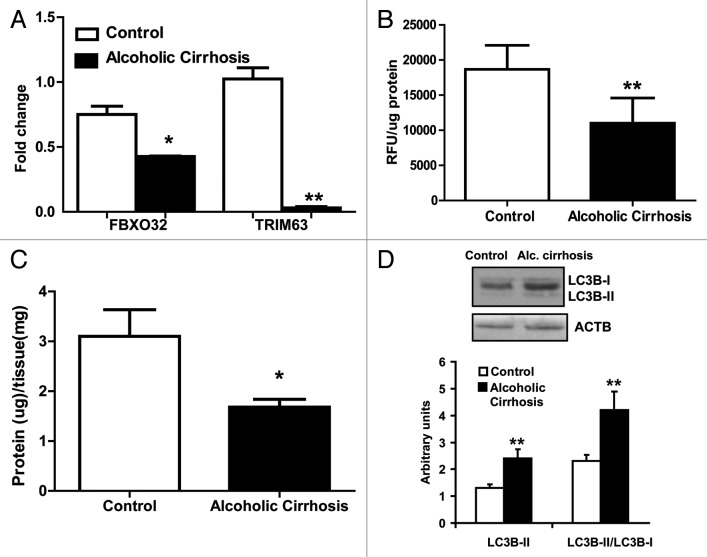
To determine whether alcoholic cirrhotics have lower muscle area than the controls, skeletal muscle area was quantified using the standard CT imaging technique. We observed significantly lower muscle area in the cirrhotics compared with healthy controls (Fig. 1). The underlying mechanism for muscle loss in cirrhotic muscles was assessed by examining the proteasome pathway. Critical proteasome components, FBXO32 and TRIM63, were significantly downregulated in the cirrhotics (Fig. 2A). 20S proteasome activity was also lower in cirrhotic skeletal muscle compared with controls (Fig. 2B). Interestingly, this was accompanied by lower protein per mg of tissue in the skeletal muscle from alcoholic cirrhotics (Fig. 2C). These data suggest protein degradation by a non-proteasome pathway and therefore, autophagy was assessed as an alternative mechanism for muscle loss with ethanol exposure. Significantly, an increase in LC3B lipidation was observed in skeletal muscle lysates from alcoholic cirrhotics compared with controls (Fig. 2D) suggesting that autophagy may underlie the muscle loss observed in alcoholic cirrhotics.
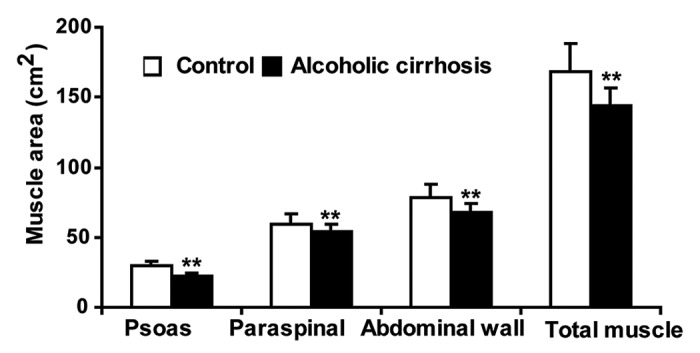
Figure 1. Skeletal muscle mass was reduced in alcoholic cirrhosis. Skeletal muscle area measured on CT image analysis at L4 vertebra showed significantly lower muscle mass in alcoholic cirrhosis compared with controls. (n = 5 in each group) **P < 0.01.
Figure 2. Proteolysis markers in alcoholic cirrhotics compared with the controls. (A) Relative fold change in FBXO32 and TRIM63 mRNA (B) 20S proteasome activity in the skeletal muscle from alcoholic cirrhosis compared with controls. (C) Protein content per mg muscle weight in alcoholic cirrhotics and controls. (D) Representative immunoblots and densitometry of LC3B lipidation in the skeletal muscle from alcoholic cirrhotics and controls. *P < 0.05 **P < 0.01. n = 5 each in cirrhosis and controls.
Alcohol-fed mice have lower skeletal muscle mass with unaltered ubiquitin proteasome but increased autophagy
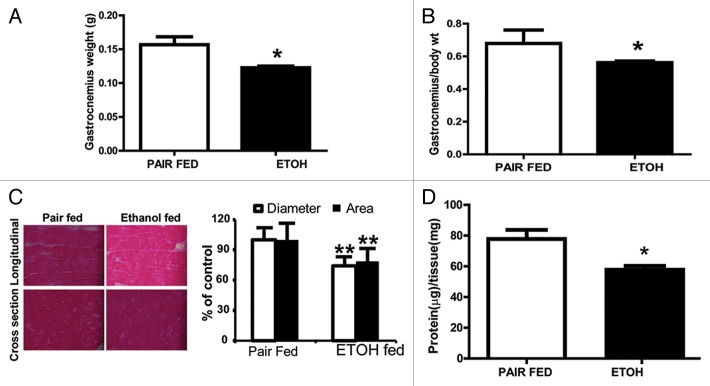
Since alcoholic cirrhotics have lower muscle mass associated with increased autophagy and lower proteasome-mediated proteolysis, we assessed whether a similar mechanism contributed to muscle loss with ethanol feeding in mice in vivo. Total body weight was not appreciably different between ethanol-fed mice and pair-fed controls (data not shown) but the gastrocnemius muscle weight was significantly lower (P = 0.02) in the ethanol-fed mice (Fig. 3A). Gastrocnemius muscle mass expressed as a ratio of whole body weight was also significantly lower in ethanol-fed than pair-fed controls (Fig. 3B). Histology of the gastrocnemius muscle showed significantly lower longitudinal diameter and cross-sectional area in ethanol-fed mice compared with pair-fed controls without evidence of myonecrosis, inflammatory response, or fibrosis. (Fig. 3C). Muscle protein/ unit of muscle tissue was lower in ethanol-fed mice than pair-fed controls (Fig. 3D).
Figure 3. Body weight and muscle mass in ethanol-fed mice. (A) Gastrocnemius weight and (B) Gastrocnemius to body weight ratio in ethanol-fed mice compared with pair-fed controls. (C) Representative histological cryosections of gastrocnemius muscle oriented in the longitudinal direction and cross-section from ethanol-fed and pair-fed control mice, and histograms showing mean diameter and cross-sectional area from at least 30 sections from each animal. (D)Total skeletal muscle protein content per mg muscle weight in ethanol-fed and pair-fed control mice. *P < 0.05; **P < 0.01. n = 6 mice in each group.
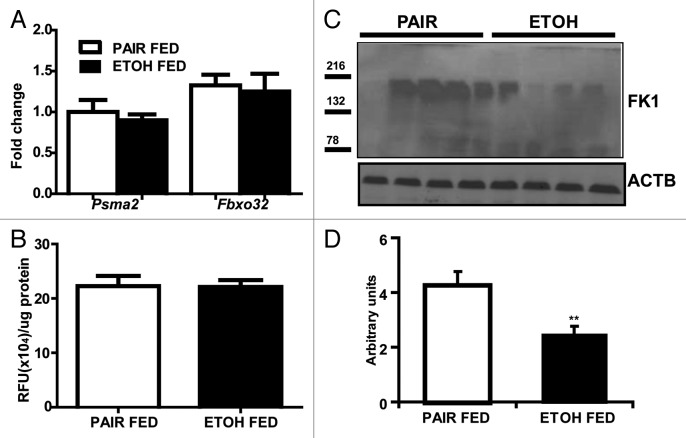
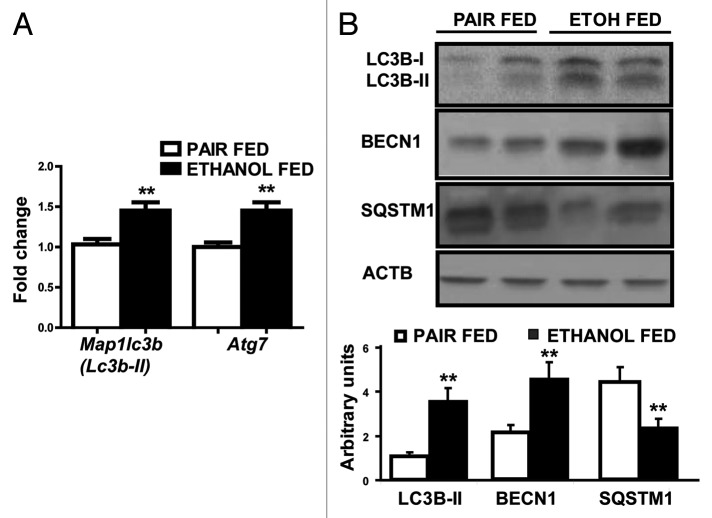
Relative expression of the proteasome components, (mRNA) Psma2 (Lmpc3 or proteasome C3) and (mRNA) Fboxo32 (Fig. 4A) and 20S proteasome activity in the gastrocnemius muscle (Fig. 4B) was not significantly different in the ethanol-treated and pair-fed controls. Immunoblots, however, showed significantly lower ubiquitinated large molecular weight structural proteins in the gastrocnemius muscle from ethanol-fed mice compared with pair-fed controls (Fig. 4C and D). In contrast, real-time PCR quantification of critical autophagy genes (mRNA) Lc3b and (mRNA) Atg7 showed significantly higher expression in ethanol-fed mice compared with pair-fed controls (Fig. 5A). Consistently, increased LC3B lipidation, BECN1/Beclin 1 expression and SQSTM1/p62 degradation in ethanol-fed mice suggested increased muscle autophagy (Fig. 5B).
Figure 4. Ubiquitin proteasome markers in ethanol-fed mice compared with the pair-fed controls. (A) Relative expression of mRNA of ubiquitin proteasome markers Psma2 and Fboxo32. (B) 20S proteasome activity in gastrocnemius muscle (C) Immunoblots and (D) densitometry of ubiquitinated large muscle structural proteins using the FK1 antibody in ethanol-fed mice compared with pair-fed controls. **P < 0.01. n = 6 mice in each group.
Figure 5. Autophagy markers in ethanol-fed mice compared with its pair-fed controls. (A) Relative fold change in expression of Lc3b and Atg7 mRNA (B) Representative immunoblots from 2 animals each and densitometry (n = 6 animals in each group) for LC3B lipidation, SQSTM1 degradation, and BECN1 protein overexpression in gastrocnemius muscle from ethanol-fed compared with pair-fed controls. **P < 0.01.
Increased autophagy in ethanol-treated murine myotubes
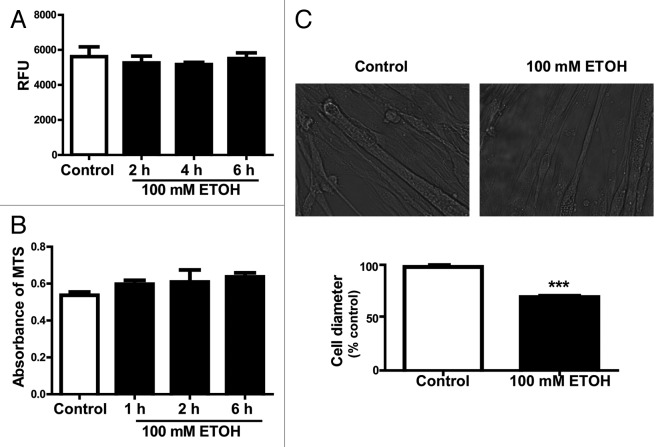
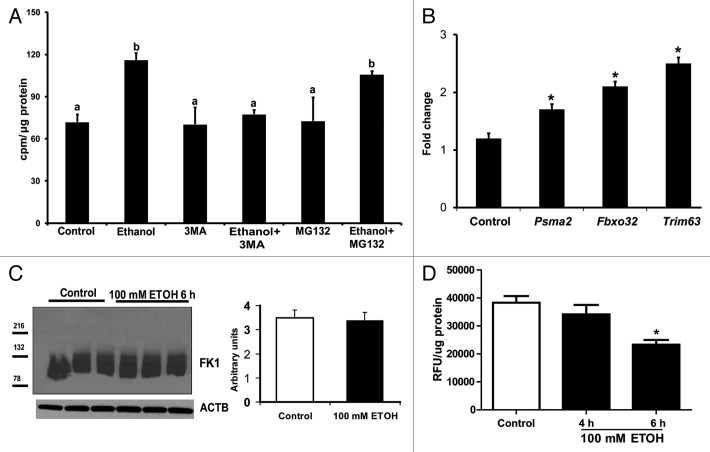
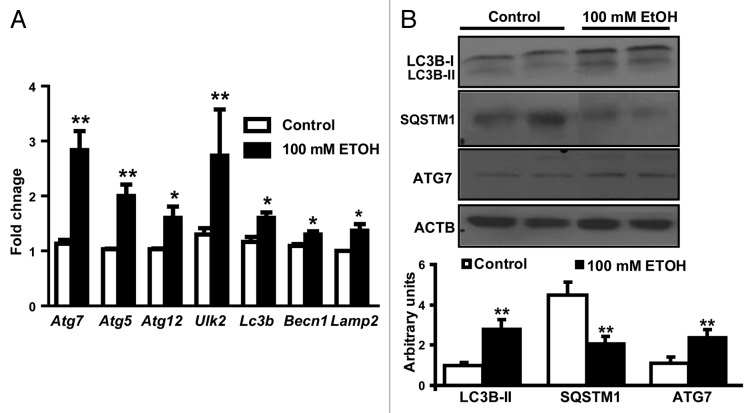
In order to dissect the mechanisms of ethanol-mediated proteolysis in skeletal muscle, C2C12 murine myotubes were exposed to ethanol. Importantly, cell viability and proliferation were not altered in response to ethanol exposure (Fig. 6A and B). Ethanol-treated cells were significantly smaller than control cells (Fig. 6C). Pulse-chase experiments were performed to investigate whether loss in cell size is due to increased protein degradation by autophagy. Ethanol exposure resulted in elevated muscle proteolysis measured by increased release of [3H] phenylalanine following a long chase period. Ethanol induced proteolysis was blocked by the autophagy inhibitor, 3-methyladenine, but was not altered by the proteasome inhibitor, MG132 (Fig. 7A). Even though critical proteasome gene expression was higher with ethanol treatment (Fig. 7B), immunoblotting studies for ubiquitination showed no difference between ethanol-treated and control cells (Fig. 7C), while 20S proteasome activity was lower with ethanol treatment (Fig. 7D). Real-time PCR for autophagy gene-expression markers showed significant elevation in (mRNA) Ulk2, Atg5, Atg7, Atg12, Lc3b, Becn1, and Lamp2 (Fig. 8A). Immunoblotting showed increased LC3B lipidation, elevated SQSTM1 degradation, and higher ATG7 protein expression in C2C12 myotubes exposed to ethanol compared with controls, indicating increased autophagy (Fig. 8B).
Figure 6. Responses of C2C12 myotubes treated with 100 mM ethanol. (A) Cell viability and (B) cell proliferation of differentiated C2C12 murine myotubes incubated in 100 mM ethanol and control cells (C) Representative images of phase contrast microscopy of C2C12 murine myotubes treated with 100 mM ethanol used to quantify the myotube diameter. Myotubes treated with 100 mM ethanol for 6 h (mean diameter ± SEM) compared with control conditions. ***P < 0.001. All experiments were done in triplicate and 3 independent experiments were performed.
Figure 7. Proteolysis in C2C12 myotubes treated with 100 mM ethanol. (A) Release of ring [3H] phenylalanine after a long chase period was increased and was inhibited by using 3 methyl adenine, an autophagy inhibitor. In contrast, the proteasome inhibitor, MG132, did not affect ethanol-induced increased proteolysis. Lettering above bars indicates differences as follows: (a and b) P < 0.05; same letter indicates absence of difference between those groups. (B) Relative expression of the critical proteasome component genes, Psma2, Fboxo32, and Trim63 shows increased expression in ethanol-treated cells compared with controls. *P < 0.05. (C) Representative immunoblots and densitometry of ubiquitinated proteins identified using the FK-1 antibody in myotubes treated with 100 mM ethanol compared with controls. (D) 20S proteasome activity assay in gastrocnemius muscle from mice fed ethanol compared with controls. *P < 0.05 compared with control. All experiments were done in triplicate and 3 independent experiments were performed.
Figure 8. Autophagy markers in ethanol-treated C2C12 cells compared with controls. (A) Relative expression of the autophagy-associated genes Atg7, Atg5, Atg12, Ulk2, Lc3b, Becn1, and Lamp2 in C2C12 myotubes treated with 100 mM ethanol for 6 h compared with controls. (B) Representative immunoblots and densitometry for LC3B-II (following cleavage and lipidation of LC3B), SQSTM1 degradation and ATG7 expression from C2C12 myotubes treated with 100 mM ethanol for 6 h compared with controls. *P < 0.05 **P < 0.01. All experiments were done in triplicate and 3 independent experiments were performed.
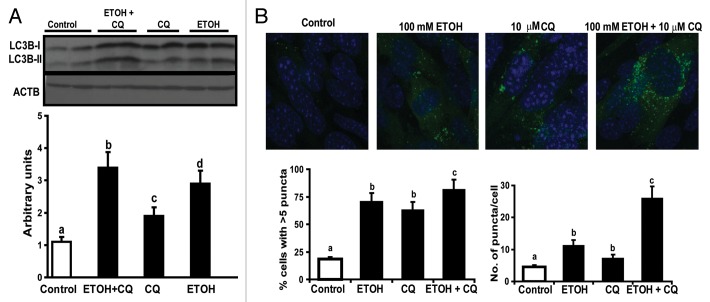
Since autophagy markers only provide a static measure, we performed assessment of autophagy flux in myotubes exposed to ethanol in presence of the lysosomal inhibitor, chloroquine. Autophagy flux, measured by LC3B lipidation was increased in myotubes exposed to ethanol (Fig. 9A). Confocal fluorescent microscopy of C2C12 myotubes stably expressing GFP-LC3B (Fig. 9B) also showed significant autophagosome formation with ethanol exposure. Importantly, choroquine treatment resulted in an increase of autophagosome formation consistent with the increased flux as observed with LC3B lipidation in response to ethanol exposure. These data support the idea that ethanol exposure leads to marked increase in rates of autophagy flux that may underlie protein degradation and muscle loss.
Figure 9. Increased autophagy flux in murine myotubes exposed to ethanol. (A) Representative immunoblots and densitometry for LC3B lipidation in C2C12 myotubes treated with 100 mM ethanol (ETOH), 10 uM chloroquine (CQ), and 100 mM ethanol with 10 μM chloroquine. Lettering above bars denotes differences as follows: (a and b) < 0.001; (a–c) P < 0.05; (a–d) P < 0.01; (b and c) P < 0.01; (c and d) P < 0.01; (b–d) P < 0.01 and identical letters indicate no difference between those groups. (B) Representative fluorescent confocal microscopy images of C2C12 murine myotubes stably transfected with GFP-LC3B and treated with 100 mM ethanol, 10 μM chloroquine and 100 mM ethanol with 10 uM chloroquine. Percentage of cells with at least 5 GFP-LC3B positive and mean number of puncta per cell. (a and b) P < 0.01; (a–c) P < 0.001; (b and c) P < 0.05. Same letters indicate no significant difference. All experiments were done in triplicate and 3 independent experiments were performed.
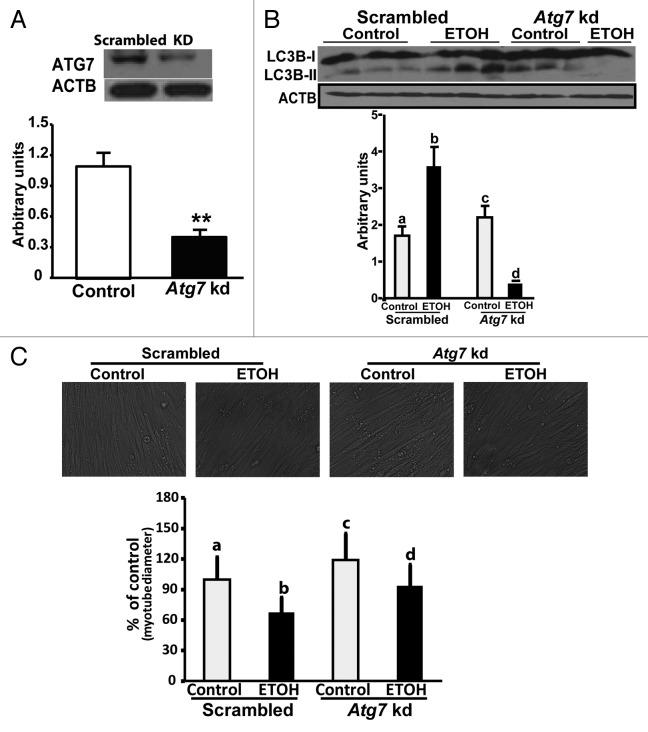
In order to demonstrate that autophagy contributes to reduction in muscle mass, C2C12 myotubes with stable knockdown of Atg7 were generated that showed over 50% reduction in expression of ATG7 protein (Fig. 10A). With knockdown of Atg7, no increase in LC3B lipidation was observed in contrast to the cells transfected with scrambled shRNA following ethanol exposure (Fig. 10B). Atg7 knockdown also resulted in abrogation of the reduction in size of muscle cells with ethanol treatment (Fig. 10C).
Figure 10. Ethanol-induced muscle autophagy was reduced by Atg7 knockdown. (A) Representative immunoblots and densitometry showing Atg7 knockdown in C2C12 myotubes. Scrambled (scrambled construct). **P < 0.01. (B) Representative immunoblots and densitometry (LC3B-II/LC3B-I ratio) showed that LC3B lipidation was not increased in C2C12 myotubes with stable knockdown of the critical autophagy gene Atg7 that were exposed to 100 mM ethanol. Lettering above bars denotes differences as follows: (a and b) P < 0.001; (a–c) P < 0.05; (a–d) P < 0.01; (b and c) P < 0.01; (c and d) P < 0.01; (b–d) P < 0.01. Same letters indicate no significant difference. (C) Representative images of phase contrast microscopy used to quantify the myotube diameter of C2C12 murine myotubes with stable Atg7 knockdown and scrambled shRNA treated, with 100 mM ethanol. Myotubes treated with 100 mM ethanol for 6 h (mean diameter ± SEM) compared with control conditions. (a and b), (a–c), (b–d), (c and d) P < 0.001. Same letters indicate no significant difference. All experiments done in triplicate and 3 independent experiments were performed.
Autophagy is induced by the ethanol metabolite acetaldehyde
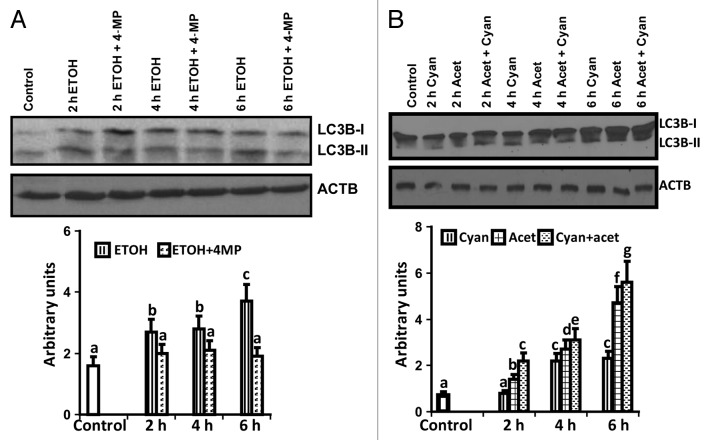
We investigated whether ethanol or its metabolite acetaldehyde contributes to increased autophagy. Ethanol-exposed myotubes were treated with inhibitors of alcohol dehydrogenase (4-methylpyrazole) or acetaldehyde dehydrogenase (cyanamide) and LC3B lipidation was quantified as a measure of autophagy. Ethanol-induced LC3B lipidation was not increased in presence of 4-methylpyrazole suggesting that acetaldehyde, the downstream metabolite of ethanol, mediates autophagy (Fig. 11A). Consistent with this postulation, treatment of cells with acetaldehyde significantly increased LC3B lipidation and blocking acetaldehyde metabolism by cyanamide further increased autophagy, providing evidence that acetaldehyde mediates autophagy during ethanol exposure (Fig. 11B).
Figure 11. Ethanol-mediated autophagy flux is due to acetaldehyde. (A) Representative immunoblots and densitometry of LC3B lipidation following treatment with 100 mM ethanol, 100 mM ethanol with 1 mM 4-methylpyrazole (alcohol dehydrogenase inhibitor) at 2, 4, and 6 h compared with the controls. Lettering above bars denotes differences as follows: (a and b), (b and c) P < 0.01; (a–c) P < 0.001. (B) Representative immunoblots and densitometry of LC3B lipidation in response to 1mM acetaldehyde, 0.3 mM cyanamide (acetaldehyde dehydrogenase inhibitor) and acetaldehyde with cyanamide at 2, 4, and 6 h. (a and b), (b and c), (c–e), (d and e) P < 0.05; (a–c), (f and g) P < 0.01; (c–f) P < 0.001. Same letters indicate no significant difference. Ac, acetaldehyde; Cy, Cyanamide; MP, 4-methylpyrazole. All experiments were done in triplicate and 3 independent experiments performed.
Discussion
We report that proteasome activity as a mechanism of protein degradation is not altered in skeletal muscles from alcoholic cirrhotics, ethanol-fed mice, or C2C12 myotubes exposed to ethanol, indicating that alternative modes of muscle loss are activated. Using this set of models, our studies showed that ethanol-induced muscle loss due to protein degradation is mediated by autophagy. Furthermore, our studies show that autophagy flux is increased by ethanol exposure in C2C12 myotubes and its metabolite acetaldehyde mediates this increase in autophagy. These studies are important in the context of alcoholic cirrhosis wherein severe muscle loss occurs8,9,11,18 and our current studies provide the underpinnings for the mechanisms accounting for proteolytic degradation and muscle loss.
We observed significant loss of muscle area in alcoholic cirrhotics as assessed by CT images, which was consistent with previous data on muscle loss using anthropometric measures.4,5,30 Although a number of causes for malnutrition and reduced muscle mass have been suggested in alcoholic liver disease,31 there have been limited studies on molecular mechanisms in patients with alcoholic cirrhosis specifically with regards to skeletal muscle proteolytic pathways.12,18 Consistent with these data, ethanol-fed mice had lower muscle mass and muscle diameter on histology without inflammatory cell infiltration or myonecrosis. These are similar to those reported by others in ethanol-fed rats and in human muscle biopsies.32,33 Lack of inflammatory infiltrate or increased fibrosis also suggests that our molecular studies were performed on muscle tissue per se and not on non-myogenic cells. Our studies in C2C12 myotubes also showed reduced muscle cell diameter in response to ethanol exposure.
Ubiquitin-mediated proteolysis is believed to be the major mechanism of skeletal muscle atrophy but it is also known that autophagy also contributes to muscle protein turnover.34 In this regard, our observation of unaltered or lower ubiquitin mediated proteolysis in the skeletal muscle of patients with alcoholic cirrhosis compared with controls is consistent with previous reports in animal and cell models.17,18 Failure to activate the canonical ubiquitin mediated muscle proteolysis maybe due to ethanol-induced mitochondrial dysfunction and reduced cellular ATP stores35 that impair proteasome activity.36 Additionally, it is known that ethanol can directly impair ubiquitin components, which may account for reduced proteasome activity.37 Correspondingly, we observed unaltered 20S proteasome activity expression of the ubiquitin component genes with reduced ubiquitination of large structural proteins following ethanol exposure in mice fed ethanol. The cellular model did show an increase in the expression of critical proteasome gene expression even though the functional activation of the proteasome pathway was not increased as observed by either the activity assay or during the pulse chase experiments where a potent proteasome inhibitor, MG132 did not significantly alter ethanol-mediated proteolysis. The lack of any significant increase in ubiquitinated proteins despite reduced proteasome activity suggests an autophagic degradation of these proteins. The increased expression of proteasome gene components without a corresponding increase in proteasome activity or proteolysis can be explained by posttranscriptional or posttranslational effects of ethanol or its metabolites. Some of the differences observed in these disparate models are consistent with conflicting reports of unaltered or lower proteolysis by previous investigators and may be a reflection of the concentration or duration of exposure of ethanol in vivo vs. in vitro and differences in the rate of ethanol metabolism.
Since our data showed that ubiquitin-mediated proteolysis was not increased despite continued reduction in muscle mass and protein content in alcoholic cirrhotics or following ethanol exposure, this indicates alternative mechanisms of protein breakdown. In this regard, we observed increased lipidation of LC3B, a prominent marker of autophagy, in alcoholic cirrhotics compared with controls. Similarly, ethanol-fed mice or myotubes exposed to ethanol showed increase in multiple static measures of autophagy. Autophagy flux studied by confocal fluorescence microscopic analysis of myotubes stably expressing GFP-LC3, and chloroquine showed that ethanol stimulates autophagosome formation rather than block maturation of autophagosome. Our data also demonstrated that autophagy contributes to ethanol-induced myotube proteolysis, since blocking autophagy with 3-methyladenine reduced release of labeled phenylalanine from long-lived muscle proteins in pulse-chase experiments. This is in contrast to studies reporting no appreciable changes in proteolysis in myoblasts following ethanol exposure.17,38 The apparent difference in results could be due to a shorter duration of the pulse chase conditions and the undifferentiated state of the cells used (myoblasts instead of myotubes) in those studies. Marked reduction in proteolysis following the autophagy inhibitor 3-methyladenine in conjunction with our data on the ubiquitin proteasome components show that autophagy is the primary proteolytic mechanism in the skeletal muscle upon ethanol exposure. Studies in the Atg7 knockdown cells were consistent with the interpretation that autophagy contributes to increased proteolysis and reduced muscle mass. The myotube diameter in the Atg7 knockdown is reduced after ethanol compared with control untreated and knockdown cells but larger than the control cells treated with ethanol. These show that blocking autophagy does mitigate but does not completely reverse ethanol-induced muscle loss since ethanol also impairs muscle protein synthesis that contributes to a reduction in muscle size39 that is not reversed by blocking autophagy.
Increased muscle autophagy in these patients could be either a direct effect of ethanol or its metabolites as pathophysiological metabolic alterations are known to occur in cirrhosis.34 It is well known that skeletal muscles are exposed to high concentrations of ethanol and acetaldehyde when plasma concentration of ethanol is increased.40,41 Our studies show that the ethanol metabolite acetaldehyde is a critical mediator of increased autophagy following ethanol exposure as inhibition of ethanol metabolism by alcohol dehydrogenase results in reduced autophagy. Consistently, blocking acetaldehyde metabolism by an acetaldehyde dehydrogenase inhibitor resulted in a further increase in autophagy. These complementary data suggest that the ethanol metabolite, acetaldehyde, induces skeletal muscle autophagy following ethanol exposure. Acetaldehyde can potentially stimulate autophagy by a number of mechanisms including alteration in mitochondrial and microsomal membrane lipids, induction of oxidative stress in cultured cells,42,43 and generation of protein adducts.44,45 Thus, our studies lay the foundation for the idea that acetaldehyde generated by ethanol metabolism may underlie the increased autophagy observed with ethanol and may contribute to sarcopenia in these patients.
The role of autophagy in maintenance of skeletal muscle mass is not yet completely clear and our study is a beginning point in understanding the role of autophagy in alcoholic cirrhosis. A number of muscle disorders have been shown to be due to impaired autophagy while exaggerated autophagy contributes to muscle loss.46,47 Our in vitro studies in murine myotubes showed that knockdown of the critical autophagy gene Atg7 resulted in reduced LC3B lipidation that was accompanied by increased cell diameter. Since autophagy plays a critical role in cellular homeostasis, the long-term and functional consequences of blocking autophagy during ethanol exposure need to be examined. Short-term ethanol exposure in vitro and in animal models cannot be equated with long-standing alcoholic cirrhosis since muscle autophagy is not only increased by ethanol but also by other metabolic consequences of cirrhosis including hyperammonemia.34 Our data are consistent with previous reports of more severe muscle loss in alcoholic cirrhosis5,48 that suggest that the combined effects of ethanol induced sarcopenia are additive to that caused by hyperammonemia once cirrhosis develops. Studies in human subjects to demonstrate the direct effect of ethanol on skeletal muscle autophagy will need ethanol feeding and are ethically challenging. Our animal and in vitro studies demonstrate that ethanol plays a direct role in enhanced muscle autophagy in patients with cirrhosis.
In summary, the results of our studies show that physiologically relevant concentrations of ethanol and its metabolite induce skeletal muscle autophagy. This is supported by measurement of autophagy flux showing that ethanol treatment increased autophagy. The issue of whether autophagy is beneficial in removing toxic protein aggregates or detrimental by contributing to sarcopenia is, however, yet to be understood. Therefore, further studies are required to dissect the underlying molecular mechanisms of increased autophagy and its contribution to skeletal muscle responses in patients with alcoholic liver disease.
Materials and Methods
Reagents
The following antibodies were used: BECN1/Beclin1 (Cell Signaling, 3495); ATG7 (Cell Signaling, 2631), LC3B (Novus Biologicals, NB100-2220), SQSTM1/p62 (Progen, JP62-C), FK1 (Enzo Life Sciences, BML-PW8805) and ACTB/β-actin (Santa Cruz Biotechnology Inc, sc-1615). Proteasome 20S activity assay (Chemicon Inc, APT 280) was performed using a fluorometric assay based on the release of 7-amino-coumarin on proteolysis using methods previously described.34 Primers were designed by Integrated DNA Technologies. Chemicals used in this study were obtained from Sigma Aldrich: acetaldehyde (Fluka 00070), ethanol (E7023), 3-methyladenine (M9281), cyanamide (187364), 4-methylpyrazole (M1387), MG132 (2211) and mineral oil (M5904). Ring [3H] phenylalanine was obtained from Perkin Elmer (NET112200IMC)
Human studies
Patients with alcoholic cirrhosis who underwent liver transplantation and matched controls (n = 5 each) were included in the study after obtaining an informed consent. Controls included donors for liver transplantation or subjects undergoing elective abdominal surgery without evidence of underlying disease. The diagnosis of cirrhosis was made by liver biopsy in patients. Alcohol was considered to be the etiological factor by clinical and chemical dependency evaluation. The clinical details are shown in Table 1. Muscle mass was quantified by previously described methods using CT slice at L4 vertebra, the psoas, paraspinal, and abdominal wall muscle areas were quantified with the threshold settings for skeletal muscle set at −29 to +150 Hounsfield units.49 Skeletal muscle biopsies were obtained from the rectus abdominis, blotted, weighed, flash frozen in liquid nitrogen, and stored for later assays at −80 °C. The details of these methods have been previously described.34 All studies were approved by the Institutional Review Board at the Cleveland Clinic and written informed consent obtained from the subjects.
Table 1. Clinical characteristics of subjects.
| Characteristic | Control | Alcoholic cirrhosis |
|---|---|---|
| Number | 5 | 5 |
| Gender (M:F) | 4:1 | 4:1 |
| Age (y) | 48.4 ± 10.6 | 49.2 ± 11.4 |
| Ascites | 0 | 5 |
| BMI (kg/m2) | 27.0 ± 1.0 | 27.7 ± 3.0 |
| Serum bilirubin (mg/dl) | 0.4 ± 0.1 | 13.1 ± 11.5** |
| Serum GPT/ALT (IU/dl) | 20.4 ± 6.7 | 39.0 ± 21.3* |
| Serum GOT/AST (IU/dl) | 27.4 ± 7.9 | 63.4 ± 41.8* |
| Serum creatinine (mg/dl) | 0.8 ± 0.3 | 1.1 ± 0.4 |
| Serum albumin (g/dl) | 4.0 ± 0.8 | 2.8 ± 0.8** |
| Child Pugh score | 5.0 ± 0 | 9.6 ± 2.1*** |
P < 0.05; **P < 0.01; ***P < 0.001. GPT/ALT, glutamic-pyruvate transaminase/alanine aminotransferase; GOT/AST, glutamic-oxaloacetic transaminase/aspartate aminotransferase; BMI, body mass index; M, male; F, female.
Animal studies
All procedures using mice were approved by the Cleveland Clinic Institutional Animal Care and Use Committee. Female C57BL/6 mice (Jackson Laboratory) at 8 wk of age, were allowed free access to a Lieber DeCarli liquid diet (Dyets Inc, 710260) containing ethanol or isocalorically substituted maltodextrins. Animals were housed in the biological resource unit with a 12 h light/day cycle. After adjusting to the control liquid diet for 2 d, the ethanol-fed group was given a liquid diet with 1% ethanol (5.5% total calories) for 2 d, 2% ethanol (11% total calories) for 2 d, 4% (22% total calories) for 7 d, 5% (27% total calories) for 7 d and finally 6% (32% total calories) for 7 d as described earlier.50 At the time of euthanasia, mice were anesthetized and gastrocnemius muscle harvested, weighed and flash frozen in liquid nitrogen and stored at −80 °C for subsequent assays. The ethanol-fed mice had liver injury as evidenced by steatosis, mild inflammatory cell infiltrates compared with pair-fed controls as reported earlier.51 Additionally, plasma aspartate and alanine amino transferase and liver triglyceride content were increased compared with controls (data not shown). Gastrocnemius histology with hematoxylin and eosin staining for light microscopy examination were done on cryosections of a part of the muscle frozen in isopentane chilled in liquid nitrogen. Fiber diameter in longitudinal sections and area in cross sections were determined in at least 30 fibers in each animal in the ethanol-fed and pair-fed controls.
Cell cultures
C2C12 murine myoblasts (ATCC; CRL 1772) were grown to confluence in proliferation medium (Dulbecco’s modified Eagle’s medium (DMEM) containing 10% fetal bovine serum) followed by differentiation in DMEM with 2% horse serum for 48 h as previously described.34 Myotubes were then exposed to 100 mM of ethanol up to 6 h. Ethanol-treated and control cells were harvested at the same time points. Cell viability was assessed using the trypan blue and resazurin reduction assays (Promega, G8082) as previously described.34 Cell proliferation was determined by reduction of (3-(4,5-dimethylthiazol-2-yl)-5-(3-carboxymethoxyphenyl)-2-(4-sulfophenyl)-2H-tetrazolium (MTS) into a formazan product (Promega, G5421) that is soluble in culture medium and read on a 96-well plate at 490 nm. MTS is converted into aqueous, soluble formazan by dehydrogenase enzymes found in metabolically active cells and used to quantify cell proliferation. Even though cell proliferation is unlikely to be altered in short periods of time, the impact of ethanol exposure on proliferation at different time points, which is our standard duration of ethanol exposure of up to 6 h, was quantified to establish that changes in cell proliferation did not artifactually influence the endpoints of interest.
Generation of stable cell lines with Atg7 knockdown
A stable cell line expressing shRNA to Atg7, a critical autophagy gene, was generated by lentivirus transduction using protocols approved by the Institutional Biosafety Committee at the Cleveland Clinic. In brief, lentivirus was generated in HEK293T cells transfected with a MISSION Atg7 shRNA construct (Sigma, NM_028835. 1-2309s1c1), and the lentivirus packaging constructs, RSV-Rev, MDGLG-RRE and HCMV-G, using Polyfect (Qiagen, 301105) according to manufacturer’s instructions. Post-transfection, media containing viral particles was collected at 48 h and passed through 0.4-µm filter. This was used to infect C2C12 cells in the presence of polybrene (20 μg/ml) and stable cell lines were selected with puromycin (1.5 μg/ml) for 10 d.
Cell diameter measurement
The diameters of at least 80 myotubes from 3 independent experiments each were measured using ImageJ (imagej.nih.gov/ij/list.html). The mean ± SD were calculated and expressed as a ratio compared with controls.
Autophagy flux and response to ethanol or acetaldehyde
Autophagy flux was quantified in cell cultures using the autophagy inhibitor chloroquine, and performing immunoblotting for detection of LC3B lipidation, BECN1 overexpression, and SQSTM1 degradation, as previously described.34 Additional studies were also done in C2C12 stably expressing GFP-LC3B using fluorescence microscopy following ethanol treatment with and without chloroquine.34
Cells were treated with 100 mM ethanol or 1 mM acetaldehyde with and without 2 mM 4-methylpyrazole (alcohol dehydrogenase inhibitor) or 0.3 mM cyanamide (acetaldehyde dehydrogenase inhibitor). Since acetaldehyde was highly volatile, cell cultures were layered with 250 μl of mineral oil over the incubation medium. Mineral oil did not alter the cell morphology and has been reported not to alter the cellular respiration.52 Total proteins were extracted and autophagy flux assessed as described earlier.34
Real-time PCR
Total RNA was extracted as previously described and used for real-time PCR.34,53 In brief, total RNA from the rectus abdominis muscle from human subjects or the gastrocnemius muscle from the mice and C2C12 myotubes treated with ethanol was isolated using TRI reagent (Molecular Research Center Inc, TB126). cDNA was synthesized using avian leukemia retrovirus reverse transcriptase (BD Clontech, 639506) and real-time PCR performed using the SYBR® fluorescence kit (Qiagen, 204141) with Stratagene Mx3000p (Agilent Technologies). Relative differences were normalized to the expression of ACTB in humans (Actb in mice).34,53 Expression of autophagy genes and proteasome genes were quantified using primer sequences previously published.34 Primer sequence for (mRNA) Atg12 was Forward 5′ CCCAGACCAA GAAGTTGGAA 3′ and reverse 5′ CAGCACCGAA ATGTCTCTGA 3′ (NM_026217.3).
Immunoblots
Total muscle protein was extracted from a precisely weighed amount (~30 mg) of frozen skeletal muscle samples or from the cells in culture. Samples were added to the Lysing Matrix D (MP Biomedicals, 6913-100) tubes with ice-cold RIPA buffer (Thermo Scientific, 89900) with protease and phosphatase inhibitors (Thermo Scientific, 1862495, 1862209) and protein extracted after homogenizing the tissue using FastPrep® 120 (Q-BIOgene). Protein content was quantified using the bicinchoninic acid assay (Thermo Fisher Scientific, 23227) and stored at −80 °C for subsequent assays. For immunoblots, equal amounts of protein samples were loaded on a 4–12% gradient gel, electrophoresed, and then electrotransferred onto PVDF membranes that were blocked using 5% nonfat milk in tris-buffered saline (TBS; 50 mM Tris, 150 mM sodium chloride, pH 7.6). The membranes were incubated overnight at 4 °C in primary antibodies as described earlier.34 The FK1 antibody was used to detect ubiquitination of large proteins that are the predominant type of structural proteins in the skeletal muscle. The membranes were washed in TBST (50 mM Tris, 150 mM sodium chloride, 0.05% Tween 20, pH 7.6) followed by incubation with appropriate secondary antibodies. Immune reactivity was detected by chemiluminescent HRP substrate (Millipore, WBKLS0500). The primary antibody dilutions are as follows: ATG7 1:1000; BECN1 1:1000; ACTB 1:1000; FK1 1:1000; LC3B 1:1000; SQSTM1 1:500. In order to establish that ACTB is an appropriate loading control, we examined its expression in response to ethanol and found no significant change (Fig. S1). We therefore used this as our loading control for these studies.
Fluorescent confocal microscopy
Semiconfluent (70–80%) monolayers of stably transfected GFP-LC3B C2C12 cells on glass slides were incubated in differentiation medium and exposed to 100 mM ethanol in 2% differentiation medium. Cells were washed with PBS and-fixed in 4% paraformaldehyde at the room temperature for 30 min. After another 3× PBS washes, samples were mounted on Vectashield® mounting medium for fluorescence with DAPI (Vector Laboratories, H-1200). Images were acquired on a Leica TCS SP2® confocal laser scanning microscope. The samples were excited at 488 nm. Cells were imaged at 40×, and the images were collected using Leica® Confocal software.
Analysis of GFP-LC3B puncta
The GFP-LC3B puncta were counted and expressed as number of cells with > 5 green puncta per cell as previously described.54 GFP-LC3B puncta were scored in Z-stack overlays from at least 4 separate fields with ~100 nuclei and autophagosome analysis was performed using a customized virtual basic Image-Pro macro.
Protein breakdown
Myotubes in differentiation media (DM) were treated with 2 μCi/ml ring [3H]- phenylalanine for labeling intracellular proteins. After a 24 h pulse, the medium was removed, cells washed with DM twice, and incubated with DM overnight to chase out the short-lived proteins. At the end of the chase period, cells were treated with 100 mM ethanol with and without 10 mM 3-methyladenine (an autophagy inhibitor) and 30 μM MG132 (a proteasome inhibitor). At the end of the treatment, the medium was collected and radioactivity measured as counts per min in 60 μl of medium on a Beckman Coulter LS6500 scintillation counter (Beckman Coulter Inc). Protein estimation performed as described above and the data expressed as cpm/μg protein as a measure of proteolysis of long-lived proteins that are degraded by the autophagy pathway.55
Statistical analysis
Experimental data for all conditions are expressed as mean ± SEM and the number of animals used is provided in the figure legends. Quantitative variables were analyzed using the Student t test for protocols with 2 groups. For all studies in which the experimental protocol involved more than 2 groups, data were analyzed using a one-way analysis of variance. When ANOVA showed a significant overall effect, differences among different groups were assessed using the Bonferroni post-hoc analysis. Qualitative variables were analyzed using the chi square test. A P < 0.05 was considered significant. All analyses were done using SPSS v20 (IBM).
Supplementary Material
Disclosure of Potential Conflicts of Interest
No potential conflicts of interest were disclosed.
Acknowledgments
We would like to acknowledge the assistance of Dr Richard Prayson, the muscle histopathologist at the Cleveland Clinic, for his assistance with reviewing the skeletal muscle sections.
This work was supported in part by the Cleveland Alcohol Center grant P20- AA 017837 to LEN and DK 83414 to SD and NIH grant R01DK082437 to CM.
Glossary
Abbreviations:
- 3MA
3-methyladenine
- 4MP
4-methylpyrazole
- ACTB
actin, beta
- ATG/Atg
autophagy related (protein/gene)
- BECN1
Beclin 1, autophagy related
- CT
computerized tomography
- ETOH
ethanol
- FBXO32/Atrogin1
F-box protein 32
- GFP-LC3
N-terminal green fluorescent protein (GFP) fused LC3
- LAMP2
lysosomal-associated membrane protein 2
- PCR
polymerase chain reaction
- MAP1LC3B/LC3B
microtubule-associated protein 1 light chain 3 beta
- MTOR
mechanistic target of rapamycin
- PSMA2
proteasome (prosome, macropain) subunit, alpha type, 2
- SQSTM1/p62
sequestosome 1
- TGFB
transforming growth factor, beta 1
- TRIM63/MURF1
tripartite motif containing 63, E3 ubiquitin protein ligase
- ULK2
unc-51 like autophagy activating kinase 2
References
- 1.Tandon P, Ney M, Irwin I, Ma MM, Gramlich L, Bain VG, Esfandiari N, Baracos V, Montano-Loza AJ, Myers RP. Severe muscle depletion in patients on the liver transplant wait list: its prevalence and independent prognostic value. Liver Transpl. 2012;18:1209–16. doi: 10.1002/lt.23495. [DOI] [PubMed] [Google Scholar]
- 2.Huisman EJ, Trip EJ, Siersema PD, van Hoek B, van Erpecum KJ. Protein energy malnutrition predicts complications in liver cirrhosis. Eur J Gastroenterol Hepatol. 2011;23:982–9. doi: 10.1097/MEG.0b013e32834aa4bb. [DOI] [PubMed] [Google Scholar]
- 3.Montano-Loza AJ, Meza-Junco J, Prado CM, Lieffers JR, Baracos VE, Bain VG, Sawyer MB. Muscle wasting is associated with mortality in patients with cirrhosis. Clin Gastroenterol Hepatol. 2012;10:166–73, e1. doi: 10.1016/j.cgh.2011.08.028. [DOI] [PubMed] [Google Scholar]
- 4.Mendenhall CL, Anderson S, Weesner RE, Goldberg SJ, Crolic KA, Veterans Administration Cooperative Study Group on Alcoholic Hepatitis Protein-calorie malnutrition associated with alcoholic hepatitis. Am J Med. 1984;76:211–22. doi: 10.1016/0002-9343(84)90776-9. [DOI] [PubMed] [Google Scholar]
- 5.Italian Multicentre Cooperative Project on Nutrition in Liver Cirrhosis Nutritional status in cirrhosis. J Hepatol. 1994;21:317–25. doi: 10.1016/S0168-8278(05)80308-3. [DOI] [PubMed] [Google Scholar]
- 6.Caly WR, Strauss E, Carrilho FJ, Laudanna AA. Different degrees of malnutrition and immunological alterations according to the aetiology of cirrhosis: a prospective and sequential study. Nutr J. 2003;2:10. doi: 10.1186/1475-2891-2-10. [DOI] [PMC free article] [PubMed] [Google Scholar]
- 7.Antar R, Wong P, Ghali P. A meta-analysis of nutritional supplementation for management of hospitalized alcoholic hepatitis. Can J Gastroenterol. 2012;26:463–7. doi: 10.1155/2012/945707. [DOI] [PMC free article] [PubMed] [Google Scholar]
- 8.Marway JS, Preedy VR, Peters TJ. Experimental alcoholic skeletal muscle myopathy is characterised by a rapid and sustained decrease in muscle RNA content. Alcohol Alcohol. 1990;25:401–6. [PubMed] [Google Scholar]
- 9.Preedy VR, Keating JW, Peters TJ. The acute effects of ethanol and acetaldehyde on rates of protein synthesis in type I and type II fibre-rich skeletal muscles of the rat. Alcohol Alcohol. 1992;27:241–51. [PubMed] [Google Scholar]
- 10.Preedy VR, Macallan DC, Griffin GE, Cook EB, Palmer TN, Peters TJ. Total contractile protein contents and gene expression in skeletal muscle in response to chronic ethanol consumption in the rat. Alcohol. 1997;14:545–9. doi: 10.1016/S0741-8329(97)00045-1. [DOI] [PubMed] [Google Scholar]
- 11.Lang CH, Frost RA, Svanberg E, Vary TC. IGF-I/IGFBP-3 ameliorates alterations in protein synthesis, eIF4E availability, and myostatin in alcohol-fed rats. Am J Physiol Endocrinol Metab. 2004;286:E916–26. doi: 10.1152/ajpendo.00554.2003. [DOI] [PubMed] [Google Scholar]
- 12.Martin FC, Peters TJ. Assessment in vitro and in vivo of muscle degradation in chronic skeletal muscle myopathy of alcoholism. Clin Sci (Lond) 1985;68:693–700. doi: 10.1042/cs0680693. [DOI] [PubMed] [Google Scholar]
- 13.Milakofsky L, Miller JM, Vogel WH. Effects of acute ethanol administration on rat plasma amino acids and related compounds. Biochem Pharmacol. 1986;35:3885–8. doi: 10.1016/0006-2952(86)90680-5. [DOI] [PubMed] [Google Scholar]
- 14.Reinus JF, Heymsfield SB, Wiskind R, Casper K, Galambos JT. Ethanol: relative fuel value and metabolic effects in vivo. Metabolism. 1989;38:125–35. doi: 10.1016/0026-0495(89)90251-5. [DOI] [PubMed] [Google Scholar]
- 15.Lang CH, Wu D, Frost RA, Jefferson LS, Kimball SR, Vary TC. Inhibition of muscle protein synthesis by alcohol is associated with modulation of eIF2B and eIF4E. Am J Physiol. 1999;277:E268–76. doi: 10.1152/ajpendo.1999.277.2.E268. [DOI] [PubMed] [Google Scholar]
- 16.Preedy VR, Peters TJ. The effect of chronic ethanol ingestion on protein metabolism in type-I- and type-II-fibre-rich skeletal muscles of the rat. Biochem J. 1988;254:631–9. doi: 10.1042/bj2540631. [DOI] [PMC free article] [PubMed] [Google Scholar]
- 17.Vary TC, Frost RA, Lang CH. Acute alcohol intoxication increases atrogin-1 and MuRF1 mRNA without increasing proteolysis in skeletal muscle. Am J Physiol Regul Integr Comp Physiol. 2008;294:R1777–89. doi: 10.1152/ajpregu.00056.2008. [DOI] [PMC free article] [PubMed] [Google Scholar]
- 18.Hong-Brown LQ, Frost RA, Lang CH. Alcohol impairs protein synthesis and degradation in cultured skeletal muscle cells. Alcohol Clin Exp Res. 2001;25:1373–82. doi: 10.1111/j.1530-0277.2001.tb02361.x. [DOI] [PubMed] [Google Scholar]
- 19.Preedy VR, Venkatesan S, Peters TJ, Nott DM, Yates J, Jenkins SA. Effect of chronic ethanol ingestion on tissue RNA and blood flow in skeletal muscle with comparative reference to bone and tissues of the gastrointestinal tract of the rat. Clin Sci (Lond) 1989;76:243–7. doi: 10.1042/cs0760243. [DOI] [PubMed] [Google Scholar]
- 20.Lecker SH, Jagoe RT, Gilbert A, Gomes M, Baracos V, Bailey J, Price SR, Mitch WE, Goldberg AL. Multiple types of skeletal muscle atrophy involve a common program of changes in gene expression. FASEB J. 2004;18:39–51. doi: 10.1096/fj.03-0610com. [DOI] [PubMed] [Google Scholar]
- 21.Bousquet-Dubouch MP, Nguen S, Bouyssié D, Burlet-Schiltz O, French SW, Monsarrat B, Bardag-Gorce F. Chronic ethanol feeding affects proteasome-interacting proteins. Proteomics. 2009;9:3609–22. doi: 10.1002/pmic.200800959. [DOI] [PMC free article] [PubMed] [Google Scholar]
- 22.Madaro L, Marrocco V, Carnio S, Sandri M, Bouché M. Intracellular signaling in ER stress-induced autophagy in skeletal muscle cells. FASEB J. 2013;27:1990–2000. doi: 10.1096/fj.12-215475. [DOI] [PubMed] [Google Scholar]
- 23.Ogata M, Hino S, Saito A, Morikawa K, Kondo S, Kanemoto S, Murakami T, Taniguchi M, Tanii I, Yoshinaga K, et al. Autophagy is activated for cell survival after endoplasmic reticulum stress. Mol Cell Biol. 2006;26:9220–31. doi: 10.1128/MCB.01453-06. [DOI] [PMC free article] [PubMed] [Google Scholar]
- 24.Mansouri A, Demeilliers C, Amsellem S, Pessayre D, Fromenty B. Acute ethanol administration oxidatively damages and depletes mitochondrial dna in mouse liver, brain, heart, and skeletal muscles: protective effects of antioxidants. J Pharmacol Exp Ther. 2001;298:737–43. [PubMed] [Google Scholar]
- 25.Li SY, Ren J. Cardiac overexpression of alcohol dehydrogenase exacerbates chronic ethanol ingestion-induced myocardial dysfunction and hypertrophy: role of insulin signaling and ER stress. J Mol Cell Cardiol. 2008;44:992–1001. doi: 10.1016/j.yjmcc.2008.02.276. [DOI] [PMC free article] [PubMed] [Google Scholar] [Retracted]
- 26.Hansen TE, Johansen T. Following autophagy step by step. BMC Biol. 2011;9:39. doi: 10.1186/1741-7007-9-39. [DOI] [PMC free article] [PubMed] [Google Scholar]
- 27.Ding WX, Ni HM, Gao W, Yoshimori T, Stolz DB, Ron D, Yin XM. Linking of autophagy to ubiquitin-proteasome system is important for the regulation of endoplasmic reticulum stress and cell viability. Am J Pathol. 2007;171:513–24. doi: 10.2353/ajpath.2007.070188. [DOI] [PMC free article] [PubMed] [Google Scholar]
- 28.Thomes PG, Trambly CS, Thiele GM, Duryee MJ, Fox HS, Haorah J, Donohue TM., Jr. Proteasome activity and autophagosome content in liver are reciprocally regulated by ethanol treatment. Biochem Biophys Res Commun. 2012;417:262–7. doi: 10.1016/j.bbrc.2011.11.097. [DOI] [PubMed] [Google Scholar]
- 29.Hong-Brown LQ, Brown CR, Kazi AA, Huber DS, Pruznak AM, Lang CH. Alcohol and PRAS40 knockdown decrease mTOR activity and protein synthesis via AMPK signaling and changes in mTORC1 interaction. J Cell Biochem. 2010;109:1172–84. doi: 10.1002/jcb.22496. [DOI] [PMC free article] [PubMed] [Google Scholar]
- 30.Santolaria F, Pérez-Manzano JL, Milena A, González-Reimers E, Gómez-Rodríguez MA, Martínez-Riera A, Alemán-Valls MR, de la Vega-Prieto MJ. Nutritional assessment in alcoholic patients. Its relationship with alcoholic intake, feeding habits, organic complications and social problems. Drug Alcohol Depend. 2000;59:295–304. doi: 10.1016/S0376-8716(99)00129-5. [DOI] [PubMed] [Google Scholar]
- 31.McClain CJ, Barve SS, Barve A, Marsano L. Alcoholic liver disease and malnutrition. Alcohol Clin Exp Res. 2011;35:815–20. doi: 10.1111/j.1530-0277.2010.01405.x. [DOI] [PMC free article] [PubMed] [Google Scholar]
- 32.Salisbury JR, Preedy VR, Rose PE, Deverell MH, Peters TJ. Ethanol-induced chronic myopathy in the young rat: a light and electron microscopic study in type I or type II fibre-rich skeletal muscles. Alcohol Alcohol. 1992;27:493–500. [PubMed] [Google Scholar]
- 33.Hanid A, Slavin G, Mair W, Sowter C, Ward P, Webb J, Levi J. Fibre type changes in striated muscle of alcoholics. J Clin Pathol. 1981;34:991–5. doi: 10.1136/jcp.34.9.991. [DOI] [PMC free article] [PubMed] [Google Scholar]
- 34.Qiu J, Tsien C, Thapalaya S, Narayanan A, Weihl CC, Ching JK, Eghtesad B, Singh K, Fu X, Dubyak G, et al. Hyperammonemia-mediated autophagy in skeletal muscle contributes to sarcopenia of cirrhosis. Am J Physiol Endocrinol Metab. 2012;303:E983–93. doi: 10.1152/ajpendo.00183.2012. [DOI] [PMC free article] [PubMed] [Google Scholar]
- 35.Bailey SM, Pietsch EC, Cunningham CC. Ethanol stimulates the production of reactive oxygen species at mitochondrial complexes I and III. Free Radic Biol Med. 1999;27:891–900. doi: 10.1016/S0891-5849(99)00138-0. [DOI] [PubMed] [Google Scholar]
- 36.Peth A, Uchiki T, Goldberg AL. ATP-dependent steps in the binding of ubiquitin conjugates to the 26S proteasome that commit to degradation. Mol Cell. 2010;40:671–81. doi: 10.1016/j.molcel.2010.11.002. [DOI] [PMC free article] [PubMed] [Google Scholar]
- 37.Bardag-Gorce F, French BA, Nan L, Song H, Nguyen SK, Yong H, Dede J, French SW. CYP2E1 induced by ethanol causes oxidative stress, proteasome inhibition and cytokeratin aggresome (Mallory body-like) formation. Exp Mol Pathol. 2006;81:191–201. doi: 10.1016/j.yexmp.2006.07.007. [DOI] [PubMed] [Google Scholar]
- 38.Bonner AB, Swann ME, Marway JS, Heap LC, Preedy VR. Lysosomal and nonlysosomal protease activities of the brain in response to ethanol feeding. Alcohol. 1995;12:505–9. doi: 10.1016/0741-8329(95)00035-6. [DOI] [PubMed] [Google Scholar]
- 39.Hong-Brown LQ, Brown CR, Huber DS, Lang CH. Alcohol and indinavir adversely affect protein synthesis and phosphorylation of MAPK and mTOR signaling pathways in C2C12 myocytes. Alcohol Clin Exp Res. 2006;30:1297–307. doi: 10.1111/j.1530-0277.2006.00157.x. [DOI] [PubMed] [Google Scholar]
- 40.Pikkarainen PH, Gordon ER, Lebsack ME, Lieber CS. Determinants of plasma free acetaldehyde levels during the oxidation of ethanol: effects of chronic ethanol feeding. Biochem Pharmacol. 1981;30:799–802. doi: 10.1016/0006-2952(81)90168-4. [DOI] [PubMed] [Google Scholar]
- 41.Di Padova C, Worner TM, Lieber CS. Effect of abstinence on the blood acetaldehyde response to a test dose of alcohol in alcoholics. Alcohol Clin Exp Res. 1987;11:559–61. doi: 10.1111/j.1530-0277.1987.tb00174.x. [DOI] [PubMed] [Google Scholar]
- 42.Grafström RC, Dypbukt JM, Sundqvist K, Atzori L, Nielsen I, Curren RD, Harris CC. Pathobiological effects of acetaldehyde in cultured human epithelial cells and fibroblasts. Carcinogenesis. 1994;15:985–90. doi: 10.1093/carcin/15.5.985. [DOI] [PubMed] [Google Scholar]
- 43.Holownia A, Ledig M, Braszko JJ, Ménez JF. Acetaldehyde cytotoxicity in cultured rat astrocytes. Brain Res. 1999;833:202–8. doi: 10.1016/S0006-8993(99)01529-2. [DOI] [PubMed] [Google Scholar]
- 44.Niemelä O, Parkkila S, Koll M, Preedy VR. Generation of protein adducts with malondialdehyde and acetaldehyde in muscles with predominantly type I or type II fibers in rats exposed to ethanol and the acetaldehyde dehydrogenase inhibitor cyanamide. Am J Clin Nutr. 2002;76:668–74. doi: 10.1093/ajcn/76.3.668. [DOI] [PubMed] [Google Scholar]
- 45.Koll M, Ahmed S, Mantle D, Donohue TM, Palmer TN, Simanowski UA, Seltz HK, Peters TJ, Preedy VR. Effect of acute and chronic alcohol treatment and their superimposition on lysosomal, cytoplasmic, and proteosomal protease activities in rat skeletal muscle in vivo. Metabolism. 2002;51:97–104. doi: 10.1053/meta.2002.28967. [DOI] [PubMed] [Google Scholar]
- 46.Bialek P, Morris C, Parkington J, St Andre M, Owens J, Yaworsky P, Seeherman H, Jelinsky SA. Distinct protein degradation profiles are induced by different disuse models of skeletal muscle atrophy. Physiol Genomics. 2011;43:1075–86. doi: 10.1152/physiolgenomics.00247.2010. [DOI] [PMC free article] [PubMed] [Google Scholar]
- 47.Masiero E, Sandri M. Autophagy inhibition induces atrophy and myopathy in adult skeletal muscles. Autophagy. 2010;6:307–9. doi: 10.4161/auto.6.2.11137. [DOI] [PubMed] [Google Scholar]
- 48.Roongpisuthipong C, Sobhonslidsuk A, Nantiruj K, Songchitsomboon S. Nutritional assessment in various stages of liver cirrhosis. Nutrition. 2001;17:761–5. doi: 10.1016/S0899-9007(01)00626-8. [DOI] [PubMed] [Google Scholar]
- 49.Tsien C, Shah SN, McCullough AJ, Dasarathy S. Reversal of sarcopenia predicts survival after a transjugular intrahepatic portosystemic stent. Eur J Gastroenterol Hepatol. 2013;25:85–93. doi: 10.1097/MEG.0b013e328359a759. [DOI] [PubMed] [Google Scholar]
- 50.Pritchard MT, McMullen MR, Stavitsky AB, Cohen JI, Lin F, Medof ME, Nagy LE. Differential contributions of C3, C5, and decay-accelerating factor to ethanol-induced fatty liver in mice. Gastroenterology. 2007;132:1117–26. doi: 10.1053/j.gastro.2007.01.053. [DOI] [PMC free article] [PubMed] [Google Scholar]
- 51.Cohen JI, Roychowdhury S, McMullen MR, Stavitsky AB, Nagy LE. Complement and alcoholic liver disease: role of C1q in the pathogenesis of ethanol-induced liver injury in mice. Gastroenterology. 2010;139:664–74, e1. doi: 10.1053/j.gastro.2010.04.041. [DOI] [PMC free article] [PubMed] [Google Scholar]
- 52.Holmuhamedov EL, Czerny C, Beeson CC, Lemasters JJ. Ethanol suppresses ureagenesis in rat hepatocytes: role of acetaldehyde. J Biol Chem. 2012;287:7692–700. doi: 10.1074/jbc.M111.293399. [DOI] [PMC free article] [PubMed] [Google Scholar]
- 53.Dasarathy S, Dodig M, Muc SM, Kalhan SC, McCullough AJ. Skeletal muscle atrophy is associated with an increased expression of myostatin and impaired satellite cell function in the portacaval anastamosis rat. Am J Physiol Gastrointest Liver Physiol. 2004;287:G1124–30. doi: 10.1152/ajpgi.00202.2004. [DOI] [PubMed] [Google Scholar]
- 54.Homer CR, Richmond AL, Rebert NA, Achkar JP, McDonald C. ATG16L1 and NOD2 interact in an autophagy-dependent antibacterial pathway implicated in Crohn’s disease pathogenesis. Gastroenterology. 2010;139:1630–41, e1-2. doi: 10.1053/j.gastro.2010.07.006. [DOI] [PMC free article] [PubMed] [Google Scholar]
- 55.Roberts EA, Deretic V. Autophagic proteolysis of long-lived proteins in nonliver cells. Methods Mol Biol. 2008;445:111–7. doi: 10.1007/978-1-59745-157-4_6. [DOI] [PubMed] [Google Scholar]
Associated Data
This section collects any data citations, data availability statements, or supplementary materials included in this article.


