Abstract
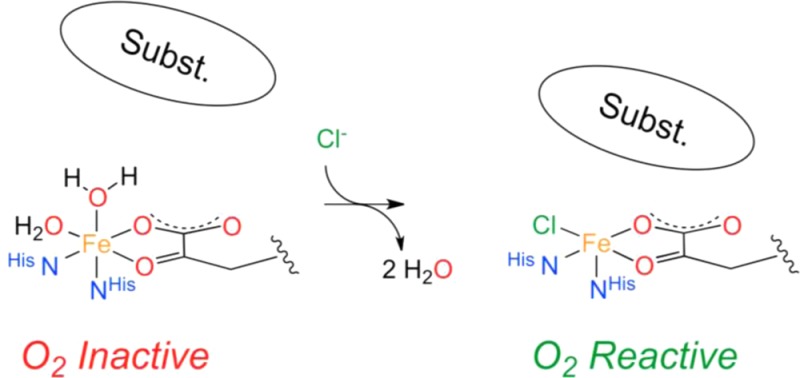
Mononuclear nonheme Fe(II) (MNH) and α-ketoglutarate (α-KG) dependent halogenases activate O2 to perform oxidative halogenations of activated and nonactivated carbon centers. While the mechanism of halide incorporation into a substrate has been investigated, the mechanism by which halogenases prevent oxidations in the absence of chloride is still obscure. Here, we characterize the impact of chloride on the metal center coordination and reactivity of the fatty acyl-halogenase HctB. Stopped-flow kinetic studies show that the oxidative transformation of the Fe(II)-α-KG-enzyme complex is >200-fold accelerated by saturating concentrations of chloride in both the absence and presence of a covalently bound substrate. By contrast, the presence of substrate, which generally brings about O2 activation at enzymatic MNH centers, only has an ∼10-fold effect in the absence of chloride. Circular dichroism (CD) and magnetic CD (MCD) studies demonstrate that chloride binding triggers changes in the metal center ligation: chloride binding induces the proper binding of the substrate as shown by variable-temperature, variable-field (VTVH) MCD studies of non-α-KG-containing forms and the conversion from six-coordinate (6C) to 5C/6C mixtures when α-KG is bound. In the presence of substrate, a site with square pyramidal five-coordinate (5C) geometry is observed, which is required for O2 activation at enzymatic MNH centers. In the absence of substrate an unusual trigonal bipyramidal site is formed, which accounts for the observed slow, uncoupled reactivity. Molecular dynamics simulations suggest that the binding of chloride to the metal center of HctB leads to a conformational change in the enzyme that makes the active site more accessible to the substrate and thus facilitates the formation of the catalytically competent enzyme–substrate complex. Results are discussed in relation to other MNH dependent halogenases.
Introduction
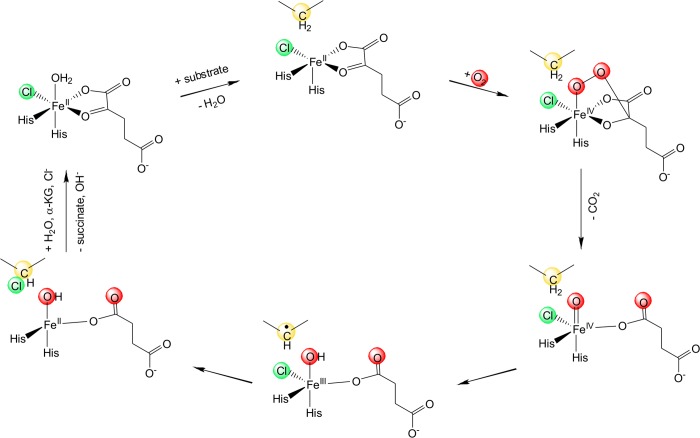
In nature, the selective halogenation of nonactivated carbon atoms is performed by mononuclear nonheme Fe(II) (MNH), O2, and α-ketoglutaric acid (α-KG) dependent halogenases. The structural rationale of this chemically challenging reaction has been elucidated rather recently,1−3 and to date only a handful of MNH halogenases have been biochemically characterized.4−11 The molecular mechanism of these halogenases follows, in principle, that of the closely related α-KG dependent hydroxylases. The α-KG-dependent hydroxylases have a reactive Fe(II) center coordinated by a 2-His 1-carboxylate motif and three water ligands. Upon coordination of the α-KG cofactor, two water molecules are replaced but the six-coordinate (6C) geometry of the Fe(II) center is retained. Only after substrate binding in the outer coordination sphere is the remaining water ligand displaced from the Fe(II) center and the resulting five-coordinate (5C) species is activated for reaction with O2.12 The α-KG cofactor is decarboxylated by the activated dioxygen species, which leads to the formation of a high-spin Fe(IV)=O intermediate that abstracts a hydrogen atom from the substrate.13,14 While in MNH dependent hydroxylases the reaction proceeds via transfer of the hydroxyl group from the Fe(III)–OH intermediate onto the substrate radical, in halogenases an iron-coordinated chloride replaces the carboxylate ligand and successfully competes with the hydroxyl moiety to yield the halogenated product (Scheme 1).
Scheme 1. Proposed Molecular Mechanism of Fe(II) and α-KG Dependent Halogenation13,14 .
In the presence of α-KG and substrate, O2 binds to the five-coordinate Fe(II) center and decarboxylates the α-KG cofactor. This yields a highly reactive Fe(IV)=O intermediate that abstracts a proton from the substrate. Chloride rather than the hydroxyl moiety is rebound by the substrate radical, resulting in a chlorinated reaction product.
Several reasons have been invoked for the strong preference of halogenation over hydroxylation that has generally been observed in halogenases:4−6,10 (i) the lower redox potential of Cl• compared to OH•;15 (ii) possible bicarbonate formation between the metal bound hydroxyl group and the α-KG derived CO2 which prevents the transfer of the hydroxyl moiety;16 (iii) possible protonation of the hydroxyl group by a nearby Glu-Arg proton donor that results in the formation of water, which makes hydroxylation unfavorable;17 (iv) the difference in binding strengths of the chloride and hydroxyl group to the metal ion and the resulting energetic barrier for hydroxylation;18 or (v) the positioning of the substrate radical relative to the Cl–Fe(III)–OH center.19,20 Recently, it has been shown that the O2 reactivity of the α-KG-bound halogenase SyrB2 results in a 5C trigonal bipyramidal Fe(IV)=O intermediate with the Fe–O vector perpendicular to the C–H bond of the substrate. H-atom abstraction by an Fe(IV)=O π* molecular orbital leads to an intermediate where the Fe(III)–OH moiety is oriented away from the substrate carbon radical and the halide is primed for rebound halogenation.21
While substantial efforts have been made to investigate the second half of the halogenases’ reaction in order to rationalize the preference of substrate chlorination over hydroxylation after proton abstraction, there has not been much focus on the first half of the catalytic cycle. Chloride-bound crystal structures of the substrate-free MNH halogenases SyrB2,1 and CurA-Hal3 show that the halide can coordinate to the iron even before the substrate binds. On the other hand, in CytC3 no halide is present in the crystal structure with Fe(II) and α-KG bound, despite the rather high chloride concentrations in the mother liquor (80 mM).2 This suggests that halides are not necessarily bound a priori. To date no study has elucidated how the halogenases prevent alternative oxidation reactions in the absence of halide.
Recently, a fatty acyl-halogenase, HctB from L. majuscula, has been characterized in our laboratory.11 The enzyme that modifies middle-chain fatty acyl moieties displays an unprecedented three domain organization, which sets it apart from the monodomain amino acyl-halogenases and the multidomain ketide halogenases: An acyl-Coenzyme A (acyl-CoA) binding protein is N-terminally fused to a halogenase domain, while its C-terminus connects to an acyl-carrier protein (ACP) domain. The ACP domain bears an inherent thiolation site, where the substrate covalently binds via a phosphopantetheinyl bridge. This composition makes HctB self-sufficient in regard to a substrate binding entity and may be prototypical for fatty acyl-halogenases. The trifunctional enzyme introduces 5-oxo-, 5,5-dichloro-, and 5-chloro-4-vinyl moieties into the hexanoyl substrate under chloride saturating conditions. In the course of the enzyme’s biochemical characterization we observed that O2 reduction was triggered by the presence of not only the substrate but also chloride under single turnover conditions.11
Based on these observations, a suspected role of chloride in primary O2 activation in HctB is investigated in this study: Circular dichroism (CD), magnetic CD (MCD), and variable-temperature, variable-field (VTVH) MCD spectroscopies directly observe the geometric and electronic structure of the enzymatic Fe(II) active site. In combination with stopped-flow kinetics the spectroscopic data reveal that the metal center is constituted in the absence of a halide ion but remains inert toward O2 and that the presence of chloride is essential for triggering O2 reduction at the metal center. Molecular dynamics (MD) simulations of the HctB halogenase domain are employed to gain insights into the role of the protein structure in chloride-dependent O2 activation.
Experimental Section
Protein Production and Purification
Recombinant nonacylated HctB was expressed, purified, and acylated with the fatty acyl-CoA substrate as described previously11 except the final enzyme solution was exchanged into 20 mM Bis-Tris buffer (pH 7.5) for stopped-flow analysis.
Stopped-Flow UV/Vis Spectrophotometric Analysis
The enzyme was made O2-free by ∼20 cycles of evacuation and N2-flushing in an airtight V-Vial (Wheaton, Millville/USA) capped with a screw-top septum (Supelco, Bellefonte/USA), and subsequently 0.95 equiv of Fe(II)SO4·7H2O and α-KG (Sigma-Aldrich, St. Louis/USA) were added from stock solutions (10 mM) in a N2-purged glovebox. The enzyme preparations (440–550 μM active sites) were mixed at 10 °C with equal volumes of 20 mM Bis-Tris buffer, pH 7.5 that contained ∼1.4 mM O2 if not stated otherwise and either 0.1 or 1 M NaCl if required, using an SX20 Stopped-Flow UV/vis spectrophotometer (Applied Photophysics, Leatherhead/UK), which was equipped with a polychromatic light source. Note that in a previous study the addition of 1 equiv of α-KG to acylated HctB (100 μM) yielded maximum initial O2 consumption rates and thus, in the enzyme kinetic measurements performed here, which used ∼95% cofactor-loaded active sites (>100 μM), saturating conditions were ensured.11 Spectroscopic analyses were carried out by using an SX20 photodiode array detector, whereby absorptions from 270 to 730 nm were recorded with 400 collected data points in the first 0.4 s and 1 datum point per 100 ms in the remaining 40 or 60 s. Absorbance traces of ≥4 measurements per condition were averaged and fit using the following methods: When rates of signal changes were so slow that they had linear characteristics over the monitored time, rates were determined based on the extinction coefficient of the α-KG-Fe(II)-HctB complex (ε500nm = 0.15 mM–1 cm–1).11 Rates were then related to the applied metal concentration to give specific rates. In the case of apparently bi- or triphasic curves, the Pro-Kineticist 1.0.10 software (Applied Photophysics) was used and the trace at the respective constant wavelength was fit to sequential models in the form of A → B → C and A → B → C → D respectively, in order to obtain the respective apparent 1st order net rate constants.
CD/MCD Spectroscopy
If not stated otherwise, for CD/MCD spectroscopy, protein samples were exchanged into deuterated 50 mM HEPES/NaOD buffer pD 7.5, containing 1 M NaCl if required, using 4 mL Amicon Ultra Centrifugal Filters and concentrated to 1.5–3.5 mM. O2 was removed from the samples by ∼20 cycles of evacuation and argon flushing. Ferrous ammonium sulfate and α-KG were added to the enzyme preparations in microliter quantities from deuterated, anaerobic stock solutions in a N2-purged glovebox, where the final sample was filled into a CD or MCD cell. CD measurements were carried out on a Jasco J-730W spectropolarimeter at 283 K. Spectra were corrected by subtracting the respective cofactor-free spectrum. MCD samples were prepared from CD samples by adding glassing agent to saturation at approximately 50% sucrose. Samples were injected into MCD cells, frozen, and stored in liquid N2 until use. MCD spectra were recorded on a Jasco J-730W spectropolarimeter equipped with an Oxford Instruments Spectromag 4000 superconducting magnet and a liquid N2-cooled InSb detector. To affirm the authenticity of the MCD signals, field dependencies at −7, +3.5, and +7 T were recorded at 5 K. The C-term origin of the signals was confirmed by tracking temperature dependencies at 5, 20, and 40 K at +7 T (3 scans per condition were averaged).12 The data obtained were corrected by subtraction of the zero-field spectrum at the respective temperature. MCD spectra were compared to their respective CD counterparts in order to verify that transitions had the same energies in CD and MCD and with and without glassing agent.
MD Simulations
A structural model of the HctB halogenase domain was created by homology modeling as described previously.11 MD simulations were performed with the YASARA Structure suite, version 12.11.20 (YASARA Biosciences).22 A periodic simulation cell, which comprised the whole enzyme and an additional 5 Å in each dimension, was used with explicit solvent. The AMBER99 force field23 was employed and long-range electrostatic potentials were calculated with the Particle Mesh Ewald (PME) method, with a cutoff of 7.864 Å.24,25 Force field parameters for α-KG were generated with the AutoSMILES utility,26 which assigned a van der Waals radius of 2.27 Å and a charge of +2 to the iron cofactor. Fe(II) parameters were defined to reflect the principal octahedral geometry of the Fe(II) center. An equilibrium spring length that was derived from DFT calculations was used for all ligands27 with a stretching force constant of 125 N m–1. Ligand–Fe–ligand angles of minimum energy were defined as 180° for opposite ligands and as 90° for all others, with angle bending force constants of 1000 kJ mol–1 rad.2 In this way, force field parameters for N-ε of His112, N-ε of His228, and α-KG coordinating carboxylate and keto-oxygen were defined for the chloride-free HctB model. For the chloride-containing complex, analogous parameters were included for the iron coordinated chloride ion. Note that no force field parameters were defined for Glu224. In order to investigate the impact of a putative strongly bound water at the halide position, in a second model the chloride atom was substituted by a water molecule and the respective parameters were adapted accordingly. In a third halide-free model a strongly bound water was positioned in the sixth coordination site of the iron, while the water in the halide binding position remained unrestricted. The oxidation state of the iron cofactor in all complexes was either +2, as assigned by AUTOSMILES, or–in order to assess the impact of the effective iron charge on the simulation–adjusted to values in the 0 to +2 range (see Table S2). The hydrogen bonding network was optimized by the method of Hooft and co-workers,28 and YASARA’s pKa values at pH 7.5 were assigned.29 The simulation cell was filled with water at a density of 0.997 g mL–1 using NaCl concentrations of 0.001 and 1 M, respectively. After relaxation of the solvent the system was energy minimized, whereby a steepest descent minimization was applied to remove conformational stress, followed by a simulated annealing minimization until convergence was reached (<0.05 kJ mol–1 per 200 steps). Integration time steps were set to 1.33 and 4 fs for intra- and intermolecular forces, respectively. MD simulations at 298 K were initiated, whereby integration time steps for intramolecular and intermolecular forces were set to 1.25 and 2.5 fs, respectively.
Results
Stopped-Flow Analysis
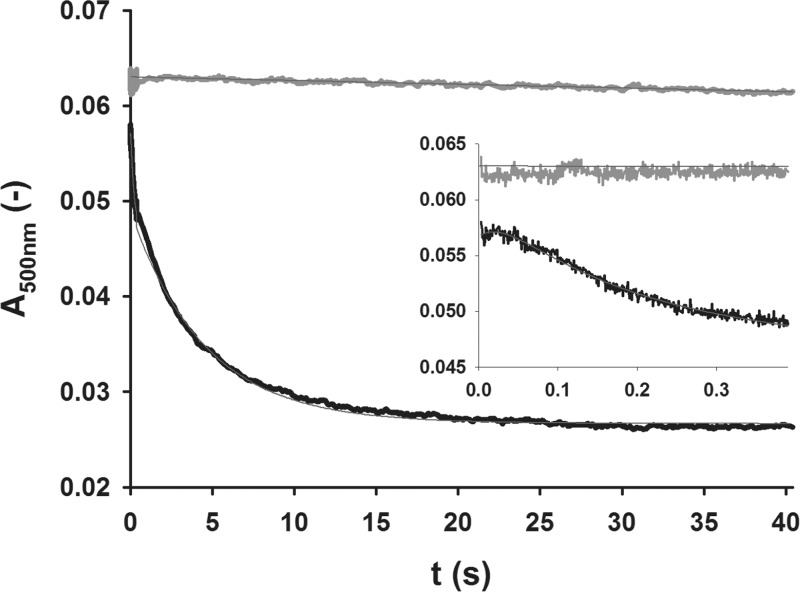
The oxidation of the Fe(II)-α-KG complex was monitored spectrophotometrically via single turnover stopped-flow measurements by recording the decay of its prototypical metal to ligand charge transfer (MLCT) transition (ε500nm = 150 M–1 cm–1).30 Therefore, anaerobic enzyme preparations of acylated HctB (Ac-HctB), preloaded with ∼0.95 mol equiv Fe(II) and α-KG, were mixed with O2-enriched (650–1400 μM) and, optionally, 1 M NaCl-containing buffer at a 1:1 ratio. In the absence of NaCl the α-KG-Fe(II)-Ac-HctB complex decayed slowly with a specific rate of 1.1 × 10⁻³ s–1 (cO2 = 700 μM). By contrast, under analogous conditions but in the presence of chloride, the absorbance band disappeared within ∼20 s. The trace displayed three distinct phases that could be resolved: A lag phase of ∼60 ms (kSC1 = 35.1 s–1) was followed by a phase of fast signal decay, which gave an apparent first-order rate constant kSC2 of 6.74 s–1 and accounted for approximately one-third of the total amplitude. The third phase of the reaction, a slower absorbance decrease (kSC3 = 0.22 s–1), equaled the O2 depletion rate (∼0.22 s–1) that had previously been determined using an O2 sensor under similar conditions (Figure 1). (Note that kSC1, kSC2, and kSC3 represent apparent first-order net rate constants.)
Figure 1.
Stopped-flow absorption kinetic traces of the α-KG-Fe(II)-Ac-HctB complex decay. The conversion of the chromophoric α-KG-Fe(II) pair was monitored in the absence (gray) and presence (black) of 0.5 M NaCl at 500 nm, and average traces were fit with a linear regression (green) and via a three-phasic model using the Pro-Kineticist software (Applied Photophysics, see Materials and Methods section for details), respectively. The inset shows the initial 400 ms phase of the reaction.
Rates were not significantly dependent on the O2 concentration (Table S1, Figure S1). The total amplitude of signal decay corresponded to 97% of the α-KG-Fe(II) concentration, confirming a quantitative conversion of the complex. It is worth noting that in previous studies it was observed that the Fe(IV)=O intermediate had a similar extinction coefficient at 520 nm as the Fe(II)-α-KG complex but additionally showed a significant absorbance increase at 318 nm (ε ≈ 1500 M–1 cm–1).13 An analogous signal increase was not detectable during substrate conversion by Ac-HctB. Instead, a slow signal increase at 320 nm in the absence (Figure S2b) and presence (Figure S2d) of chloride was obtained, which may indicate some Fe(II) oxidation as a side reaction.
When nonacylated HctB (further on termed HctB) was subjected to stopped-flow analysis, the chloride-free complex displayed an almost stable signal at 500 nm over the measured time range with a specific rate of 0.1 × 10⁻³ s–1 (Figure S2a). In the presence of chloride, α-KG-Fe(II)-HctB precipitated under both aerobic and anaerobic conditions. The velocity of precipitation was chloride dependent and led to an absorbance increase over the whole recorded wavelength range (Figures S2c, S3, and S4). This phenomenon, which was not observed during O2 sensor measurements, prohibited the determination of these reaction rates. Summarizing, according to stopped-flow measurements the decay of the α-KG-Fe(II)-Ac-HctB complex is accelerated ≥200-fold by chloride, while the presence of covalently bound substrate in the absence of chloride enhanced the rate only by an order of magnitude.
CD, MCD, and VTVH MCD Spectroscopy
In order to gain insight into the Fe(II) active site geometric and electronic structure, combined CD/MCD spectroscopic measurements of the enzymatic Fe(II) centers of HctB (i.e., no substrate) and Ac-HctB in the presence and absence of α-KG and saturating NaCl concentrations were pursued. The methodology developed in ref (31) allows for the determination of the Fe(II) center geometric structure, based on the energies of its associated d–d transitions: Free high spin Fe(II) possesses a 5D ground state, which upon the influence of an octahedral ligand field splits into a 5T2g ground state and a 5Eg excited state that are separated by 10 Dq ≈ 10 000 cm–1. The 5Eg state is further split in the distorted octahedral geometry of a protein environment, leading to two transitions split by ∼2000 cm–1. Removal of an axial ligand forms a square pyramidal five-coordinated species resulting in the splitting of the 5Eg state by ∼5000 cm–1, yielding transitions at ≥10 000 and ∼5000 cm–1. Rearrangement to a trigonal bipyramidal 5C geometry leads to transitions at <10 000 and <5000 cm–1 (the latter frequently undetectable).12 Thus, near-IR (NIR) CD and MCD spectra give information on the number of different Fe(II) coordination environments present in a sample as well as their geometric structures. VTVH MCD complements these excited state data by providing information on the ground state splitting of the t2g orbitals of a given site. A non-Kramers doublet model developed previously for the fitting of VTVH MCD data provides ground state spin Hamiltonian parameters δ and g|| for negative zero-field-split (ZFS) systems or axial D and rhombic |E| ZFS parameters for positive ZFS systems, which in turn are used to determine the tetragonal splitting, Δ, of the dxy orbital from the {dxz, dyz} pair, as well as the rhombic splitting, V, of the dxz and dyz orbitals.31 The relative energies of the five d orbitals of an Fe(II) active site can therefore be determined, and the site’s geometric and electronic structures characterized.
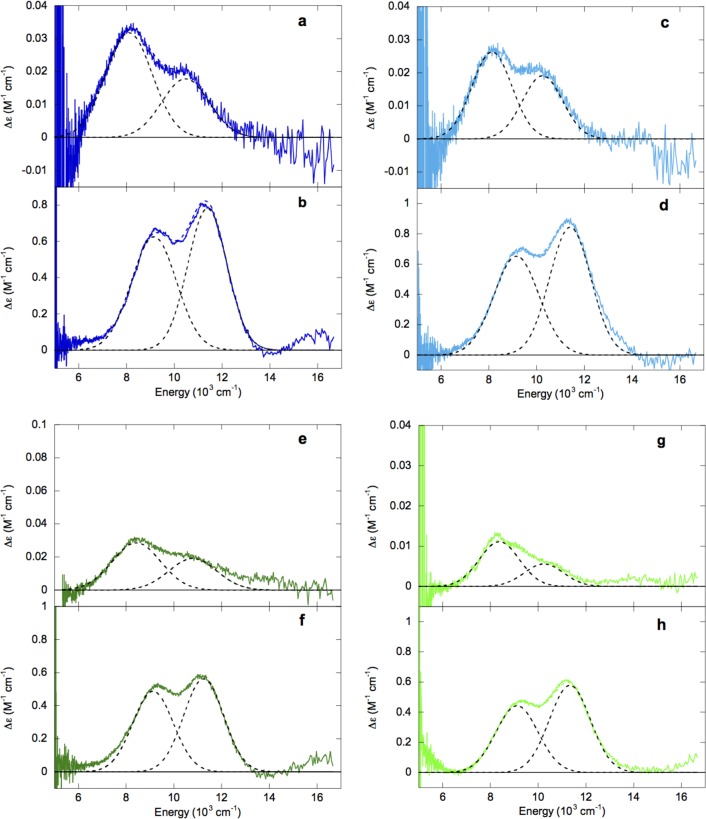
283 K CD and 5 K MCD spectra of Fe(II)-HctB and Fe(II)-Ac-HctB in the absence and presence of chloride are shown in Figure 2. In CD, these four enzyme forms all show two transitions at ∼8100 and ∼10400 cm–1 (Figure 2a, c, e, and g) indicative of distorted octahedral Fe(II) sites, whereas in MCD two transitions are observed at ∼9200 cm–1 and ∼11 400 cm–1 for the four forms (Figure 2b, d, f, and h). Such shifts upon going to low temperature have been observed for clavaminate synthase 2 (CS2)30 and factor inhibiting hypoxia-inducible factor (FIH)32 and are attributed to stronger ligand–metal bonds at lower temperature. The similarity of the spectra for all four forms indicates that no significant change in the eg orbitals of HctB-bound Fe(II) has occurred in the presence of chloride or substrate.
Figure 2.
283 K CD and 5 K MCD spectra of Fe(II)-HctB (a and b, respectively, dark blue), Fe(II)-Ac-HctB (c and d, respectively, light blue), Fe(II)/Cl–-HctB (e and f, respectively, dark green), and Fe(II)/Cl–-Ac-HctB (g and h, respectively, light green). Component peaks and resultant fits are in black and colored dashed lines, respectively.
However, VTVH MCD data as shown in Figure 3 indicate that the t2g orbitals are perturbed when chloride is bound to Fe(II). The VTVH MCD data of Fe(II)-HctB and Fe(II)-Ac-HctB in the absence of chloride (Figure 3a and b) can be fit with the same parameters of a positive ZFS system with D = +10.8 ± 0.1 cm–1 and |E| = 2.6 ± 0.1 cm–1, and corresponding t2g orbital splittings of Δ ≈ 500 ± 100 cm–1 and |V| ≈ 300 ± 50 cm–1. Upon addition of chloride, the VTVH MCD data change outside of error as shown in supporting Figure S5a and b. Fe(II)/Cl–-HctB (Figure 3c) fits to a positive ZFS with parameters of D = +10.2 ± 0.1 cm–1 and |E| = 2.6 ± 0.1 cm–1, and corresponding t2g orbital splittings of Δ ≈ 700 ± 100 cm–1 and |V| ≈ 450 ± 50 cm–1. The increased t2g orbital splittings are attributed to chloride being a stronger π donor ligand than the replaced water. In the presence of substrate and chloride (Figure 3d), the VTVH MCD data fit to give a positive ZFS with D = 3.7 ± 0.1 cm–1 and |E| = 2.4 ± 0.1 cm–1, and corresponding t2g orbital splittings of Δ ∼ 850 ± 100 cm–1 and |V| ∼ 540 ± 50 cm-1. The substrate therefore further perturbs the chloride bound Fe(II) site. That substrate binding only appears to perturb the Fe(II) site when chloride is also present is explored in the MD simulation section below.
Figure 3.
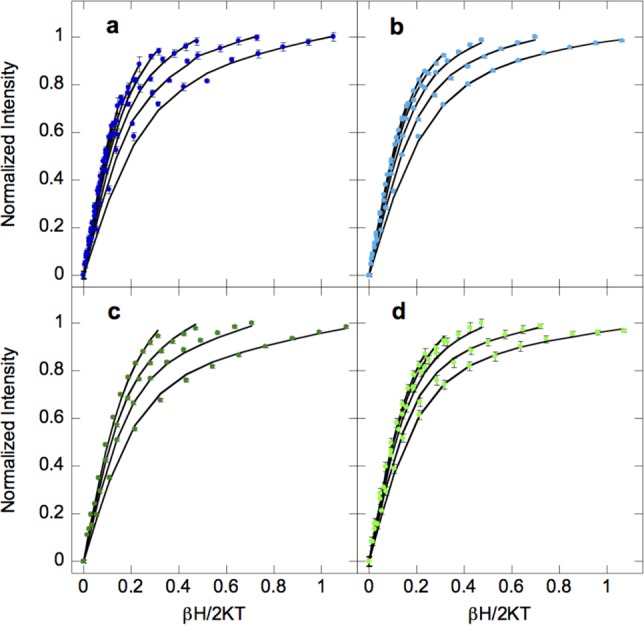
VTVH MCD data and fitted curves for Fe(II)-HctB (a, 2.2, 3.3, 5, 7.5, 10, 15, and 20 K, dark blue), Fe(II)-Ac-HctB (b, 2.2, 3.4, 5, 7.5, 10, and 15 K, light blue), Fe(II)/Cl–-HctB (c, 2.3, 3.3, 5, and 7.5 K, dark green), and Fe(II)/Cl–-Ac-HctB (d, 2.2, 3.4, 5, 7.5, and 10 K, light green). Error bars for the data are shown or otherwise are the size of the data points.
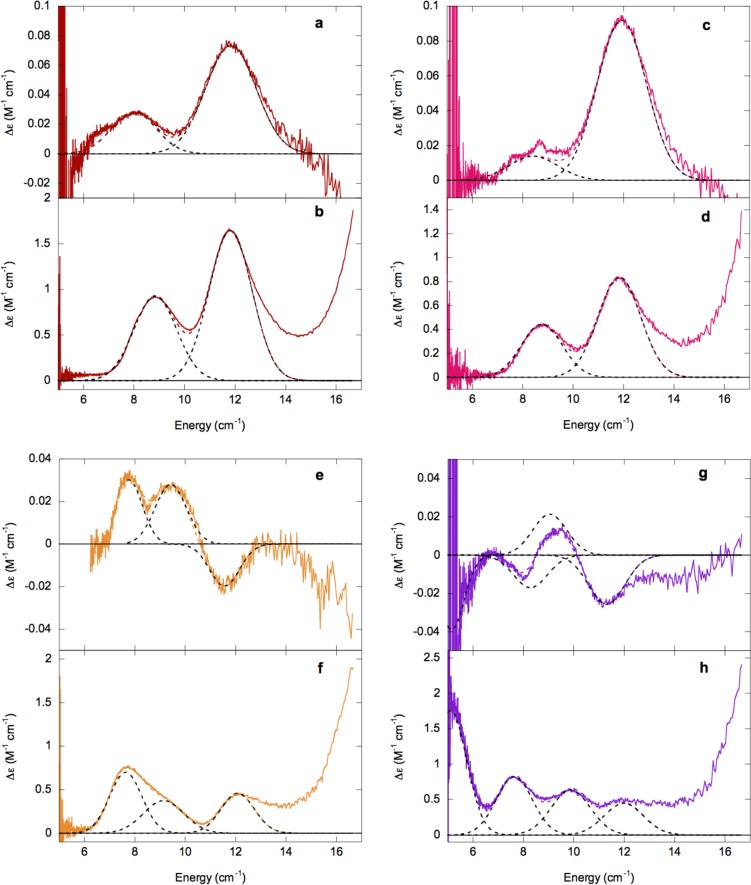
CD and MCD spectra of α-KG-Fe(II)-HctB and α-KG-Fe(II)-Ac-HctB in the absence and presence of chloride are given in Figure 4. In the presence of α-KG both HctB and Ac-HctB MCD spectra show two NIR transitions at ∼8800 and 11 800 cm–1 as well as the rising edge of the Fe(II) → α-KG π* metal-to-ligand charge transfer (MLCT) starting at ∼16 000 cm–1 (Figure 4b and d).
Figure 4.
283 K CD and 5 K MCD spectra of α-KG-Fe(II)-HctB (a and b, respectively, red), α-KG-Fe(II)-Ac-HctB (c and d, respectively, pink), α-KG-Fe(II)/Cl–-HctB (e and f, respectively, orange), and α-KG-Fe(II)/Cl–-Ac-HctB (g and h, respectively, purple). Component peaks and resultant fits are in black and colored dashed lines, respectively.
The presence of substrate does not lead to a significant perturbation of the MCD spectra in the absence of chloride for the α-KG-bound Fe(II) site. The relatively large 5Eg splitting of ∼3000 cm–1 is similar to that found in α-KG/chloride-bound CytC3 (∼3660 cm–1)33 and may be attributed to a weaker water ligand than that found in a site containing the 2His/1-carboxylate facial triad, such as CS2.30 This has been explained by the lack of the H-bond between the facial triad carboxylate and the coordinated water, which gives this water partial hydroxide character and strengthens the Fe–OH2 bond.33
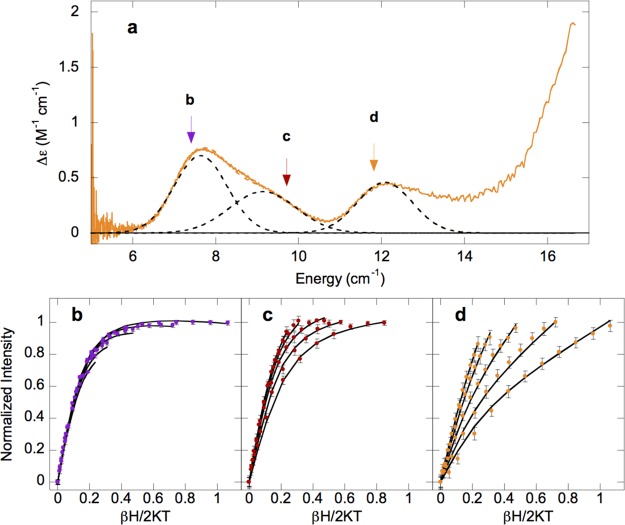
Upon addition of chloride, striking changes occur. The MCD spectrum of α-KG-Fe(II)/Cl–-HctB (Figure 4f, orange) shows three NIR transitions at ∼7600, ∼9100, and ∼12 100 cm–1, in addition to the MLCT shoulder at ∼16 000 cm–1. The presence of three transitions indicates that more than one Fe(II) site is present. In order to determine the nature of these species VTVH MCD data were collected on the three peaks at 7350, 9500, and 11 800 cm–1 as shown in Figure 5 (arrows in a, isotherms in b–d). VTVH MCD data collected on the 7600 cm–1 transition are fit to a negative ZFS with δ ≈ 1.3 ± 0.1 cm–1 and g|| ≈ 8.6 ± 0.1. The very small value of δ is indicative of a trigonal bipyramidal site, as was found to be present in the reduced, naphthalene-bound form of the Rieske-dependent naphthalene dioxygenase, which possessed a feature at 8165 cm–1 with a δ ≈ 1.2 ± 0.1 cm–1 and g|| ≈ 8.5 ± 0.1.34 Data collected at 9500 and 11 800 cm–1 were fit to the same ground state to give a positive ZFS with D = 9.3 ± 0.1 cm–1 and |E| = 2.1 ± 0.1 cm–1, corresponding to t2g orbital splittings of Δ ≈ 900 ± 100 cm–1 and |V| ≈ 560 ± 50 cm–1. Note that the data at 11 800 cm–1 required the addition of a B term of approximately 12% of the total intensity, due to overlap with the MLCT transition. α-KG-Fe(II)/Cl–-HctB is therefore a mixture of 6C and 5C trigonal bipyramidal sites.
Figure 5.
VTVH MCD analysis of α-KG-Fe(II)/Cl–-HctB. (a) MCD spectrum with arrows marking the energies at which VTVH MCD data were collected, at (b) 7350 cm–1 (purple), (c) 9500 cm–1 (red), and (d) 11 800 cm–1 (orange). All data were collected at 2.2, 3.4, 5, 7.5, and 10 K. Error bars for the data are shown or otherwise are the size of the data points.
The MCD spectrum of α-KG-Fe(II)/Cl–-Ac-HctB (Figure 4h, purple) shows four transitions: ∼5000, ∼7600, ∼9900, and ∼12 000 cm–1. The presence of four ligand field transitions indicates that α-KG-Fe(II)/Cl–-Ac-HctB is also a mixture in this case containing sites of square pyramidal (due to the ∼5000 cm–1 transition) and octahedral sites. VTVH MCD data were collected on the low-energy band at 5750 cm–1 as shown in Figure 6 (the other bands were too weak for a meaningful signal-to-noise ratio). The VTVH MCD data for this band could be fit using negative ZFS parameters of δ ≈ 2.6 ± 0.1 cm–1 and g|| ≈ 8.8 ± 0.1, corresponding to t2g splittings of Δ ≈ −1100 ± 100 cm–1 and |V| ≈ 660 ± 50 cm–1, the larger t2g splitting being consistent with a square pyramidal Fe(II) center. Thus, upon binding of chloride to α-KG-Fe(II)-Ac-HctB the site goes from 6C to 5C.
Figure 6.
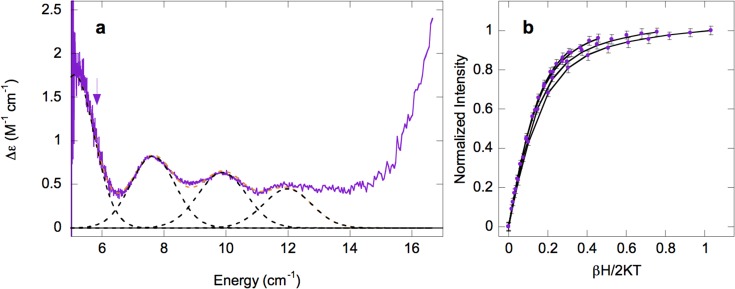
VTVH MCD analysis of α-KG-Fe(II)/Cl–-Ac-HctB. (a) MCD spectrum with arrows marking the energy at which VTVH MCD data were collected at (b) 5750 cm–1 (purple). Data were collected at 2.3, 3.3, 5, and 7.5 K. Error bars for the data are shown.
To determine whether the maintenance of the six-coordinate Fe(II) site in the chloride-free α-KG-Fe(II)-Ac-HctB complex was due to a missing negative charge at the halide binding position, we recorded the spectrum of the equivalent sample at a pD of 9.1. However, the pD shift by 1.6 log units, which previously brought about water deprotonation in a noncarboxylate coordinated Fe(II) center,35 did not significantly alter the MCD spectrum (Figure S6).
MD Simulations
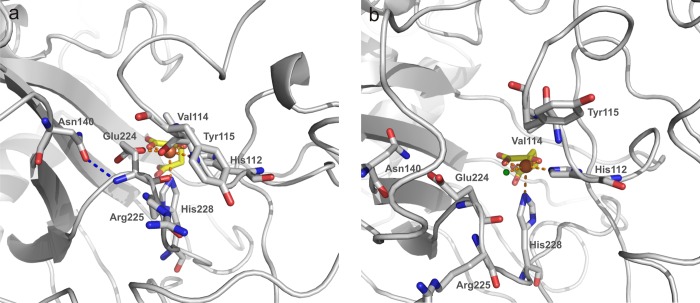
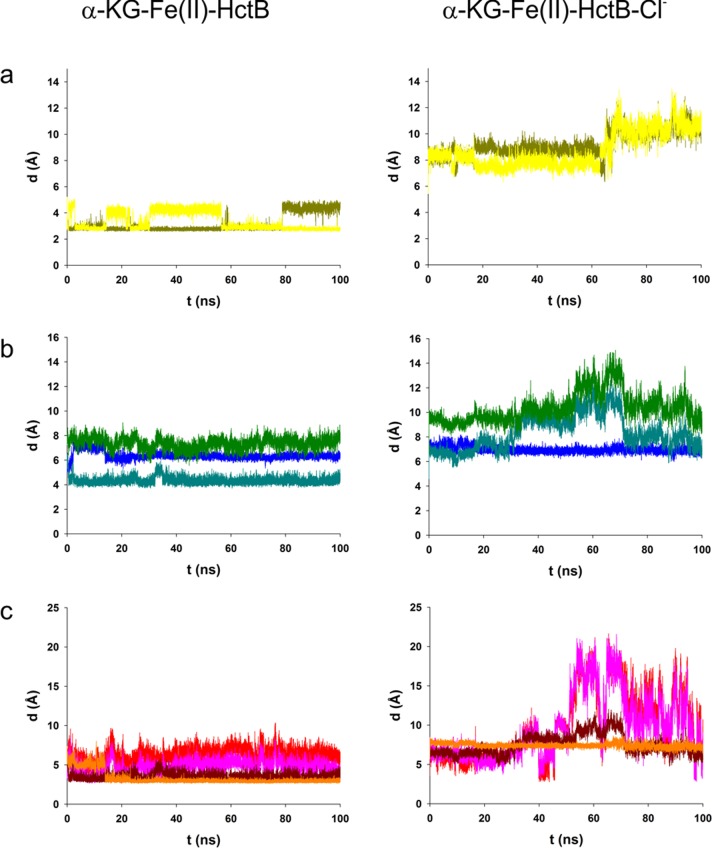
No crystal structure for HctB is available to date. Consequently, to elucidate the structural basis of chloride mediated O2 activation, a model of the HctB halogenase domain was constructed based on the crystal structure of SyrB21 and subjected to MD simulations in the absence and presence of 1 M NaCl in the simulation cell. In order to ensure a geometrically appropriate metal center structure, an octahedral iron force field was defined and applied to the ligands, namely His112, His228, α-KG, and—where appropriate—chloride, as detailed in the Experimental Section. 100 ns MD simulations of the 2-His 1-Chloro α-KG ligated Fe(II)-HctB model and its chloride-free analogue at 297 K showed overall structures that were stable over the simulation time. However, in the halide-free model, a rearrangement at the metal center was observed: Residue Glu224, which pointed away from the metal center in all starting structures, reoriented and coordinated to the Fe(II) ion, as demonstrated in a 90 ns snapshot of the active site (Figure 7a). By contrast, the respective simulation in the presence of chloride roughly preserved the conformation of Glu224 from the starting structure (Figure 7b). When the simulation of the HctB domain under chloride-free conditions was repeated with a water molecule kept bound to the metal ion either at the axial, “6th” position (Figure S7) or at the equatorial position that is otherwise occupied by the chloride ion (Figure S8), Glu224 also reoriented in order to point toward Fe(II) in both cases, whereby the residue’s carboxylate moiety H-bonded to the water molecule that occupied the Cl– binding site or coordinated directly (Figures S7 and S8). (Note that both a displacement and preservation of metal bound water are feasible in principle and, therefore, needed to be considered). Trajectories of the Fe(II)-Glu224 carboxylate oxygen distances show that this reorientation takes place instantaneously (<100 ps), (Figures 8a, left, S9a, S10a). By contrast, in the chloride containing structure the carboxylate moiety of Glu224 remained pointing away from the HctB active site (Figure 8a, right), presumably due to electrostatic interactions.
Figure 7.
90 ns snapshots of the HctB halogenase domains derived from MD simulations of the modeled structures at 297 K. While in the chloride-free structure (a) Glu224 points toward Fe(II) (orange ball), in the chloride-containing structure (b) the halide (green ball) coordinates to Fe(II) and Glu224 points away from the metal cofactor. This results in a rearrangement of the neighboring residues Val114, Tyr115, Asn140, and Arg225. Water molecules are not displayed.
Figure 8.
Trajectories from 100 ns MD simulations depicting distances of residues involved in the chloride-triggered structural rearrangement in HctB in the absence (left panels) and presence (right panels) of 1 M chloride. Panel a shows distances of O-5 and O-5′ of Glu224 to Fe(II). Panel b displays backbone distances from C-2 of Asn140 to N-2 of Glu224 (blue); N-2 of Val114 to C-2 of Glu224 (teal); and C-2 of Tyr115 to C-2 of Arg225 (green). Panel c gives the distances of the putative H-bonding atoms O-7 of Tyr115 to N-ω of Arg225 (red); O-7 of Tyr115 to N-ω′ of Arg225 (pink); N-2 of Val114 to O-1 of Glu224 (dark red); and O-4 of Asn140 to N-2 of Glu224 (orange).
In order to assess the impact of a probable overestimation of electrostatics in our model on the orientation of Glu224, 1 ns MD simulations at varying reduced effective charges of Fe(II) were subsequently performed. Results showed that the observed two principal distinct orientations of Glu224, toward and away from Fe in the absence and presence of chloride, were not sensitive to the Fe(II) charge within the studied range of 0 to +2. However, for Cl–-free models with no bound water in the halide binding pocket, increased charges roughly correlated with increased frequency of direct coordination of Glu224 to Fe (Table S2).
The reorientation of Glu224 in the chloride-free HctB structures led to major structural changes. The residue’s flipping resulted in a H-bonding interaction between its backbone oxygen and the backbone nitrogen of Val114 (Figure 8c, left, dark red) in the model containing the water-free Fe(II) sphere and drew the respective strands closer together (Figure 8b, left, teal). However, in the two models with a water tightly bound to the Fe(II) center either at the chloride-binding position or at the second water-binding position in the octahedral 2-His α-KG complex, no interactions between these residues were observed (Figures S9b and S10b). In all three chloride-free models (Figures 7a, S7, and S8), the side chains of Tyr115 and Arg225 reduced their distance from an average of 10 Å to 4–6 Å (Figures 8c, S9c, and S10c, pink and red traces) and became less flexible. In the case of the halide-free model without tightly bound water, the backbone nitrogen of Glu224 formed a H-bond with the side chain oxo group of Asn140 (Figure 8c, left, orange). In all halide-free models, the backbone of Asn140 and Glu224 came closer together (Figures 8b, S9b, and S10b, blue traces). Thus, according to our models, the effect of chloride binding to Fe(II) is to induce conformational changes in HctB.
Discussion
The Impact of Chloride Binding on the Metal Center Geometry and the O2 Reduction Activity
This study demonstrates that although an enzymatic α-KG bound Fe(II) center is constituted in the absence of a halide, the latter impacts the geometric structure of the metal center and thereby triggers O2 activation in HctB. CD/MCD spectroscopic studies of the metal centers in Fe(II)-HctB and Fe(II)-Ac-HctB show a stable six-coordinate geometry in the absence of any cofactor. This sets HctB apart from the related α-KG dependent halogenase CytC3, where α-KG was a prerequisite for Fe(II) binding to the enzyme in solution.33 HctB samples with and without chloride show similar excited-state spectral features. However, the dπ (t2g) orbitals are perturbed upon halide binding as shown by VTVH MCD. Also, while the ground state splitting is the same for Fe(II)-HctB and Fe(II)-Ac-HctB in the absence of halide, the splittings for halide-bound HctB in the absence of substrate differ from those where the substrate is bound. These results provide experimental evidence for the effect of halide binding on protein conformation and thus are consistent with MD simultations. It is interesting to note that in the presence of α-KG and substrate, conditions in which most other α-KG-dependent enzymes trigger water ligand dissociation and activation of O2, the Fe(II) site in HctB remains 6C (Figure 4c and d).
This is consistent with the idea that the substrate does not sterically interact with the active site until chloride is bound to Fe(II). Evidence for a 5C Fe(II) site is found only upon binding of chloride to the α-KG-Fe(II) site. For α-KG-Fe(II)/Cl−-Ac-HctB a 5C/6C mixture of square pyramidal and octahedral sites is present. The vacated coordination site allows binding of O2 and results in an active site that is competent for catalysis. This is supported by stopped-flow kinetics, which demonstrate that the presence of chloride results in a ≥200-fold increase in the rate of α-KG-Fe(II)-Ac-HctB complex decay. Interestingly, the presence of α-KG and chloride but absence of substrate leads to the formation of a mixture of trigonal bipyramidal and octahedral sites. This directly reflects the slow but measurable uncoupled consumption of O2, observed only for this form (7% of the rate of α-KG-Fe(II)-Cl-Ac-HctB(11)). These findings are in contrast to the results for CytC3, which showed the presence of only 6C sites unless α-KG, substrate, and chloride were all present,33 and kinetic findings for SyrB2 which showed a 5000-fold loss in rate in the absence of substrate.36
A Putative Role of Glu224 in O2 Activation of HctB
In the absence of a crystal structure for HctB, stuctural models of its halogenase domain allowed some interesting insights into a putative role of Cl– in the activation of HctB for catalysis: MD simulations of the HctB structural models suggest major structural differences between the chloride-bound and chloride-free forms. In the absence of chloride, the carboxylate moiety of Glu224 is oriented toward the iron center (either directly binding to Fe(II) or H-bonding to a coordinated H2O). This results in H-bonding interactions between the backbones of Glu224 and Val114 in models containing a water-free Fe(II) center. Additionally, hydrogen bonds form between Glu224 and Asn140 in all investigated halide-free models that bring the residues’ carbon atoms closer together. Moreover the distances between the Tyr115 and Arg225 side chains are significantly reduced in all chloride-free models. Notably, previous in silico docking studies suggested that the fatty acyl moiety accesses the active site between the strands that contain residues 114–115 and 224–225 (Figure S11).11 As these residues converge in the chloride-free model, an analogous active site access by the substrate’s acyl moiety could be severely hampered. Such a scenario provides a rationale for the substrate’s inability to affect MCD spectra (i.e., the 6C → 5C conversion) and to markedly increase O2 consumption rates in the absence of chloride. The apparent transient stability of the α-KG-Fe(II)-Ac-HctB complex during single turnover kinetics, which is mirrored by the ∼60 ms lag phase in Figure 1, may thus reflect the reorganization of the enzyme upon chloride binding, involving the opening of the substrate channel, the substrate entrance to the active site, and the formation of the five-coordinate iron center required for the O2 dependent catalysis to take place. In the absence of chloride a bound water could take the halide’s position at the metal center, or alternatively, direct coordination of Glu224 could take place. A corresponding acidic amino acid residue is present in the other so far annotated fatty acyl-halogenase Psm3L, but it is not generally conserved in MNH halogenases. According to sequence alignments, the amino acyl-halogenases have a serine in the respective position and in the structure of SyrB2 this residue occupies a similar space as Glu224 in the HctB model. Therefore, the proposed molecular mechanism may be specific to this subtype of fatty acyl-halogenases. However, a principal role of chloride in the activation of halogenases by triggering changes in the protein structure may be a general feature of the MNH halogenase mechanism. Interestingly, in SyrB2 a major rearrangement of polypeptide strands was obtained upon binding of Fe(II) and chloride to an α-KG containing structure.1 In CurA, concomitant coordination of α-KG and chloride to the iron center also resulted in a structural reorganization.3 In contrast, CytC3, which could not be crystallized with a metal coordinated halide, possesses the same conformation in its apo and Fe(II)+α-KG-bound forms.2 Even though structural data are scarce and the presence of charged buffer molecules may compromise their interpretation, it is noteworthy that in the available studies conformational rearrangements were accompanied by a switch from a halide-free to a halide-coordinating metal center. Particularly for halogenases with low chloride affinity and those that perform multiple halogenations per substrate and therefore consume the bound halide, a chloride-dependent activation would prevent undesired hydroxylation after the primary halogenation step. Note that a report was recently published that briefly described the chloride induced formation of an Fe(IV) species in SyrB2, supporting our notion that this may be a general mechanism in halogenases.37
In summary, the present study has shown that halide binding is key for the O2 reactivity of HctB, as neither is an open coordination position for O2 binding present nor is the substrate allowed to properly align above the active site unless halide is ligated to Fe(II). These effects help to maintain halogenase activity in HctB and may be factors involved in the mechanisms of halogenases in general.
Acknowledgments
Financial support by the Austrian Science Fund (FWF) grant W901–B05 DK Molecular Enzymology (to G.D.S.) and NIH Grant GM 40392 (to E.I.S.) is gratefully acknowledged.
Supporting Information Available
Traces and kinetic constants for all stopped-flow measurements; VTVH MCD data fits for Fe(II)/Cl-HctB; Low-temperature, 7 T MCD spectra of the α-KG-Fe(II)-Ac-HctB complex; Snapshots and trajectories for MD simulations with water bound to the 5th and 6th coorination position of iron, respectively. This material is available free of charge via the Internet at http://pubs.acs.org.
Author Present Address
§ Institute of Biochemistry, Graz University of Technology, Petersgasse 12, and Institute of Molecular Biosciences, University Graz, Humboldtstr. 50, A-8010 Graz, Austria.
The authors declare no competing financial interest.
Funding Statement
National Institutes of Health, United States
Supplementary Material
References
- Blasiak L. C.; Vaillancourt F. H.; Walsh C. T.; Drennan C. L. Nature 2006, 440, 368–371. [DOI] [PubMed] [Google Scholar]
- Wong C.; Fujimori G. D.; Walsh C. T.; Drennan C. L. J. Am. Chem. Soc. 2009, 131, 4872–4879. [DOI] [PMC free article] [PubMed] [Google Scholar]
- Khare D.; Wang B.; Gu L.; Razelun J.; Sherman D. H.; Gerwick W. H.; Hakansson K.; Smith J. L. Proc. Natl. Acad. Sci. U.S.A. 2010, 107, 14099–14104. [DOI] [PMC free article] [PubMed] [Google Scholar]
- Vaillancourt F. H.; Yeh E.; Vosburg D. A.; O’Connor S. E.; Walsh C. T. Nature 2005, 436, 1191–1194. [DOI] [PubMed] [Google Scholar]
- Vaillancourt F. H.; Yin J.; Walsh C. T. Proc. Natl. Acad. Sci. U.S.A. 2005, 102, 10111–10116. [DOI] [PMC free article] [PubMed] [Google Scholar]
- Ueki M.; Galonic D. P.; Vaillancourt F. H.; Garneau-Tsodikova S.; Yeh E.; Vosburg D. A.; Schroeder F. C.; Osada H.; Walsh C. T. Chem. Biol. 2006, 13, 1183–1191. [DOI] [PubMed] [Google Scholar]
- Galonic D. P.; Vaillancourt F. H.; Walsh C. T. J. Am. Chem. Soc. 2006, 128, 3900–3901. [DOI] [PubMed] [Google Scholar]
- Neumann C. S.; Walsh C. T. J. Am. Chem. Soc. 2008, 130, 14022–14023. [DOI] [PMC free article] [PubMed] [Google Scholar]
- Gu L.; Wang B.; Kulkarni A.; Geders T. W.; Grindberg R. V.; Gerwick L.; Håkansson K.; Wipf P.; Smith J. L.; Gerwick W. H.; Sherman D. H. Nature 2009, 459, 731–735. [DOI] [PMC free article] [PubMed] [Google Scholar]
- Jiang W.; Heemstra J. R.; Forseth R. R.; Neumann C. S.; Manaviazar S.; Schroeder F. C.; Hale K. J.; Walsh C. T. Biochemistry 2011, 50, 6063–6072. [DOI] [PMC free article] [PubMed] [Google Scholar]
- Pratter S. M.; Ivkovic J.; Birner-Gruenberger R.; Breinbauer R.; Zangger K.; Straganz G. D. ChemBioChem 2014, 15, 567–574. [DOI] [PubMed] [Google Scholar]
- Solomon E. I.; Brunold T. C.; Davis M. I.; Kemsley J. N.; Lee S.-K.; Lehnert N.; Neese F.; Skulan A. J.; Yang Y.-S.; Zhou J. Chem. Rev. 2000, 100, 235–349. [DOI] [PubMed] [Google Scholar]
- Galonic D. P.; Barr E. W.; Walsh C. T.; Bollinger J. M.; Krebs C. Nat. Chem. Biol. 2007, 3, 113–116. [DOI] [PubMed] [Google Scholar]
- Diebold A. R.; Brown-Marshall C. D.; Neidig M. L.; Brownlee J. M.; Moran G. R.; Solomon E. I. J. Am. Chem. Soc. 2011, 133, 18148–18160. [DOI] [PMC free article] [PubMed] [Google Scholar]
- Kojima T.; Leising R. A.; Yan S.; Que L. Jr. J. Am. Chem. Soc. 1993, 115, 11328–11335. [Google Scholar]
- de Visser S. P.; Latifi R. J. Phys. Chem. B 2009, 113, 12–14. [DOI] [PubMed] [Google Scholar]
- Pandian S.; Vincent M. A.; Hillier I. H.; Burton N. A. Dalton Trans. 2009, 31, 6201–6207. [DOI] [PubMed] [Google Scholar]
- Kulik H. J.; Blasiak L. C.; Marzari N.; Drennan C. L. J. Am. Chem. Soc. 2009, 131, 14426–14433. [DOI] [PMC free article] [PubMed] [Google Scholar]
- Matthews M. L.; Neumann C. S.; Miles L. A.; Grove T. L.; Booker S. J.; Krebs C.; Walsh C. T.; Bollinger J. M. Proc. Natl. Acad. Sci. U.S.A. 2009, 106, 17723–17728. [DOI] [PMC free article] [PubMed] [Google Scholar]
- Kulik H. J.; Drennan C. L. J. Biol. Chem. 2013, 288, 11233–11241. [DOI] [PMC free article] [PubMed] [Google Scholar]
- Wong S. D.; Srnec M.; Matthews M. L.; Liu L. V.; Kwak Y.; Park K.; Bell C. B. III; Alp E. E.; Zhao J.; Yoda Y.; Kitao S.; Seto M.; Krebs C.; Bollinger J. M. Jr.; Solomon E. I. Nature 2013, 499, 320–324. [DOI] [PMC free article] [PubMed] [Google Scholar]
- YASARA (9.11.9); YASARA Biosciences GmbH, Vienna, Austria; 2012. [Google Scholar]
- Wang J.; Cieplak P.; Kollman P. A. J. Comput. Chem. 2000, 21, 1049–1074. [Google Scholar]
- Cornell W. D.; et al. J. Am. Chem. Soc. 1995, 117, 5179–5197. [Google Scholar]
- Essman U.; et al. J. Chem. Phys. 1995, B 103, 8577–8593. [Google Scholar]
- Jakalian A.; Jack D. B.; Bayly C. J. Comput. Chem. 2002, 23, 1623–1641. [DOI] [PubMed] [Google Scholar]
- Pandian S.; Vincent M. A.; Hillier I. H.; Burton N. A. Dalton Trans. 2009, 6201–6207. [DOI] [PubMed] [Google Scholar]
- Hooft R. W.; Vriend G.; Sander C.; Abola E. E. Nature 1996, 381, 272. [DOI] [PubMed] [Google Scholar]
- Krieger E.; Nielsen J. E.; Spronk C. A.; Vriend G. J. Mol. Graph. Model. 2006, 25, 481–486. [DOI] [PubMed] [Google Scholar]
- Pavel E. G.; Zhou J.; Busby R. W.; Gunsior M.; Townsend C. A.; Solomon E. I. J. Am. Chem. Soc. 1998, 120, 743–753. [Google Scholar]
- Solomon E. I.; Pavel E. G.; Loeb K. E.; Campochiaro C. Coord. Chem. Rev. 1995, 144, 369–460. [Google Scholar]
- Light K. M.; Hangasky J. A.; Knapp M. J.; Solomon E. I. J. Am. Chem. Soc. 2013, 135, 9665–9674. [DOI] [PMC free article] [PubMed] [Google Scholar]
- Neidig M. L.; Brown C. D.; Light K. M.; Galonić Fujimori D.; Nolan E. M.; Price J. C.; Barr E. W.; Bollinger J. M. Jr.; Krebs C.; Walsh C. T.; Solomon E. I. J. Am. Chem. Soc. 2007, 129, 14224–14231. [DOI] [PMC free article] [PubMed] [Google Scholar]
- Ohta T.; Chakrabarty S.; Lipscomb J. D.; Solomon E. I. J. Am. Chem. Soc. 2008, 130, 1601–1610. [DOI] [PMC free article] [PubMed] [Google Scholar]
- Straganz G. D.; Diebold A. R.; Egger S.; Nidetzky B.; Solomon E. I. Biochemistry 2010, 49, 996–1004. [DOI] [PMC free article] [PubMed] [Google Scholar]
- Matthews M. L.; Krest C. M.; Barr E. W.; Vaillancourt F. H.; Walsh C. T.; Green M. T.; Krebs C.; Bollinger M. J. Jr. Biochemistry 2009, 48, 4331–4343. [DOI] [PMC free article] [PubMed] [Google Scholar]
- Matthews M. L.; Chang W. C.; Layne A. P.; Miles L. A.; Krebs C.; Bollinger M. J. Jr. Nat. Chem. Biol. 2014, 10, 209–215. [DOI] [PMC free article] [PubMed] [Google Scholar]
Associated Data
This section collects any data citations, data availability statements, or supplementary materials included in this article.


