Abstract
Protein misfolding and concomitant aggregation towards amyloid formation is the underlying biochemical commonality among a wide range of human pathologies. Amyloid formation involves the conversion of proteins from their native monomeric states (intrinsically disordered or globular) to well-organized, fibrillar aggregates in a nucleation-dependent manner. Understanding the mechanism of aggregation is important not only to gain better insight into amyloid pathology but also to simulate and predict molecular pathways. One of the main impediments in doing so is the stochastic nature of interactions that impedes thorough experimental characterization and the development of meaningful insights. In this study, we have utilized a well-known intermediate state along the amyloid-β peptide aggregation pathway called protofibrils as a model system to investigate the molecular mechanisms by which they form fibrils using stability and perturbation analysis. Investigation of protofibril aggregation mechanism limits both the number of species to be modeled (monomers, and protofibrils), as well as the reactions to two (elongation by monomer addition, and protofibril–protofibril lateral association). Our new model is a reduced order four species model grounded in mass action kinetics. Our prior study required 3200 reactions, which makes determining the reaction parameters prohibitively difficult. Using this model, along with a linear perturbation argument, we rigorously determine stable ranges of rate constants for the reactions and ensure they are physically meaningful. This was accomplished by finding the ranges in which the perturbations dieout in a five-parameter sweep, which includes the monomer and protofibril equilibrium concentrations and three of the rate constants. The results presented are a proof-of-concept method in determining meaningful rate constants that can be used as a bonafide way for determining accurate rate constants for other models involving complex biological reactions such as amyloid aggregation.
Keywords: Aβ, Protein aggregation, Mathematical model, Stability, Rate constants
1. Introduction
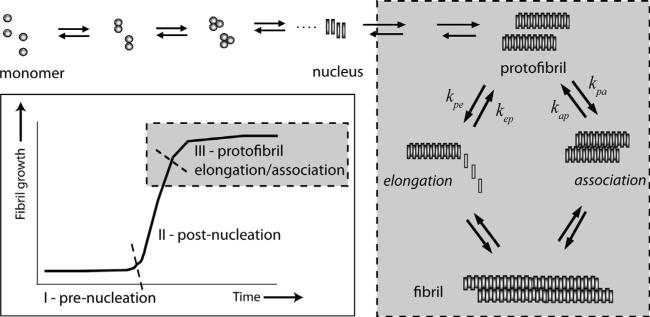
Protein aggregation is now being recognized as one of the fundamental processes in cell biology that seem to play a role in both cell toxicity and survival. More commonly known for their pathogenicity in neurodegenerative diseases, amyloid aggregates are also seen to take part in functional roles [6]. One of the most widely investigated amlyloid proteins is the amyloid-β (Aβ) peptide that is implicated in Alzheimer's disease (AD). The intrinsically disordered monomeric Aβ peptide aggregates to form large molecular weight, insoluble fibrils that deposit as senile plaques in the brains of AD patients [19]. The process of Aβ aggregation, as well as other amyloidogenic proteins, is highly stochastic but follows a nucleation-dependent mechanism in which a specific structural re-organization and concomitant self-assembly is a prerequisite for the aggregation process to occur. The nucleation-dependent mechanism displays a characteristic sigmoidal growth curve containing a lag-phase, where the nucleation occurs, followed by rapid growth and saturation (Fig. 1; inset). Stochasticity in this process can be appreciated by the fact that it involves multiple scales of the reactions (temporal and spatial) that can give raise to multiple nucleation events leading to heterogeneous assembly, depending on the experimental conditions.
Fig. 1.
The general model for protein aggregation. A monomer will self-aggregate to form a protofibril. The protofibril can then continue aggregation via two distinct pathways: elongation, where monomer addition continues, or lateral association, where protofibrils join together side-to-side to form fibrils. Inset: fibril growth as a function of time. The characteristic curve of fibril formation includes a lag-phase prior to nucleation, an exponential growth region and the stationary phase.
In our previous study, we have demonstrated the temporal modeling of Aβ aggregation using a top-down approach by systematically dissecting the sigmoidal growth into experimentally verifiable segments [7]. In the same article, we specifically described the post-nucleation event involving protofibril elongation and association using ODE-based simulations, and derived the rate constants involved in such processes. In the current paper, we have taken the biophysically and computationally well characterized processes of Aβ protofibril elongation and association as a model interactions, to perform the perturbation analysis, to demonstrate and distinguish between the kinetically- and thermodynamically-stable products. More specifically, this paper demonstrates a novel method of selecting appropriate rate constants, when there is no clear way of identifying them, which render the system of equations physically meaningful by incorporation of kinetic and thermodynamic features.
In this work, we model the Aβ aggregation reactions highlighted in Fig. 1. In the reduced-order model developed and employed here, the monomer to protofibril pathway (which includes nucleation) is combined into a single reaction step and the two potential pathways for elongation are conserved. The rate constants in this system of equations are unknown thereby making the solvability of the system impossible. Parametric fitting of the system to experimental data is very difficult due to the complexity of the problem and the abundance of species. Therefore, it is proposed that perturbation arguments and thermodynamic stability can be used to simplify the process of determining the rate constants. The corresponding differential equations are then used to derive a set of first-order perturbed differential equations. The two forward rate constants with which the present work is concerned are kpe, for protofibril to elongation reactions, and kpa, for protofibril to association reaction rate constant, which are systematically varied to determine which pairs of solutions produce stable solutions for the perturbed system. The pairs of solutions that are allowed are then subjected to thermodynamic constraints in an effort to further reduce the allowable pairs of solutions.
In Sections 2 and 3, we discuss the experimental methodology and results. The following Section 4 is devoted to the development of the reduced order model and also to the introduction and implementation of the new methodology of determining rate constants. These new rate constants are then introduced into the model system and solved numerically. We also discuss the relevance and justification of this process and compare the results of our theory with those obtained from experiments.
2. Experimental materials and methods
The standard approaches: thioflavin-T (ThT) staining and dynamic light scattering (DLS) experiments were done to measure the formation of elongated and associated aggregates respectively, as a function of time. The details of the experimental methods are explained in the rest of this section followed by the results obtained.
Aβ42 was synthesized by the Peptide Synthesis Facility at the Mayo Clinic (Rochester, MN) using routine Fmoc chemistry. MALDI-ToF mass spectrometry revealed >90% purity of the peptide. Sodium dodecylsulphate (SDS) and thioflavin-T were procured from Sigma (St. Louis, MO). All other chemicals were obtained from VWR Inc.
Any pre-formed aggregates of Aβ42 were removed by purifying the crude peptide by size exclusion chromatography (SEC) on a Superdex-75 column in order to eliminate seeds in our reactions. The fractions corresponding to the monomers were used to make fresh protofibrils (Ps) as previously reported [7]. Briefly, 50–60 μM of Aβ42 monomer in 20 mM Tris–HCl, pH 8.0 and 50 mM NaCl were agitated at 25 degrees for 8–12 h. The P formation was monitored by ThT fluorescence by periodically taking aliquots of the reaction mixture. Each time, the samples were centrifuged at 19000× g for 20 min and ThT fluorescence was recorded for the supernatant to monitor the presence of soluble Ps in the supernatant. After optimal fluorescence increase, the sample was again centrifuged at 19000× g for 20 min and the supernatant was collected. The supernatant was then subjected to SEC fractionation using a Superdex-75 column. The concentration was determined by UV–vis spectrophotometry with the molar extinction coefficient of 1450 cm–1 M–1.
3. Experimental results: protofibril elongation and association
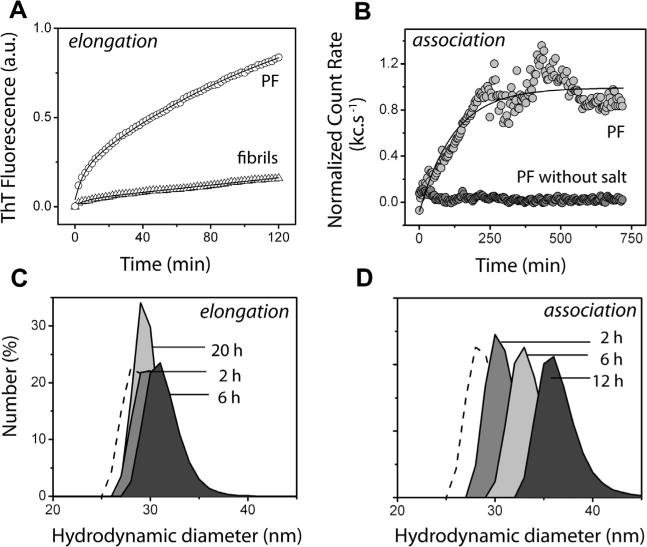
In order to identify the differences between the bulk rate constants for P elongation and association we monitored the reactions by ThT fluorescence and dynamic light scattering techniques, respectively. Protofibril (P) elongation was monitored using thioflavin-T (ThT) fluorescence as previously reported [7,12]. The elongation reaction was initiated by adding 25 μM freshly purified Aβ42 monomers to isolated 2 μM Ps (Fig. 2A, circles). As a negative control, a similar elongation experiment on isolated 2 μM Aβ42 fibrils was performed, which as expected, did not show significant elongation (Fig. 2A, triangles). The data were fit to first-order exponential equation as reported previously [7], which gave a bulk rate constant (kpe) value of 0.012 s–1. The kinetics of P association was monitored with dynamic light scattering (DLS). The reaction was initiated by the adding 150 mM NaCl as reported previously [7,16], and was monitored for 12 h as shown in Fig. 2B. The data was plotted against normalized count rates (kcs–1) which correlate to the hydrodynamic diameter. As expected, an exponential increase in the size was observed (Fig. 2B, light gray circles) in presence of NaCl, while in the absence of 150 mM NaCl, no increase in the size was observed (Fig. 2B, gray circles). Deconvolution of the data with a first order exponential equation yielded a rate constant (kpa) of 0.008 s–1. In addition to the estimation of rate constants, the increase in the size of Ps at various time points during both elongation and association reactions was evaluated to assist modeling by making realistic assumptions. Ps in buffer alone showed a monodisperse peak with a diameter of about 27 nm (Fig. 2 C and D; dotted peak). There was only a marginal increase in the hydrodynamic diameter of the Ps after 2 h (gray peak), 6 h (dark gray peak) and 20 h (light gray peak) during elongation with 25 μM Aβ42 monomers. On the contrary, the diameter of Ps when incubated with 150 mM salt, showed a considerable increase in the size. The diameter was recorded as ≈ 30, ≈ 33, and ≈ 36 nm after 2 (gray peak), 6 (light gray peak), and 20 h (dark gray peak), respectively. These data indicate that the product involving P elongation could be a kinetic product as opposed to thermodynamic nature of the associated species. Furthermore, the association reaction involves a significant size increase (≈1.4-fold) as compared to the elongated one, which forms the basis of some of the assumptions made in our models.
Fig. 2.
Elongation and association of Protofibrils (Ps). (A), Elongation of 2 μM Ps monitored over a period of two hours using ThT fluorescence in the presence of 25 μM Aβ42 monomers (circles). A similar reaction with 2 μM fibrils was used as negative control (triangles). (B), P association monitored over a period of 12 h using dynamic light scattering (DLS) in presence (light gray circles) and absence (gray circles) of 150 mM NaCl. The data is plotted against normalized count rates per second (Kcs–1). (C and D), Size distribution of Ps after 2, 6, and 20 h of elongation with 25 μM Aβ42 monomer and after 2, 6, and 12 h of association with 150 mM NaCl respectively, monitored using DLS.
4. A reduced order problem
In this section, we present a reduced problem by modeling the entire aggregation process through a series of four key steps that are the focus of our attention. Our paper follows a well established approach which has been successful in capturing the essential features of the problem in a cost effective manner. Typically, researchers have adopted curve fitting experiments or empirical laws based on first principles of statistical mechanics to obtain rate constants for complex problems [1,5]. The use of former technique to determine precise rate constants is extremely difficult for Aβ aggregation. The difficulty is due to the enormous complexity of the problem and the superabundance of species that populate such systems; thereby making them highly stochastic. The latter method is also not completely problem free; it has been cast in some doubt due to the approximate and probabilistic nature of the argument [9]. The primary objective of this work therefore remains to employ rigorous mathematical and biophysical stability arguments, aided by experimental observations, to narrow down the space of rate constants that are meaningful. Morris and co-workers review the various types of modeling techniques that have been used previously in the literature [5]. Models relevant to the system being studied in this work include those derived on the basis of empirical sources (e.g., logistic equations), as well as those derived from kinetic and/or thermodynamic considerations (e.g., Mass action equations, nonmass action equations which consist of minimalistic equations and other kinetic equations and quantitative structure–activity relationship equations). Our approach belongs to the category of minimalistic equations/Ockham's razor principles, as described by Finke and co-workers in their recent review paper on kinetic models [5]. The reduced order approach adopted by some prominent researchers in the protein aggregation field [1,3,4,14,15,17] has shown to be an effective and economical approach to the problem. We begin this section with a discussion of the model and the equilibrium state. This is then followed by an introduction and application of two new constraints: (i) mathematical stability and (ii) thermodynamic stability upon our model system.
4.1. Equilibria and constraints
We propose a three stage model for protofibril formation from Ps which included the pathways to lateral association and elongation. Based on the previous reports on Aβ40 protofibril size, we assume that the Ps are made of approximately 1600 monomeric units [16]. We also simplify the reactions towards P formation as one reaction (monomers → 1600mers with forward and backward rates kmp and kpm respectively), while based on the literature, we assume two pathways of the formation of Ps containing 3200mers from the one with 1600mers (schematically shown in Fig. 1): (a) lateral association (A), in which two molecules of Ps interact laterally (with forward and backward rates kpa and kap respectively; this assumption is partly based on the size estimates obtained experimentally as described above), and (b) elongation (E), in which 1600 monomer molecules add sequentially at the ends of Ps (with forward and backward rates kpe and kep respectively). Mathematically, we represent the system by:
Here, as in the rest of the paper, the notation for concentration of a species, usually denoted [X] is replaced by the more compact form X. In this case, M is the monomer concentration, P is the 1600mer concentration, E refers to the concentration of the elongated 3200mer and A, the concentration of the laterally associated 3200mer. The terms kij (i, j = m, p, e, a) refer to the forward and backward reaction rates. The corresponding system of differential equations are then given by Kondepudi and Pauling [10,18]
| (1) |
| (2) |
| (3) |
| (4) |
At equilibrium we can find the steady state concentrations of the four species under consideration. Lets take Me, Pe, Ee and Ae to be the equilibrium concentrations of each species. We use the steady state version of the above system of Eqs. (1)–(4) to obtain certain physical constraints for the problem, namely: (i) , (ii) and (iii) . Naturally, these must be simultaneously true in order to be self-consistent.
4.2. Stability conditions
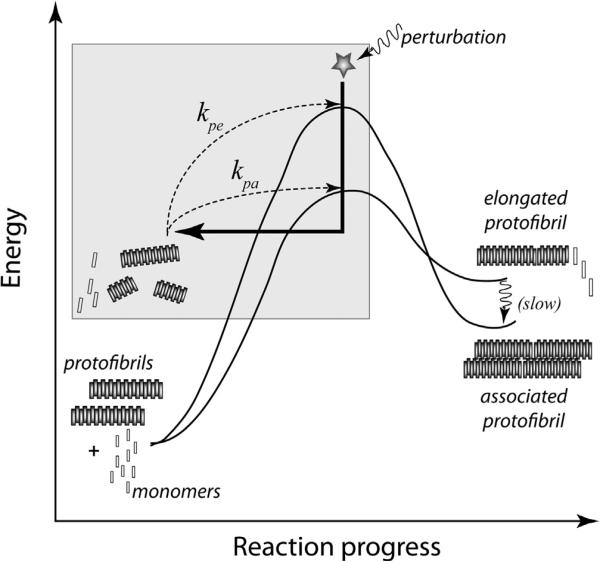
In this subsection, we derive conditions for stable equilibria by linearly perturbing the stable solutions Me, Pe, Ee and Ae. Our underlying argument is that in a physical system such as this, the steady equilibrium must be stable under sufficiently small perturbations. Fig. 3 schematically represents the energy diagram of this process and represents our assumptions about the system. Since the rate constants for the system of equations are not given, the system remains unsolvable. However, we know that for the system to be physically meaningful, the equilibrium state for this system must be mathematically stable and any perturbation, if sufficiently small, must eventually vanish.1 Therefore, the rate constants must necessarily allow for this condition. In fact, in terms of the energetics of the aggregation process, it can be said that at any point in time, any perturbation that drives the system out of its trajectory will eventually die and bring the system back to its course. This last statement is mathematically tractable only in the equilibrium state. The behavior of the perturbation therefore in itself becomes an interesting dynamic worthy of examination and which provides essential clues into the behavior of the original system.
Fig. 3.
Energy profile for Aβ aggregation schematically depicts our perturbation based approach and different rates at which elongation and association occur.
The perturbation to the equilibrium concentrations of the different species takes the form
| (5) |
where M1, P1, E1 and A1 represent perturbed concentrations and ε is the magnitude or order of the perturbation. The expressions for M, P, E, A are placed into Eqs. (1)–(4) and the O(ε) are collected, giving us the perturbed system
| (6) |
| (7) |
| (8) |
| (9) |
The Eqs. (6)–(9) represent the governing equations for the perturbed terms. Therefore, in order to establish the stability of the equilibrium states, we need to show that the perturbed terms eventually vanish and thereby determine a range for stable rate constants. To do so, we write Eqs. (6)–(9) in the operator form
| (10) |
where A (M1, P1, E1, A1} and
Our objective to seek the range of the rate constants in which the real part of all the eigenvalues remains simultaneously negative, is also subject to the equilibrium constraints obtained earlier. We conduct a parametric sweep of the rate constants and identify the resulting eigenvalues and eigenvectors for the perturbation. The Eqs. (1)–(4) represent a system of six parameters (forward and backward rate constants) and additionally two equilibria (Me and Pe) making our search task extremely tedious. We therefore perform a more restricted search by holding certain parameters fixed. For all our computations, we assumed kmp = 9 × 10⁻¹ (determined from [7]) and is obtained from the law of mass action. The equilibrium values of monomers and protofibrils are varied between the values shown in Table 1. In the graphs depicting our results below, we choose three representative cases from this list to denote the observed patterns.
Table 1.
The table shows the equilibrium concentrations that were used to study the dependence of the solutions on Me and Pe.
| Set | Me | Pe |
|---|---|---|
| 1 | 100 Χ 10–6 | 1 Χ 10–6 |
| 2 | 10 Χ 10–6 | 1 Χ 10–6 |
| 3 | 1 Χ 10–4 | 1 Χ 10–4 |
| 4 | 1 Χ 10–6 | 100 Χ 10–6 |
| 5 | 1 Χ 10–6 | 10 Χ 10–6 |
| 6 | 1 Χ 10–6 | 1 Χ 10–6 |
| 7 | 1 Χ 10–6 | 1 Χ 10–9 |
| 8 | 1 Χ 10–9 | 1 Χ 10–6 |
| 9 | 1 Χ 10–9 | 1 Χ 10–9 |
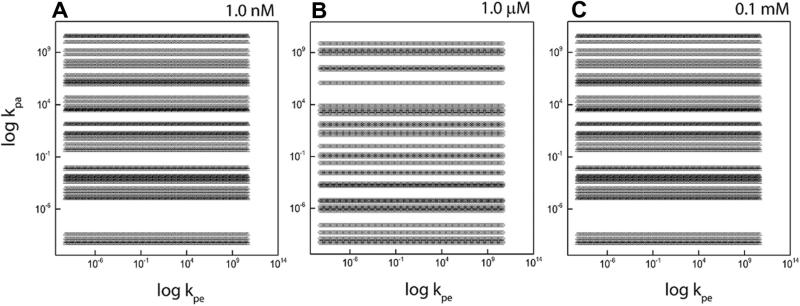
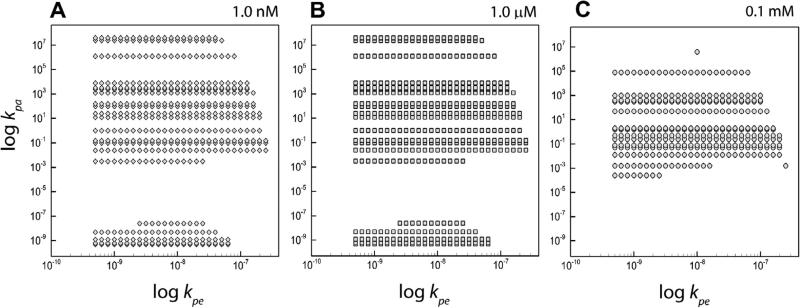
Additionally, we assume kep = kpe10–1 and kap = kpa10–6. This choice of ratio between forward and backward is made on the reasonable assumption that the associated molecules are more stable than the elongated ones. It then follows that the associated molecules are less likely to break down and contribute to the backward rates as compared to the elongated molecules. The order of magnitudes in our study, when assumed, are based upon our previous work [7] where rate constants were obtained by means of a pre-determined relationship relating the rate constants to the aggregate size, based upon the laws of statistical mechanics [7,11]. The results presented below are to be taken as representative cases and once again, chosen based on our previous work; a sweep over the entire parameter range is naturally impractical. Our first set of computations sweeps over the range 10–10 ≤ kpe ≤ 1010 and 10–10 ≤ kpa ≤ 1010 in steps of 100.1. Fig. 4 shows the results of our calculations on a log–log plot, for three different equilibrium concentrations; these are the rate constants that render the system (1)–(4) stable.
Fig. 4.
The figure shows the set of allowable rate constants based on the application of mathematical stability condition for the case γ1 = γ2 = 0.5 where all three stability constraints have been applied. The panels A, B and C show the variation of the graph with changing values of equilibrium concentrations Me and Pe.
This mathematical constraint, though valuable, is insufficient. While the stable parameter space is considerably reduced by this analysis, it remains prohibitively large. We therefore resort to a second condition, rooted in the biophysics of the problem. It can be argued that the 3200mer species obtained via elongation might correspond to a kinetically-stable species with the reaction proceeding much faster than the lateral association based on experiments described in the previous sub-section. Typically, the product arising out of lateral association must be the thermodynamically stable product since linear elongated protofibrils eventually coalesce into intertwined fibrils via association. This is also evident from the bulk, experimentally determined rates of the two processes (Fig. 2); the rate constant for elongation (kpe = 0.012 s–1) was determined to be about 1.4 times faster than that for the association reaction (kpa = 0.008 s–1) upon fitting the curves to a first order kinetic equation. As a result we argue that the following two conditions be satisfied. The first states that, over a sufficiently long time (denoted t* ), the magnitude of deviation from equilibrium for the elongated biomolecules would be less than those of the associated molecules. Hence
| (11) |
where 0 < γ1 < 1 needs to be satisfied. Here t* >> 1 represents a sufficiently long time when equilibrium is reached. Finally the vectors (ai, bi, ci, di)T for i = 1, 2, 3, 4 are the eigenvectors corresponding to the eigenvalues λi, respectively. The condition (11) is actually valid throughout the reaction, i.e. for all t and not just at the equilibrium state. As a result the value of γ1 varies between 0 and 1 with γ1 << 1 for t < t* while γ1 approaches closer to unity as t > t* . Since, it is unclear what exactly γ1 could be at the equilibrium, we have selected a range of values and identified the rate constants kbe, kba which satisfy the condition (11).
The second constraint is based in the fact that the kinetically stable molecules (elongated species) achieve equilibrium at a faster rate than the thermodynamically stable molecules (associated species). Therefore this requires that
| (12) |
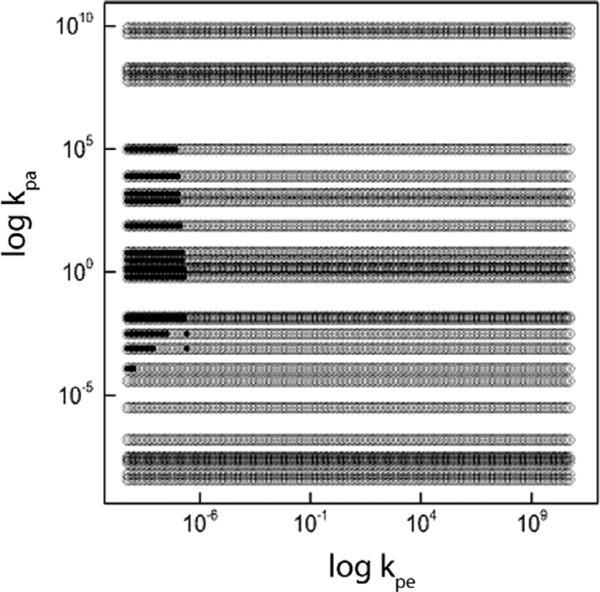
We performed additional calculations with the same fixed parameters as considered above and impose our conditions, namely Eqs. (11) and (12). Fig. 4 shows the resulting parameter space for the three different equilibrium values. Needless to say, the plots displayed here and the corresponding parameter values chosen are mere representative cases. The result of significance is that the parameter space (kpe, kpa) is considerably reduced. Tables 2 show the reduction in the allowable rate constants based on variations in γ1, γ2 and also the impact of the stability constraints. Fig.5 shows a sample plot of the allowed rate constant for thespecial case of γ1 = γ2 = 0.5 and Me = 1 μM and Pe = 1 μM. The open circles represent the case when the mathematical stability condition alone is applied while the closed circles indicate the cases where all three conditions have been applied.
Table 2.
The table shows the variation in the number of allowed values of kpa and kpe with changing values of γ1 and γ2. This representative table is shown for the case of Me = 1 μM and Pe = 1 μM.
| γ 2 |
γ
1
|
|||||
|---|---|---|---|---|---|---|
| 1.0 | 0.8 | 0.6 | 0.4 | 0.2 | 0.1 | |
| 1.0 | 530 | 530 | 530 | 530 | 530 | 530 |
| 0.8 | 524 | 524 | 524 | 524 | 524 | 524 |
| 0.6 | 511 | 511 | 511 | 511 | 511 | 511 |
| 0.4 | 306 | 306 | 306 | 306 | 306 | 306 |
| 0.2 | 101 | 101 | 101 | 101 | 101 | 101 |
| 0.1 | 82 | 82 | 82 | 82 | 82 | 82 |
Fig. 5.
The figure shows the set of allowable rate constants for the case γ1 = γ2 = 0.5 where all three stability constraints have been applied. The panels A, B and C show the variation of the graph with changing values of equilibrium concentrations Me and Pe.
To quantify this reduction in the space of allowed rate constants, we point to the Table 2 below which documents the number of allowed values of the rate constants as a function of the terms γ1 and γ2, after application of the stability (11) and (12), in addition to mathematical stability. As is shown in the table there is a dramatic drop in the number of rate constants with decreasing γ1 and γ2 reaching to an 85% drop as γ1 or γ2, for instance, drops from 1 to 0.1. The Table 2 is a representative case and one among the many cases explored based upon the values of Me and Pe from Table 1. In almost all of the cases, the reduction in the number of allowable rate constants is considerable with a decrease in the values of γ1 and γ2. The only unique case observed is the one where Me = 1 nM and Pe = 1 nM; here the rate constants are almost insensitive to γ1 but show a reduction of over 70% as γ2 : 1 → 0.1.
The mathematically and thermodynamically stable kpe and kpa values were compared for varying equilibrium concentrations for the monomers and protofibrils as shown in Table 1. The resulting rate constants were compared to search for matches. Sets 3, 4 and 5 had no overlap with any of the other sets. The overlap between sets 1, 2, 6, and 8 yielded 497 overlapping values. The overlap between sets 7 and 9 yielded 853 values. The overlap between sets 1, 2, 6, 7 and 9, as well as sets 7 and 8, yielded 4 overlapping values. The union of the overlapping values was used to simulate results using the full equation system which is discussed in the following subsection. Fig. 6.
Fig. 6.
The figure shows the set of allowable rate constants for the case γ1 = γ2 = 0.5 and Me = 1 μM and Pe = 1 μM. The open circles stand for the mathematically permissible values while the closed circles represent the permitted rate constants where all three stability constraints have been applied.
4.3. Solution to Eqs. (1)–(4)
We used the ODEs defined in (1)–(4) to simulate the entire fibril formation pathway. All the simulations were executed in Matlab's ODE solver using ode23s. We used each of the overlapping rate constants (for kpe and kpa) as obtained above in the simulation. Additionally, we used the following estimates for the remaining rate constants as discussed previously:
In order to compare the simulation results to the ThT fluorescence intensities measured from biochemical experiments we need to define a formal mapping scheme. The fluorescence intensity plots from experiments essentially show the cumulative effect of all protofibrils of a certain size (and beyond). Hence, from the simulation, one has to plot the cumulative effects from all the protofibrils (1600mers), elongated 3200mers (i.e., the E's) and associated 3200mers (i.e., the A's) that can be mapped directly to the experimental ThT estimates. In order to do this we will compute the following expression at each value of the simulation time:
| (13) |
where b is a constant scaling factor to map to the fluorescence sensitivity estimates.
Note that since the experimental set-up (and hence the conditions) for generating the intensities against different initial concentrations was the same, it is unlikely that the mapping constant b should be different for different initial concentrations. This is in contrast to what has been proposed in [11] to fit the curves conveniently to experiments without considering the intricacies of the system of equations. Our results have been generated keeping the value of b constant and set to b = 4750 which gave the least square error after several additional iterations of the simulation.
Also, the rounding-off errors in Matlab had to be considered to execute the simulations specifically because of the term M1600 in the ODEs. This was achieved by scaling the concentration of monomers to a value of 1 at each time step and computing the relative concentrations of the other 3 species based on that. Also, the each of the concentrations of the 4 species had to be scaled back to their actual values before the next iteration of the numerical simulation of the ODEs.
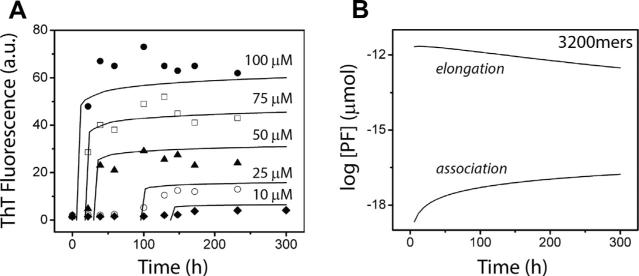
Fig. 7A shows the comparison of the numerical simulations with that of the ThT fluorescence based biochemical experiments of the entire pathway wherein we considered the five different initial monomer concentrations (of 10, 25, 50, 75 and 100 μM respectively) while that of the other 3 species were set to zero. It can be observed that even with a simplified model of only 4 species we can very closely reproduce the fibril formation dynamics as the simulation and experimental estimates are in close agreement. Note that, the simulated curves did not produce any lag times which is common for protein aggregation systems because model did not consider the nucleation phase separately. This can however be achieved simplistically by adding a delay term to the model or extending the model to consider more oligomers from the pre-nucleation phase both of which outline our future work in identifying the proper rate constants for the pathway.
Fig. 7.
The figure shows the results of our numerical simulations of the system (1)–(4) with the rate constants derived from the stability criteria. Multiple curves for different initial conditions are shown in panel (A) and compared with experimental data taken from [7]. Panel (B) shows the individual elongation and association curves in semi-log form.
Also, note that the Fig. 7A actually plots multiple curves for each initial monomer concentration corresponding to each of the rate constants estimated from the overlapping regions. However, there is minimal (or close to zero) deviation in the simulated plots for each of these rate constants showing the effectiveness of the stability analysis discussed above. It can be hence be argued that the identified combinations of rate constants are supposed to reproduce exactly the same pathway dynamics irrespective of the difference in their actual values.
Fig. 7B shows the actual concentrations of E (top curve) and A (bottom curve) produced by one of the identified rate constant combinations for the 100 μM initial monomer concentration test case. It can be observed that both E's and A's proceed towards dynamic equilibrium in the long time limit; however interestingly, the concentration of E's decrease with time as opposed to an increase in the concentration of A's. This behavior is however expected and illustrates the correctness of our model: initially the E's grow fast in the system and reach a dynamic equilibrium because of the high monomer concentrations. After sufficient number of P's were produced, the lateral association reactions take effect and shift the dynamic equilibrium of the E's by using up the P's in the system. This in turn triggers the backward elongation reactions and hence result in an over-all decrease in the concentration of E's.
5. Discussion
In summary, our paper proposes a stability based approach to estimate the rate constants for models discussing protein self assembly. In particular, we discuss the case of Aβ protein aggregation, which has been identified as a possible cause of Alzheimer's disease. A reduced order, four species model approximating the aggregation process including monomers, protofibrils (composed of 1600 monomers) which in turn lead to competing laterally associated and elongated proteins, is considered. The model is designed to capture the post nucleation phase of the reactions. The nucleation mass as of now remains unknown and needs to be identified before we can model the aggregation process in its entirety and is under continued investigation. The stability criterion that we propose allow us to select a highly reduced set of rate constants from a much larger search space. The selected rate constants are then employed to solve the original system of equations.
It has to be borne in mind that the exercise presented here is not directed towards estimating the rate constants and other parameters which would match the experimental data obtained. In other words, this is not a curve-fitting method to see the best fit obtained. Instead, our approach serves as a proof-of-concept for a first principle based mathematical methodology by which accurate rate constants for individual reactions involved in a complex process like amyloid aggregation could be obtained to assist a computational modeling. Our top-down modeling method is distinctly different from other curve-fitting paradigms in that the individual rate constants are validated for their contribution to the aggregation process. The main difference when compared to previous approaches arises from the fact that the experimental data is not used to force the model to fit but rather the bulk properties obtained from the experiments are used as leads to reduce the parameter space and to make physiochemically-relevant assumptions. Ideally, any model on Aβ aggregation should be able to identify the kinetic rate constants in the different phases of aggregation: pre-nucleation, post-nucleation, and fibril elongation/association. In [5] (and the references therein) the authors provide a detailed review on various models of Aβ aggregation which can be still classified as curve fitted models and fail to present a precise understanding of the process. Recently, Chung-Lee and colleagues have generated a detailed molecular-level model of insulin aggregation [11], which tries to understand the biophysics behind protein aggregation systems. However, their model cannot be directly used to understand the dynamics of Aβ aggregation wherein, the nucleation stage is itself unknown. In a bid to understand the complete dynamics of Aβ aggregation, authors in [7] propose a divide-and-conquer strategy by dissecting the Aβ42 aggregation process into the three biophysically distinct stages and present a detailed model of the third stage in the aggregation process that involves protofibril elongation as well as lateral association to fibrils and report the dynamics in terms of the kinetic rates associated with this stage. However, a major drawback in these approaches is the process of identifying the rate constants involved. Both [7,11] accomplished the rate constant identification stage manually (and arguably arbitrarily), and both fail to sweep the entire parameter space of rate constants. Hence the reported rate constants in [7,11] only show one possible solution (amongst many) that fit the experimental curve well which was chosen somewhat arbitrarily.
Since amyloid aggregation process is extremely complex involving a very large number of molecular interactions, the parameter space for finding accurate rate constants for individual reaction is extraordinarily large. Therefore, it is a challenge even for computing methods to perform the sweep to narrow down to realistic parameters. In this regard, mathematical stability analyses, despite its computational cost, as demonstrated here, can be extremely helpful in the modeling of amyloid aggregation. In this paper, we have simplified the Aβ reactions to a 4-species model to demonstrate this methodology as a proof-of-concept. Although understandably, the absence of nucleation mass prevents a perfect agreement with the experimental data (especially in the initial stages of the reactions), the trend between the elongation and association reactions have been consistent between the model and experimental data. We believe that there is a much stronger biophysical basis for the selection in this paper. The natural question that arises is if this methodology can be applied to obtain the appropriate rate constants for each individual reactions from monomers to 3200mers. At this stage this complex problem remains yet to be solved and is definitely a computational challenge. However, identification of the nucleation mass, would allow us to refine our existing model and suggest appropriate systems which can account for the pre and post nucleation processes effectively and is the ongoing subject of our investigation. In such a case, the methodology suggested here would be very helpful in identifying the individual rate constants.
Our efforts in this paper also indicate multiple solutions for possible rate constant combinations, each being equally good in determining the entire pathway dynamics. Arguably, fitting to the entire pathway dynamics curves obtained from the in vitro experiments will fail to identify which of these combinations is the best one to use and point to the fact that newer experimental/theoretical considerations have to be made to find a consensus. For example, the monomer depletion curve from HPLC measurements and molecular dynamic simulations on possible estimates of the nucleation mass can serve as additional evidence in down-selecting from these rate constant combinations and reducing the solution space. Hence the over-all goal of our model is much broader and can cater to any biological system characterized by a system of homogeneous ODEs. Our model makes a first-pass on the parameter estimation problem by down-selecting the possible solution space theoretically.
Acknowledgments
Authors AV and AM wish to thank Professors Han Schelvis, Nina Goodey and Marc Kasner for helpful discussions and comments. VR and PG thank NSF EAGER award (# 1049962) and VR thanks Mississippi INBRE funded by grants from the National Center for Research Resources (5P20RR016476-11) and the National Institute of General Medical Sciences (8 P20 GM103476-11) from the National Institutes of Health. VR and GG also thank Dr. Cannon for letting us use his DLS instrument. The authorship on this paper is assigned alphabetically. Authors GG and VR contributed to the experimental results and authors AM, PG and AV worked on the theoretical and numerical parts of the paper. A major portion of the paper is based on the MS thesis work of AM.
Footnotes
References
- 1.Cohen SIA, Vendruscolo M, Dobson CM, Knowles TPJ. Journal of Molecular Biology. 2012;421:160–171. doi: 10.1016/j.jmb.2012.02.031. [DOI] [PubMed] [Google Scholar]
- 2.Erdi P, Toth J. Mathematical Models of Chemical Reactions, Theory and Applications of Deterministic and Stochastic Models. Manchester University Press; Princeton University Press; Manchester: Princeton: 1989. [Google Scholar]
- 3.Ferrone F. Analysis of protein aggregation kinetics. Methods in Enzymology. 1999;309:256–274. doi: 10.1016/s0076-6879(99)09019-9. [DOI] [PubMed] [Google Scholar]
- 4.Ferrone F. Nucleation: the connections between equilibrium and kinetic behavior. Methods in Enzymology. 2006;412:285–299. doi: 10.1016/S0076-6879(06)12017-0. [DOI] [PubMed] [Google Scholar]
- 5.Morris AM, Watzky MA, Finke RG. Protein aggregation kinetics, mechanism, and curve-fitting: a review of the literature, Biochimica et Biophysica Acta. Proteins and Proteomics. 2009;1794:375–397. doi: 10.1016/j.bbapap.2008.10.016. [DOI] [PubMed] [Google Scholar]
- 6.Fowler DM, Koulov AV, Balch WE, Kelly JW. Functional amyloid-from bacteria to humans. Trends in Biochemical Sciences. 2007;32:217–224. doi: 10.1016/j.tibs.2007.03.003. [DOI] [PubMed] [Google Scholar]
- 7.Ghosh P, Kumar A, Datta B, Rangachari V. Dynamics of protofibril elongation and association involved in Abeta42 peptide aggregation in Alzheimer's disease. BMC Bioinformatics. 2010;11(Suppl. 6):S24. doi: 10.1186/1471-2105-11-S6-S24. [DOI] [PMC free article] [PubMed] [Google Scholar]
- 8.Glendinning P. Stability, Instability and Chaos: An Introduction to the Theory of Nonlinear Differential Equations. Cambridge University Press; 1994. [Google Scholar]
- 9.Hettema H. Hyle International Journal for Philosophy of Chemistry. 2013;18:145–173. [Google Scholar]
- 10.Kondepudi D. Introduction to Modern Thermodynamics. second ed. Wiley; 2008. [Google Scholar]
- 11.Lee CC, Nayak A, Sethuraman A, Belfort G, McRae GJ. A three-stage kinetic model of amyloid fibrillation. Biophysical Journal. 2007;92:3448–3458. doi: 10.1529/biophysj.106.098608. [DOI] [PMC free article] [PubMed] [Google Scholar]
- 12.Levine H. Thioflavine T interaction with synthetic Alzheimer's disease β-amyloid peptides: detection of amyloid aggregation in solution. Protein Science. 1993;2(3):404–410. doi: 10.1002/pro.5560020312. [DOI] [PMC free article] [PubMed] [Google Scholar]
- 13.Mazumdar J. An Introduction to Mathematical Physiology and Biology. second ed. Cambridge University press; 1999. [Google Scholar]
- 14.Morris A, Watzky M, Agar J, Finke R. Fitting neurological protein aggregation kinetic data via a 2-step, minimal/Ockham's razor model:? the Finke–Watzky mechanism of nucleation followed by autocatalytic surface growth. Biochemistry. 2008;47(8):2413–2427. doi: 10.1021/bi701899y. [DOI] [PubMed] [Google Scholar]
- 15.Morris A, Finke R. α-synuclein aggregation variable temperature and variable pH kinetic data: a re-analysis using the Finke–Watzky 2-step model of nucleation and autocatalytic growth. Biophysical chemistry. 2009;140:9–15. doi: 10.1016/j.bpc.2008.11.003. [DOI] [PubMed] [Google Scholar]
- 16.Nichols MR, et al. Growth of β-amyloid(1–40) on and lateral association. characterization of distinct products by light scattering and atomic force microscopy. Biochemistry. 2002;41(19):6115–6127. doi: 10.1021/bi015985r. [DOI] [PubMed] [Google Scholar]
- 17.Pallitto M, Murphy RA. Mathematical model of the kinetics of β-amyloid fibril growth from the denatured state. Biophysical Journal. 2001;81:1805–1822. doi: 10.1016/S0006-3495(01)75831-6. [DOI] [PMC free article] [PubMed] [Google Scholar]
- 18.Pauling L. General Chemistry: Dover Books in Chemistry Series. Dover Publications; 1988. [Google Scholar]
- 19.Selkoe DJ. Alzheimer's disease: genes, proteins, and therapy. Physiological Reviews. 2001;81:741–766. doi: 10.1152/physrev.2001.81.2.741. [DOI] [PubMed] [Google Scholar]
- 20.Strogatz S. Nonlinear dynamics and chaos: with applications to physics, biology, chemistry, and engineering (studies in nonlinearity) first ed. Westview Press; 2001. [Google Scholar]


