

Abstract
Background: Metastatic renal cell carcinoma (mRCC) patients treated with anti-vascular endothelial growth factor (VEGF) therapies demonstrate promising outcomes but not all patients benefit. Factors that predict response remain to be elucidated.
Patients and methods: Nephrectomy material from 37 patients with mRCC receiving bevacizumab ± erlotinib was used for protein and gene expression assessment. Protein lysates were subjected to reverse-phase protein array profiling. RNA extracts were used to carry out gene expression microarray-based profiling. Normalized protein and gene expression data were correlated with overall survival (OS) and progression-free survival (PFS) using univariate Cox hazard model and linear regression. Immunoblotting was carried out to validate the results.
Results: High protein levels of AMP-activated protein kinase and low levels of cyclin B1 (CCNB1) were associated with longer OS and PFS. Further validation revealed reduced expression and activation of phosphoinositide 3-kinase (PI3K) pathway components and cell cycle factors in patients with prolonged survival after therapy. Gene expression analysis revealed up-regulation of PI3K- and cell cycle-related pathways in patients with shorter PFS.
Conclusions: The OS and PFS of bevacizumab ± erlotinib-treated patients with renal cell carcinoma were associated with changes in expression of protein and gene expression markers related to PI3K pathway and cell cycle signaling.
Keywords: angiogenesis, bevacizumab, biomarker profiling, gene expression arrays, protein arrays, renal cell carcinoma
introduction
Aberrant angiogenesis is considered a hallmark of clear cell renal cell carcinoma (ccRCC), mechanistically linked to the genetic pathogenesis of this disease. In particular, the majority (80%) of ccRCC cases harbor inactivating mutations or deletions of VHL [1], resulting in constitutive activation of hypoxia-inducible factor (HIF) and subsequent induction of target genes, including VEGF [2, 3]. Approximately 30% of patients with RCC have metastatic disease either at initial presentation or after nephrectomy. Metastatic RCC (mRCC) is refractory to radiotherapy and chemotherapy, and immunotherapy benefits only a few patients; therefore, targeting vascular endothelial growth factor (VEGF)-dependent angiogenesis provides a rational and more effective approach to this disease [4].
Bevacizumab, an antibody against VEGF [5], showed efficacy when administered as monotherapy in a phase II trial evaluating patients with cytokine refractory mRCC. Progression-free survival (PFS) was significantly prolonged in patients who received bevacizumab 10 mg/kg i.v. every 2 weeks compared with patients who received placebo [6]. Two randomized phase III trials comparing bevacizumab plus interferon versus interferon alone or interferon plus placebo showed longer PFS times in favor of the bevacizumab arms, lending credence to blocking the VEGF pathway in mRCC [7]. Preclinical data indicate that the epidermal growth factor receptor (EGFR) pathway is up-regulated in RCC and that blocking both the EGFR and the VEGF pathways may provide synergy [8, 9]. However, a randomized phase II trial of bevacizumab plus erlotinib versus bevacizumab alone in patients with mRCC failed to show any clinical benefit from the addition of erlotinib [10, 11].
The identification of the molecular factors that predict which subset of patients benefits from bevacizumab and the elucidation of the mechanisms of resistance to this agent will aid in patient selection and may guide therapy development.
In the current study, we explore post-treatment protein and gene expression markers in nephrectomy specimens in mRCC patients treated on a phase II trial of presurgical bevacizumab (with or without erlotinib) and evaluate their association with outcome.
patients and methods
patient selection and evaluation
After signing informed consent, patients were enrolled into an Institutional Research Board-approved, phase II, single-arm clinical trial conducted at M.D. Anderson Cancer Center. Eligible patients were required to have mRCC with predominant (>50%) clear cell histology, be eligible for nephrectomy, have measurable disease, no brain metastasis, no prior systemic therapy and a performance status of 0 or 1 [12]. Fifty patients were enrolled in the study, of which, 38 (76%) were Caucasian, 9 (18%) Hispanic and 3 (6%) African American. Thirty-seven (74%) patients were male. Median age of patients on study was 61 years.
patient treatment
Patients received bevacizumab 10 mg/kg i.v. every 14 days for four infusions plus erlotinib 150 mg p.o. daily for 8 weeks. Nephrectomy was carried out 2 weeks after the last dose of erlotinib and 4 weeks after the last dose of bevacizumab. Twenty-three patients received bevacizumab and erlotinib, and 27 patients received bevacizumab alone after a protocol amendment in December 2005 to remove erlotinib. One cycle was defined as 14 days of treatment.
tumor response assessment
After four cycles of presurgical treatment with bevacizumab–erlotinib or bevacizumab alone (after amendment), patients were restaged and response in primary and metastatic lesions was assessed by comparing the longest tumor diameter (measured in centimeters) with that recorded at baseline. Percentage change between baseline and 8 weeks was recorded. Response was assessed using RECIST.
tissue collection and evaluation
Post-treatment nephrectomy specimens were snap-frozen in liquid nitrogen. Tissue areas adjacent to the material used in protein arrays were paraffin-embedded for hematoxylin–eosin (H&E). The paraffin-embedded blocks were cut and processed according to previously established protocols [13]. H&Es for post-treatment tumors were reviewed (PT) using light microscopy in a uniform blinded fashion, without knowledge of outcome, clinical stage, histological grade or pathologic substage of the primary tumor.
protein preparation
Pieces from frozen tissues were cut by placing specimens on a dry ice block to prevent thawing. The excised samples were placed directly in ice-cold lysis buffer [1% Triton X-100, 50 mm HEPES (pH 7.4), 150 mmol/l NaCl, 1.5 mmol/l MgCl2, 1 mmol/l ethylene glycol tetraacetic acid, 100 mmol/l NaF, 10 mmol/l Na pyrophosphate, 1 mmol/l Na3VO4, 10% glycerol, 1 mmol/l phenylmethylsulfonyl fluoride and 10 μg/ml aprotinin] and homogenized immediately. After centrifugation, protein concentration in the supernatants was determined by bicinchoninic acid (Pierce, Thermo Scientific, Inc., Rockford, IL).
reverse-phase protein arrays
Protein extracts were normalized to 1 μg/μl concentration using bicinchoninic acid assay, boiled with 1% sodium dodecyl sulfate (SDS) (with beta-mercaptoethanol) and manually diluted in 6 twofold serial dilutions with lysis buffer. A GeneTAC arrayer (Genomic Solutions, Inc., Ann Arbor, MI) created array spots on nitrocellulose-coated FAST slides (Schleicher & Schuell BioScience, Inc., Keene, NH) from the serial dilutions [14, 15]. Each slide was probed with a validated primary antibody, and the signal was amplified using a DakoCytomation catalyzed system (Dako North America, Inc., Carpinteria, CA). A secondary antibody (anti-mouse or anti-rabbit) was used as a starting point for amplification. The reverse-phase protein array (RPPA) slides were scanned by the Hewlett-Packard scanner and its companying scanning software, and the slide images were quantified by the software MicroVigene (VigeneTech Inc., Carlisle, MA), producing raw signal intensities. The latter were then processed by the R package SuperCurve [14] developed by the Department of Bioinformatics and Computational Biology at M. D. Anderson Cancer Center (http://bioinformatics.mdanderson.org/OOMPA). The protein concentrations of each set of slides were normalized by median polish, producing normalized logarithmic signal intensities [16]. Student’s t-test was used to evaluate statistical significance of protein expression levels between sample groups. To generate heat maps, Treeview (University of Glasgow) and Cluster software was used [17].
immunoblotting
Protein lysates of the same concentration (50 μg of total protein per sample) were loaded on 8% SDS–polyacrylamide gel electrophoresis gels, resolved and blotted to polyvinylidene fluoride membranes. The membranes were incubated with primary antibodies [AMP-activated protein kinase (AMPK) rabbit polyclonal antibody at 1:1000 dilution (Cell Signaling Technology, Inc., Danvers, MA), GAPDH mouse monoclonal at 1:5000 (Applied Biosystems/Ambion, Austin, TX), Cyclin B1 rabbit monoclonal at 1:1000 (Epitomics, Inc., Burlingame, CA)]. The interaction between primary and secondary antibodies was detected using chemiluminescence (Pierce) and by exposure to Kodak X-OMAT AR film (KODAC, Rochester, NY). By analyzing images from the scanned films using ImageJ 1.41 software (NIH: http://rsb.info.nih.gov/ij/), densitometric measurements of the bands were carried out and normalized to loading controls (GAPDH). Student’s t-test was used to evaluate statistical significance of protein expression levels between sample groups.
gene expression microarrays
Frozen tissue samples from treated patients were used for gene expression profiling (sample names shown in supplemental Table S1, available at Annals of Oncology online). Total RNA extraction and purification from tissue samples were carried out using TRIzol reagent (Invitrogen, Carlsbad, CA) as per the manufacturer’s protocol. Preparation of labeled complementary RNA and hybridization to HGU133 Plus 2.0 GeneChips was done as per the manufacturer’s recommended protocol (GeneChip Expression Analysis Technical Manual, Affymetrix, Rev 5.0, November 2004).
The raw data (CEL files) were normalized and analyzed using dCHIP software as previously described [18]. For changes in gene expression between high and low PFS groups, a P value cut-off of 0.05 was chosen. The degree of differential gene expression was expressed in t scores. Differentially expressed genes were subjected to pathway analysis. Tables containing array probe set identifiers and corresponding t scores of differential expression were uploaded in Ingenuity Pathways Analysis software (Ingenuity Systems, Redwood City, CA) for an Ingenuity analysis that generates networks of gene interactions and assigns gene ontology descriptions of biological function on the basis of information retrieved from the software’s literature database. Right-tailed Fisher’s exact test was used to determine the probability that each biological function assigned to each network was due to chance alone by comparing the number of genes from the gene expression profile that participate in a given biological function with the total number of occurrences of those genes in all functional annotations stored in the software’s database.
statistical analysis
Linear regression was carried out with clinical variables, including age, gender, race and Fuhrman nuclear grade (FNG), or with protein and mRNA marker expression levels as predicting variables and tumor size response as the dependent variable [19]. The same clinical or marker expression variables were used to test association with PFS and overall survival (OS) outcomes using a Cox proportional hazard model. P values were adjusted by the classical Benjamini–Hochberg method with P < 0.05 considered significant [20].
results
cell cycle and proliferation protein markers correlate with OS and PFS
In order to detect proteins associated with clinical outcome after treatment with bevacizumab ± erlotinib, protein extracts from 37 primary tumors were spotted on protein arrays and assessed for expression of 36 protein markers (supplemental Figure S1, supplemental Table S1, available at Annals of Oncology online). The antibodies assessed represented a range of signaling networks, including growth and proliferation pathways, cell cycle control, extracellular matrix and angiogenesis effector molecules. Replicate (separate lysate from the same patient) and duplicate (same lysate spotted twice) preparations from the same patient showed very similar protein expression patterns [clustering within a median Pearson distance of 0.82, for most of the patient samples with such replicate and duplicate preparations (14 of the 17 samples)], indicating reproducibility of the technique (supplemental Figure S1, available at Annals of Oncology online).
In order to identify protein markers associated with survival and PFS, normalized log intensities that correspond to protein expression levels were tested for correlation with OS and PFS by using univariable Cox proportional hazard model analysis. The Cox model showed AMPK and cyclin B1 (CCNB1) significantly correlated with OS and PFS (Figure 1). In particular, high AMPK protein levels were associated with longer OS and PFS [P = 0.0612 and P = 0.0378, false discovery rate (FDR) of 10%]. On the other hand, high CCNB1 levels were associated with shorter OS and PFS (P = 0.028 and P = 0.0378, FDR = 10%). Other covariables, including age, race, gender and FNG, did not correlate with clinical outcome. In addition, there was no association between erlotinib treatment and outcome [12]. With respect to protein marker changes between the two treatment arms (bevacizumab alone versus bevacizumab plus erlotinib), there were three markers that showed statistically significant change. PTEN increased in the combination treatment (P = 0.0033), whereas p-TSC2 and p27 increased in the bevacizumab monotherapy group (P = 0.0025 and P = 0.0021, respectively) (from data in supplemental Table S1, available at Annals of Oncology online).
Figure 1.
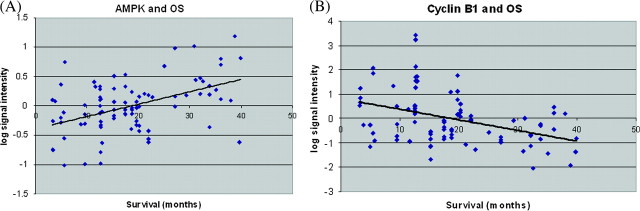
Differentially expressed protein markers that correlate with overall survival (OS). AMP-activated protein kinase (AMPK) [shown in (A)] and cyclin B1 [shown in (B)] protein levels expressed in normalized log signal intensities are shown for each tumor sample as correlated with OS from the corresponding patients.
marker validation confirms that AMPK is induced in patients with longer OS
In order to confirm that differences in AMPK and cyclin B1 expression are associated with clinical outcome, we employed immunoblotting. Protein lysates from primary tumors from seven patients with prolonged OS times (>30 months) and seven patients with short OS times (<10 months) were tested for expression of AMPK and cyclin B1. In the case of cyclin B1, we were not able to detect signal (data not shown), but in the case of AMPK, the results were consistent with the RPPA data. In particular, AMPK expression was increased in the patients with prolonged OS compared with the ones with short OS (Student’s t-test: P = 0.0035) (supplemental Figure S2, available at Annals of Oncology online). The protein levels were also tested in a control set of 25 untreated patient samples in order to examine whether the differences in protein expression were specific to treatment efficacy. AMPK levels were increased in the prolonged OS group compared with untreated controls (Student’s t-test: P = 0.0023) (supplemental Figure S2, available at Annals of Oncology online).
changes in AMPK protein expression inversely correlate with changes in the signaling status of the phosphoinositide 3-kinase pathway
AMPK is a tumor suppressor inhibiting the cell growth and proliferation effects of the phosphoinositide 3-kinase (PI3K) pathway via indirect and direct action on various signaling molecules. We sought to examine protein expression (based on the RPPA data in supplemental Figure S1, supplemental Table S1, available at Annals of Oncology online) of PI3K pathway components in the prolonged OS (>30 months) and short OS (<10 months) patient sample sets and evaluate whether the predicted up- or down-regulation of various PI3K pathway components occurred. The same markers were also evaluated in RPPA-based data from untreated patients (supplemental Table S2, available at Annals of Oncology online). As AMPK exerts its effect on the PI3K pathway only if it is phosphorylated, we also tested phospho-AMPK (pAMPK) levels in the same patient sample sets to confirm the functional relevance of our findings. We found that pAMPK levels were induced in the patients with prolonged OS when compared with untreated patients (P = 0.00044) or with patients with short OS (P = 0.0003) (Figure 2). The signal intensities of the phosphorylated form of AKT (pAKT-serine473) detected by RPPA in samples from the prolonged OS group were compared with the intensities from samples of the short OS group as well as untreated patients. The levels of pAKT were inversely correlated with the total AMPK and pAMPK levels, showing a statistically significant increased expression in the short OS group (P = 0.02) and borderline increased expression in the untreated controls (P = 0.06) when compared with longer survivors (Figure 2). Similarly, one of the downstream effectors of pAKT, phospho-S6, exhibited similar patterns to pAKT expression (P = 0.014 for prolonged versus short survival groups, P = 0.05 for prolonged survival versus untreated groups) (Figure 2). Importantly, another tumor suppressor that inhibits AKT activation, PTEN, showed increased expression in the prolonged OS group compared with short OS groups and untreated controls (P = 0.003 for prolonged versus short OS groups, P = 0.0004 for prolonged OS versus untreated groups) (Figure 2).
Figure 2.

pAMPK and AKT pathway protein marker levels according to survival and treatment status. pAMPK, pAKT-serine 473, PTEN and pS6 serine 235 protein levels (expressed as normalized log intensities) from the RPPA experiment are shown in patient groups of long and short survival after treatment and in untreated controls. Error bars refer to standard error.
Expression levels of pAKT, pS6, pAMPK and PTEN across the entire spectrum of OS values of the patients participating in the study are shown in Figure 3 (the expression values are also shown in more detail in supplemental Tables S1 and S2, available at Annals of Oncology online).
Figure 3.
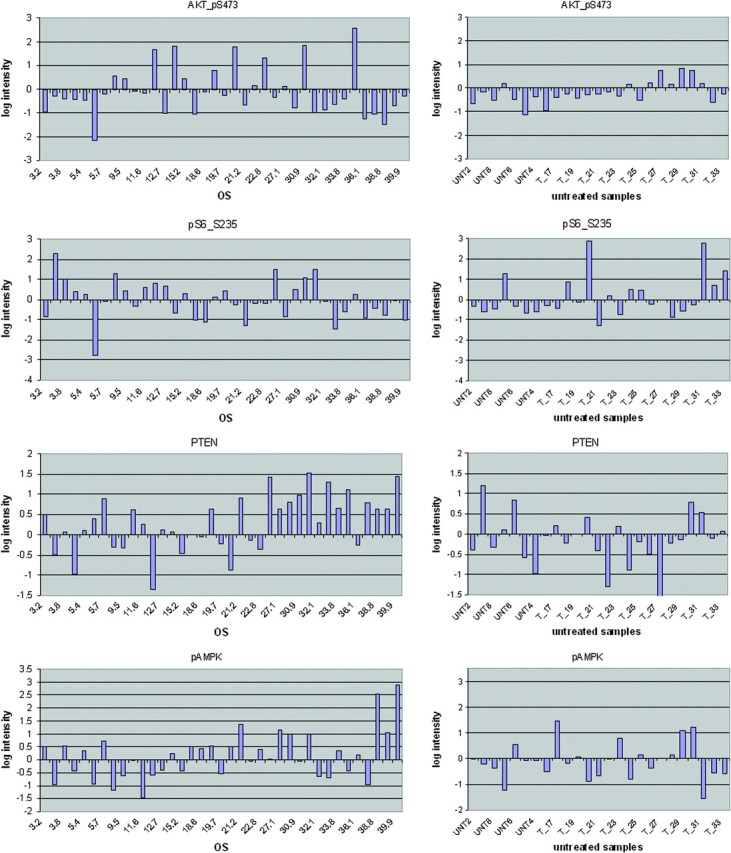
Detailed pAMPK and AKT pathway protein marker levels for treated and untreated patients. Analytical data of pAMPK, pAKT-serine 473, PTEN and pS6 serine 235 protein levels (expressed as normalized log intensities) from the RPPA experiment are shown for patients in the clinical trial (four panels, left side) and untreated patients (four panel, right side. Overall survival (OS in months) is shown for all treated patients. For samples where replicate preparations were available, the logarithmic intensities shown represent averages.
cell cycle and proliferation mRNA markers are differentially expressed between short and prolonged PFS groups of treated patients
Global gene expression profiling was carried out as a means of evaluating the effect of therapy on the renal cancer transcriptome and in order to explore the potential interactions between the transcriptome and the proteomic changes captured by RPPA. We obtained gene expression data on 31 of the 37 patients analyzed with RPPA and generated associations with pathways and signaling molecules using Ingenuity software.
Gene expression data were analyzed to identify genes that were differentially expressed in patient tumor samples of prolonged (≥10 months) or short (<10 months) PFS. One thousand seven hundred and eighty-six differentially expressed genes with P < 0.05 (supplemental Table S3, available at Annals of Oncology online) were further subjected to pathway analysis using the Ingenuity Pathway Analysis software. The analysis revealed that genes falling into distinct functional categories (supplemental Figure S3, available at Annals of Oncology online) and canonical pathways (supplemental Figure S4, available at Annals of Oncology online) were differentially expressed according to PFS status. In particular, genes related to cell cycle control (supplemental Figure S3A, supplemental Figure S4A, available at Annals of Oncology online) and p53 signaling (supplemental Figure S3B, supplemental Figure S4B, available at Annals of Oncology online) represented the most prominent groups in this analysis. Genes in these categories showed reduced expression in samples from patients with long PFS. Specific genes from the functional category of cell cycle control that exhibited low expression in the prolonged PFS group included growth factors such as erythropoietin (EPO) and interleukin 6 (IL6), receptors such as integrin beta 1 (ITGB1), Notch 1 and CD40, signaling molecules such as CDC42 and Src homology 2 domain containing transforming protein 1 (SHC1), transcription factors such as SMAD3, RELA and JUN, cyclins such as CCNE2, cyclin-dependent kinases (CDK2, CDK8) and cell cycle division genes (CDC2, CDC7). This Ingenuity analysis-generated pathway is related to one of the protein markers identified by RPPA, CCNB1 (cyclin B1) because both CCNB1 and factors in the pathway are involved in cell cycle and because the protein products of certain cell cycle division genes in this pathway (CDC2, CDC7) can directly bind CCNB1 and affect its function. The transcript of the gene CCNB1 was not found differentially expressed in our study (data not shown), implying that the changes in protein levels of this gene may involve post-transcriptional mechanisms.
Important outcome related genes were also found in the p53 signaling gene group (supplemental Figure S3B, supplemental Figure S4B, available at Annals of Oncology online). Down-regulation of p53 signaling genes [such as p53-regulated apoptosis-inducing protein 1 (P53AIP1), mediator complex subunit 1 (MED1) and MDM2] as well as genes in the PI3K pathway (AKT2 and the activation domain subunit of PI3 Kinase, PIK3C2A) were associated with prolonged PFS. The observations on AKT2 and PIK3C2A gene expression levels indicate that reduced signaling through the PI3K pathway occurs in patients with prolonged PFS, which is consistent with the findings related to the proteomic markers pAKT, pS6, pAMPK and PTEN. Of note, the transcript for AMPK was not differentially expressed in patients with short versus long PFS (data not shown).
These data show that expression of genes related to the PI3K and cell cycle control pathways are differentially expressed based on PFS status in bevacizumab ± erlotinib-treated patients, further underscoring their importance in engendering resistance to antiangiogenic therapy.
conclusions
In the current study, by employing high-throughput gene expression and protein microarray screening approaches, we identified protein and gene expression markers associated with treatment outcome in bevacizumab- and erlotinib-treated nephrectomy specimens from mRCC patients. In particular, high protein levels of AMPK and low protein levels of cyclin B1 (CCNB1) are correlated with favorable OS and PFS. More importantly, dichotomization of data shows that phosphorylated AMPK is also associated with improved outcome in these patients. These trends are consistent with the biological function of these molecules.
CCNB1 is a mitosis-promoting cyclin important in G2–M transition [21], disruption of which is implicated in cancer pathogenesis, and is anticipated to be induced in growing tumors refractory to therapy. In addition, increased levels and aberrant localization of CCNB1 were implicated in clinical progression of renal cell carcinoma in patients [22]. Other factors associated with cell cycle control were found to exhibit increased levels of gene expression in the patients with poor survival in this study. In particular, cell division cycle factors CDC2, CDC7 and CDC25A, all participating in binding and activating cyclin B1 and other cyclins [23], showed decreased expression in patients with prolonged PFS, consistent with the CCNB1 protein level findings.
AMPK was first described as a sensor of cellular energy status and a regulator of metabolism. Recent studies show that the tumor suppressor LKB1 is an AMPK activator [24] and that the tumor-suppressors p53 and TSC2 lie downstream [25]. AMPK may block cell growth and proliferation through inhibition of the AKT/mTOR pathway. In particular, activated AMPK (pAMPK) phosphorylates TSC2 and increases the ability of the TSC1–TSC2 complex to inhibit mTOR [26]. In the absence of, or after inactivation of AMPK, phospho-AKT (AKT activated by PI3K) inhibits the function of TSC1–TSC2, leading to mTOR activation. Substrates of mTOR include translation initiation factors (S6K which phosphorylates S6, and 4-EBP1), as well as serine 473 of AKT as part of a positive feedback loop [27]. Inhibition of AKT is also accomplished by PTEN, a phosphatase that prevents PI3K activation [28]. Other potential mechanisms of AMPK-mediated inhibition of AKT include IRS-1 phosphorylation by AMPK and subsequent repression of PI3K [29], and AKT dephosphorylation by AMPK-activated protein phosphatase 2A [30]. It is interesting to note that the hereditary RCC syndrome Birt Hogg Dube is due to a mutation in folliculin, which is regulated by AMPK signaling via folliculin interacting protein 1 (FNIP1) [31], lending credence to the importance of AMPK pathway regulation in RCC carcinogenesis.
Further analysis of the PI3K pathway in our patients demonstrates an expected and balanced up- or down-regulation of PI3K pathway components, including pAKT S473, PTEN, and pS6. Gene expression data support these observations, with decreased mRNA levels of AKT2 and PI3K subunits. Our findings that AMPK and pAMPK levels are higher and PI3K pathway activation is lower in treated long-term survivors compared with untreated controls indicate that antiangiogenesis therapy induces or selects for tumors possessing elevated levels of AMPK and a repressed AKT/mTOR pathway.
The PI3K pathway has been previously implicated in renal carcinogenesis. Patients with primary RCC and higher levels of AKT have a poorer prognosis [32]. In sorafenib-treated patients, higher levels of AKT S473 are associated with a shorter PFS [33]. RCC primary tumors and cell lines present with PI3K/AKT pathway activation [34] concurrent with reduced levels of PTEN [35]. The downstream consequences of PI3K pathway activation on tumor progression in RCC are multifactorial. Beyond the obvious effect of AKT activation on survival, protein production and early response factor transcription, the PI3K pathway is likely to contribute to higher levels of angiogenesis in RCC, as HIF1α and HIF2α protein expression is positively influenced by active mTOR [36, 37]. Other studies have shown that PI3K signaling contributes to enhanced angiogenesis in RCC [36]. Positive feedback pathways may also exist. A recent study showed that elevated HIF1α and HIF2α in VHL-null tumors leads to increased AKT/mTOR activation as reflected by increased phosphorylation levels of S6 [38], emphasizing an interplay between VHL mutational status and PI3K pathway activation. Thus, higher levels of PI3K pathway activation are likely proangiogenic and will influence the endothelial phenotype in RCC. Our data indicate that targeting the PI3K pathway could benefit RCC patients both in the presence or in the absence of antiangiogenic therapy. Studies with mTOR inhibitors have demonstrated single-agent activity [39, 40]. Furthermore, multiple PI3K pathway targeted drugs are in or entering clinical trial. It is possible that PI3K pathway activation will prove to be a more precise marker to select patients most likely to benefit from PI3K pathway inhibition.
Combination of bevacizumab with erlotinib did not exhibit any difference in outcome when compared with bevacizumab monotherapy [12], consistent with previous studies [10, 11]. The protein markers differentially expressed between the two treatment arms (PTEN, p27 and p-TSC2) reveal modulation of components of the PI3K (PTEN and p-TSC2) and cell cycle (p27) pathways upon addition or exclusion of erlotinib. Although these shifts may be of biological importance, our sample size may be too small to provide a corresponding clinical readout. An alternate explanation is that since the addition of erlotinib results in up-regulation of PTEN, but a corresponding relative down-regulation of p27, these changes result in a mutual canceling-out of their effect on tumor biology.
In summary, we show that protein and gene expression profiling revealed markers differentially expressed in patients who achieved improved outcome after bevacizumab ± erlotinib therapy. Our data indicate that modulation of the PI3K pathway, AMPK and cyclin B1 occur as a result of treatment and that resistance to antiangiogenic therapy is associated with PI3K pathway activation. As effective targeted therapies are becoming available for clinical research, it will be important to test a combination of antiangiogenic agents with agents that target the cell cycle and PI3K pathways in patients with advanced RCC.
funding
Partially funded by the Mary K. Chapman Fund for Renal Cell Carcinoma Molecular Research, The Mary K. Chapman Foundation.
disclosure
EJ: Genentech research funding, advisory board member. DT-F, NT, PT, WL, DP, BT, GBM: no conflicts of interest.
Supplementary Material
References
- 1.Banks RE, Tirukonda P, Taylor C, et al. Genetic and epigenetic analysis of von Hippel-Lindau (VHL) gene alterations and relationship with clinical variables in sporadic renal cancer. Cancer Res. 2006;66:2000–2011. doi: 10.1158/0008-5472.CAN-05-3074. [DOI] [PubMed] [Google Scholar]
- 2.Iliopoulos O, Levy AP, Jiang C, et al. Negative regulation of hypoxia-inducible genes by the von Hippel-Lindau protein. Proc Natl Acad Sci U S A. 1996;93:10595–10599. doi: 10.1073/pnas.93.20.10595. [DOI] [PMC free article] [PubMed] [Google Scholar]
- 3.Maxwell PH, Wiesener MS, Chang GW, et al. A randomized trial of bevacizumab, an anti-vascular endothelial growth factor antibody, for metastatic renal cancer [see comment] N Engl J Med. 2003;349:427–434. doi: 10.1056/NEJMoa021491. [DOI] [PMC free article] [PubMed] [Google Scholar]
- 4.Rathmell WK, Wright TM, Rini BI. Molecularly targeted therapy in renal cell carcinoma. Expert Rev Anticancer Ther. 2005;5:1031–1040. doi: 10.1586/14737140.5.6.1031. [DOI] [PubMed] [Google Scholar]
- 5.Ferrara N, Hillan KJ, Gerber HP, Novotny W. Discovery and development of bevacizumab, an anti-VEGF antibody for treating cancer. Nat Rev Drug Discov. 2004;3:391–400. doi: 10.1038/nrd1381. [DOI] [PubMed] [Google Scholar]
- 6.Yang JC, Haworth L, Sherry RM, et al. A randomized trial of bevacizumab, an anti-vascular endothelial growth factor antibody, for metastatic renal cancer. N Engl J Med. 2003;349:427–434. doi: 10.1056/NEJMoa021491. [DOI] [PMC free article] [PubMed] [Google Scholar]
- 7.Escudier B, Pluzanska A, Koralewski P, et al. Bevacizumab plus interferon alfa-2a for treatment of metastatic renal cell carcinoma: a randomised, double-blind phase III trial. Lancet. 2007;370:2103–2111. doi: 10.1016/S0140-6736(07)61904-7. [DOI] [PubMed] [Google Scholar]
- 8.Ciardiello F, Caputo R, Bianco R, et al. Inhibition of growth factor production and angiogenesis in human cancer cells by ZD1839 (Iressa), a selective epidermal growth factor receptor tyrosine kinase inhibitor. Clin Cancer Res. 2001;7:1459–1465. [PubMed] [Google Scholar]
- 9.Riedel F, Gotte K, Li M, et al. EGFR antisense treatment of human HNSCC cell lines down-regulates VEGF expression and endothelial cell migration. Int J Oncol. 2002;21:11–16. [PubMed] [Google Scholar]
- 10.Bukowski RM, Kabbinavar FF, Figlin RA, et al. Randomized phase II study of erlotinib combined with bevacizumab compared with bevacizumab alone in metastatic renal cell cancer [see comment] J Clin Oncol. 2007;25:4536–4541. doi: 10.1200/JCO.2007.11.5154. [DOI] [PubMed] [Google Scholar]
- 11.Hainsworth JD, Sosman JA, Spigel DR, et al. Treatment of metastatic renal cell carcinoma with a combination of bevacizumab and erlotinib. J Clin Oncol. 2005;23:7889–7896. doi: 10.1200/JCO.2005.01.8234. [DOI] [PubMed] [Google Scholar]
- 12.Jonasch E, Wood CG, Matin SF, et al. Phase II presurgical feasibility study of bevacizumab in untreated patients with metastatic renal cell carcinoma. J Clin Oncol. 2009;27:4076–4081. doi: 10.1200/JCO.2008.21.3660. [DOI] [PMC free article] [PubMed] [Google Scholar]
- 13.Abrahams NA, Tamboli P. Oncocytic renal neoplasms: diagnostic considerations. Clin Lab Med. 2005;25:317–339. doi: 10.1016/j.cll.2005.01.006. vi. [DOI] [PubMed] [Google Scholar]
- 14.Hu J, He X, Baggerly KA, et al. Non-parametric quantification of protein lysate arrays. Bioinformatics. 2007;23:1986–1994. doi: 10.1093/bioinformatics/btm283. [DOI] [PubMed] [Google Scholar]
- 15.Tibes R, Qiu Y, Lu Y, et al. Reverse phase protein array: validation of a novel proteomic technology and utility for analysis of primary leukemia specimens and hematopoietic stem cells. Mol Cancer Ther. 2006;5:2512–2521. doi: 10.1158/1535-7163.MCT-06-0334. [DOI] [PubMed] [Google Scholar]
- 16.Hennessy BT, Lu Y, Poradosu E, et al. Pharmacodynamic markers of perifosine efficacy. 2007;13:7421–7431. doi: 10.1158/1078-0432.CCR-07-0760. [DOI] [PubMed] [Google Scholar]
- 17.Eisen MB, Spellman PT, Brown PO, Botstein D. Cluster analysis and display of genome-wide expression patterns. Proc Natl Acad Sci U S A. 1998;95:14863–14868. doi: 10.1073/pnas.95.25.14863. [DOI] [PMC free article] [PubMed] [Google Scholar]
- 18.Li C. Automating dChip: toward reproducible sharing of microarray data analysis. BMC Bioinformatics. 2008;9:231. doi: 10.1186/1471-2105-9-231. [DOI] [PMC free article] [PubMed] [Google Scholar]
- 19.Venables WN, Ripley BD. Modern Applied Statistics with S. New York: Springer; 2002. [Google Scholar]
- 20.Benjamini Y, Drai D, Elmer G, et al. Controlling the false discovery rate in behavior genetics research. Behav Brain Res. 2001;125:279–284. doi: 10.1016/s0166-4328(01)00297-2. [DOI] [PubMed] [Google Scholar]
- 21.Moore JD, Kirk JA, Hunt T. Unmasking the S-phase-promoting potential of cyclin B1. Science. 2003;300:987–990. doi: 10.1126/science.1081418. [DOI] [PubMed] [Google Scholar]
- 22.Ikuerowo SO, Kuczyk MA, Mengel M, et al. Alteration of subcellular and cellular expression patterns of cyclin B1 in renal cell carcinoma is significantly related to clinical progression and survival of patients. Int J Cancer. 2006;119:867–874. doi: 10.1002/ijc.21869. [DOI] [PubMed] [Google Scholar]
- 23.Draetta G, Luca F, Westendorf J, et al. Cdc2 protein kinase is complexed with both cyclin A and B: evidence for proteolytic inactivation of MPF. Cell. 1989;56:829–838. doi: 10.1016/0092-8674(89)90687-9. [DOI] [PubMed] [Google Scholar]
- 24.Shaw RJ, Kosmatka M, Bardeesy N, et al. The tumor suppressor LKB1 kinase directly activates AMP-activated kinase and regulates apoptosis in response to energy stress. Proc Natl Acad Sci U S A. 2004;101:3329–3335. doi: 10.1073/pnas.0308061100. [DOI] [PMC free article] [PubMed] [Google Scholar]
- 25.Bolster DR, Crozier SJ, Kimball SR, Jefferson LS. AMP-activated protein kinase suppresses protein synthesis in rat skeletal muscle through down-regulated mammalian target of rapamycin (mTOR) signaling. J Biol Chem. 2002;277:23977–23980. doi: 10.1074/jbc.C200171200. [DOI] [PubMed] [Google Scholar]
- 26.Inoki K, Zhu T, Guan KL. TSC2 mediates cellular energy response to control cell growth and survival. Cell. 2003;115:577–590. doi: 10.1016/s0092-8674(03)00929-2. [DOI] [PubMed] [Google Scholar]
- 27.Sarbassov DD, Guertin DA, Ali SM, Sabatini DM. Phosphorylation and regulation of Akt/PKB by the rictor-mTOR complex. Science. 2005;307:1098–1101. doi: 10.1126/science.1106148. [DOI] [PubMed] [Google Scholar]
- 28.Cantley LC, Neel BG. New insights into tumor suppression: PTEN suppresses tumor formation by restraining the phosphoinositide 3-kinase/AKT pathway. Proc Natl Acad Sci U S A. 1999;96:4240–4245. doi: 10.1073/pnas.96.8.4240. [DOI] [PMC free article] [PubMed] [Google Scholar]
- 29.Tzatsos A, Tsichlis PN. Energy depletion inhibits phosphatidylinositol 3-kinase/Akt signaling and induces apoptosis via AMP-activated protein kinase-dependent phosphorylation of IRS-1 at Ser-794. J Biol Chem. 2007;282:18069–18082. doi: 10.1074/jbc.M610101200. [DOI] [PubMed] [Google Scholar]
- 30.Kim KY, Baek A, Hwang JE, et al. Adiponectin-activated AMPK stimulates dephosphorylation of AKT through protein phosphatase 2A activation. Cancer Res. 2009;69:4018–4026. doi: 10.1158/0008-5472.CAN-08-2641. [DOI] [PubMed] [Google Scholar]
- 31.Baba M, Hong SB, Sharma N, et al. Folliculin encoded by the BHD gene interacts with a binding protein, FNIP1, and AMPK, and is involved in AMPK and mTOR signaling. Proc Natl Acad Sci U S A. 2006;103:15552–15557. doi: 10.1073/pnas.0603781103. [DOI] [PMC free article] [PubMed] [Google Scholar]
- 32.Horiguchi A, Oya M, Uchida A, et al. Elevated Akt activation and its impact on clinicopathological features of renal cell carcinoma. J Urol. 2003;169:710–713. doi: 10.1097/01.ju.0000038952.59355.b2. [DOI] [PubMed] [Google Scholar]
- 33.Jonasch E, Corn P, Pagliaro LC, et al. Upfront, randomized, phase 2 trial of sorafenib versus sorafenib and low-dose interferon alfa in patients with advanced renal cell carcinoma: clinical and biomarker analysis. Cancer. doi: 10.1002/cncr.24685. 2009 Oct 27. [Epub ahead of print] [DOI] [PMC free article] [PubMed] [Google Scholar]
- 34.Robb VA, Karbowniczek M, Klein-Szanto AJ, Henske EP. Activation of the mTOR signaling pathway in renal clear cell carcinoma. J Urol. 2007;177:346–352. doi: 10.1016/j.juro.2006.08.076. [DOI] [PubMed] [Google Scholar]
- 35.Brenner W, Farber G, Herget T, et al. Loss of tumor suppressor protein PTEN during renal carcinogenesis. Int J Cancer. 2002;99:53–57. doi: 10.1002/ijc.10303. [DOI] [PubMed] [Google Scholar]
- 36.Thomas GV, Tran C, Mellinghoff IK, et al. Hypoxia-inducible factor determines sensitivity to inhibitors of mTOR in kidney cancer. Nat Med. 2006;12:122–127. doi: 10.1038/nm1337. [DOI] [PubMed] [Google Scholar]
- 37.Toschi A, Lee E, Gadir N, et al. Differential dependence of hypoxia-inducible factors 1 alpha and 2 alpha on mTORC1 and mTORC2. J Biol Chem. 2008;283:34495–34499. doi: 10.1074/jbc.C800170200. [DOI] [PMC free article] [PubMed] [Google Scholar]
- 38.Gordan JD, Lal P, Dondeti VR, et al. HIF-alpha effects on c-Myc distinguish two subtypes of sporadic VHL-deficient clear cell renal carcinoma. Cancer Cell. 2008;14:435–446. doi: 10.1016/j.ccr.2008.10.016. [DOI] [PMC free article] [PubMed] [Google Scholar]
- 39.Atkins MB, Hidalgo M, Stadler WM, et al. Randomized phase II study of multiple dose levels of CCI-779, a novel mammalian target of rapamycin kinase inhibitor, in patients with advanced refractory renal cell carcinoma. J Clin Oncol. 2004;22:909–918. doi: 10.1200/JCO.2004.08.185. [DOI] [PubMed] [Google Scholar]
- 40.Raymond E, Alexandre J, Faivre S, et al. Safety and pharmacokinetics of escalated doses of weekly intravenous infusion of CCI-779, a novel mTOR inhibitor, in patients with cancer. J Clin Oncol. 2004;22:2336–2347. doi: 10.1200/JCO.2004.08.116. [DOI] [PubMed] [Google Scholar]
Associated Data
This section collects any data citations, data availability statements, or supplementary materials included in this article.