Abstract
Plexin-B1 is a single-pass transmembrane receptor. Its Rho GTPase binding domain (RBD) can associate with small Rho GTPases and can also self-bind to form a dimer. In total, more than 400 ns of NAMD molecular dynamics simulations were performed on RBD monomer and dimer. Different analysis methods, such as root mean squared fluctuation (RMSF), order parameters (S2), dihedral angle correlation, transfer entropy, principal component analysis, and dynamical network analysis, were carried out to characterize the motions seen in the trajectories. RMSF results show that after binding, the L4 loop becomes more rigid, but the L2 loop and a number of residues in other regions become slightly more flexible. Calculating order parameters (S2) for CH, NH, and CO bonds on both backbone and side chain shows that the L4 loop becomes essentially rigid after binding, but part of the L1 loop becomes slightly more flexible. Backbone dihedral angle cross-correlation results show that loop regions such as the L1 loop including residues Q25 and G26, the L2 loop including residue R61, and the L4 loop including residues L89–R91, are highly correlated compared to other regions in the monomer form. Analysis of the correlated motions at these residues, such as Q25 and R61, indicate two signal pathways. Transfer entropy calculations on the RBD monomer and dimer forms suggest that the binding process should be driven by the L4 loop and C-terminal. However, after binding, the L4 loop functions as the motion responder. The signal pathways in RBD were predicted based on a dynamical network analysis method using the pathways predicted from the dihedral angle cross-correlation calculations as input. It is found that the shortest pathways predicted from both inputs can overlap, but signal pathway 2 (from F90 to R61) is more dominant and overlaps all of the routes of pathway 1 (from F90 to P111). This project confirms the allosteric mechanism in signal transmission inside the RBD network, which was in part proposed in the previous experimental study.
Introduction
Plexin-B1 is a single-pass transmembrane protein belonging to the plexin family, which plays important roles in axon guidance, angiogenesis, and cancer.1 Plexins are unique as they are the first examples of a receptor that interacts directly with small GTPases, a family of proteins that are essential for cell motility, proliferation, and survival. Plexin-B1 can receive semaphorin guidance cues2 and transfer signals through the lipid membrane. Plexin-B1 can associate with certain Rho GTPases through its Rho GTPase binding domain (RBD),3−5 an intracellular domain with the structure shown in Figure 1. The RBD can also self-bind to form a homodimer with the structure shown in Figure 2. The binding of RBD with small Rho GTPase and self-binding can compete because of a partial steric hindrance effect.6
Figure 1.
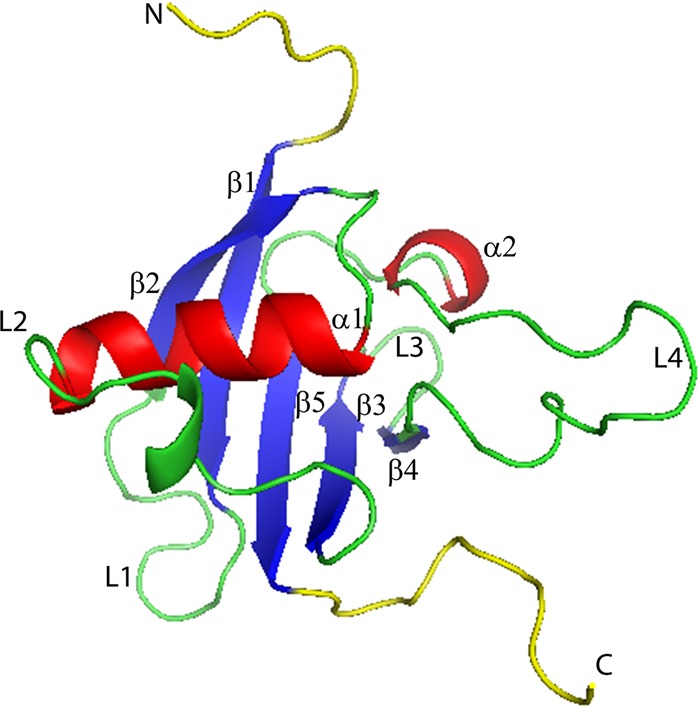
Secondary structure of plexin-B1 RBD domain. The N-terminal and C-terminal regions are shown in yellow, β sheet from 1 to 5 in blue, and α helix from 1 to 2 in red; loop regions including L1–L4 are in green. The L2 loop (residues K50–T62) is thought to be important for interactions with neighboring domains. The L3 loop (residues S69–G73) is involved in Rho GTPase binding. The L4 loop (residues L77–L96) is associated with dimer formation.
Figure 2.
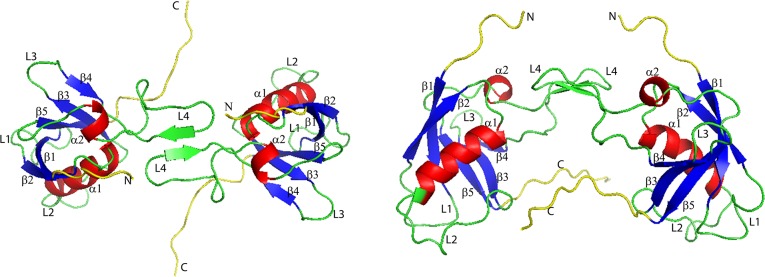
Plexin-B1 RBD dimer secondary structure in top view (left) and side view (right). Different regions of RBD are labeled and are shown using the same color strategy as in Figure 1.
To affect the signal transmission process through the plasma membrane, conformational changes need to be transmitted through the single transmembrane helix. In the absence of small Rho GTPases, the unbound RBD is thought to dimerize the receptor inside the cell, just as the extracellular domain forms a dimer outside. Binding of ligand outside and Rho GTPase inside appears to cooperate to destabilize the dimeric form of the receptor.7 Thus, Rho GTPase binding is thought to regulate the signal transduction process and conformational changes.
Protein function is intimately linked to its dynamics, especially correlated motions, which are essential for the coupling of binding sites in allosteric regulation.8−10 In this project, the backbone dihedral angle cross-correlation matrix has been calculated to investigate the coupling movements inside the RBD network based on simulation trajectories. Furthermore, we have examined the causality relationship of correlated motions in the RBD dimerization process using an information theory measure of transfer entropy (TE).11 The transfer entropy analysis can reveal how correlated motions are used to transmit information through the system and can help to clarify the link between correlated motions and biological function in biomolecular systems.12,13 In this project, the method developed by Kamberaj and van der Vaart13 has been applied to understand changes in the correlated motions in the RBD dimerization process by investigating the drive–response relationship between residues in the RBD monomer form and dimer form.
Protein–protein interactions can be affected by allosteric mechanisms.14−16 Investigating the binding process of the plexin-B1 RBD domain and the small GTPase Rac1, dynamical protein features were found that are indicative of a dynamic allosteric mechanism.17 In the previous project18 using mostly experimental NMR measurements, picosecond–nanosecond dynamics of the plexin-B1 RBD domain in both monomer and dimer forms were investigated using both the model-free (MF) method and the slowly relaxing local structure (SRLS) approach to measure the local ordering. It was found that the loops became more flexible than the secondary structure elements. Upon dimerization, a monomer–monomer interface with increased rigidity and reduced nanosecond mobility was generated, and an allosteric mechanism that accompanies the RBD dimerization was suggested. To substantiate such a mechanism, the correlated motions needed to be analyzed further, and this is reported here.
Molecular simulation methods in combination with dynamical network analysis could supply information on the interaction and signal pathways inside the protein network and help us to understand the mechanism of binding and regulation of the receptor at atomic level.19,20 In this project, this combination of analysis tools was applied to RBD monomer and dimer simulations.
Results and Discussion
Plexin-B1 RBD Domain Sequence and Structure
The RBD (shown in Figure 1 and its dimer form shown in Figure 2) has a structure very similar to that of ubiquitin.1 Both have a long helix that lies on a five-stranded β sheet with a shorter helix close to the C-terminus. Unlike ubiquitin, however, the RBD domain of plexin-B1 has several long loops, one of which, L4, is involved with dimer formation, whereas the others, L1–L3, are involved in Rho GTPase binding and interactions with neighboring domains.18 The region of the RBD domain that associates with small GTPases, L3 and β-strand 4, lies adjacent to the dimerization region,21 L4, which forms hydrogen bonds between residues 89−93 on each plexin-B1 protein.
Calculating the initial and average core structures of the RBD monomer and dimer forms based on simulation trajectories, results are shown in Figure 3. When the two initial structures are compared, a RMSD of 1.36 Å for all heavy atoms was observed between RBD monomer and dimer forms for the structures without loops and termini. For the simulation-averaged structures, this difference is reduced to an RMSD of 0.61 Å. That suggests that after long-term simulations, RBD monomer and dimer form structures converge. The structural similarities and the common fluctuations are also indicated by a large extent of overlap of the principal components (Figure S3 in the Supporting Information).
Figure 3.
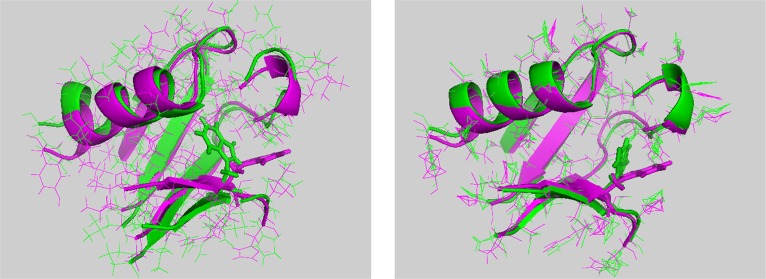
First structure (left) and average structure (right) comparisons between plexin-B1 RBD monomer (in green) and dimer (in magenta) forms in cartoon. All of the loop regions and head and tail regions are chopped. Residue W67 in both monomer and dimer forms is shown as sticks.
Another interesting point is that, although the surface and some of the protein interior side chains initially have totally different orientations between the monomer and dimer forms, after long-term simulations, most of them converge. This is also true for W67 on β3; although this residue still shows an orientation change from the monomer to dimer form, the rotation angle between the two W67 residues decreased by around 50% from the initial structure to the average structure. This is consistent with NMR spectra comparing the two states of the protein, showing only very localized changes for the NMR signals in the region near the monomer–dimer interface.7,22
Without considering the loop regions or termini, the RMSDs of backbone heavy atoms were calculated for both RBD monomers and each unit in dimer form after alignment on the RBD monomer crystal structure, and results are shown in Figure S1 in the Supporting Information. The RBD monomers have on average a higher RMSD than the dimer forms. The RBD in dimer form only has a RMSD of 1.3 Å with a deviation of 0.2 Å. This shows that the backbone of the dimer remains closer to the starting structure compared to the simulations of the monomer.
RMSF Results
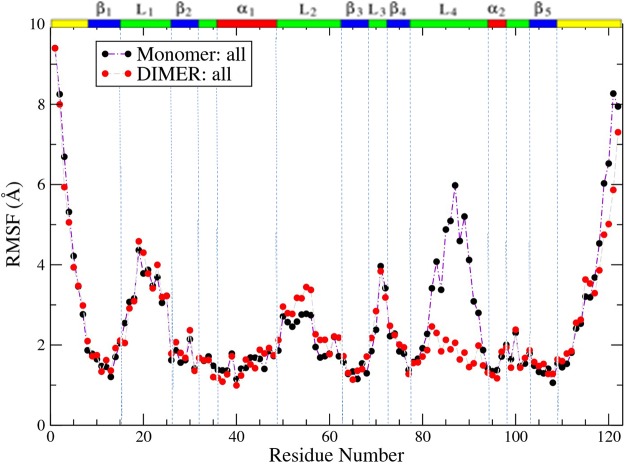
Comparing the RMSF of residues including both backbone and side-chain atoms between RBD monomer and dimer forms, results are shown in Figure 4 and Figure S2 in the Supporting Information.
Figure 4.
Averaged RMSF comparison between plexin monomer and dimer simulations. The RMSF for all (including both backbone and side-chain atoms) is shown.
From Figure 4, on binding, the RMSF decreased significantly in the L4 loop region from around 6 to 2.2 Å while decreasing slightly in the C-terminal region. On the contrary, after binding, the L2 loop showed slightly increased RMSF, as did the β1 region, β5 region, head of the β2, and the tail of the α1 regions. Figure S2 in the Supporting Information shows that backbone heavy atoms have lower fluctuations than side-chain atoms.
A mapping of the RMSF difference between the monomer and dimer to the structure of the dimer is shown in Figure 5, which reveals that the dynamics of the dimerization L4 loop is most decreased (dark blue), whereas motions in the L2 loop region are slightly increased.
Figure 5.
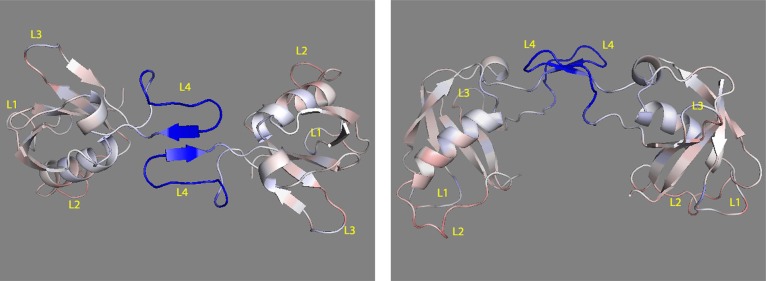
Plexin-B1 RBD monomer to dimer RMSF change mapped to the structure in top view (left) and in side view (right). Colors range from blue to white to red (with white representing no change in RMSF, blue representing RMSF decrease, and red representing RMSF increase). The nine N- and C-terminal residues are not shown.
S2 Difference Calculation
As shown from RMSF calculations, different regions of RBD showed different dynamic fluctuations after dimerization. To determine which bonds contributed most to the rigidification after binding, order parameters for in total three kinds of bonds were calculated, for both backbone and side chain, as well as core and surface residue groups.
Based on the S2 calculations on the RBD in both monomer and dimer forms, ΔS2 values for each of four groups were summarized, with data shown in Table 1.
Table 1. Summation and Average of ΔS2 for Different Bond Types at Different Locations.
| CH bond |
|||
|---|---|---|---|
| sum (ΔS2) | number | av (ΔS2) | |
| backbone, core | 0.63 | 38 | 1.66 × 10⁻² |
| backbone, surface | 3.44 | 73 | 4.71 × 10⁻² |
| side chain, core | 10.00 | 201 | 4.98 × 10⁻² |
| side chain, surface | 30.50 | 492 | 6.20 × 10⁻² |
| NH bond |
|||
|---|---|---|---|
| sum (ΔS2) | number | av (ΔS2) | |
| backbone, core | 1.97 | 41 | 4.80 × 10⁻² |
| backbone, surface | 2.79 | 58 | 4.81 × 10⁻² |
| side chain, core | 2.22 | 43 | 5.16 × 10⁻² |
| side chain, surface | 4.27 | 139 | 3.07 × 10⁻² |
| CO bond |
|||
|---|---|---|---|
| sum (ΔS2) | number | av (ΔS2) | |
| backbone, core | 0.73 | 39 | 1.87 × 10⁻² |
| backbone, surface | 4.47 | 67 | 6.67 × 10⁻² |
| side chain, core | 1.60 | 43 | 3.72 × 10⁻² |
| side chain, surface | 6.60 | 106 | 6.23 × 10⁻² |
As can be seen, after binding, there is a net increase of S2 in total, which means that different atom types at different locations become more rigid. By comparison of the contributions from different locations, atoms on the surface are rigidified more than core atoms by showing larger S2 increases, and atoms on the side chain become more rigid with a larger S2 increase.
Because most of the order parameter changes are small, we rescaled the difference by multiplying with temperature, which equals 300, then divided by R, which is 8.314, then took the log of the data. After these operations, we mapped the S2 change in structure shown in Figure 6. As can be seen from both the top view and side view figures, after binding, almost all of the bonds changed their flexibilities. On the same residue, some bonds become more rigid (shown in blue), while some others become more flexible (shown in red), except bonds within the L4 loop, which only become more rigid, and some spots on β1–4, α1–2, and L2, which become more rigid after binding by showing significant increases in S2. However, part of the L1 loop only becomes more flexible in both backbone and side chain atoms. Importantly, the results show more discrimination or local changes than the RMSF results. There are two reasons for that. The first is that the S2 method of analysis considers only reorientation of the bond vectors (largely a local measurement) and, thus, is very sensitive to changes in local structures, in contrast to the RMSF analysis, which is also strongly affected by segmental (e.g., loop-wide) fluctuations and can reflect longer range translational motions of protein segments. The second reason is that the correlation functions for order parameter determination are limited to 5 ns, which corresponds to the time scale detected by the experimental NMR measurement in this project, whereas RMSF is calculated over the entire trajectory (at least 50 ns). Thus, RMSF can include motions not seen by NMR or S2.
Figure 6.

Plexin-B1 RBD monomer to dimer order parameter change mapped to the structure in top view (left) and in side view (right). Colors range from blue to white to red (white represents no change, blue represents S2 increasing, and red represents S2 decreasing). The nine N- and C-terminal residues are not shown.
The change in S2 can be converted to an estimate of entropy change using the method of Yang and Kay23 (Supporting Information Table S1). Again, it was found that the surface groups contributed more to the decreasing of entropy than core groups, and side-chain groups contributed more to the entropy decrease than backbone atoms because of the larger amount of bonds involved in the side chains and surface residues. The entropy per bond is similar for the three kinds of bonds, and at different locations, which showed a similar tendency for the S2 change.
By comparison of the highlighted regions in Figure 6 with data shown in ref (18), similar tendencies can be found, but with some differences. The reason is that in the current project, S2 of three kinds of bonds (CH, NH, and CO) were considered, whereas in ref (18) only S2 values of NH bonds were calculated. Because more side-chain bond dynamics were taken into consideration, it is not surprising to see the results are moderately different.
Dihedral Angle Correlation Results
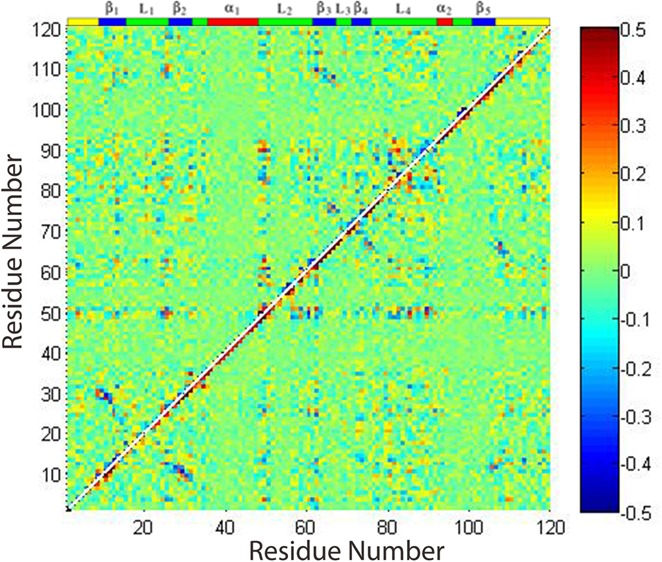
Calculating the ϕ, φ combined matrix for RBD in monomer and dimer forms, results are presented in Figure 7. The left-hand panel of Figure 7 shows that the RBD monomer has many regions with correlated motions in the β1, the head of the β2, β3, and L2 loop, the L4 loop region, and the C-terminal region, with the head of the β2, β3, and L2 and the L4 regions being most correlated. After binding, the backbones of almost the entire protein become rigid, as seen above; this change in dynamics is accompanied by a decrease in the way motions are correlated, as shown in the right-hand panel of Figure 7.
Figure 7.
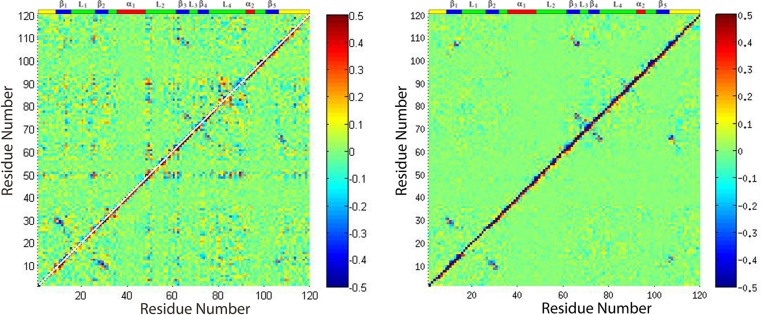
Averaged mixed dihedral angle covariance matrix for plexin RBD monomers (left) and dimer (right).
Because the dihedral angle cross-correlation matrix showed the strongest correlational motions at around residues Q25, R61, and D81 in the monomer form and relatively weak correlated motions at Q25 and slightly correlated motion at R61 for the dimer form, data for the correlation of all residues with Q25 and R61 were extracted for both RBD monomer and dimer from the matrix as examples, with the correlation coefficient mapped to the structures shown in Figures 8 and 9.
Figure 8.
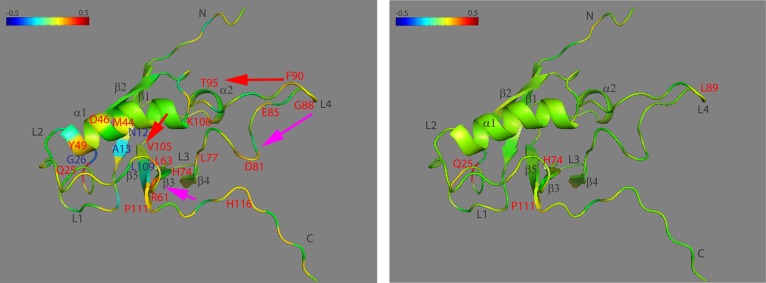
Structure at residue Q25 for RBD monomer (left) and dimer (right) with the correlation coefficient of dihedral angle motions mapped to the main chain Cα (see color scale from −0.5 to +0.5). Key residues with negative correlation coefficients are labeled in blue, with positive correlation coefficients in red, possible signal pathway 1 pointed out in red arrows, and possible signal pathway 2 in magenta arrows.
Figure 9.
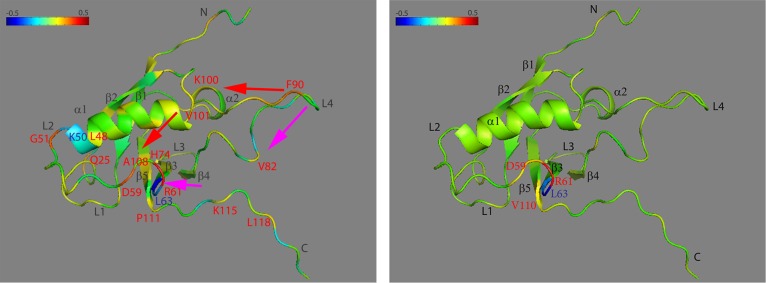
Structure at residue R61 for RBD monomer (left) and dimer (right) with the correlation coefficient of dihedral angle motions mapped to the main chain Cα (see color scale from −0.5 to +0.5). Key residues and possible signal pathways are labeled in the same strategy as in Figure 8.
From the left-hand panel of Figure 8, in RBD monomer form, residue Q25 is strongly correlated with itself, strongly correlated with residue R61, and correlated with residues L77, D81, and F90 on L4. It is also slightly correlated with residue T95 on α2 and correlated with K100 at the loop after α2, residue V105 on β5, residue H74 on β4, and residue L63 on β3. It is also anticorrelated with G26 on the L1 loop and A13 on β1. Therefore, the rigidification of the L4 loop can be transmitted to α2 following the direction of the loop and then to β5 as shown in red arrows. In the opposite direction, the rigidification of the L4 loop can be transmitted to β4, then to L3, and then to β3 as shown in magenta arrows. Those two appear as signal pathways in the RBD network.
From the right-hand panel of Figure 8, after binding, Q25 is no longer strongly anticorrelated with G26, but still shows slight correlation with several residues on L4 (L89, H74) and with one residue between α2 and β5 (K100) (not labeled). Following the other direction of the L4 loop, there are several residues on β4, L3, and β3 also showing correlation with Q25, although not so strong as compared to residues in the RBD monomer form.
Checking the correlational movements of R61, the data is mapped onto the structure as shown in the left-hand panel of Figure 9; in RBD monomer there are strong correlations between R61 and itself, with D59 and G51 on L2 and with residue F90 on L4. It also has slight correlations with residue K100 on α2 and residues A108 and P111 on β5. Moving in the opposite direction of L4, residue V82 on β4, residue H74 on L3, and residues D59 and G51 on L2 are strongly correlated with R61, so the RBD monomer form shows two signal pathways being consistent with those detected from Q25 related structure. Strong anticorrelation was found between R61 and L63 and with K50, which is at the head of L2.
After binding, as shown in the right-hand panel of Figure 9, the anticorrelation between R61 and L63 is still seen, but is not seen with K50. The correlation between R61 and D59 and P111 can still be detected.
Transfer Entropy Results
On the basis of correlated dynamics calculation, the causality relationship in RBD dimerization was addressed by calculating the transfer entropy for plexin-B1 RBD in monomer and dimer forms. The directional index Dj→i results from transfer entropy calculations are shown in Figure 10 for RBD in monomer (left) and dimer (right) forms.
Figure 10.
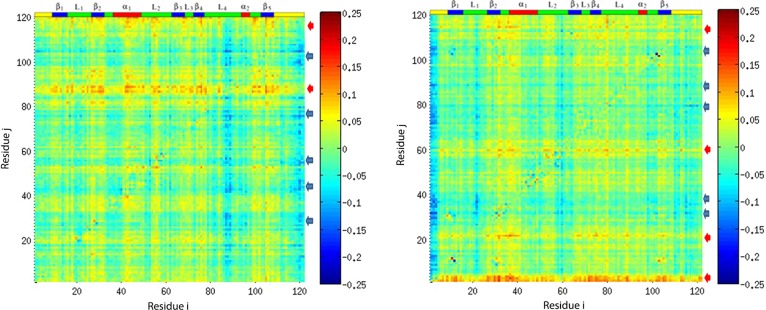
Normalized directional index for plexin RBD in monomer (left) and dimer (right) forms with motion activator regions labeled in red arrows and motion responder regions labeled in blue arrows. Atom j is on the vertical, and atom i is on the horizontal axis. Positive values of Dj→i (in yellow and red) indicate that the information flow is from j to i, and atom j is the source of the correlation between atoms j and i; on average, the fluctuations of atom j drive the fluctuations of atom i. On the contrary, negative values of Dj→i (in blue) indicate that atom j is the sink of the correlations between atoms j and i, and atom j responds to the motion of atom i.
The analysis in the left-hand panel of Figure 10 shows that the L4 loop and the C-terminus can drive the correlational motion, with β5, β4, and L2, α1, β2 regions being the responders of the motion.
The right-hand panel of Figure 10 shows that after binding, the N-terminus becomes the motion activator of the correlational motion, which can drive the motion of all nearby regions. The next strong driver is on the L1 loop, the terminal of the L2 loop, and the head of the C-terminal region. Different from the monomer form, β2, part of the α1 region, and the beginning and end of the L4 dimerization loop became the responders of the correlational motion. β5 is still a sink of correlational motion, but not as strong as in the monomer form.
On the basis of the correlational motion of RBD in the monomer and dimer forms, the dimerization process appears to be driven by the L4 loop and C-terminus. The finding of the function of the C-terminus is consistent with the dynamic changes observed at the C-terminal by NMR relaxation data.18 After binding, the L4 loop becomes rigid and can only respond to motions driven by other regions.
Dynamical Network Analysis Results
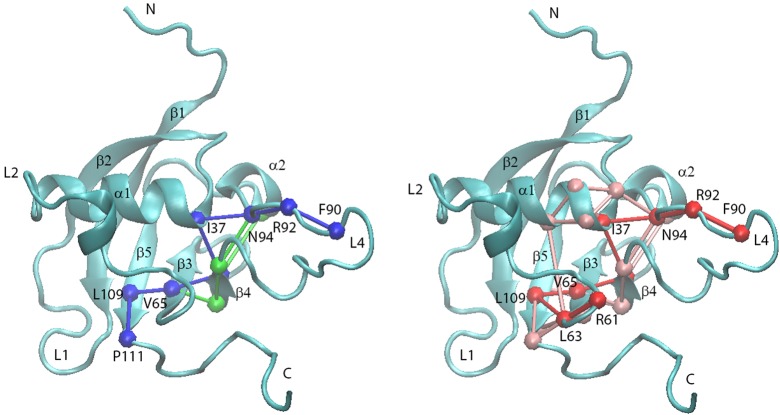
Because there are interactions inside the protein, the protein can be viewed as a network. Analyzing the interaction inside the network, communication pathways can be calculated. Using the plug-in in the VMD 1.9.1 edition, the dynamical network in RBD monomers and dimers was analyzed based on residue–residue interactions over time. The Cα atom in each residue was treated as one node. Multiple nodes with strong interactions can form one community. Using such a strategy, RBD monomer and dimer networks were built, and results are shown in Figure 11.
Figure 11.
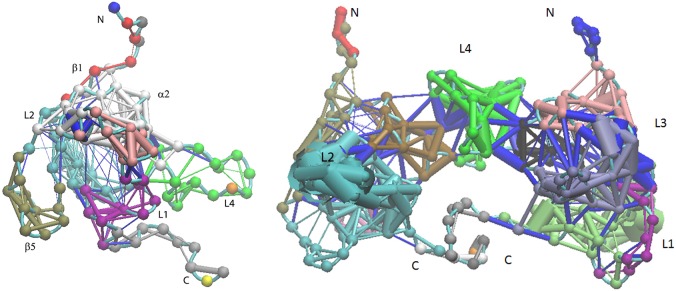
Plexin-B1 RBD monomer and dimer dynamical network analysis results comparison: (left) monomer network structure oriented in the same direction as in Figure 1; (right) dimer network structure oriented in the same direction as Figure 2.
In RBD monomer form, there are in total 12 communities each shown in different colors, but only 17 communities are formed in the dimer because there are cross communications between the two monomers through the L4 loops as shown in blue in the right-hand panel of Figure 11. Comparison of the thickness of edges reveals that the L2 loop becomes the interaction-intensive community in the dimer form, but not in the monomer form.
Because the signal pathways were detected based on dihedral angle cross-correlation calculations, this information was used as input to predict the signal pathways using dynamical network analysis program. The results are shown in Figure 12. As can be seen, there are multiple connections between surrounding residues in both signal pathways, which means that once one connection is broken, the overall signal pathway may still be valid due to an built-in redundancy of interactions. Therefore, mutation of one residue that has connections with surrounding residues and also has replacement pathways nearby will not change the signal route.
Figure 12.
Plexin-B1 RBD monomer network pathways predicted. (left) only network pathway 1 is shown, in green, which is mostly overlapped by the shortest path shown in blue; (right) network pathway 1, in green, network pathway 2, in pink, and its shortest path, shown in red, with network pathway 1 being totally overlapped by network pathway 2 (again green, not seen). The RBD backbone is shown in cyan, and the residue numbers are labeled in the shortest pathways.
By comparison of signal pathways 1 and 2, it is obvious that the shortest pathways from both can overlap except for the pathway-ending residues. Because those two signal pathways use different sink residue numbers (P111 as the sink residue for signal pathway 1 and R61 as the input for signal pathway 2), that kind of difference is reasonable. However, signal pathway 2 is predicted to be more dominant by overlapping all of the routes from signal pathway 1. The signal pathways predicted confirmed those inferred from a combined molecular dynamics–experimental analysis of relaxation data published previously.18
Comparison with Previous Work
In a previous project,18 we proposed two allosteric pathways that are altered upon RBD dimerization. In pathway 1, the entropy loss at the L3 loop was regained in the β3 and β4 regions. In pathway 2, L2 and the C-terminus were rigidified, and the L3 and L4 loops were involved, with the entropy loss regained in the other regions of the protein.
On the basis of investigations conducted in this project, the allosteric mechanism was confirmed by both ΔS2 and binding entropy calculation, with results showing the L4 loop becoming rigid but the L1 loop becoming more flexible. Analyzing backbone dihedral angle cross-correlations, pathways 1 and 2 were confirmed by correlated motions at key residues in the structures such as centers and hinges.
Conclusions
In this project, both RBD monomer and dimer simulations were performed with a total simulation time of more than 400 ns. On the basis of RMSF calculations, after binding, the L4 loop becomes very rigid, whereas the L2 loop and some residues in the β1 and β5 regions, the head of β2, and the tail of the α1 region become slightly more flexible. Calculating S2 for three kinds of bonds, we found that after binding there is a net increase of order parameters in total. The L4 loop becomes largely rigid after binding, but part of the L1 loop becomes more flexible, which suggests that there could be an allosteric mechanism in the RBD network. When the backbone dihedral angle cross-correlation matrix was calculated, two signal pathways were detected based on strongly correlated motions in the structure. Using dynamical network analysis, the signal pathways in the RBD network were confirmed, and signal pathway 2 was found to be more dominant than signal pathway 1, although the shortest pathways from both can overlap. The L2 loop becomes an interaction-intensive community in the dimer form, but not in the monomer form. On the basis of transfer entropy calculations, the RBD binding process appears to be driven by the L4 loop and the C-terminus. The RBD dimer motion is driven predominantly by the N-terminus and certain residues in the L1 loop, the terminal of the L2 loop, and the head of the C-terminal region.
Materials and Methods
Simulation Details
The plexin-B1 RBD monomer form has in total 122 residues, with the sequence composed of human plexin-B1 residues 1742–1862 plus two N-terminal lysine residues, added for increased protein expression yield. In this project, residues were renumbered from 1 to 122. To be consistent with previous computational and experimental work,17,24,25 the monomer form of RBD was stabilized with a W90F mutation in the loop region, whereas the RBD dimer form keeps the original W90 in the sequence.
In total, four all-atom unrestrained molecular dynamics simulations were carried out on the plexin-B1 RBD monomer, starting from the same structure but using different random numbers in the NAMD simulations. Four molecular dynamics simulations were performed on plexin-B1 RBD dimer with the initial structure setup shown in detail in ref (18) also starting from the same dimer structure but with different random seeds in the NAMD simulations.
In setting up the system, RBD monomer/dimer form was solvated in a cubic box of explicitly represented water (TIP3P water model). NaCl (0.15 M) and counterions (to neutralize the system) were added using the CHARMM program. After that, unrestrained all-atom molecular dynamics simulations were performed at a temperature of 300 K and a pressure of 1 atm using NAMD program ver. 2.8.26 After a brief minimization, the equilibration and production runs were followed with a time step of 2 fs. The standard particle mesh Ewald method was used with periodic boundary conditions to calculate the long-range electrostatic interactions of the system. The CHARMM 22 all-atom potential function27 was used with CMAP correction.28 For nonbonded calculations, a cutoff of 12 Å was used. All bonds involving hydrogen were kept rigid using the SHAKE algorithm. For each system listed above, 55 ns of NAMD simulations were performed including 5 ns for equilibration.
Because the RBD dimer is detected as overlapping signals from each RBD protein in NMR experiments,18 the properties calculated in this project were averaged between two monomers in the dimer form, after results from four different dimer simulations were averaged. The RBD monomer results were averaged from four different monomer simulations. In total, five kinds of analysis were done as listed below.
RMSF Calculation
Root mean squared fluctuation (RMSF) is a measure of the deviation between atomic positions of residues and their averaged structure from the trajectory. Because most residues have both backbone and side chains, RMSF for the backbone only, the side chain only, and all were calculated individually to quantitatively measure the magnitude of each selection. The CHARMM program was used to calculate the RMSF for residues.
Order Parameter Calculation
To see the effects of RBD dimerization on protein motions, atoms were classified into four groups: backbone atoms in the core, backbone atoms on the surface, side chain atoms in the core, and side chain atoms on the surface. To know which groups of atoms contributed more in the binding process, the order parameter change for each group was calculated individually.
In this project, C, N, O, CA, HN, HA, and HT are defined as backbone atoms, whereas others are side-chain atoms. To determine which residue and atom groups are in the core and which residue and atom groups are on the surface, accessible surface area (ASA) per residue was calculated for both backbone atoms and side-chain atoms using the CHARMM program. A water radius of 1.4 Å was used. Residues with ASA of backbone atoms smaller than 2.4 Å2 are classified as core residues; otherwise, they are on the surface. Side-chain atoms with an ASA smaller than 10 Å2 are classified as on the core; otherwise, they are on the surface.
Order parameters for three kinds of bonds, CH, NH, and CO, were analyzed. For different types of bonds, different distance cutoffs were used in the order parameter calculation. For both CH and NH bonds, a cutoff of 1.2 Å was used, whereas for CO bonds, a distance cutoff of 1.35 Å was used.
On the basis of the above classification, S2, reflecting the amplitude of bond fluctuations on the picosecond–nanosecond time scale, was calculated using the CHARMM program over the same time intervals as in a previous project.18 We calculated the order parameters for RBD in both dimer form and monomer form.
Dihedral Angle Correlation Calculation
To quantitatively describe the motional correlations of the backbone, we calculated the ϕ and ψ cross-correlation matrix. ϕ describes the rotation of the N–Cα bond and involves the CO–N–Cα–CO bonds. ψ describes the rotation of Cα and the CO bond and involves the N–Cα–CO–N bonds. Both ϕ and ψ are calculated for all residues except the first and last ones and at different times using CHARMM program.
Because both ϕ and ψ are angular variables, to avoid the periodicity problem, the circular correlation coefficient, which is a T-linear dependence, was calculated in this project following the method of Fisher29,30 and Mardia and Jupp.31 The circular correlation matrix element rT for two circular variables x and y can be calculated with eqs 1–9 during the simulation time i from 1 to N:
| 1 |
where
| 2 |
| 3 |
| 4 |
| 5 |
| 6 |
| 7 |
| 8 |
| 9 |
Here, N is no less than 22000. So the above T-linear association has good enough sampling. x and y are ϕ or ψ in radians. Becaue ϕ and ψ can be cross-correlated, the ϕ−ψ cross-correlation coefficient was also calculated. Because ϕ–ϕ, ψ–ψ, and ϕ−ψ correlation coefficients can be high at different residues, and all three of them show the correlation between movements, we combined the correlation matrices from ϕ–ϕ, ϕ−ψ, and ψ–ψ and always chose the element with the largest magnitude at the position to build the final matrix. Therefore, although we calculated three correlation matrices for ϕ and ψ, we then built one combined correlation matrix.
Transfer Entropy Calculation
Following Kamberaj and Van der Vaart,13 we calculated the transfer entropy (TE) based on the simulation trajectories to determine which sections of the protein drive the movement of the other sections in the dimer compared to the monomer. The TE calculation is based on information theory, which can extract the causality of correlated motions from molecular dynamics simulations.
Dynamical Network Analysis
The dynamical network analysis was used to build a network model of the residues of RBD in monomer and dimer forms, from which the residues with the strongest interactions in the receptor were detected. It was also used to predict the signal pathways in the receptor based on available signal pathway residue information. The network model was built by the NetworkView plug-in of VMD32,33 and the program Carma.34 In the network, the nodes could be considered as a single atom or a cluster of atoms. In this project, each Cα atom in one amino acid was treated as one node. The edge between two nodes was defined with the cutoff distance of 4.5 Å for at least 75% of molecular dynamics simulated trajectory.
Acknowledgments
We are grateful for funding from an NIH grant to M.B. (R01GM092851) and a postdoctoral fellowship to L.Z. (T32DK007470). Some of the dynamics calculations and analysis were carried out at the Case Western Reserve High Performance Cluster and at Lonestar (Austin, TX, USA) under XSEDE via a TeraGrid award to M.B. We thank Mirco Zerbetto and Antonino Polimeno (both from the University of Torino) for help with the RBD dimer simulations. We thank Prof. Arjan van der Vaart for kindly sending us his code to calculate the transfer entropy.
Supporting Information Available
Extra RMSD and RMSF figures, dynamical network analysis result and figure for RBD dimer, principal component analysis results and binding entropy results; RMSD of heavy atoms comparison between RBD monomer and dimer based on all monomer and dimer simulations; RMSF comparison between RBD monomer and dimer simulations based on all (including both backbone and side chain atoms), backbone atoms only and side-chain only selections; dynamical network analysis applied on RBD dimer and results; principle component analysis method introduced and applied on RBD monomer and dimer forms, and results compared between combined RBD monomer trajectories and each unit in the combined RBD dimer trajectories; estimation of RBD binding entropy based on S2 results for RBD in monomer and dimer forms, and summation of binding entropies for different bond types; mapping of binding entropies on RBD structure. This material is available free of charge via the Internet at http://pubs.acs.org.
The authors declare no competing financial interest.
Funding Statement
National Institutes of Health, United States
Supplementary Material
References
- Tong Y.; Hota P.; Hamaneh M. B.; Buck M. Insights into Oncogenic Mutations of Plexin-B1 Based on the Solution Structure of the Rho GTPase Binding Domain. Structure 2008, 16, 246–258. [DOI] [PMC free article] [PubMed] [Google Scholar]
- Negishi M.; Oinuma I.; Katoh H. Plexins: Axon Guidance and Signal Transduction. Cell. Mol. Life Sci. 2005, 62, 1363–1371. [DOI] [PMC free article] [PubMed] [Google Scholar]
- Zhang L.; Bouguet-Bonnet S.; Buck M.. Allostery: Methods and Protocols; Methods in Molecular Biology 796; Springer Protocols: Secaucus, NJ, USA, 2011; pp 235–259. [DOI] [PMC free article] [PubMed] [Google Scholar]
- Wang H.; Hota P. K.; Tong Y.; Li B.; Shen L.; Nedyalkova L.; Borthakur S.; Kim S.; Tempel W.; Buck M.; Park H.-W. Structural Basis of Rnd1 Binding to Plexin Rho GTPase Binding Domains (RBDs). J. Biol. Chem. 2011, 286, 26093–26106. [DOI] [PMC free article] [PubMed] [Google Scholar]
- Hota P. K.; Buck M. Plexin Structures Are Coming: Opportunities for Multilevel Investigations of Semaphorin Guidance Receptors, Their Cell Signaling Mechanisms, and Functions. Cell. Mol. Life Sci. 2012, 69, 3765–3805. [DOI] [PMC free article] [PubMed] [Google Scholar]
- Hota P. K.; Buck M. Thermodynamic Characterization of Two Homologous Protein Complexes: Associations of the Semaphorin Receptor Plexin-B1 RhoGTPase Binding Domain with Rnd1 and Active Rac1. Protein Sci. 2009, 18, 1060–1071. [DOI] [PMC free article] [PubMed] [Google Scholar]
- Tong Y.; Chugha P.; Hota P. K.; Alviani R. S.; Li M.; Tempel W.; Shen L.; Park H. W.; Buck M. Binding of Rac1, Rnd1, and RhoD to a Novel Rho GTPase Interaction Motif Destabilizes Dimerization of the Plexin-B1 Effector Domain. J. Biol. Chem. 2007, 282, 37215–37224. [DOI] [PMC free article] [PubMed] [Google Scholar]
- Goodey N. M.; Benkovic S. J. Allosteric Regulation and Catalysis Emerge via a Common Route. Nat. Chem. Biol. 2008, 4, 474–482. [DOI] [PubMed] [Google Scholar]
- Hammes G. G. Multiple Conformational Changes in Enzyme Catalysis. Biochemistry 2002, 41, 8221–8228. [DOI] [PubMed] [Google Scholar]
- Kern D.; Zuiderweg E. R. The Role of Dynamics in Allosteric Regulation. Curr. Opin. Struct. Biol. 2003, 13, 748–757. [DOI] [PubMed] [Google Scholar]
- Schreiber T. Measuring Information Transfer. Phys. Rev. Lett. 2000, 85, 461–464. [DOI] [PubMed] [Google Scholar]
- Qi Y.; Im W. Quantification of Drive-Response Relationships Between Residues During Protein Folding. J. Chem. Theory Comput. 2013, 9, 3799–3805. [DOI] [PMC free article] [PubMed] [Google Scholar]
- Kamberaj H.; van der Vaart A. Extracting the Causality of Correlated Motions from Molecular Dynamics Simulations. Biophys. J. 2009, 97, 1747–1755. [DOI] [PMC free article] [PubMed] [Google Scholar]
- Wand A. J. Dynamic Activation of Protein Function: A View Emerging from NMR Spectroscopy. Nat. Struct. Biol. 2001, 8, 926–931. [DOI] [PubMed] [Google Scholar]
- Finerty P. J. Jr.; Mittermaier A. K.; Muhandiram R.; Kay L. E.; Forman-Kay J. D. NMR Dynamics-Derived Insights into the Binding Properties of a Peptide Interacting with an SH2 Domain. Biochemistry 2005, 44, 694–703. [DOI] [PubMed] [Google Scholar]
- Bracken C.; Carr P. A.; Cavanagh J.; Palmer A. G. 3rd. Temperature Dependence of Intramolecular Dynamics of the Basic Leucine Zipper of GCN4: Implications for the Entropy of Association with DNA. J. Mol. Biol. 1999, 285, 2133–2146. [DOI] [PubMed] [Google Scholar]
- Bouguet-Bonnet S.; Buck M. Compensatory and Long-Range Changes in Picosecond Nanosecond Main-Chain Dynamics upon Complex Formation: 15N Relaxation Analysis of the Free and Bound States of the Ubiquitin-like Domain of Human Plexin-B1 and the Small GTPase Rac1. J. Mol. Biol. 2008, 377, 1474–1487. [DOI] [PMC free article] [PubMed] [Google Scholar]
- Zerbetto M.; Anderson R.; Bouguet-Bonnet S.; Rech M.; Zhang L.; Meirovitch E.; Polimeno A.; Buck M. Analysis of 15N-1H NMR Relaxation in Proteins by a Combined Experimental and Molecular Dynamics Simulation Approach: Picosecond-nanosecond Dynamics of the Rho GTPase Binding Domain of Plexin-B1 in the Dimeric State Indicates Allosteric Pathways. J. Phys. Chem. B 2012, 117, 174–84. [DOI] [PMC free article] [PubMed] [Google Scholar]
- Bai Q.; Shen Y.; Jin N.; Liu H.; Yao X.. Molecular Modeling Study on the Dynamical Structural Features of Human Smoothened Receptor and Binding Mechanism of Antagonist LY2940680 by Metadynamics Simulation and Free Energy Calculation. Biochim. Biophys. Acta–Gen. Subj. 2014, DOI: 10.1016/j.bbagen.2014.03.010. [DOI] [PubMed] [Google Scholar]
- Ermakova E.; Kurbanov R. Effect of Ligand Binding on the Dynamics of Trypsin. Comparison of Different Approaches. J. Mol. Graphics Model. 2014, 49, 99–109. [DOI] [PubMed] [Google Scholar]
- Tong Y.; Hota P. K.; Penachioni J. Y.; Hamaneh M. B.; Kim S.; Alviani R.; Shen L.; He H.; Tempel W.; Tamagnone L.; Park H.; Buck M. Structure and Function of the Intracellular Region of the Plexin-B1 Transmembrane Receptor. J. Biol. Chem. 2009, 284, 35962–35972. [DOI] [PMC free article] [PubMed] [Google Scholar]
- Tong Y.; Buck M. 1H, 15N, 13C Assignments and Secondary Structure Characterization Reveal that the Rac1 Binding Domain of Plexin-B1 Has an Ubiqitin Fold. J. Biomol. NMR 2005, 31, 369–370. [DOI] [PMC free article] [PubMed] [Google Scholar]
- Yang D.; Kay L. E. Contributions to Conformational Entropy Arising from Bond Vector Fluctuations Measured from NMR-derived Order Parameters: Application to Protein Folding. J. Mol. Biol. 1996, 263, 369–382. [DOI] [PubMed] [Google Scholar]
- Zerbetto M.; Buck M.; Meirovitch E.; Polimeno A. Integrated Computational Approach to the Analysis of NMR Relaxation in Proteins: Application to psns Main Chain 15N1H and Global Dynamics of the Rho GTPase Binding Domain of Plexin-B1. J. Phys. Chem. B 2011, 115, 376–388. [DOI] [PMC free article] [PubMed] [Google Scholar]
- Hamaneh M. B.; Zhang L.; Buck M. A Direct Coupling between Global and Internal Motions in a Single Domain Protein? MD Investigation of Extreme Scenarios. Biophys. J. 2011, 101, 196–204. [DOI] [PMC free article] [PubMed] [Google Scholar]
- Phillips J.; Braun R.; Wang W.; Gumbart J.; Tajkhorshid E.; Villa E.; Chipot C.; Skeel R.; Kalé L.; Schulten K. Scalable Molecular Dynamics with NAMD. J. Comput. Chem. 2005, 26, 1781–1802. [DOI] [PMC free article] [PubMed] [Google Scholar]
- MacKerell A. D. Jr.; et al. All-Atom Empirical Potential for Molecular Modeling and Dynamics Studies of Proteins. J. Phys. Chem. B 1998, 102, 3586–3616. [DOI] [PubMed] [Google Scholar]
- Buck M.; Bouguet-Bonnet S.; Pastor R. W.; MacKerell A D. Jr. Importance of the CMAP Correction to the CHARMM22 Protein Force Field: Dynamics of Hen Lysozyme. Biophys. J. 2006, 90, L36–L38. [DOI] [PMC free article] [PubMed] [Google Scholar]
- Fisher N. I.; Lee A. J. A Correlation Coefficient for Circular Data. Biometrika 1983, 70, 327–332. [Google Scholar]
- Fisher N. I.Statistical Analysis of Circular Data; Cambridge University Press: New York, 1993; p 277. [Google Scholar]
- Mardia K. V.; Jupp P. E.. Directional Statistics; Wiley: Chichester, UK, 2000; p 429. [Google Scholar]
- Humphrey W.; Dalke A.; Schulten K. VMD – Visual Molecular Dynamics. J. Mol. Graphics 1996, 14, 33–38. [DOI] [PubMed] [Google Scholar]
- Sethi A.; Eargle J.; Black A.; Luthey-Schulten Z. Dynamical Networks in tRNA:protein Complexes. Proc. Natl. Acad. Sci. U.S.A. 2009, 106, 6620–6625. [DOI] [PMC free article] [PubMed] [Google Scholar]
- Glykos N. Software News and Updates. Carma: a Molecular Dynamics Analysis Program. J. Comput. Chem. 2006, 27, 1765–1768. [DOI] [PubMed] [Google Scholar]
Associated Data
This section collects any data citations, data availability statements, or supplementary materials included in this article.


