Abstract
We report a two-photon fluorescent probe (PN1) that can be excited by 750 nm femto-second pulses, shows high photostability and negligible toxicity, and can visualize H2O2 distribution in live cells and tissue by two-photon microscopy.
Hydrogen peroxide (H2O2) is a prominent member of the reactive oxygen species (ROS) family that includes the superoxide anion radical (O2•), hydroperoxy radical (HO2•), hydroxyl radical (HO•), peroxy radical (RO •), singlet oxygen (1 2 O2), and hypochlorous acid (HOCl), and plays important roles in physiology, aging, and disease in living organisms.1 While unregulated increases in cellular levels of H2O2 have been linked to DNA damage, mutation, and genetic instability, controlled bursts of H2O2 are utilized for cell signaling.2 In this context, a key challenge for elucidating the biological roles of H2O2 in living systems is the ability to monitor this specific ROS at the cell, tissue, and organism level. For this purpose, a growing number of fluorescent probes for H2O2 have been developed; one of our laboratories has focused on H2O2 reporters based on a boronate deprotection mechanism, which offers selectivity for H2O2 over other ROS and is suitable for imaging H2O2 fluxes in living cells.3 However, the majority of these probes have been evaluated using one-photon microscopy (OPM) and require relatively short excitation wavelengths (<525 nm), which limits their use in deep tissue imaging due to the shallow depth of penetration (<80 μm). As such, methods for imaging H2O2 in thicker samples, such as tissues and whole organisms, are therefore relatively rare.4
An attractive approach to the detection of H2O2 deep inside living tissues is the use of two-photon microscopy (TPM). TPM, which employs two near-infrared photons as the excitation source, offers a number of advantages over one-photon microscopy, including increased depth of penetration (>500 μm), localized excitation, and prolonged observation time due to the use of less-damaging lower energy light.5 To our knowledge, there have been no reports on the targeted design and evaluation of two-photon (TP) probes for H2O2 that are applicable for deep tissue imaging. To this end, an effective TP probe for H2O2 should exhibit the following features: sufficient solubility in aqueous buffers, selective reactivity to H2O2, a high TP cross section, and stable spectroscopic properties over a biologically relevant pH range.
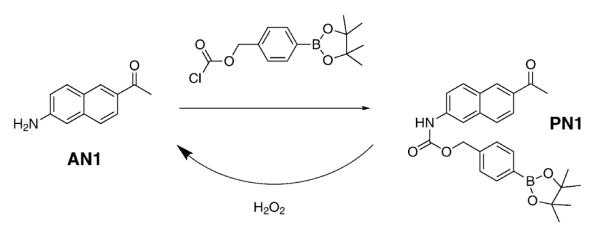
With these aims in mind, we now report Peroxy Naphthalene 1 (PN1), a new ratiometric TP fluorescence probe for H2O2. PN1 was constructed by introducing a boronate-based carbamate leaving group to 2-acetyl-6-aminonaphthalene (AN1), a TP fluorophore that has been successfully utilized in live tissue imaging.6 We anticipated that the H2O2-triggered boronate cleavage of the electron-poor carbamate linkage would liberate the more electron-rich AN1, giving rise to more red-shifted fluorescence emission.
The synthesis of PN1 is shown in Scheme 1 (see ESI† for details). Its solubility was determined by fluorescence titration and found to be 4.5 μM in physiological buffer (HEPES 20 mM, pH 7.1), which is sufficient for cellular staining (Fig. S2, ESI†). Under these simulated physiological conditions, PN1 exhibits an absorption maximum at λabs = 321 nm (ε = 12 200 M−1 cm−1) and an excitation maximum at λexc = 328 nm. The uncaged AN1 features a red-shifted absorption maximum at λabs = 338 nm (ε = 13 200 M−1 cm−1) and an excitation maximum at λexc = 358 nm (Fig. S3, ESI†). PN1 exhibits a fluorescence maximum at λfl = 453 nm (Φ = 0.70), which is almost 50 nm blue-shifted from that of AN1 (λfl = 500 nm, Φ = 0.40). The larger Stokes shift observed in AN1 compared to PN1 is likely to be due to greater stabilization of the charge-transfer excited state of the former fluorophore that contains both electron-donating and electron-withdrawing groups.
Scheme 1.

Synthesis of Peroxy Naphthalene 1 (PN1).
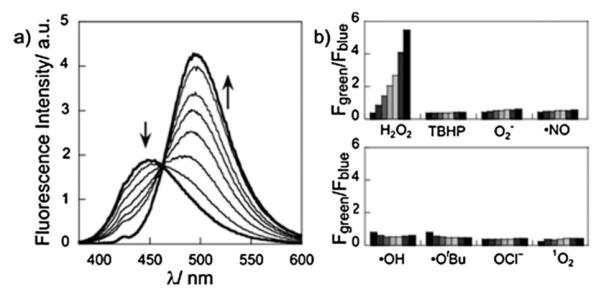
The reaction between PN1 and H2O2, monitored by fluorescence emission (Fig. 1a) and LC-MS (Fig. S1, ESI†), produced AN1 as the only major fluorescent product. The excitation spectrum of a 3 μM solution of PN1 treated with 1 mM H2O2 in HEPES buffer shows a gradual increase at 370 nm with a concomitant decrease at 358 nm. This process follows 1st-order kinetics, with kobs = 9.5 × 10⁻⁴ s−1 (Fig. S4, ESI†). Similar results were observed in the fluorescence mode, where the PN1 emission at 450 nm decreases while the AN1 emission at 500 nm increases, following pseudo 1st-order kinetics, with kobs = 8.3–9.2 × 10⁻⁴ s−1 (Fig. 1 and Fig. S5d–f, ESI†). The relative emission intensity ratios at 390–465 (Fblue) and 500–550 nm (Fgreen) showed a 17-fold increase (Fgreen/Fblue, Fig. S5c, ESI†), establishing that PN1 can serve as a ratiometric fluorescent probe for H2O2.
Fig. 1.

(a) Fluorescence response of 3 μM PN1 to 1 mM H2O2. Spectra were acquired at 0 to 60 min at every 10 min and at 120 min after H2O2 was added. (b) Fluorescence responses of 3 μM PN1 to various reactive oxygen species (ROS) at 200 μM. Bars represent emission intensity ratios Fgreen/Fblue at 0, 15, 30, 45, 60, 90, and 120 min after addition of each ROS. Data were acquired at 25 °C in 20 mM HEPES, pH 7.1, with excitation at λ = 370 nm.
We then evaluated the ability of PN1 to detect H2O2 in a two-photon mode. The TP action spectra of PN1 and AN1 in HEPES buffer at pH 7.1 indicate Φδmax values of 12 and 45 GM at 720 and 740–750 nm, respectively (Fig. S6, ESI†). The observed TP spectral changes upon the H2O2-mediated conversion of PN1 to AN1 are nearly identical to those observed in the one-photon spectra, showing a pseudo 1st-order increase at 500 nm with kobs = 1.0 × 10⁻³ s−1, with a 10-fold enhancement in the Fgreen/Fblue ratio (Fig. S7, ESI†).
PN1 exhibits a monotonic increase in Fgreen/Fblue with time after the addition of 200 μM H2O2 (Fig. 1b). Furthermore, PN1 demonstrates high selectivity for H2O2 over competing ROS, as revealed by the unperturbed Fgreen/Fblue ratios upon addition of 200 μM concentrations of various ROS, including tert-butylhydroperoxide, hypochlorite, superoxide, singlet oxygen, nitric oxide, hydroxyl radical, and tert-butoxy radical. Moreover, the Fgreen/Fblue ratio is independent of solution pH over a biologically relevant pH range (Fig. S8, ESI†). The combined results reveal that PN1 can detect H2O2 by ratiometric fluorescence imaging with minimum interference from pH or from other ROS.
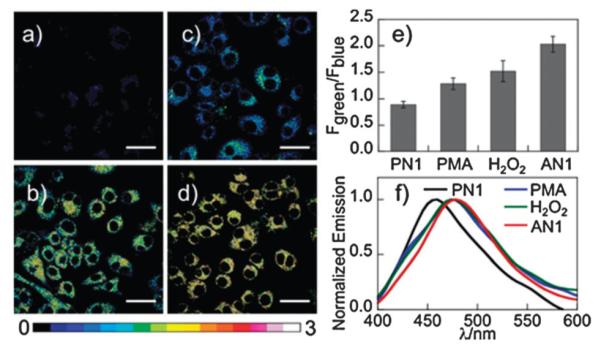
We next sought to utilize PN1 as a TP probe to detect changes in H2O2 levels in cellular environments. Using 750 nm TP excitation in a scanning lambda mode, Raw 264.7 cells labeled with PN1 (Fig. 2a) show an emission maximum at 450 nm, while cells treated with AN1 (Fig. 2d) show a red-shifted emission maximum at 480 nm (Fig. 2f and Fig. S10, ESI†). The blue-shift in AN1 emission in cells compared to that observed in aqueous buffer is due to the solvatochromic response of AN1 to the more hydrophobic environment of the former. Upon TP excitation, the ratio image constructed from blue and green collection windows gives average emission ratios of 0.89 and 2.03 for PN1 and AN1, respectively. When the cells were pretreated with 100 μM H2O2 for 30 min before labeling with PN1, the ratio increased to 1.52 (Fig. 2c, e, and Fig. S11, ESI†). More importantly, PN1 is responsive to the endogenous burst of H2O2 produced in a living cell, showing a patent increase in the Fgreen/Fblue ratio to 128 after stimulation of the PN1-labeled cells for 30 min with phorbol myristate acetate (PMA; Fig. 2b and e), which induces H2O2 generation through a cellular inflammation response7 (Fig. 2c and Fig. S11, ESI†). PN1 is non-toxic to cells over the course of imaging experiments, as determined by a WST-1 assay (Fig. S12, ESI†).
Fig. 2.

Pseudocolored TPM ratiometric images (Fgreen/Fblue) of Raw 264.7 cells labeled with (a) PN1 and (d) AN1. (b, c) Cells were pretreated with (b) 1 μL PMA (1 μg mL−1) and (c) 100 μM H2O2 for 30 min before labeling with PN1. (e) Average Fgreen/Fblue in images (a–d). (f) Lambda mode scanning of PN1, PMA, H2O2 and AN1 in figures (a–d). Images were acquired using 750 nm excitation and fluorescent emission windows: blue = 390–465 nm, green = 500–550 nm. Scale bar = 30 μm.
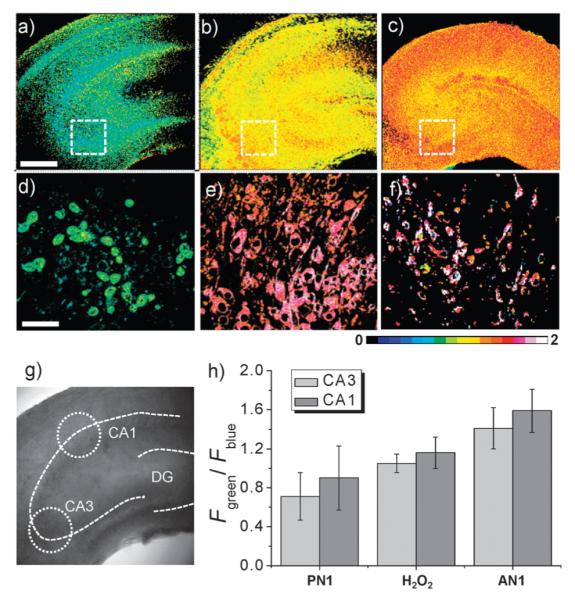
To further establish the utility of PN1 for bioimaging applications, we also investigated the ability of this new probe to detect the changes in H2O2 levels deep within live tissue. The hippocampus was isolated from a 2-day old rat, and a slice was incubated with 20 μM PN1 for 1 h at 37 °C (Fig. 3b). The brightfield image of this slice reveals the CA1 and CA3 regions and the dentate gyrus (DG; Fig. S13, ESI†). Because the structure of the brain tissue is heterogeneous, we acquired 10 TPM images at the depths of 90–180 μm to visualize the overall H2O2 distribution (Fig. S13, ESI†). The TPM ratio-metric images constructed from Fig. S13 (ESI†) reveal that the basal H2O2 levels in the CA1 and CA3 regions are higher than in the DG region (Fig. 3a), with average emission ratios of 0.71 and 0.90 in the CA1 and CA3 regions, respectively (Fig. 3h). Upon treatment of the tissue with increasing amounts of H2O2, the ratio increased gradually to 1.05 (CA3) and 1.16 (CA1) at 1 mM H2O2 (Fig. 3g, Fig. S14 and S15, ESI†), which lie between those measured in PN1- and AN1-labeled tissues (Fig. 3c and h, Fig. S13 and S16, ESI†). Hence, PN1 is responsive to rises in H2O2 in tissue. Moreover, the images at a higher magnification enable observation of the H2O2 distribution in the individual cells in the CA1 region at a 120 μm depth (Fig. 3d–f). Further, the TPM images at the depths 90–180 μm show the H2O2 distribution in each xy plane along the z direction (Fig. S13, ESI†). These findings demonstrate that PN1 is capable of detecting changes in H2O2 levels in live tissues at depths ranging from 90–180 μm using TPM.
Fig. 3.

Ratiometric TPM image of a fresh rat hippocampal slice. (a–c) Ratiometric TPM images were accumulated along the z-direction at the depths of 90–180 μm (10 images) with magnification at 10×: (a) a hippocampal slice labeled with PN1 (20 μM, 30 min), (b) a hippocampal slice pretreated with H2O2 (1 mM, 30 min) before PN1 labeling (20 μM, 30 min), and (c) a hippocampal slice labeled with AN1 (20 μM, 30 min). (d–f) Enlarged images of (a–c) at 120 μm depth with 100× magnification. (g) Approximate positions (dotted circles) used for measurements of emission ratios in the CA3 and CA1. (h) Average Fgreen/Fblue in (a–c). The TPEF were collected at two channels (blue = 390–465 nm, green = 500–550 nm) upon excitation at 750 nm with fs pulse. Scale bars: 30 μm (a) and 300 μm (d).
To conclude, we have developed a new TP probe, PN1, which shows a significant TP cross section, a marked blue-to-green emission color change in response to H2O2, good ROS selectivity, low cytotoxicity, and insensitivity to pH in the biologically relevant pH range. This new probe can visualize H2O2 levels in live cells, as well as in living tissues at depths of 90–180 μm without interference from other biologically relevant ROS. Current efforts are directed at utilizing PN1 and related fluorophores for optical imaging and mechanistic studies of H2O2 chemistry in complex biological specimens.
Supplementary Material
Footnotes
Electronic supplementary information (ESI) available: Experimental details for the synthesis, photophysical studies, and cell and tissue imaging. See DOI: 10.1039/c1cc13583j
Notes and references
- 1(a).Harman D. Proc. Natl. Acad. Sci. U. S. A. 1981;78:7124–7128. doi: 10.1073/pnas.78.11.7124. [DOI] [PMC free article] [PubMed] [Google Scholar]; (b) Finkel T, Holbrook NJ. Nature. 2000;408:239–247. doi: 10.1038/35041687. [DOI] [PubMed] [Google Scholar]; (c) Stadtman ER. Free Radical Res. 2006;40:1250–1258. doi: 10.1080/10715760600918142. [DOI] [PubMed] [Google Scholar]
- 2(a).Lambeth JD. Nat. Rev. Immunol. 2004;4:181–186. doi: 10.1038/nri1312. [DOI] [PubMed] [Google Scholar]; (b) Rhee SG. Science. 2006;312:1882–1883. doi: 10.1126/science.1130481. [DOI] [PubMed] [Google Scholar]; (c) Stone JR, Yang S. Antioxid. Redox Signaling. 2006;8:243–270. doi: 10.1089/ars.2006.8.243. [DOI] [PubMed] [Google Scholar]; (d) Miller EW, Tulyathan O, Isacoff EY, Chang CJ. Nat. Chem. Biol. 2007;3:263–267. doi: 10.1038/nchembio871. [DOI] [PubMed] [Google Scholar]; (e) Giorgio M, Trinei M, Migliaccio E, Pelicci PG. Nat. Rev. Mol. Cell Biol. 2007;8:722–728. doi: 10.1038/nrm2240. [DOI] [PubMed] [Google Scholar]; (f) Veal EA, Day AM, Morgan BA. Mol. Cell. 2007;26:1–14. doi: 10.1016/j.molcel.2007.03.016. [DOI] [PubMed] [Google Scholar]; (g) Poole LB, Nelson KJ. Curr. Opin. Chem. Biol. 2008;12:18–24. doi: 10.1016/j.cbpa.2008.01.021. [DOI] [PMC free article] [PubMed] [Google Scholar]; (h) Winterbourn CC. Nat. Chem. Biol. 2008;4:278–286. doi: 10.1038/nchembio.85. [DOI] [PubMed] [Google Scholar]; (i) Bao L, Avshalumov MV, Patel JC, Lee CR, Miller EW, Chang CJ, Rice ME. J. Neurosci. 2009;29:9002–9010. doi: 10.1523/JNEUROSCI.1706-09.2009. [DOI] [PMC free article] [PubMed] [Google Scholar]; (j) Paulsen CE, Carroll KS. ACS Chem. Biol. 2010;5:47–62. doi: 10.1021/cb900258z. [DOI] [PMC free article] [PubMed] [Google Scholar]; (k) Miller EW, Dickinson BC, Chang CJ. Proc. Natl. Acad. Sci. U. S. A. 2010;107:15681–15686. doi: 10.1073/pnas.1005776107. [DOI] [PMC free article] [PubMed] [Google Scholar]; (l) Woo HA, Yim SH, Shin DH, Kang D, Yu DY, Rhee SG. Cell. 2010;140:517–528. doi: 10.1016/j.cell.2010.01.009. [DOI] [PubMed] [Google Scholar]; (m) Dickinson BC, Peltier J, Stone D, Schaffer DV, Chang CJ. Nat. Chem. Biol. 2011;7:106–112. doi: 10.1038/nchembio.497. [DOI] [PMC free article] [PubMed] [Google Scholar]
- 3(a).Chang MCY, Pralle A, Isacoff EY, Chang CJ. J. Am. Chem. Soc. 2004;126:15392–15393. doi: 10.1021/ja0441716. [DOI] [PMC free article] [PubMed] [Google Scholar]; (b) Miller EW, Albers AE, Pralle A, Isacoff EY, Chang CJ. J. Am. Chem. Soc. 2005;127:16652–16659. doi: 10.1021/ja054474f. [DOI] [PMC free article] [PubMed] [Google Scholar]; (c) Albers AE, Okreglak VS, Chang CJ. J. Am. Chem. Soc. 2006;128:9640–9641. doi: 10.1021/ja063308k. [DOI] [PubMed] [Google Scholar]; (d) Srikun D, Miller EW, Dornaille DW, Chang CJ. J. Am. Chem. Soc. 2008;130:4596–4597. doi: 10.1021/ja711480f. [DOI] [PubMed] [Google Scholar]; (e) Dickinson BC, Chang CJ. J. Am. Chem. Soc. 2008;130:11561–11562. doi: 10.1021/ja802355u. [DOI] [PMC free article] [PubMed] [Google Scholar]; (f) Albers AE, Dickinson BC, Miller EW, Chang CJ. Bioorg. Med. Chem. Lett. 2008;18:5948–5950. doi: 10.1016/j.bmcl.2008.08.035. [DOI] [PMC free article] [PubMed] [Google Scholar]; (g) Srikun D, Albers AE, Nam CI, Iavaron AT, Chang CJ. J. Am. Chem. Soc. 2010;132:4455–4465. doi: 10.1021/ja100117u. [DOI] [PMC free article] [PubMed] [Google Scholar]; (h) Dickinson BC, Huynh C, Chang CJ. J. Am. Chem. Soc. 2010;132:5906–5915. doi: 10.1021/ja1014103. [DOI] [PMC free article] [PubMed] [Google Scholar]
- 4(a).Lee D, Khaja S, Velasquez-Castano JC, Dasari M, Sun C, Petros J, Taylor WR, Murthy N. Nat. Mater. 2007;6:765–769. doi: 10.1038/nmat1983. [DOI] [PubMed] [Google Scholar]; (b) Van de Bittner GC, Dubikovskaya EA, Bertozzi CR, Chang CJ. Proc. Natl. Acad. Sci. U. S. A. 2010;107:21316–21321. doi: 10.1073/pnas.1012864107. [DOI] [PMC free article] [PubMed] [Google Scholar]
- 5(a).Zipfel WR, Williams RM, Webb WW. Nat. Biotechnol. 2003;21:1368–1376. doi: 10.1038/nbt899. [DOI] [PubMed] [Google Scholar]; (b) Helmchen F, Denk W. Nat. Methods. 2005;2:932–940. doi: 10.1038/nmeth818. [DOI] [PubMed] [Google Scholar]
- 6(a).Kim HM, Cho BR. Acc. Chem. Res. 2009;42:863–872. doi: 10.1021/ar800185u. [DOI] [PubMed] [Google Scholar]; (b) Kim HM, Cho BR. Chem.–Asian J. 2011;6:58–69. doi: 10.1002/asia.201000542. [DOI] [PubMed] [Google Scholar]
- 7.Geraghty KM, Chen S, Harthill JE, Ibrahim AF, Toth R, Morrice NA, Vandermoere F, Moorhead GB, Hardie DG, MacKintosh C. Biochem. J. 2007;407:231–241. doi: 10.1042/BJ20070649. [DOI] [PMC free article] [PubMed] [Google Scholar]
Associated Data
This section collects any data citations, data availability statements, or supplementary materials included in this article.


