Abstract
Quantum dots are semiconductor nanocrystals that exhibit exceptional optical and electrical behaviors not found in their bulk counterparts. Following seminal work in the development of water-soluble quantum dots in the late 1990's, researchers have sought to develop interesting and novel ways of exploiting the extraordinary properties of quantum dots for biomedical applications. Since that time, over 10,000 articles have been published related to the use of quantum dots in biomedicine, many of which regard their use in detection and diagnostic bioassays. This review presents a didactic overview of fundamental physical phenomena associated with quantum dots and paradigm examples of how these phenomena can and have been readily exploited for manifold uses in nanobiotechnology with a specific focus on their implementation in in vitro diagnostic assays and biodetection.
Nanotechnology as a field seeks to explore, understand and exploit the unique physicochemical properties of materials that emerge as their size is decreased to scales on the order of 100 nanometers or less. Over the last two decades, one area of persistent interest in nanotechnology, and nanobiotechnology in particular, involves optical and electrical phenomena associated with semiconductors at the nanometer scale. Semiconductor nanocrystals, typically referred to as “quantum dots” (QDs), exhibit exotic optical and electrical behaviors not found in their bulk counterparts, including high photoluminescence (PL), extinction coefficients and photostability. These properties have engendered considerable interest in fields ranging from quantum computing and solar cells to in vivo tumor labeling and high sensitivity in vitro diagnostics. Here we present a didactic overview of fundamental physical phenomena associated with quantum dots and paradigm examples of how these phenomena can and have been readily exploited for manifold uses in nanobiotechnology with a specific focus on their implementation in diagnostics and biodetection.
A Brief History of Quantum Dots
Initial investigations
The “dot” referred to in quantum dots connotes an extremely confined region of space approaching zero dimensions (likewise quantum “wires” and “wells” are confined to one and two dimensions, respectively). It is within this nanometer size regime that semiconductors transition from behaving as bulk materials to those predicted for individual or small groups of atoms and likewise begin to exhibit exceptional phenomena.
At the center of the majority of interesting phenomena associated with quantum dots is the exciton, that is, an electron-hole pair, created via external energy (e.g., light) input, that remains coupled by Coulombic attraction in materials such as semiconductors and insulators. While the initial theory behind the exciton has existed since the 1930's with the pioneering works of Frenkel1, as well as Wannier2 and Mott3, it wasn't until the late 1960's that researchers began focusing their efforts into the creation of semiconductors capable of exploiting the theory for applications in applied science. In particular, interest piqued into the development of light emitting diodes, in which exciton electron-hole recombination results in the emission of light. While predicted well in advance by theory, advances in microfabrication in the 1970's led to the first demonstrations of quantum confinement in 2-dimensional wells in 19744 and one-dimensional wires in 19825. Shortly thereafter, seminal work by researchers such as Brus6, 7 and Ekimov8 resulted in the first reproducible methods for synthesizing nanoscale crystals of CdS capable of physically constricting excitons in all three dimensions, thus creating the first so-called quantum dots.
Timeline of Seminal Papers/Novel Uses in Biotechnology
Despite the discovery and development of the QD, the concept of using luminescent semiconductor nanocrystals for biological applications was not immediately obvious, mainly due to QD's typically highly toxic constituents, such as cadmium, as well as their native inability to be readily dispersed within biologically compatible [aqueous] solutions. Capitalizing on advancements in QD synthesis techniques9-11 aimed to improve QD size monodispersity while maintaining highly luminescent behavior, in 1998 two landmark papers reported the encapsulation of QDs in water soluble coatings in order to allow labeling of both formalin-fixed12 and live13 cells.
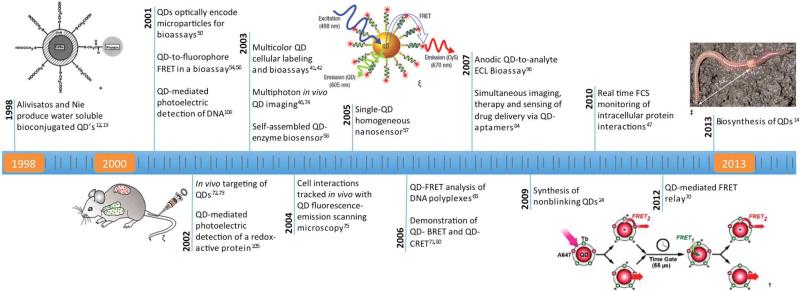
The publication of these papers ushered in a virtual gold rush of research into the potential biological uses and applications of QDs. The decade of 2000-2010 alone saw the publication of almost 100,000 manuscripts (>10,000 of which dealt with biotechnological applications) relating to the development, characterization and use of QDs. While a detailed analysis of these papers is well beyond the scope of this review, Figure 1 provides a publication timeline of 25 select landmark papers in the use of QDs in biotechnology, ending in the notable, recently published report of the biosynthesis of QDs by common earthworms14.
Figure 1.
Timeline of selected seminal papers in the use of quantum dots for biomedical applications. * From [13]. Reprinted with permission from AAAS. ζ From [72]. ©2002 by the National Academy of Sciences ; ξ Author's work from [57]. ; † Reprinted with permission from [70]. ©2012 American Chemical Society. ‡ Reprinted by permission from Macmillan Publishers Ltd: Nature Nanotechnology [14], ©2013.
Principle Physics of Quantum Dots
Quantum dots are nanocrystals made of semiconductor materials. There are two very different approaches to fabricate quantum dots: a top-down approach in which the dimensionality of solid matter is gradually reduced, and a bottom-up approach, in which quantum dots are grown via chemical synthesis15 or epitaxial growth16. These methods have been able to produce quantum dots with diameters of a few nanometers, whose sizes are small enough to display quantum mechanical properties. A notable characteristic of quantum dots is that their optical and electrical properties are highly composition- and size-dependent17.
Optical Properties of Quantum Dots
In semiconductors, after the absorption of a photon with energy above the semiconductor band gap energy, an electron-hole pair (or exciton) will be created. If the semiconductor nanocrystal has a diameter smaller than its exciton Bohr radius (usually a few nanometers), the electrons and holes are confined, leading to a so-called quantum confinement effect where energy levels are quantized, with values directly dependent on the nanocrystal size18. As the size of the quantum dots is decreased (typically smaller than 10nm), the quantum confinement effects become more dominant.
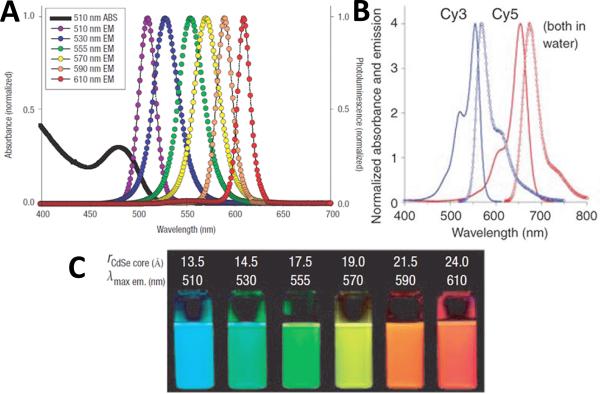
Quantum dot photoluminescence (PL) occurs when the excited electron relaxes to the ground state and recombines with the hole, releasing electromagnetic energy with a narrow and symmetric energy band (frequency) within the UV to near-infrared regime17. With broad excitation spectra and narrow and symmetric emission spectra, quantum dots have a very large wavelength difference between their respective absorption and emission peaks (large Stoke Shifts), which is in remarkable contrast to common organic dyes, as shown in Figure 2(A) and (B)19, 20. Meanwhile, quantum dots made up of different materials, or different sized quantum dots of the same material, have distinct emission wavelengths (or PL colors). Generally, the emission PL wavelength is proportional to the size of the quantum dot. The larger the quantum dot, the redder its color is, as shown in Figure 2 (C). This unique property allows excitation of mixed quantum dot populations at a single wavelength far removed from their respective emissions, such as in UV range. Other QD optical properties interesting to engineers and biologists include their high quantum yield, better photostability compared with common standard fluorophores, high molar extinction coefficients that are 10 to 100 times of that of common organic dyes, as well as exceptional resistance to photo- and chemical degradation19, 21-23. One oft-cited drawback of QDs is that intermittent fluorescence (blinking) of QDs can be observed by temporarily preventing exciton recombination, such as in continuous excitation (though the development of non-blinking QDs has also been reported24). This phenomenon can be observed at the single molecule level and reduces quantum yield25, 26. In terms of applications, single quantum dots can be seen and tracked using standard fluorescence spectroscopy27, as well as confocal microscopy28, total internal reflection microscopy29 and basic wide-field epifluorescence microscopy30, 31.
Figure 2.
Optical properties of quantum dots. (A) Absorption and emission spectrum of six different QDs. (B) Absorption and emission spectrum of two organic dyes, Cy3 and Cy5. Note that QDs have larger Stoke Shifts than common dyes. (C) Comparison of fluorescence photo graphs of six QD in (A) with CdSe core sizes. All samples were excited with 365nm UV light. Reprinted by permission from Macmillan Publishers Ltd: Nature Materials [19], ©2005 and Nature Methods [20], ©2005.
Electrical Properties of Quantum Dots
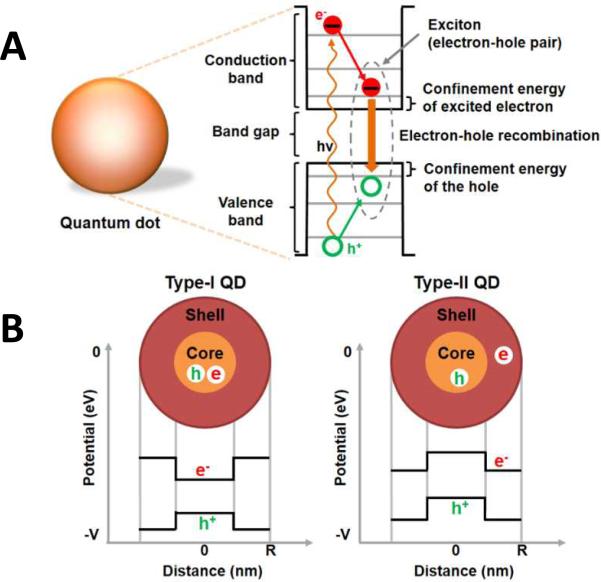
Quantum dots are often referred to as “artificial atoms” because their charge carriers (electrons and holes) occupy discrete energy states, just like the electrons of a single atom. This is a direct result of carrier confinement within the physical dimensions of the nanocrystals18, 32. As mentioned above, if provided sufficient energy, QD electrons will be excited from the valence band to the conduction band while leaving an empty state in the valence band. This empty state, or “hole”, can be thought of as a mobile positive charge in the valance band. After excitation, the electrons and holes rapidly lose their energy and jump to levels near the bottom of their conduction and the top of their valence bands, respectively. As the electrons fall across the band gap to recombine with the holes, in so-called electron-hole recombination, energy is released, as shown in Figure 3(A). The released energy can be considered as the sum of the confinement energies of the excited electron and hole, the band gap energy and the bound energy of the exciton. Generally, a photon can only excite one electron [of a fluorescent species] across the band gap and create only one exciton, with excess energy released as heat. In QDs, however, multiple excitons can be simultaneously created, which is called multiple exciton generation (MEG) and helps increase the energy conversion efficiency of the nanocrystals15, 33.
Figure 3.
Electrical properties of quantum dots. (A) Illustration of electron-hole recombination and corresponding energy levels. (B) Energy level diagram of type-I and type-II QDs.
QD core/shell structures yield confinement behaviors that are highly related to the core and shell materials themselves. For example, when the energy band gap of the shell material is larger than that of the core material, the electron-hole pair is confined within the core, as shown in Figure 3(B). These QDs are called type-I QDs and demonstrate higher photoluminescence (PL) efficiency as compared to type-II QDs (where the band gap of the shell is smaller than the QD). In Type-II QDs, the electrons and holes are confined to the shell and the core respectively, as shown in Figure 3(B). Here, the charge carriers have to cross the core-shell interface for radiative recombination, emitting fluorescence with wide and tunable wavelength. Of particular note, however, is the strong interaction that occurs between these charge carriers and any surrounding materials, which is highly dependent on the materials themselves and greatly affects the overall electrical properties of QDs. Hence, it is resultantly very difficult to formulate a general many-electron theory of QDs34.
QDs are very sensitive to the presence of additional charges (electrons or holes) either on their surfaces or in the surrounding environment, which can alter both the nanocrystal absorption and PL alike35-37. As a result, the presence of additional charges can lead to quenching of the QD PL due to Auger recombination (non-radiative energy transfer to a third charge carrier)38, 39. Complete quenching can be observed through addition of charge(s) directly into the QD core, resulting in strong spatial overlap between the charge(s) and the exciton, whereas partial quenching results from charge(s) that occur on the nanocrystal surface due to weaker overlap with the exciton35-39. Likewise, bringing redox-active complexes in close proximity to the QDs may quench the QD PL by promoting transfer of external electrons (and holes) to either the QD core or the QD surface states40.
Quantum Dot Phenomena and Paradigms
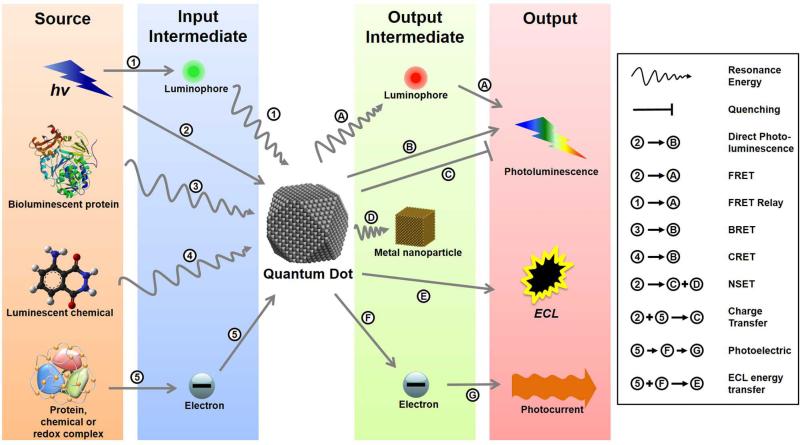
Given the astounding phenomena that semiconductor nanocrystals are capable of, it is no wonder that they have generated extraordinary interest in the applied sciences. One of the principle areas within nanobiotechnology that has sought to capitalize upon these phenomena is the field of biological diagnostics and detection. Likewise, it is the aim of this review to explore examples of how researchers have leveraged the unique characteristics of QDs to accomplish unprecedented diagnostic assays. Figure 4 provides a schematic overview of the different energy transfer schemes of in vitro bioassays that have been employed and are detailed in this review. Each QD-based assay requires an energy source, whether it be electromagnetic (light), chemical, biochemical or electrical. Each type of assay described in this review utilizes a different pathway for the energy, which is ultimately detected in the form of electromagnetic energy or an electrical (current/voltage) output.
Figure 4.
Quantum Dot Assay Schemes. Schematic illustration of the energy transfer schemes utilized in various types of QD assay paradigms. Each assay requires an energy input (electromagnetic, chemical, biochemical or electrical) that is transmitted to the QDs either directly or through an input intermediate. This energy modifies the electron behaviour within the QDs, which release the energy, either directly or through an output intermediate, in the form of emitted light or charge transfer (electrical current).
Optical and Resonance Phenomena
Due to the unique and highly desirable luminescent properties of QDs, it is no wonder that the most common and direct means of incorporating QDs into bioassays is through excitation with a light source and/or measurement of their resulting emitted light. The field has moved well-beyond the simple luminescent labeling demonstrated over 15 years ago, to assays involving numerous QDs, fluorophores and energy sources. It is ultimately the unique combinations of these components that result in new assay forms and paradigms.
Direct Photoluminescence
Basic Immunoassay
The most basic use of QDs in bioassays is the direct labeling of targets of interest, such as first described by Nie13 and Alivisatos12, who used QDs to directly label mammalian cells in vitro. Similarly, QDs can be conjugated to high affinity [detection] molecules, such as antibodies, in order to directly label individual biomolecules of interest, as shown in Figure 5 (A). In a direct PL assay, after the QD-labeled detection molecules have been given sufficient time to bind to their target, unbound QDs must be washed away in order to identify the target of interest. This leaves a resulting PL signal from the remaining QDs that is proportional to amount of target present in the assay. This type of assay is termed heterogeneous due to the need for wash steps.
Figure 5.
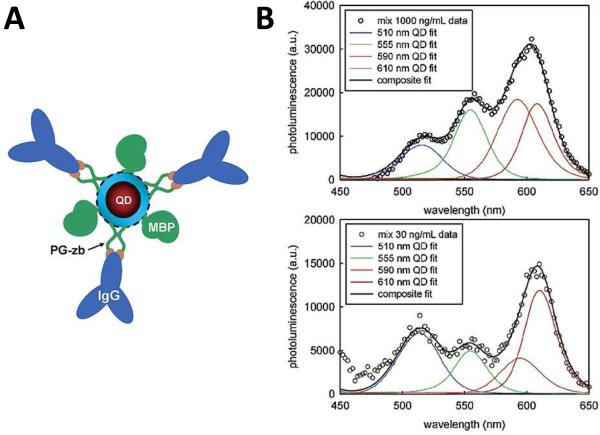
QD Immunoassay. (A) Illustration showing a mixed surface QD conjugate. Antibodies against target molecules are conjugated to ZnS-capped QDs through PG-zb adaptor and/or MBP purification proteins. Four QD colors are each conjugated to antibodies against different toxins and used in a standard sandwich immunoassay. (B ) Composite (black curve) and component (color curves) luminescence from the 4-color immunoassay at 1000 ng/ml (top) and 30 ng/ml (bottom). Taken from [41], not subject to copyright.
Within only a few years following the introduction of water soluble QDs, QD-based immunoassays had already significantly advanced well beyond simple single-color assays to demonstrations of simultaneous two-, three- and even four-color assays. As an example, Goldman et. al. described a QD-based direct PL four-color assay for the detection and simultaneous quantification of biothreat agents41. Such multicolor assays require QDs with appropriately designed luminescent characteristics. While, unlike organic fluorophores, QDs can, in general, be excited using a single excitation source/spectrum, their diameters must differ to a substantial enough extent to allow for minimal overlapping between their respective energy states and resulting emission spectra, allowing for easy differentiation between the labels. By conjugating different labels to different antibodies, each antibody target can be simultaneously detected and quantified by color. Figure 5 (B) shows the detected luminescence from the four-color assay as a function of wavelength. By carefully determining the emissive spectra from each of the QD labels, the combined luminescent signal (black line) can be deconvoluted into individual luminescence from each of the four QD components, thus allowing for quantification of each of the four target antigens. There are numerous reports of direct luminescence assays, some notable examples include: live cell labeling42, bacterial pathogen detection43, immunochromatography44, in situ molecular profiling of cancer biomarkers45, 46, QD fluorescence correlation spectroscopy (FCS) of protein dynamics47, labeling of vasculature48 and in situ hybridization49.
Multiplexed Optical Coding
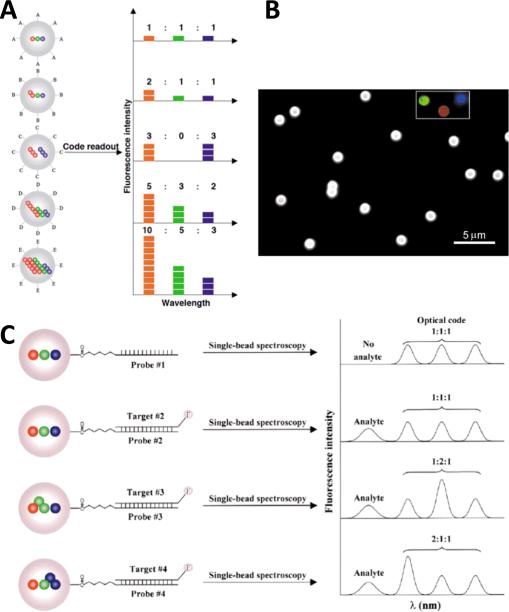
While the characteristic narrow emission spectra of differentially-sized QDs can be leveraged as distinct individual labels, Han et. al. demonstrated that they can also be used combinatorially to create massively multiplexed assays.50 By encapsulating varying ratios and quantities (intensities) of different QD colors within polymer microbeads, the group, led by Nie, developed unique optically encoded microbeads. Once again, a key enabling advantage of using QDs is their ability to be used with a single excitation source/spectrum. Figure 6 (A) shows an illustration of the developed encoding scheme, while (B) shows a color micrograph of encoded microparticles. This method could theoretically generate (nm - 1) unique codes, where n is the number of distinguishable QD colors and m is the number of intensities employed. While up to a million optical codes are possible, the authors estimate that the creation of as many as 5-6 colors and 6 different intensity levels is more realistically achievable, thereby yielding a total of 10,000-40,000 unique optical labels. Figure 6 (C) shows how the encoding scheme might be used with single-bead spectroscopy for a highly multiplexed assay. This and other multiplexing schemes have been developed and employed in a number of notable publications, including SNP analysis51, single DNA molecule detection via multiplexed color colocalization31, genetic mutation analysis using fluorescence coincidence detection52 and magnetic-QD multiplexed gene expression analysis53.
Figure 6.
Multiplexed Optical Encoding. (A) Schematic showing optical encoding scheme using wavelength and intesity via multiple QDs embedded within microparticles. (B) Color micrograph showing microbeads appearing white due to encoding with red, green and blue QDs (individual colors shown in inset). (C) Mutliplexed hybridization assay using optically-encoded microbeads. Specific probes are conjugated to each microbead code and used to recognize a specific target. The targets are nonspecifically fluorescently labeled and when “captured”, the corresponding bead can be decoded and the target identified. Reprinted by permission from Macmillan Publishers Ltd: Nature Biotechnology [50], ©2001.
Förster Resonance Energy
In direct PL QD-based assays, excitons created by an excitation light source recombine, releasing energy as emitted light. It is possible, however, for the energy to be transferred via resonance to other molecules nearby without emission of light by the QD. In an appropriately designed system, fluorescent molecules can be used as acceptors of this energy; the energy is then able to excite an outer shell electron within the fluorescent molecule and be released as light (fluoresce) upon relaxation of the electron to its ground state. While this energy transfer mechanism was first described by Förster in 194854 and is likewise referred to as Förster resonance energy transfer (FRET), it wasn't until 2001 that QD-based FRET was reported in a bioassay55, 56. Notably, FRET is a highly distance-dependent phenomenon, as the efficiency of energy transfer is inversely related to the sixth power of the distance between the donor and acceptor.
QD-Fluorophore DNA Nanosensor
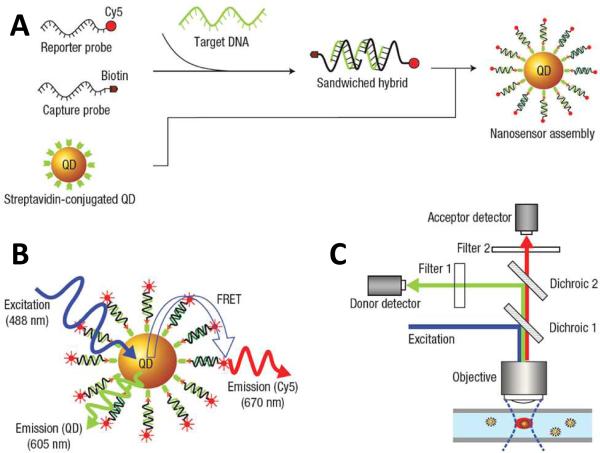
The FRET mechanism adds another dimension to QD-based assays that can be employed to develop exquisite assays that would otherwise be difficult or impossible. As FRET is only observed when the donor and acceptor are extremely proximal to each other, it can be used to detect the presence or absence of fluorophores near the QD surface. And since fluorophores can be readily conjugated to high affinity molecules, including complementary nucleic acid sequences, QD-based FRET can likewise be used to detect the presence of molecules and DNA target sequences of interest, such as our group described in 200557. Biotin-conjugated DNA capture probes and Cy5 fluorophore-conjugated reporter probes were first mixed with target DNA sequences and allowed to hybridize. Streptavidin-coated QDs were then added thereby creating QD-[capture probe]-[target DNA]-[reporter probe] complexes, as shown in Figure 7 (A). Thus, in the presence of target DNA, excited QDs emit light as well as transfer energy to the fluorophore-tagged reporter probes, as shown schematically in Figure 7 (B). Finally, as shown in Figure 7 (C), light emitted by both the QDs and reporter probes could then be simultaneously detected using a custom confocal spectroscopic setup, capable of individually probing each QD as it passed through a detection volume within a microcapillary. Overall, the nanosensor assay exhibited an assay sensitivity over 100 times better than conventional molecular beacon DNA detection schemes. Furthermore, the assay was homogeneous, requiring no wash steps to achieve target detection. Homogeneous, FRET-based assays have also been utilized for the detection of numerous compounds and other applications, including detection of maltose58, TNT59, cocaine60, HIV DNA binding elements61, DNA methylation62-64, as well as examinations into the stability and unpacking dynamics of DNA polyplexes in gene delivery65-67.
Figure 7.
QD-Fluorophore DNA Nanosensor. (A) Streptavidin-coated QDs capture target DNA hybridized to pairs of complementary probes labeled with a fluorophore or biotin, respectively. (B) Upon illumination, both the QD and the fluorophore simultaneously emit light through photoluminescence and FRET, respectively. (C) The emitted light is detected using a custom microcapillary-based setup capable of probing individual nanocomplexes. Taken from authors’ work [57].
Polymerase Dynamics
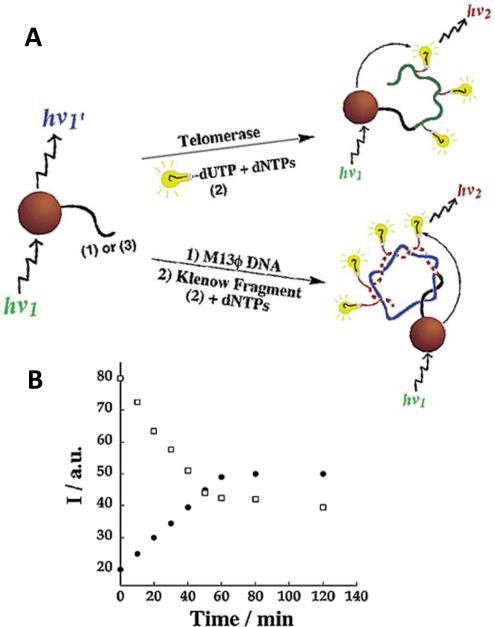
The efficiency of FRET from the QDs to acceptor fluorophores is a characteristic determined by a number of parameters such as the spectral overlap between the QD emission and fluorophore excitation, as well as the distance and luminescent efficiencies of the two. These factors likewise dictate the probability that a photon will be absorbed by the QD and transferred to the fluorophore to be emitted as light. Furthermore, the greater the number of acceptor fluorophores located within close proximity to the QD, the greater the likelihood that the exciton energy will be transferred to any one of the acceptors. A very interesting example of leveraging this phenomenon was reported in 200368 by Patolsky et. al. who employed it to measure the dynamics of DNA replication. In these experiments, primer oligonucleotides or viral DNA was covalently linked to QDs and was polymerized using telomerase or DNA polymerase, respectively. The authors performed the polymerization using a mixture of nucleotides that included fluorescently-labeled uracil residues that acted as FRET acceptors, as shown in Figure 8 (A). The polymerization was followed by excitation of the QDs with a laser and observation of the emitted luminescence from both the QDs and the fluorescent uracil as it was incorporated into the polymerizing DNA on the surface of the QDs. Hence, as the polymerization proceeded, an increasing number of acceptor fluorophores became incorporated into the growing DNA strands on the surface of the QDs, thereby increasing the relative FRET fluorescence from the fluorophore and decreasing the ratio of light emitted by the QDs in a manner directly proportional to the rate of DNA replication, as shown Figure 8 (B). Following Patolsky's report of a QD FRET-based dynamic assay, similar paradigms have also been leveraged to investigate the kinetics of DNA strand exchange69.
Figure 8.
QD FRET-based Monitoring of Polymerase Dynamics. (A) QDs were functionalized with either synthetic or M13ϕ DNA and incubated in the presence of Texas Red-labeled dUTP telomerase or DNA polymerase, respectively. (B) As replication (or telomerization) proceeds, the QD emission (white circles) decreases and the FRET- based Texas Red emission (solid black circles) increases. Reprinted with permission from [68]. ©2003 American Chemical Society.
FRET Relay
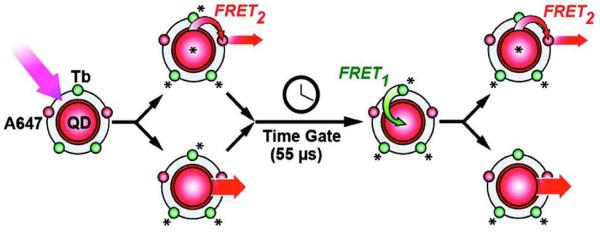
QDs are not only capable of donating resonant energy, but also capable of accepting it from excited luminescent compounds. This was elegantly demonstrated by Algar et. al.70, who reported the generation of a so-called “FRET relay”. Here, nanocomplexes were synthesized consisting of a central QD bioconjugated to multiple peptides and oligonucleotides each labeled with either a long lifetime luminescent Terbium complex or a standard fluorescent dye (Alexafluor 647), as shown in Figure 9. In order to initiate the relay, the nanocomplexes were illuminated with a xenon flash bulb at a wavelength of 339nm, at the center of the Terbium absorbance peak. Since this wavelength also provided sufficient energy for the creation of excitons within the QDs, a time-gate (55µs) was employed to filter out the initial QD luminescence as well as the initial FRET to the dye. After the time-gate, the long lifetime Tb-complexes remained excited and continued to transfer resonant energy to the QDs, thereby re-exciting them and allowing resonant energy transfer from the QDs to the fluorophores and thus completing the Terbium to QD to fluorophore relay. The authors additionally showed how such a relay could be employed as highly sensitive biosensors for proteolytic cleavage, DNA hybridization and for use in time-gated multiplex assays.
Figure 9.
FRET Relay. QD complexes consisting of a fluorophore (A647) and Terbium (Tb) are excited with incident light causing QD and A647 FRET2-basedbased light emission. After a 55 μs time gate, the excited Tb continues to excite the QD via FRET1, causing further emissions from both the QD and A647 FRET2. Reprinted with permission from [70]. ©2012 American Chemical Society.
Similar two-step “FRET Relay” paradigms have also been utilized in the detection of maltose58 and by our group to investigate the condensation and stability of DNA polyplexes67. Here, plasmid DNA, dual-labeled with QDs and fluorophores, was complexed with a fluorescently labeled cationic polymer gene carrier. Excitation of the QDs initiated a FRET cascade from the QD to the plasmid fluorophore (nucleic acid dye) to the fluorophore (Cy5)-labeled gene carrier. This system ultimately allowed for a three-state kinetic model of DNA condensation: (1) fully condensed DNA with emission from all three luminophores; (2) polymer-released intact DNA exhibiting emission from the QD and nucleic acid dye and (3) degraded DNA resulting in emission solely from the QD. Thus, by analyzing the luminescence from the system, the real time kinetics of DNA delivery could be readily observed and studied. It is such highly engineered multiple component and distance-dependent FRET assays that now allow researchers the ability to study molecular dynamics and kinetics with unprecedented ease.
Other types of Energy Transfer
In each of the previous examples of energy transfer, the initial energy source came from an exciting light source, i.e. electromagnetic radiation. There are, however, alternate means of exciting electrons and generating excitons within QDs that do not require an external light source, as illustrated in Figure 4.
Bioluminescence Resonance Energy Transfer (BRET)
As early as 2006, researchers had reported the development of so-called “self-illuminating” QDs for in vivo imaging applications.71 While in vivo imaging with QDs had been previously demonstrated72-75, like the previous examples illustrated above, it necessitated the use of an external illuminating source, which can prove difficult in clinical practice. These self-illuminating QDs, however, were shown to be capable of acting as acceptors of energy released from a biochemical reaction, the luciferase-mediated oxidation of coelenterazine, through a process highly similar to FRET known as bioluminescence resonance energy transfer (BRET). The same group, Xia et. al., later demonstrated that a similar energy transfer scheme could be utilized for novel in vitro bioassays for matrix metalloproteinases (MMPs)76. As shown in Figure 10, luciferase was bioconjugated to QDs via an amino acid linker that also acted as an MMP substrate. In the absence of MMPs (and the presence of coelenterazine), the bioconjugated QDs emitted light due to BRET from the luciferase reaction, while in the presence of specific MMPs capable of cleaving the amino acid linker, the luciferase linkage was severed thereby preventing BRET and QD light emission. Thus by measuring the loss in BRET signal (light emitted by the QD), the presence and concentration of MMPs could be determined. Other examples of novel, QD BRET-based assays include: protease detection77, nucleic acid detection78 and cellular protein interactions79.
Figure 10.

BRET-based Matrix Metalloproteinase (MMP) Activity. QDs are covalently conjugated to bioluminescent luciferase via a MMP substrate peptide linker. In the presence of the luciferase substrate (coelenterazine), the QDs are excited via BRET and emit light. In the presence of the MMP, however, the peptide is cleaved, stopping the BRET. Reprinted with permission from [76]. ©2008 American Chemical Society.
Chemiluminescence Resonance Energy Transfer (CRET)
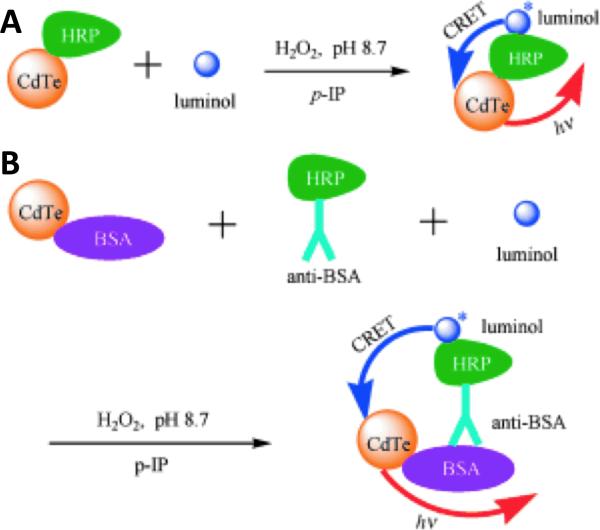
While the Rao group pursued applications using QD-based BRET, other investigators continued to pursue alternative schemes of transferring energy to and from QDs in order to develop novel bioassays. In the same year (2006), Huang et. al. demonstrated a highly similar, synthetic means of transferring chemical energy via resonance to QDs80. Here, QDs were first bioconjugated to horseradish peroxidase (HRP) enzymes, creating catalyst nanocomplexes. In the presence of luminol and hydrogen peroxide, HRP catalyzes the oxidation of luminol, ultimately exciting electrons within the molecule that proceed to relax, emitting light (fluorescing) in the process. As shown in Figure 11 (A), by coupling the HRP in close proximity to the QD, the energy that would normally result in light production could instead be transferred through resonance to the QD through another FRET-like phenomenon known as chemiluminescence resonance energy transfer (CRET). As a proof-of-concept, the authors also demonstrated a simple immunoassay utilizing CRET for the detection of proteins, as illustrated in Figure 11 (B). In this paradigm, the common protein bovine serum albumin (BSA) acted as a mock antigen and was bioconjugated to the QDs. The QDs were then allowed to bind with HRP-labeled anti-BSA antibodies in the presence of luminol. After binding, hydrogen peroxide was once again added to the solution to catalyze the luminol reaction on the surface of the QDs, thereby resulting in CRET and emission of light by the QDs. Similar QD-CRET paradigms have been exploited for the detection of a number of other bioassays, including: DNA and aptamer-based detection81, post-electrophoretic detection82, and VEGF detection83.
Figure 11.
CRET-based Immunoassay of Proteins. (A) Horseradish peroxidase (HRP)- conjugated QDs can be excited via CRET in the presence of peroxide, luminol and an enhancer (p-IP). (B) QDs can also be conjugated to antigen (here, BSA) and allowed to bind to HRP-conjugated antibodies, allowing for CRET (in the presence the reactants). Reprinted with permission (CC BY-NC) from [80].
Nanosurface Energy Transfer (NSET) AND Dipole To Metal Particle Energy Transfer (DMPET)
Bioassays and sensors involving the transfer of resonant energy do not necessarily require the use of a second luminescent species. By transferring energy to nonluminescent chemicals or materials, one can also develop quenching-based assays. Such a paradigm is commonly employed in assays involving organic fluorophores closely coupled to quenching moieties such as in the case of drug release studies84 and so-called molecular beacons. Likewise, many researchers have reported quenching of fluorescent species by inorganic nanometals. While the exact mechanism of this quenching was initially somewhat enigmatic, it was generally agreed upon that the transfer of resonant energy from the fluorescent species to the metal prevented photon emission. After a number of detailed experiments, it additionally became clear that quenching occurs at significantly greater distances than predicted by the 1/r6 dependence of the FRET mechanism. Further studies confirmed an alternative means of energy transfer exhibiting a 1/r4 dependence that, like FRET, was based upon a donor dipole, but with a metal surface as the acceptor (as opposed the second dipole in FRET). This means of energy transfer was termed nanosurface energy transfer (NSET)85, with a more refined version of the theory later appearing as dipole to metal particle energy transfer (DMPET)86.
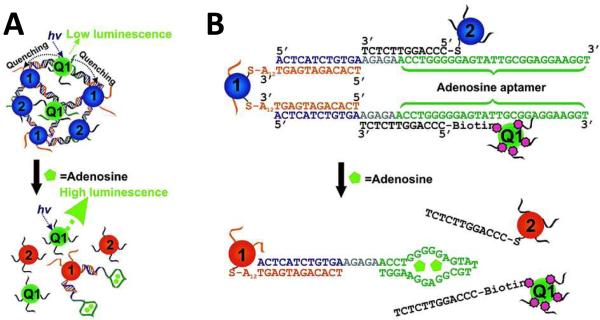
One interesting example of the implementation of DMPET into a bioassay was given by Liu et. al., who used the DMPET phenomenon in the development of a multiplexed bioassay for adenosine and cocaine.87 Here, multiple QDs were complexed with multiple gold nanoparticles through aptamers, which specifically recognize cocaine and adenosine, partially hybridized between the particles, as shown in Figure 12 (A). In the absence of either target molecule, the gold nanoparticles quenched PL emission from the QDs, while in the presence of either adenosine or cocaine, the aptamer-nanoparticle hybridization was disrupted, thereby separating the QDs/nanoparticle complexes and restoring the PL properties of the QDs, as illustrated in Figure 12 (B). The authors purported a number of advantages of the bioassay, including: fast response times (<1 min), multiplexing capability and two detection modes – fluorometric and colorimetric. A number of other NSET-based assays have additionally been reported, such as: NSET to graphene oxide for biomolecule detection88, and gold-based NSET for glucose detection89.
Figure 12.
NSET-based Aptamer Detection of Adenosine. (A) QDs (Q1) complexed to gold nanoparticles via oligonucletide linkers (1 & 2) to adenosine-specific aptamers exhibit low PL due to non-PL NSET. (B) In the presence of adenosine, the aptamer oligonucleotide linkers are displaced, disrupting the nanocomplexes, thereby allowing the QDs to luminesce normally. Reprinted with permission from [87]. ©2007 American Chemical Society.
Electrical and Electrochemical Phenomena
Though most bioassays are still based on the luminescent properties of QDs, there is increasing interest in utilizing the unique electrical properties of QDs as well. Here, charge transfer between QDs and other luminescent species, electrochemiluminescence (ECL) energy transfer, and other unique electronic behaviors of QDs conjugated with nanocomplexes have been investigated. Their unique phenomena have been further utilized in the development of novel applications for biological detection and analysis.
Charge Transfer
Peptide-Bridged Ruthenium Multiplexing
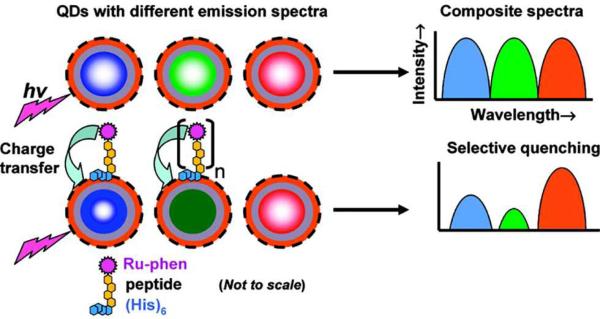
As previously illustrated, QD-based fluorescence multiplexing has been demonstrated and applied in several biological assays. While most assays utilize the QD-emission photoluminescence directly or resonance energy transfer phenomena between luminescent species, multiplexing signals can also be achieved through charge (electron) transfer between QDs and proximal redox complexes. For example, Medintz et.al. reported that charge-transfer interactions between QDs and ruthenium phenanthroline (Ru-phen) could be used to provide controlled quenching of QD photoluminescence in a multiplexed format90. Here, Ru-phen complexes were self-assembled onto QDs via peptide bridges, which were used as electron conduits between them, as shown in Figure 13. Due to the charge transfer from the metal complex to the surface states of the QDs, QD PL could be quenched efficiently. The experimental results demonstrated that the loss in PL was directly related to the number of Ru-phen complexes brought into proximity of each QD. The authors also reported that smaller QDs exhibited higher quenching efficiencies than their large-size counterparts, which may be attributable to a higher density of surface states and higher probability for charge transfer. Hence by combining redox complex conjugated QDs of multiple sizes, charge-transfer-induced PL quenching could occur over a broad window of the optical spectrum, yielding high orders of multiplex quenching. At least eight individual optical channels have been resolved using QD emissions ranging from 510 to 635 nm. This QD-redox complex quenching mechanism has been studied to create biosensors targeting proteins40, maltose91, fatty acids92, or detecting DNA hybridization in a multiplexed format93. It has also been used to monitor proteolytic activity of multiple enzymes40. In the future, multicolor fluorescence barcodes or multiplex small molecule detection such as DNA may become useful applications of QD-Ru-phen-peptide interactions.
Figure 13.
Peptide-bridged Ruthenium Multiplexing. QDs with different emission spectra are selectively conjugated with Ru-phen complexes via peptide bridge, resulting in the selective quenching of their PL emissions via electron transfer from complex to the QD surface. The quenching of each QD emission spectrum can be manipulated by varying the number of complexes assembled onto the QD. Reprinted with permission from [90]. ©2009 American Chemical Society.
Electrochemiluminescence (ECL) Energy Transfer
Another means of transferring energy to and from redox active species is electrochemiluminescence (ECL). A novel methodology based on ECL energy transfer from excited QDs to analytes has been reported as a new analytical technique94, 95. Liu et.al. developed an ECL analytical system consisting of mercaptopropionic acid (MPA)-modified CdTe QDs and an indium tin oxide (ITO) electrode96. When dissolving the QDs in an air-saturated PBS solution, a stable and intensive anodic ECL emission could be detected at the surface of the electrode. The ECL emission of excited states of QDs was ultimately attributed to electron-transfer between reduced and oxidized QDs, where the ITO electrode and dissolved oxygen in solution played important roles. Under the drive of a positive potential, the electrode mediates the transfer of the electrons from electrooxidized QDs to dissolved oxygen molecules to produce O2− species. The O2− molecules then act to inject electrons directly into other QDs in solution to form reduced QDs. The direct electron-hole recombination of reduced QDs and electrooxidized QDs form excited QDs, leading to anodic ECL emission. Several experiments have further shown that the ECL emission is also very sensitive to the electrooxidation products of catechol derivatives, such as dopamine and L-adrenalin, and can be quenched effectively by these agents through an energy-transfer process, as shown in Figure 14. This phenomenon proposes a novel and promising analytical application of QDs for ECL detection of quenchers and quencher-related analytes97. This ECL-based paradigm has also been exploited for the detection of glucose98, human IgG (HIgG)99 and human prealbumin (PAB)100.
Figure 14.
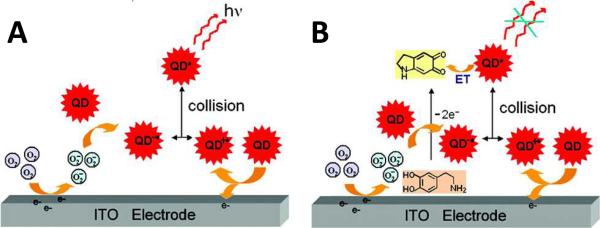
ECL Energy Transfer. (A) ECL mechanism of QDs. Electrons from oxidized QDs transfer to dissolved oxygen molecules through ITO electrode and generate O2− species. The O2− then inject electrons QDs to form reduced QDs, which collide with the oxidized QDs to produce excited QDs, leading to ECL emission. (B) At the appearance of oxidation product of dopamine, ECL emission can be quenched through the energy transfer between excited QDs and the oxidation product. Reprinted with permission from [96]. ©2007 American Chemical Society.
Surface Charge
Electrophoretic Mobility Shift Assay
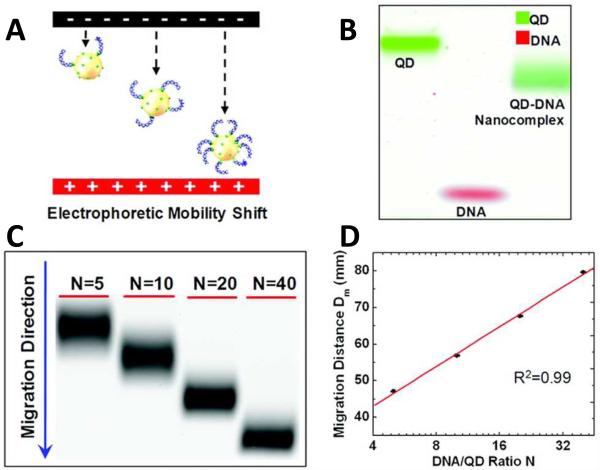
While electrophoretic mobility shift assays (EMSAs) are most commonly used to study DNA-protein interactions101, Zhang et. al. developed a similar Quantum Dot Electrophoretic Mobility Shift Assay (QEMSA) for precise DNA quantification102. This assay is based on the differential electrophoretic mobility of QD-DNA nanoassemblies based upon their respective degrees of surface-bound DNA, as shown in Figure 15 (A) and (B). At neutral pH, the streptavidin-functionalized QDs have very little intrinsic charge, which makes them ideal candidates for QEMSA as opposed to most other nanoparticles with high intrinsic charge. Hence, the zeta-potential of the QD-DNA nanoassembly is dominated by the number of DNA molecules bound to the QD surface. Under an electrical field, the electrophoretic mobility of the nanocomplexes as well as their migration distance within a gel matrix increases with the number of bound DNA, thus DNA quantity is translated into shifts in gel band position, as shown in Figure 15 (C). Meanwhile, the QDs also act as fluorescent reporters and allow the nanocomplexes to be optically detected without additional fluorophore labeling which may affect the electrophoretic migration rate. As an example, genomic DNA was quantified by labeling amplification products that were then self-assembled onto streptavidin-coated QDs to form nanocomplexes with DNA:QD ratios dependent on the amount of target present. Thus the resultant gel electrophoresis migration distances of the nanoassemblies could be utilized to determine DNA input quantity, as shown in Figure 15 (D). QEMSA has additionally been utilized to analyze copy number amplification of a specific gene, RSF1/HBXAP, in ovarian carcinoma cells and to quantify DNA methylation of a tumor suppressor gene, p16/CDK2A. The authors additionally demonstrated that this assay had better resolution than qPCR in terms of DNA copy number variation (CNV) and DNA methylation102. Similar QD-molecular beacon (QD-MB) conjugates have been developed as multicolor nanoprobes for DNA detection103and functionalized QDs have also been utilized for human serum protein imaging in polyacrylamide gel electrophoresis104.
Figure 15.
Quantum Dot Electrophoretic Mobility Shift Assay (QEMSA). (A) Schematic diagram of electrophoretic mobility of streptavidin-coated QD conjugated with biotin-labeled DNA fragments. Their mobility increases with the number of DNA molecules assembled onto the QD surface. (B) Pseudocolor gel image shows that QD DNA nanocomplexes migrate faster than naked QD (green) while slower than DNA (red). (C) Gel image of QD-DNA nanocomplexes with different DNA: QD ratios, N, in agarose gel. (D) Migration curve of migration distance of each gel band versus ratio N in (C). Reprinted with permission from [102]. ©2012 American Chemical Society.
Photoelectric
Enzyme Inhibition Assay
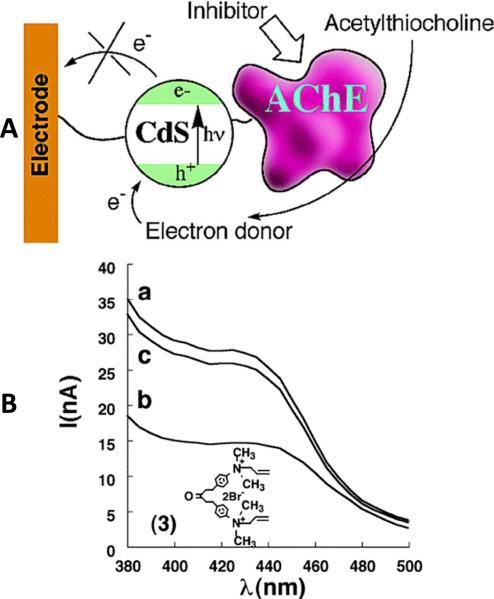
The generation of excitons within QDs do not necessarily need to be used solely for optical detection. In fact, exciton generation results in a hole that can be “filled” by other sources of electrons, leading to electrons left in the conduction band that are then free to contribute to a measurable [photo]-current. Pardo-Yissar et. al. capitalized upon this property in an assay for acetylcholine esterase (AChE), a serine protease that can catalyze the hydrolysis of acetylcholine, a central nervous system neurotransmitter105. Some AChE inhibitors, such as toxins (e.g., cobratoxin) or Sarin, are capable of blocking AChE-mediated nerve conduction leading to paralysis of vital functions. Here, the research team developed a quantum dot hybrid system was developed by the researchers to detect these AChE inhibitors photoelectrochemically. This hybrid system consisted of a functionalized Au-electrode and CdS nanoparticles coated with a protecting monolayer. The particles were then covalently bound onto the electrode surface, while the AChE were covalently linked to the particles’ surfaces, as shown in Figure 16 (A). In the presence of acetylcholine, thiocholine was generated through the hydrolysis of acetylcholine catalyzed by AChE. The hydrolysate thiocholine then acted as a donor to excite nanoparticles and generate a steady-state photocurrent over an hour long time period. These experiments also showed that the generation of photocurrents could be controlled by the concentration of acetylthiocholine. In the presence of AChE inhibitors, the photocurrent decreased, while the current recovered when the inhibitor was washed away, as shown in Figure 16 (B). This is the first example of a coupled semiconductor nanoparticle/enzyme hybrid system for photocurrent generation and inhibitor detection. Other applications of this photoelectrochemical hybrid system include pH sensing106, glucose detection107, immunoassays108 and DNA detection109.
Figure 16.
Enzyme Inhibition Assay. (A) Photocurrents are generated through a CdS nanoparticle/AChE hybrid system with an electrode. In the presence of enzyme inhibitors, electron transfer from AChE could be blocked thus photocurrent will decrease. (B) Photocurrent spectra of CdS nanoparticle/AChE hybrid system in the presence of acetylcholine, (a) without inhibitor, (b) upon addition of inhibitor, (c) after inhibitor being washed away. Reprinted with permission from [105]. ©2003 American Chemical Society.
Note on QD Syntheses and Sources
Besides the various bioassays presented above, QDs have also been employed in numerous solar photoconversion devices such as photovoltaic cells110, 111, solid-state lighting such as QD light-emitting diodes (LEDs)112 and electroluminescent displays in next-generation screens113. The wide range of QD applications has prompted intensive exploration into the synthesis of QDs and numerous approaches have been instituted, resulting in greatly improved QD quality compared with the past decades. These processes include tailored syntheses of QDs with better size and shape control, new classes of materials and better control of surface modifications. While beyond the scope of this review, readers interested in the various synthesis strategies and alternative applications are referred to several excellent published reports.15, 16, 114-116 Alternatively, bioassay-specific QDs can be readily obtained from a number of commercial sources, such as Sigma-Aldrich (St. Louis, MO), Life Technologies (Carlsbad, CA), Ocean Nano Tech (Fayettesville, AR), Antibodies Inc. (Davis, CA), among others.
Outlook and Conclusions
Over the last 15 years, the unique properties of QDs have been exploited in a plethora of ways in the development of more sensitive, rapid and useful bioassays. This work has provided important conceptual proofs of the numerous potential advantages of QDs over traditional assay reagents. Nonetheless significant hurdles remain and have prevented the widespread adoption of QDs in clinical applications. The most notable concerns regard the safety of QD constituents (e.g., Cd) as well issues regarding assay reproducibility. These issues have resulted in general recommendations for QDs to be relegated solely to specialized experiments.20 However, more recent studies into QD toxicity have alleviated some of the toxicity fears by demonstrating that, if the QDs are capped/protected sufficiently, they can be considered biocompatible for in vivo use in primates.117 Nonetheless, regardless of their in vivo biocompatibility, QDs remain ideal resources for many in vitro biomedical applications due to their astounding attributes. Future work should provide further advancements in QD synthesis and stabilization techniques to merit the replacement of fluorophores and incorporation into many common applications and assays. As this occurs, the techniques and paradigms described here will provide significant enhancements to clinical diagnostics in the immediate future.
Acknowledgements
The authors would like to acknowledge all of the tremendous work that has gone into the research and publications that have been covered and reviewed here. The authors would also like to thank funding sources from National Institutes of Health (R01CA155305, U54CA151838, R21CA173390) and National Science Foundation (1159771, 0967375).
References
- 1.Frenkel J. Physical Review. 1931;37:17–44. [Google Scholar]
- 2.Wannier GH. Physical Review. 1937;52:0191–0197. [Google Scholar]
- 3.Mott NF. Proceedings of the Royal Society of London Series a-Mathematical and Physical Sciences. 1938;167:0384–0391. doi: 10.1098/rspa.1947.0042. [DOI] [PubMed] [Google Scholar]
- 4.Dingle R, Wiegmann W, Henry CH. Physical Review Letters. 1974;33:827–830. [Google Scholar]
- 5.Petroff PM, Gossard AC, Logan RA, Wiegmann W. Applied Physics Letters. 1982;41:635–638. [Google Scholar]
- 6.Brus LE. Journal of Chemical Physics. 1984;80:4403–4409. [Google Scholar]
- 7.Rossetti R, Nakahara S, Brus LE. Journal of Chemical Physics. 1983;79:1086–1088. [Google Scholar]
- 8.Ekimov AI, Onushchenko AA. Jetp Letters. 1981;34:345–349. [Google Scholar]
- 9.Hines MA, Guyot-Sionnest P. Journal of Physical Chemistry. 1996;100:468–471. [Google Scholar]
- 10.Colvin VL, Schlamp MC, Alivisatos AP. Nature. 1994;370:354–357. [Google Scholar]
- 11.Murray CB, Norris DJ, Bawendi MG. Journal of the American Chemical Society. 1993;115:8706–8715. [Google Scholar]
- 12.Bruchez M, Moronne M, Gin P, Weiss S, Alivisatos AP. Science. 1998;281:2013–2016. doi: 10.1126/science.281.5385.2013. [DOI] [PubMed] [Google Scholar]
- 13.Chan WCW, Nie S. Science. 1998;281:2016–2018. doi: 10.1126/science.281.5385.2016. [DOI] [PubMed] [Google Scholar]
- 14.Sturzenbaum SR, Hockner M, Panneerselvam A, Levitt J, Bouillard JS, Taniguchi S, Dailey LA, Khanbeigi RA, Rosca EV, Thanou M, Suhling K, Zayats AV, Green M. Nature Nanotechnology. 2013;8:57–60. doi: 10.1038/nnano.2012.232. [DOI] [PubMed] [Google Scholar]
- 15.Nozik AJ, Beard MC, Luther JM, Law M, Ellingson RJ, Johnson JC. Chemical Reviews. 2010;110:6873–6890. doi: 10.1021/cr900289f. [DOI] [PubMed] [Google Scholar]
- 16.Grundmann M, Christen J, Ledentsov NN, Bohrer J, Bimberg D, Ruvimov SS, Werner P, Richter U, Gosele U, Heydenreich J, Ustinov VM, Egorov AY, Zhukov AE, Kopev PS, Alferov ZI. Physical Review Letters. 1995;74:4043–4046. doi: 10.1103/PhysRevLett.74.4043. [DOI] [PubMed] [Google Scholar]
- 17.Michalet X, Pinaud FF, Bentolila LA, Tsay JM, Doose S, Li JJ, Sundaresan G, Wu AM, Gambhir SS, Weiss S. Science. 2005;307:538–544. doi: 10.1126/science.1104274. [DOI] [PMC free article] [PubMed] [Google Scholar]
- 18.Alivisatos AP. Science. 1996;271:933–937. [Google Scholar]
- 19.Medintz IL, Uyeda HT, Goldman ER, Mattoussi H. Nature Materials. 2005;4:435–446. doi: 10.1038/nmat1390. [DOI] [PubMed] [Google Scholar]
- 20.Resch-Genger U, Grabolle M, Cavaliere-Jaricot S, Nitschke R, Nann T. Nature Methods. 2008;5:763–775. doi: 10.1038/nmeth.1248. [DOI] [PubMed] [Google Scholar]
- 21.Alivisatos P. Nature Biotechnology. 2004;22:47–52. doi: 10.1038/nbt927. [DOI] [PubMed] [Google Scholar]
- 22.Dabbousi BO, RodriguezViejo J, Mikulec FV, Heine JR, Mattoussi H, Ober R, Jensen KF, Bawendi MG. Journal of Physical Chemistry B. 1997;101:9463–9475. [Google Scholar]
- 23.Leatherdale CA, Woo WK, Mikulec FV, Bawendi MG. Journal of Physical Chemistry B. 2002;106:7619–7622. [Google Scholar]
- 24.Wang X, Ren X, Kahen K, Hahn MA, Rajeswaran M, Maccagnano-Zacher S, Silcox J, Cragg GE, Efros AL, Krauss TD. Nature. 2009;459:686–689. doi: 10.1038/nature08072. [DOI] [PubMed] [Google Scholar]
- 25.Efros AL, Rosen M. Physical Review Letters. 1997;78:1110–1113. [Google Scholar]
- 26.Nirmal M, Dabbousi BO, Bawendi MG, Macklin JJ, Trautman JK, Harris TD, Brus LE. Nature. 1996;383:802–804. [Google Scholar]
- 27.Zhang L, Song Y, Fujita T, Zhang Y, Chen M, Wang T-H. Advanced Materials. 2013 doi: 10.1002/adma.201304503. DOI: 10.1002/adma.201304503, n/a-n/a. [DOI] [PMC free article] [PubMed] [Google Scholar]
- 28.Lacoste TD, Michalet X, Pinaud F, Chemla DS, Alivisatos AP, Weiss S. Proceedings of the National Academy of Sciences of the United States of America. 2000;97:9461–9466. doi: 10.1073/pnas.170286097. [DOI] [PMC free article] [PubMed] [Google Scholar]
- 29.Michalet X, Pinaud F, Lacoste TD, Dahan M, Bruchez MP, Alivisatos AP, Weiss S. Single Molecules. 2001;2:261–276. [Google Scholar]
- 30.Dahan M, Levi S, Luccardini C, Rostaing P, Riveau B, Triller A. Science. 2003;302:442–445. doi: 10.1126/science.1088525. [DOI] [PubMed] [Google Scholar]
- 31.Ho YP, Kung MC, Yang S, Wang TH. Nano Letters. 2005;5:1693–1697. doi: 10.1021/nl050888v. [DOI] [PubMed] [Google Scholar]
- 32.Efros AL, Rosen M. Annual Review of Materials Science. 2000;30:475–521. [Google Scholar]
- 33.Ellingson RJ, Beard MC, Johnson JC, Yu PR, Micic OI, Nozik AJ, Shabaev A, Efros AL. Nano Letters. 2005;5:865–871. doi: 10.1021/nl0502672. [DOI] [PubMed] [Google Scholar]
- 34.Boxberg FT, J. The Handbook of Nanotechnology. Nanometer Structures: Theory, Modeling, and Simulation. 2004;Ch4:37. [Google Scholar]
- 35.Anderson NA, Lian TQ. Annual Review of Physical Chemistry. 2005;56:491–519. doi: 10.1146/annurev.physchem.55.091602.094347. [DOI] [PubMed] [Google Scholar]
- 36.Shim M, Wang CJ, Guyot-Sionnest P. Journal of Physical Chemistry B. 2001;105:2369–2373. [Google Scholar]
- 37.Wang CJ, Shim M, Guyot-Sionnest P. Science. 2001;291:2390–2392. doi: 10.1126/science.291.5512.2390. [DOI] [PubMed] [Google Scholar]
- 38.Klimov VI, Mikhailovsky AA, McBranch DW, Leatherdale CA, Bawendi MG. Physical Review B. 2000;61:13349–13352. doi: 10.1126/science.287.5455.1011. [DOI] [PubMed] [Google Scholar]
- 39.Klimov VI, Mikhailovsky AA, McBranch DW, Leatherdale CA, Bawendi MG. Science. 2000;287:1011–1013. doi: 10.1126/science.287.5455.1011. [DOI] [PubMed] [Google Scholar]
- 40.Medintz IL, Pons T, Trammell SA, Grimes AF, English DS, Blanco-Canosa JB, Dawson PE, Mattoussi H. Journal of the American Chemical Society. 2008;130:16745–16756. doi: 10.1021/ja805456x. [DOI] [PMC free article] [PubMed] [Google Scholar]
- 41.Goldman ER, Clapp AR, Anderson GP, Uyeda HT, Mauro JM, Medintz IL, Mattoussi H. Analytical Chemistry. 2003;76:684–688. doi: 10.1021/ac035083r. [DOI] [PubMed] [Google Scholar]
- 42.Jaiswal JK, Mattoussi H, Mauro JM, Simon SM. Nature Biotechnology. 2003;21:47–51. doi: 10.1038/nbt767. [DOI] [PubMed] [Google Scholar]
- 43.Hahn MA, Tabb JS, Krauss TD. Analytical Chemistry. 2005;77:4861–4869. doi: 10.1021/ac050641i. [DOI] [PubMed] [Google Scholar]
- 44.Lingerfelt BM, Mattoussi H, Goldman ER, Mauro JM, Anderson GP. Analytical Chemistry. 2003;75:4043–4049. doi: 10.1021/ac034139e. [DOI] [PubMed] [Google Scholar]
- 45.Yezhelyev MV, Al-Hajj A, Morris C, Marcus AI, Liu T, Lewis M, Cohen C, Zrazhevskiy P, Simons JW, Rogatko A, Nie S, Gao X, O'Regan RM. Advanced Materials. 2007;19:3146. [Google Scholar]
- 46.Wu XY, Liu HJ, Liu JQ, Haley KN, Treadway JA, Larson JP, Ge NF, Peale F, Bruchez MP. Nature Biotechnology. 2003;21:41–46. doi: 10.1038/nbt764. [DOI] [PubMed] [Google Scholar]
- 47.Zamir E, Lommerse PHM, Kinkhabwala A, Grecco HE, Bastiaens PIH. Nature Methods. 2010;7:295–298. doi: 10.1038/nmeth.1441. [DOI] [PubMed] [Google Scholar]
- 48.Cai WB, Shin DW, Chen K, Gheysens O, Cao QZ, Wang SX, Gambhir SS, Chen XY. Nano Letters. 2006;6:669–676. doi: 10.1021/nl052405t. [DOI] [PubMed] [Google Scholar]
- 49.Pathak S, Choi SK, Arnheim N, Thompson ME. Journal of the American Chemical Society. 2001;123:4103–4104. doi: 10.1021/ja0058334. [DOI] [PubMed] [Google Scholar]
- 50.Han M, Gao X, Su JZ, Nie S. Nat Biotech. 2001;19:631–635. doi: 10.1038/90228. [DOI] [PubMed] [Google Scholar]
- 51.Xu HX, Sha MY, Wong EY, Uphoff J, Xu YH, Treadway JA, Truong A, O'Brien E, Asquith S, Stubbins M, Spurr NK, Lai EH, Mahoney W. Nucleic Acids Research. 2003:31. doi: 10.1093/nar/gng043. [DOI] [PMC free article] [PubMed] [Google Scholar]
- 52.Song YK, Zhang Y, Wang TH. Small. 2013;9:1096–1105. doi: 10.1002/smll.201202242. [DOI] [PMC free article] [PubMed] [Google Scholar]
- 53.Eastman PS, Ruan WM, Doctolero M, Nuttall R, De Feo G, Park JS, Chu JSF, Cooke P, Gray JW, Li S, Chen FQF. Nano Letters. 2006;6:1059–1064. doi: 10.1021/nl060795t. [DOI] [PubMed] [Google Scholar]
- 54.Forster T. Annalen Der Physik. 1948;2:55–75. [Google Scholar]
- 55.Mamedova NN, Kotov NA, Rogach AL, Studer J. Nano Letters. 2001;1:281–286. [Google Scholar]
- 56.Willard DM, Carillo LL, Jung J, Van Orden A. Nano Letters. 2001;1:469–474. [Google Scholar]
- 57.Zhang C-Y, Yeh H-C, Kuroki MT, Wang T-H. Nat Mater. 2005;4:826–831. doi: 10.1038/nmat1508. [DOI] [PubMed] [Google Scholar]
- 58.Medintz IL, Clapp AR, Mattoussi H, Goldman ER, Fisher B, Mauro JM. Nature Materials. 2003;2:630–638. doi: 10.1038/nmat961. [DOI] [PubMed] [Google Scholar]
- 59.Goldman ER, Medintz IL, Whitley JL, Hayhurst A, Clapp AR, Uyeda HT, Deschamps JR, Lassman ME, Mattoussi H. Journal of the American Chemical Society. 2005;127:6744–6751. doi: 10.1021/ja043677l. [DOI] [PubMed] [Google Scholar]
- 60.Zhang CY, Johnson LW. Analytical Chemistry. 2009;81:3051–3055. doi: 10.1021/ac802737b. [DOI] [PMC free article] [PubMed] [Google Scholar]
- 61.Zhang CY, Johnson LW. Journal of the American Chemical Society. 2006;128:5324–5325. doi: 10.1021/ja060537y. [DOI] [PMC free article] [PubMed] [Google Scholar]
- 62.Bailey VJ, Easwaran H, Zhang Y, Griffiths E, Belinsky SA, Herman JG, Baylin SB, Carraway HE, Wang TH. Genome Research. 2009;19:1455–1461. doi: 10.1101/gr.088831.108. [DOI] [PMC free article] [PubMed] [Google Scholar]
- 63.Bailey VJ, Keeley BP, Razavi CR, Griffiths E, Carraway HE, Wang TH. Methods. 2010;52:237–241. doi: 10.1016/j.ymeth.2010.03.007. [DOI] [PubMed] [Google Scholar]
- 64.Bailey VJ, Keeley BP, Zhang Y, Ho YP, Easwaran H, Brock MV, Pelosky KL, Carraway HE, Baylin SB, Herman JG, Wang TH. Chembiochem. 2010;11:71–74. doi: 10.1002/cbic.200900630. [DOI] [PMC free article] [PubMed] [Google Scholar]
- 65.Ho YP, Chen HH, Leong KW, Wang TH. Journal of Controlled Release. 2006;116:83–89. doi: 10.1016/j.jconrel.2006.09.005. [DOI] [PMC free article] [PubMed] [Google Scholar]
- 66.Chen HH, Ho YP, Jiang X, Mao HQ, Wang TH, Leong KW. Molecular Therapy. 2008;16:324–332. doi: 10.1038/sj.mt.6300392. [DOI] [PMC free article] [PubMed] [Google Scholar]
- 67.Chen HH, Ho Y-P, Jiang X, Mao H-Q, Wang T-H, Leong KW. Nano Today. 2009;4:125–134. doi: 10.1016/j.nantod.2009.02.008. [DOI] [PMC free article] [PubMed] [Google Scholar]
- 68.Patolsky F, Gill R, Weizmann Y, Mokari T, Banin U, Willner I. Journal of the American Chemical Society. 2003;125:13918–13919. doi: 10.1021/ja035848c. [DOI] [PubMed] [Google Scholar]
- 69.Ho FM, Hall EAH. Biosensors & Bioelectronics. 2004;20:1001–1010. doi: 10.1016/j.bios.2004.06.017. [DOI] [PubMed] [Google Scholar]
- 70.Algar WR, Wegner D, Huston AL, Blanco-Canosa JB, Stewart MH, Armstrong A, Dawson PE, Hildebrandt N, Medintz IL. Journal of the American Chemical Society. 2012;134:1876–1891. doi: 10.1021/ja210162f. [DOI] [PubMed] [Google Scholar]
- 71.So MK, Xu CJ, Loening AM, Gambhir SS, Rao JH. Nature Biotechnology. 2006;24:339–343. doi: 10.1038/nbt1188. [DOI] [PubMed] [Google Scholar]
- 72.Akerman ME, Chan WCW, Laakkonen P, Bhatia SN, Ruoslahti E. Proceedings of the National Academy of Sciences of the United States of America. 2002;99:12617–12621. doi: 10.1073/pnas.152463399. [DOI] [PMC free article] [PubMed] [Google Scholar]
- 73.Dubertret B, Skourides P, Norris DJ, Noireaux V, Brivanlou AH, Libchaber A. Science. 2002;298:1759–1762. doi: 10.1126/science.1077194. [DOI] [PubMed] [Google Scholar]
- 74.Larson DR, Zipfel WR, Williams RM, Clark SW, Bruchez MP, Wise FW, Webb WW. Science. 2003;300:1434–1436. doi: 10.1126/science.1083780. [DOI] [PubMed] [Google Scholar]
- 75.Voura EB, Jaiswal JK, Mattoussi H, Simon SM. Nature Medicine. 2004;10:993–998. doi: 10.1038/nm1096. [DOI] [PubMed] [Google Scholar]
- 76.Xia Z, Xing Y, So M-K, Koh AL, Sinclair R, Rao J. Analytical Chemistry. 2008;80:8649–8655. doi: 10.1021/ac801562f. [DOI] [PMC free article] [PubMed] [Google Scholar]
- 77.Yao HQ, Zhang Y, Xiao F, Xia ZY, Rao JH. Angewandte Chemie-International Edition. 2007;46:4346–4349. doi: 10.1002/anie.200700280. [DOI] [PubMed] [Google Scholar]
- 78.Cissell KA, Campbell S, Deo SK. Analytical and Bioanalytical Chemistry. 2008;391:2577–2581. doi: 10.1007/s00216-008-2215-5. [DOI] [PubMed] [Google Scholar]
- 79.Quinones GA, Miller SC, Bhattacharyya S, Sobek D, Stephan JP. Journal of Cellular Biochemistry. 2012;113:2397–2405. doi: 10.1002/jcb.24111. [DOI] [PubMed] [Google Scholar]
- 80.Huang X, Li L, Qian H, Dong C, Ren J. Angewandte Chemie. 2006;118:5264–5267. doi: 10.1002/anie.200601196. [DOI] [PubMed] [Google Scholar]
- 81.Freeman R, Liu XQ, Willner I. Journal of the American Chemical Society. 2011;133:11597–11604. doi: 10.1021/ja202639m. [DOI] [PubMed] [Google Scholar]
- 82.Zhao SL, Huang Y, Shi M, Liu RJ, Liu YM. Analytical Chemistry. 2010;82:2036–2041. doi: 10.1021/ac9027643. [DOI] [PMC free article] [PubMed] [Google Scholar]
- 83.Freeman R, Girsh J, Jou AFJ, Ho JAA, Hug T, Dernedde J, Willner I. Analytical Chemistry. 2012;84:6192–6198. doi: 10.1021/ac3011473. [DOI] [PubMed] [Google Scholar]
- 84.Bagalkot V, Zhang L, Levy-Nissenbaum E, Jon S, Kantoff PW, Langer R, Farokhzad OC. Nano Letters. 2007;7:3065–3070. doi: 10.1021/nl071546n. [DOI] [PubMed] [Google Scholar]
- 85.Yun CS, Javier A, Jennings T, Fisher M, Hira S, Peterson S, Hopkins B, Reich NO, Strouse GF. Journal of the American Chemical Society. 2005;127:3115–3119. doi: 10.1021/ja043940i. [DOI] [PubMed] [Google Scholar]
- 86.Carminati R, Greffet JJ, Henkel C, Vigoureux JM. Optics Communications. 2006;261:368–375. [Google Scholar]
- 87.Liu J, Lee JH, Lu Y. Analytical Chemistry. 2007;79:4120–4125. doi: 10.1021/ac070055k. [DOI] [PubMed] [Google Scholar]
- 88.Dong HF, Gao WC, Yan F, Ji HX, Ju HX. Analytical Chemistry. 2010;82:5511–5517. doi: 10.1021/ac100852z. [DOI] [PubMed] [Google Scholar]
- 89.Tang B, Cao LH, Xu KH, Zhuo LH, Ge JH, Li QF, Yu LJ. Chemistry-a European Journal. 2008;14:3637–3644. doi: 10.1002/chem.200701871. [DOI] [PubMed] [Google Scholar]
- 90.Medintz IL, Farrell D, Susumu K, Trammell SA, Deschamps JR, Brunel FM, Dawson PE, Mattoussi H. Analytical Chemistry. 2009;81:4831–4839. doi: 10.1021/ac900412j. [DOI] [PubMed] [Google Scholar]
- 91.Sandros MG, Gao D, Benson DE. Journal of the American Chemical Society. 2005;127:12198–12199. doi: 10.1021/ja054166h. [DOI] [PubMed] [Google Scholar]
- 92.Aryal BP, Benson DE. Journal of the American Chemical Society. 2006;128:15986–15987. doi: 10.1021/ja066658f. [DOI] [PubMed] [Google Scholar]
- 93.Zhao D, Chan WH, He Z, Qiu T. Analytical Chemistry. 2009;81:3537–3543. doi: 10.1021/ac9000892. [DOI] [PubMed] [Google Scholar]
- 94.Bae Y, Myung N, Bard AJ. Nano Letters. 2004;4:1153–1161. [Google Scholar]
- 95.Ding ZF, Quinn BM, Haram SK, Pell LE, Korgel BA, Bard AJ. Science. 2002;296:1293–1297. doi: 10.1126/science.1069336. [DOI] [PubMed] [Google Scholar]
- 96.Liu X, Jiang H, Lei J, Ju H. Analytical Chemistry. 2007;79:8055–8060. doi: 10.1021/ac070927i. [DOI] [PubMed] [Google Scholar]
- 97.McCall J, Alexander C, Richter MM. Analytical Chemistry. 1999;71:2523–2527. doi: 10.1021/ac981322c. [DOI] [PubMed] [Google Scholar]
- 98.Jiang H, Ju H. Chemical Communications. 2007:404–406. doi: 10.1039/b616007g. [DOI] [PubMed] [Google Scholar]
- 99.Jie G, Zhang J, Wang D, Cheng C, Chen H-Y, Zhu J-J. Analytical Chemistry. 2008;80:4033–4039. doi: 10.1021/ac800052g. [DOI] [PubMed] [Google Scholar]
- 100.Jie G, Huang H, Sun X, Zhu J-J. Biosensors & Bioelectronics. 2008;23:1896–1899. doi: 10.1016/j.bios.2008.02.028. [DOI] [PubMed] [Google Scholar]
- 101.Hellman LM, Fried MG. Nature Protocols. 2007;2:1849–1861. doi: 10.1038/nprot.2007.249. [DOI] [PMC free article] [PubMed] [Google Scholar]
- 102.Zhang Y, Liu KJ, Wang T-L, Shih I-M, Wang T-H. ACS Nano. 2011;6:858–864. doi: 10.1021/nn204377k. [DOI] [PMC free article] [PubMed] [Google Scholar]
- 103.Kim JH, Chaudhary S, Ozkan M. Nanotechnology. 2007:18. [Google Scholar]
- 104.Liu P, Na N, Huang L, He D, Huang C, Ouyang J. Chemistry-a European Journal. 2012;18:1438–1443. doi: 10.1002/chem.201102187. [DOI] [PubMed] [Google Scholar]
- 105.Pardo-Yissar V, Katz E, Wasserman J, Willner I. Journal of the American Chemical Society. 2002;125:622–623. doi: 10.1021/ja028922k. [DOI] [PubMed] [Google Scholar]
- 106.Medintz IL, Stewart MH, Trammell SA, Susumu K, Delehanty JB, Mei BC, Melinger JS, Blanco-Canosa JB, Dawson PE, Mattoussi H. Nature Materials. 2010;9:676–684. doi: 10.1038/nmat2811. [DOI] [PubMed] [Google Scholar]
- 107.Wang G-L, Xu J-J, Chen H-Y, Fu S-Z. Biosensors & Bioelectronics. 2009;25:791–796. doi: 10.1016/j.bios.2009.08.027. [DOI] [PubMed] [Google Scholar]
- 108.Zheng M, Cui Y, Li X, Liu S, Tang Z. Journal of Electroanalytical Chemistry. 2011;656:167–173. [Google Scholar]
- 109.Willner I, Patolsky F, Wasserman J. Angewandte Chemie-International Edition. 2001;40:1861–1864. [PubMed] [Google Scholar]
- 110.Gratzel M. Inorganic Chemistry. 2005;44:6841–6851. doi: 10.1021/ic0508371. [DOI] [PubMed] [Google Scholar]
- 111.Kamat PV. Journal of Physical Chemistry C. 2008;112:18737–18753. [Google Scholar]
- 112.Coe S, Woo WK, Bawendi M, Bulovic V. Nature. 2002;420:800–803. doi: 10.1038/nature01217. [DOI] [PubMed] [Google Scholar]
- 113.Kim T-H, Cho K-S, Lee EK, Lee SJ, Chae J, Kim JW, Kim DH, Kwon J-Y, Amaratunga G, Lee SY, Choi BL, Kuk Y, Kim JM, Kim K. Nature Photonics. 2011;5:176–182. [Google Scholar]
- 114.Murray CB, Kagan CR, Bawendi MG. Annual Review of Materials Science. 2000;30:545–610. [Google Scholar]
- 115.Trindade T, O'Brien P, Pickett NL. Chemistry of Materials. 2001;13:3843–3858. [Google Scholar]
- 116.Yin Y, Alivisatos AP. Nature. 2005;437:664–670. doi: 10.1038/nature04165. [DOI] [PubMed] [Google Scholar]
- 117.Ye L, Yong KT, Liu LW, Roy I, Hu R, Zhu J, Cai HX, Law WC, Liu JW, Wang K, Liu J, Liu YQ, Hu YZ, Zhang XH, Swihart MT, Prasad PN. Nature Nanotechnology. 2012;7:453–458. doi: 10.1038/nnano.2012.74. [DOI] [PubMed] [Google Scholar]


