

Abstract
Natural killer (NK) cells are innate immune cells known for their cytolytic activities towards tumors and infections. They are capable of expressing diverse killer immunoglobulin receptors (KIRs), and KIRs are implicated in susceptibility to Crohn’s disease (CD), a chronic intestinal inflammatory disease. However, the cellular mechanism of this genetic contribution is unknown. Here we show that the ‘licensing’ of NK cells, determined by the presence of KIR2DL3 and homozygous HLA-C1 in host genome, results in their cytokine reprogramming, which permits them to promote CD4+ T cell activation and TH17 differentiation ex vivo. Microfluidic analysis of thousands of NK single cells and bulk secretions established that licensed NK cells are more polarized to pro-inflammatory cytokine production than unlicensed NK cells, including production of IFN-γ, TNF-α, CCL-5, and macrophage inflammatory protein (MIP)-1β. Cytokines produced by licensed NK augmented CD4+ T cell proliferation and IL-17A/IL-22 production. Antibody blocking indicated a primary role for IFN-γ, TNF-α, and IL-6 in the augmented T cell proliferative response. In conclusion, NK licensing mediated by KIR2DL2/3 and HLA-C1 elicits a novel NK cytokine program that activates and induces pro-inflammatory CD4+ T cells, thereby providing a potential biologic mechanism for KIR-associated susceptibility to CD and other chronic inflammatory diseases.
INTRODUCTION
NK cells are components of the innate immune system primarily known for cytolytic targeting of tumor cells and virally infected cells. Despite their apparent role in the development of many chronic inflammatory diseases,(1–6) their functional role in pathogenesis is poorly understood. Recent human genome-wide association analysis has uncovered gene expression networks of NK cells implicated in inflammatory bowel disease pathogenesis.(7) However, due to the complex roles and functional proficiencies of NK cell subpopulations, the biologic mechanisms of their involvement in chronic inflammatory diseases, and the ones pertinent to inflammatory bowel disease, remain uncertain.(1–4, 8, 9)
KIR genes are predominantly expressed by NK cells, and are one element of the receptor repertoire controlling NK cell activation, proliferation, and effector functions that mediate surveillance and host defense for microbial infection and malignancy.(10, 11) The genetic combination of killer immunoglobulin-like receptors (KIR) with their respective HLA class I ligands is associated with multiple autoimmune disorders, infectious diseases, and cancers.(5, 6) However, the functional mechanisms accounting for these disease associations, particularly for the inhibitory class of KIRs, are poorly understood. The KIR gene family is comprised of 14 functional genes (seven activating, six inhibitory, one bi-functional) and 2 pseudogenes.(12) The KIR locus exhibits haplotypes with extensive variations in number and types of KIR genes. Among the inhibitory KIRs, KIR2DL1 recognizes HLA-C2 allotypes, KIR2DL2 and KIR2DL3 recognize HLA-C1 allotypes, KIR3DL1 recognizes HLA-Bw4.(5, 12) Accordingly, functional pairings of cognate HLA and KIR genes in an individual haplotype is quite heterogeneous, which confounds studies of their biologic function.
This study was prompted by the elevated genetic susceptibility for Crohn’s disease (CD) in patients bearing the inhibitory KIR2DL2/3 with its cognate ligand HLA-C1.(13–15) This association was puzzling, since NK-target interaction via inhibitory KIR ligation suppresses NK effector function.(2, 16) One potential explanation is the licensing effects of inhibitory KIRs during NK differentiation. Licensing is a maturational process, induced by signaling of select inhibitory KIR genes with their cognate HLA ligands during NK differentiation that confers expanded functional competence of NK cells. Since the presence of relevant pairs of inhibitory KIR and cognate HLA genes are stochastic, healthy individuals genetically vary in the presence or abundance of licensed NK cells. Also, while the known NK cell functions affected by licensing include augmented target cell killing and IFN-γ production(16, 17), there has been little study of NK licensing on other aspects of NK cell function: regulation of inflammation and adaptive immunity, or the scope of licensing-related cytokine and chemokine production.(18)
Mechanistic studies of human NK cell licensing are challenging due to the complex genetic composition of KIR-HLA combinations,(12) and the conflicting roles inhibitory and activating KIRs play in licensing. Therefore, we focused on individuals homozygous for the KIR A haplotype (termed AA haplotype), a common genotype (~30% worldwide) which contains inhibitory KIRs for three key HLA class I ligands (HLA-C1, HLA-C2 and HLA-Bw4) but only one single activating KIR.(12, 19) Different inhibitory KIR-HLA class I ligand pairs confer various levels of strength for NK licensing (Table S1).(20) The most potent pair is KIR2DL3/HLA-C1; the second strongest pair is KIR3DL1/HLA-Bw4; while KIR2DL1/HLA-C2 has minimal licensing effect. Since AA haplotype individuals have KIR2DL3 and KIR2DL1, we consider individuals with homozygous HLA-C1 (abbreviated as HLA-C1C1) strongly licensed individuals, and individuals with HLA-C1/HLA-C2 or homozygous HLA-C2 (abbreviated as HLA-C2+) weakly licensed or unlicensed individuals.
Therefore, we aimed to investigate the potential of NK licensing in the KIR associated Crohn’s disease susceptibility. Here we show that NK cells from genetically licensed healthy subjects and CD patients efficiently augment antigenic CD4+ T cell proliferation, and this augmentation is mediated by soluble molecules secreted by licensed NK cells. Licensed NK cell supernatant also dramatically promotes TH17 cells, a signature CD4+ T helper subset in CD. Multiplexed cytokine study of CD cohort demonstrated that genetically licensed and unlicensed NK cells exhibit consistent and distinct cytokine profiles, with licensed NK cells distinguished by high-output, pro-inflammatory, poly-cytokine expression. Selected cytokines among this output account for the capacity of licensed NK cells to efficiently augment antigenic CD4+ T cell proliferation and TH17 polarization.
MATERIALS AND METHODS
Clinical samples
Clinical samples were collected according to protocols approved by the institutional review committee of Cedars Sinai Medical Center (CSMC) and of UCLA. CD patient, previously genotyped for HLA and KIR(13), were randomly chosen, consented and called back by CSMC. 455 out of 1306 CD patients are AA haplotype, 28 were consented for callback blood donation, and all 20 subjects who returned for for collection were included for study. Healthy donors were recruited at UCLA Clinical and Translational Research Laboratory, and genotyped by the UCLA Immunogenetics Center.
Cell isolation
PBMCs were isolated by Ficoll-Paque (GE Healthcare, Chalfont St Giles, England) density gradient centrifugation. Human NK cells were purified either from whole blood using the RosetteSep Human NK cell enrichment Cocktail, or from PBMC using Human NK cell negative selection kit (StemCell Technologies, Vancouver, BC, Canada). Human Treg-depleted T cells were purified from PBMC using a human T cell enrichment kit and CD25 positive selection kit; CD4+ T cells were purified from PBMC using a human T cell enrichment kit and CD4 positive selection kit (StemCell Technologies, Vancouver, BC, Canada). The purity of isolated NK cells and T cells were confirmed to be above 90%.
NK-T cell co-culture and blocking assays
Before co-culture, round bottom 96-well plates were coated with anti-CD3/CD28 antibody (R&D Systems, Minneapolis, MN) in PBS at 1.5 ug mL−1 at room temperature for 2 hours, or at 0.5 ug mL−1 at 4°C overnight. T cells were stained with 0.2 uM CFSE (Invitrogen, Carlsbad, CA), and co-cultured with NK cells for 3 days in 96-well plates at 1 × 10⁶ cells mL−1 in presence of 2 ng mL−1 (26 I.U) IL-2 with complete RPMI 1640 medium, containing 10% fetal bovine serum (FBS), 100 I.U mL−1 penicillin 100 ug mL−1 streptomycin, 10mM HEPES buffer, 2 mM glutamine (Cellgro, Manassas, VA), and 5 × 10⁻⁵ M 2-mercaptoethanol (Sigma, St. Louis, MO). Blocking antibodies for OX40 ligand and 2B4 (CD 252 and CD244, R&D Systems, Minneapolis, MN) were added to the co-culture at concentration of 10 ug mL−1. Neutralizing antibodies, for IL-6, IFN-γ, TNF-α, and isotype control mouse IgG1κ (eBioscience, San Diego, CA), and their combinations were added to the co-culture at 1.25 ug mL−1. The recombinant cytokines IL-6, IFN-γ, and TNF-α (R&D Systems, Minneapolis, MN) was each added to a final concentration of 20 ng mL−1, comparable to the concentration measured for these cytokines in NK cell three-day culture media analyzed by multiplex ELISA chip. For transwell assay, 24-well plates were used; NK cells were placed on the filter side of a 1.0 um pore-sized transwell (BD Falcon, San Jose, CA), and CFSE-stained T cells were placed on the plate side of the transwell.
TH17 differentiation assay
Before culturing, round bottom 96-well plates were coated with 1 ug mL−1 anti-CD3 (R&D Systems, Minneapolis, MN) in PBS for 2 hours at room temperature, and washed with 5% human AB Serum RPMI media (Lonza, Rockland, ME). Total CD4+ T cells were purified and stimulated with 0.2 ug mL−1 soluble anti-CD28, primed with different percentages of NK supernatants, and in the presence or absence of various cytokine combinations. At Day 6 or 7, CD4+ T cells were resuspended, washed once with media, and expanded with 2 ng mL−1 (26 I.U) IL-2 plus the same conditions provided for priming. At Day 14, the cells were stimulated with PMA/Ionomycin and Brefeldin A for 5 hours. Cells were then surface stained with anti-CD3, intracellularly stained with anti-IFN-γ, anti-IL-22, and anti-IL-17A, followed by flow using LSRII (BD Biosciences, San Jose, CA).
Multiplex cytokine ELISA assay
CD NK cells were isolated using Human NK cell negative selection kit (StemCell Technologies, Vancouver, BC, Canada). NK cells were cultured for 3 days in round-bottom 96-well plate at 1 × 10⁶ cells mL−1 in 2 ng mL−1 (26 I.U) IL-2 with complete RPMI 1640 medium. Then media samples were collected, stored at −80°C. Before analysis, samples were thawed, concentrated 4 times, and assayed as one batch. The initial protein panel was chosen to incorporate immune function markers, consisting primarily of cytokines and chemokines that could be secreted by NK cells. The final NK secretion antibody panel was chosen to incorporate non-redundant secretions detectable at NK three-day culture.
Single cell multiplex cytokine analysis
Frozen aliquots of PBMC were thawed and recovered overnight. Bulk NK cells were purified using human NK cell enrichment kit; CD3−CD56dimKIR2DL3+ KIR3DL1−KIR2DL1− and CD3−CD56dimKIR2DL3− NK subsets sorted by FACS. All cells were prepared on ice, and immediately analyzed by a single cell microchip. Briefly, the microchip proteomics platform is based upon isolating individual or a small number of cells into several thousand ~600 pL volume microchambers, with each chamber equipped with a miniaturized antibody array. These chips permitted the simultaneous measurement of 19 protein markers in each microchamber. After loading onto the SCBC, the cells were stimulated with 5 ng mL−1 PMA and 500 ng mL−1 ionomycin for 12 hours at 37°C, and the microchip was imaged to count cell numbers within each microchambers. After cells were washed off, the fluorescence readouts were generated by an ELISA immunoassay and were quantified using a GenePix 4400A array scanner and custom-built software algorithms.
Antibodies
The following antibodies and cell tracer were used staining for flow analysis: FITC-conjugated anti-CD158b (BD Biosciences, San Jose, CA), anti-IFN-γ (eBioscience, San Diego, CA); CFSE; PE-conjugated anti-IFN-γ (BD Biosciences, San Jose, CA), anti-TNF-α, anti-IL-22, anti-Granzyme B (eBioscience, San Diego, CA), anti-GM-CSF (R&D Systems, Minneapolis, MN); PerCP-conjugated anti-CD3 (BD Biosciences, San Jose, CA); APC-conjugated anti-CD158a (Miltenyi Biotec, Bergisch Gladbach, Germany), anti-CD4 (BD Biosciences, San Jose, CA), anti-IL-17A (eiBoscience, San Diego, CA); strepavidin-PerCP; PE-Cy7-conjugated anti-CD56, anti-CD14 (BD Biosciences, San Jose, CA), Vioblue-conjugated anti-3DL1 (Miltenyi Biotec, Bergisch Gladbach, Germany), eFluor 650NC-conjugated anti-CD3 (ebBioscience, San Diego, CA). anti-mouse IgG κ/Negative Control Compensation Particles. The use of antibody for staining was performed per manufacturer’s instructions with proper titrations. Antibodies used for cytokine assays are IL-2, IL-6, IL-10, IL-15, IL-13, CCL-4 (MIP-1β), CCL-5, CXCL-10, CCL-2, CXCL-8, IFN-γ, TNF-α, TNF-β, granzyme B, TGF-β1 (R&D Systems, Minneapolis, MN), IL-4, IL-12, GM-CSF, and perforin (eBioscience, San Diego, CA).
Flow cytometry and cell sorting
Phenotypic analysis of PBMC was performed using flow cytometry after staining of cells with fluorescence dye–conjugated antibodies. Labeled cells were analyzed with a FACSCalibur flow cytometer using CellQuest software, or LSR II (BD Biosciences, San Jose, CA) using FACSDiva software (BD Biosciences, San Jose, CA) at UCLA Flow Cytometry Core, and data analysis was performed using FlowJo (Tree Star Inc., Ashland, OR). Cells were sorted for CD3−CD56dim KIR2DL3+ KIR3DL1− KIR2DL1− and CD3− CD56dim KIR2DL3−, using Aria I equipped with FACSDiva software (BD Biosciences, San Jose, CA).
Statistical analysis and data access
Most data analyses involved comparison of continuous variables, so the Student’s two-tailed unpaired t test was used; P values of less than 0.05 were regarded as significant. All cytokine data were normalized before biostatistical analysis. GraphPad Prism (San Diego, CA) was used for statistical analysis and graphing. To uncover and visualize patient groups based on these parameters, we used Principal Component Analysis (PCA) and Hierarchical Clustering (HC), box-plot and scatter-plot analysis were performed in R package using custom-written codes. Microchip data from this study is available from our lab website (http://www.its.caltech.edu/~heathgrp/).
RESULTS
Licensed NK cells from HLA-C1C1 CD patients strongly promote the proliferation of autologous CD4+ T cells
Pro-inflammatory CD4+ helper T cells are the main effectors in induction and perpetuation of intestinal inflammation.(21, 22) As a major cellular component of innate immunity, NK cells demonstrably cross-talk with the adaptive immunity arm.(3, 19, 23–25) Since NK cells can stimulate or inhibit T cell activation via multiple mechanisms,(26–29) we first asked if strongly and weakly licensed NK cells from CD patients differentially modulated T cell proliferation in vitro. We isolated blood NK cells and autologous T cells from CD patients (Table 1), and co-cultured them in the presence of immobilized anti-CD3/CD28 and IL-2 at 2 ng·mL−1 (26 IU). At day 3, CD4+ T cell proliferation was measured via CFSE dilution (Figure 1A). CD4+ T cell proliferation was augmented linearly with the number of licensed NK cells present (Figure 1B, R2=0.996). Using linearity (R2>0.85) as a quality control criterion, 12 patient assays were selected for genetic correlation analysis. At a NK:T ratio of 1:1, NK cells from HLA-C1C1 patients were significantly more potent than those from HLA-C2+ patients, and NK cells from HLA-Bw4/Bw4 patients were significantly more potent than those from HLA-Bw6+ individuals within the HLA-C2+ subset. Thus, three distinct levels of NK function were observed: HLA-C1C1 Bw6+ > HLA-Bw4/Bw4 > Bw6/+ HLA-C2+ (Figure 1C), and this order conformed to KIR licensing strength (Table S1).(20)
Table 1.
Crohn’s Disease Patient Demographics
| UCLA_ID | HLA-Bw | HLA-C | Age | Gender | Race | Age of Diagnosis | Current Medication |
|---|---|---|---|---|---|---|---|
| CDKIR0804 | Bw6 | C1 | 63 | F | Caucasian | 19 | None |
| CDKIR0805-88 | Bw4, Bw6 | C1 | 55 | F | Caucasian | 18 | Methotrexate, Darifenacin, Ciprofloxacin |
| CDKIR0816 | Bw4, Bw6 | C1 | 50 | F | Caucasian | 26 | Acetaminophen |
| CDKIR0822 | Bw4, Bw6 | C1 | 60 | F | Caucasian | 28 | Adalimumab, Clonazepam Mesalamine, Pravastatin, Zolpidem, Alprazolam |
| CDKIR0831 | Bw6 | C1 | 60 | F | Caucasian | 49 | Glatiramer acetate, Atorvastatin, Bupropion, Escitalopram, Nitrofurantoin |
| CDKIR0919 | Bw6 | C1 | 49 | F | Caucasian | 12 | Mesalamine, Rifaximin, Hydrochlorothiazide, Alprazolam, Acetaminophen and hydrocodone |
| CDKIR0921 | Bw4 | C1 | 50 | F | Caucasian | 21 | Methadone, Fentanyl citrate, Nexium |
| CDKIR1130 | Bw6 | C1 | 40 | F | Caucasian | 25 | Escitalopram, lorazepam |
| CDKIR1207 | Bw4 | C1 | 44 | M | Caucasian | 30 | 6-Mercaptopurine, Methotrexate, Mesalamine |
| CDKIR012512-49 | Bw4, Bw6 | C1 | 55 | F | Caucasian | 33 | 6-Mercaptopurine, infliximab, citalopram |
| CDKIR0805-01 | Bw6 | C1, C2 | 48 | F | Caucasian | 26 | Colesevelam, diphenoxylate and atropine, Doxorubicin, Cyclophosphamide, Aprepitant, Ondansetron, Prochlorperazine |
| CDKIR0811 | Bw4, Bw6 | C1, C2 | 62 | M | Caucasian | 25 | Infliximab |
| CDKIR0902 | Bw4 | C1, C2 | 41 | F | Caucasian | 33 | Loestrin 4Fe, Infliximab, Propranolol, Zolpidem |
| CDKIR0914 | Bw4 | C1, C2 | 63 | F | Caucasian | 31 | Adalimumab, diphenoxylate and atropine, Colestipol, Simvastatin, Levothyroxine, Montelukast, Belladonna alkaloids and phenobarbital, Acetaminophen and hydrocodone, Escitalopram, Ibandronate, Fioricet |
| CDKIR021712 | Bw4, Bw6 | C1, C2 | 40 | M | Caucasian | 22 | Mesalamine, Infliximab |
| CDKIR022412 | Bw6 | C1, C2 | 47 | M | Caucasian | 7 | Lisinopril, Fluoxetine, Bupropion, Prednisone |
| CDKIR0805-04 | Bw4, Bw6 | C2 | 31 | M | Caucasian | 22 | 6-Mercaptopurine |
| CDKIR0809 | Bw4, Bw6 | C2 | 46 | M | Caucasian | 30 | Adalimumab, Lisdexamfetamine, Duloxetine, Cyanocobalamin (b12) |
| CDKIR1014 | Bw4 | C2 | 42 | M | Caucasian | 17 | 6-Mercaptopurine, Dicyclomine, Zolpidem, Alprazolam, Amlodipine besylate, Metoprolol, Prednisone, Dexlansoprazole, Ondansetron, Adalimumab |
| CDKIR012512-50 | Bw4, Bw6 | C2 | 43 | M | Caucasian | 33 | Acetaminophen, Cyclosporine, Adalimumab, Losartan Potassium, Cefuroxime |
Figure 1. NK cells from genetically licensed CD patients strongly augment autologous CD4+ T cell proliferation.

NK cells and autologous T cells were isolated from AA haplotype CD patient peripheral blood, stimulated with anti-CD3 and anti-CD28, and co-cultured in 2 ng mL−1 (26 I.U) IL-2 for three days. (A) Histograms of CD4+ T cell CFSE dilution after co-culturing with NK cells at the NK/T ratios as indicated, for a representative C1C1 CD patient (gated on CD4+CFSE+ cells). The number within each graph indicates the percentage of cells proliferated. (B) Correlation between NK/T ratio and change in CD4+ T cell division number in log scale, calculated as mean CFSE intensity at co-culture/mean CFSE intensity of T cell alone. (C) Comparison of change in CD4+ T cells division number at NK/T = 1:1, among C1C1Bw6/+, Bw4/Bw4, and C2+Bw6/+ AA haplotype patients. (n = 4, student t test, two-tailed. ** p < 0.005; *** p < 0.0005). (D) Histograms of CD4+ T cell CFSE dilution in the absence of (left two) or in the presence (right two) of the indicated blocking antibodies at 10 ug mL−1 (gated on CD4+CFSE+ cells). (E) Histograms of CD4+ T cell CFSE dilution at the indicated NK/T ratio without physical separation of NK cells and T cells (left two) or with separation by 1.0 um pore size transwells (right one) (gated on CD4+CFSE+ cells). The numbers in each histogram indicates the percentage of proliferating cells.
To investigate the nature of interaction between NK and CD4+ T cells, we neutralized the surface co-stimulatory molecules 2B4 and OX40 ligand, expressed by NK cells to promote CD4+ T cell activation.(27–29) Surprisingly, augmentation was fully preserved when these surface molecules were blocked (Figure 1D). To assess if this interaction was contact-dependent at all, NK cells were separated from T cells using 1 μm pore transwells, only allowing soluble mediators to communicate between the sides. Separating NK and CD4+ T cells did not affect CD4+ proliferation at all (Figure 1E), suggesting that NK augmentation of CD4+ T cell proliferation was mainly mediated by soluble molecules secreted by licensed NK cells.
NK cells from HLA-C1C1 CD patients exhibit elevated pro-inflammatory cytokine production and polyfunctionality
Multiple cytokines and chemokines are produced by NK cells,(18) but little is known about the scope of cytokine reprogramming by KIR-mediated NK licensing. Therefore, we cultured NK cells for 3 days under the same condition used for NK-T cell co-culture experiments, and quantitated the level of a panel of cytokines in the NK supernatant using a multiplex ELISA chip, which can simultaneously analyze up to 19 cytokines.(30, 31) When supernatants of NK cells from HLA-C1C1 (strongly licensed) and HLA-C2+ (weakly licensed) CD patients were compared, NK cells from HLA-C1C1 patients were significantly more robust producers of 9 cytokines (Figure 2A). This was specific to NK cells, as cytokine production by T cells was indistinguishable between HLA-C1C1 and HLA-C2+ patients (data not shown). The core differences resided in CCL-5 and MIP-1β chemokines important for neutrophil and T cell recruitment); and, IFN-γ, TNF-α, IL-6, and IL-4 (pro-inflammatory cytokines known to play a role in CD) (Figure 2A). In contrast, both types of NK cells produced negligible IL-12, IL-15, or IL-10 (Fig. 2A), as their levels were at or below the background detection threshold. Hierarchical clustering (Figure 2B) showed that HLA-C1C1 and HLA-C2+ patients were completely separated, demonstrating their distinct secretion capacities. To assess native NK cell activation state (CD69 expression), we compared 6 subjects (3 HLA-C1C1 and 3 HLA-C2+). At the time of isolation, the frequency of CD69+ cells was significantly elevated in HLA-C1C1 NK cells compared to HLA-C2+ NK cells (data not shown, p=0.018); CD69 expression was in most cultures stable after 24 hours in low dose IL-2. This observation suggested a potential positive correlation between CD69 expression and licensing-induced NK cell cytokine capacity.
Figure 2. NK cells from HLA-C1C1 patients have distinct cytokine secretion patterns compared to those from HLA-C2+ patients in bulk culture.

(A) Univariate comparison of cytokine production level of bulk culture NK cells from HLA-C1C1 CD patients with (licensing, solid dot) and HLA-C2+ patients (unlicensed, open square) genotypes. The vertical axis shows the fluorescence intensity. (n = 4 to 5, P values are calculated using two tailed student t test, adjusted for multiple comparison by FDR, * p < 0.05; ** p < 0.005; *** p < 0.0005). The dash-line indicates the detection threshold. Secretion profiles were measured by multiplex ELISA. (B) Hierarchical clustering of the bulk cytokine production profile of NK cells from HLA-C1C1 (red) and HLA-C2+ (blue) CD patients. Each row represents one protein indicated on the right, and each column represents one patient. (n= 4 to 5).
NK cells from HLA-C1C1 healthy subjects have comparable CD4+ T cell proliferation-augmenting capability
To investigate if NK cells from AA haplotype licensed healthy donors have similar levels of functionality as licensed CD patients, we assessed their effects in CD4+ T cell co-culture. Using the same co-culture assays described earlier, we observed that CD4+ T cell proliferation increased linearly with the number of licensed NK cells present in the co-culture (Figure 3A and B, R2=0.949). At an NK:T ratio of 1:1, the effect on CD4+ T cells by NK cells from the 2 HLA-C1C1 healthy subjects was comparable that that of NK cells from HLA-C1C1 patients (Figure 3C and Figure 1C).
Figure 3. NK cells from HLA-C1C1 healthy subjects have comparable CD4+ T cell – augmenting capacity as HLA-C1C1 CD patients.

(A) Histograms of CD4+ T cell CFSE dilution after co-culturing with NK cells at the NK/T ratios as indicated, for a representative HLA-C1C1 healthy subject (gated on CD4+CFSE+ cells). The number within each graph indicates the percentage of cells proliferated. (B) Correlation between NK/T ratio and change in CD4+ T cell division number in log scale, calculated as mean CFSE intensity at co-culture/mean CFSE intensity of T cell alone. (C) Change in CD4+ T cells division number at NK/T = 1:1 from two HLA-C1C1 healthy subjects.
NK cells from HLA-C1C1 patients contain a subset dominating the response
We speculated whether this secretion difference reflected a homogeneous functional change in the NK cell population, or instead a mosaic of cellular heterogeneity. Therefore, we assessed cytokine secretion profiles of individual NK cells at the single cell level using single cell barcode chips (SCBCs),(30) a high-throughput microfluidics platform. With SCBCs, single cells or a small number of cells are separated into thousands of microchambers on a chip, where the production of 19 cytokines is simultaneously and independently measured during a 12-hour period. This technology has been extensively validated, and its utility in studying immune cell response has been demonstrated, as well as compared to standard flow assays. (30)
We compared single NK cell cytokine secretion between 2 HLA-C1C1 and 2 HLA-C2+ CD patients, NK cells from HLA-C1C1 patients exhibited a higher output of multiple cytokines, including TNF-α, MIP-1β, GM-CSF, IFN-γ, IL-2, IL-6, and CXCL-10 (Figure 4A, B and Supplementary Figure 1). PCA analysis of the single cell data showed that NK cells with from HLA-C1C1 patients contained a subset that produced effector proteins (CCL-5, TNF-α, IFN-γ, MIP-1β, and IL-6), which in contrast was barely detected in NK cells from HLA-C2+ patients (Figure 4C). When the composition of cells producing 1, 2, 3, 4, 5, and >5 cytokines was characterized, we observed a more polyfunctional phenotype of NK cells from HLA-C1C1 patients (Figure 4D). This analysis established that NK cells from HLA-C1C1 patients exhibited a higher output of multiple cytokines and greater cytokine polyfunctionality at the single cell level, distinguished by a subset producing effector proteins (CCL-5, TNF-α, IFN-γ, MIP-1β, and IL-6). These findings together demonstrated that NK cells from CD patient with licensing genotypes were reprogrammed in a mosaic fashion for enhanced production of cytokines contributing to a chronic inflammatory state in vivo.
Figure 4. NK cells from HLA-C1C1 patients contain a subset of NK cells polarized for pro-inflammatory cytokines production.

(A) Univariate comparison of TNF-α production of NK cells from licensed (#0919, #1130, red) and unlicensed (#0125, #0811, blue) CD patients. The numbers in each graph indicate the percentage of microchambers that are positive for TNF-α signals. (B) Heatmap of cytokine secretion capacity for all the cytokines and all the CD patients analyzed. Each row represents one cytokine, and each column represents the percentage of microchambers that are positive for the cytokine. The color scale shows the difference in standard deviation. (C) PCA single NK cell measurements from the four CD patients. Percentage of variation explained by each component is shown in parentheses for each axis. The composition for each component is indicated on the left of the plots. (D) Bar graph of NK cell polyfunctionality. Different colors denote the percentages of single NK cells producing 1, 2, 3, 4, 5, or > 5 cytokines.
NK cells expressing KIR2DL3 are predominately responsible for the elevated cytokine production and polyfunctionality in HLA-C1C1 individuals
A simple mechanistic explanation for the mosaic pattern of NK cytokine expression is the underlying developmental heterogeneity of NK cells. During NK cell development, KIRs are stochastically expressed, resulting in a composite of licensed and unlicensed NK cells in individuals with licensing genotypes.(32) Accordingly, when such a subject is HLA-C1C1, KIR2DL3+ NK cells are licensed, and the KIR2DL3− NK cells are unlicensed. We therefore sorted licensed (CD3−CD56dimKIR2DL3+KIR3DL1−KIR2DL1−) and unlicensed (CD3−CD56dimKIR2DL3−) subsets (>95% purity), and evaluated their cytokine production at the single cell level using SCBCs. Compared to KIR2DL3− NK cells, KIR2DL3+KIR3DL1−KIR2DL1− NK cells co-expressed elevated levels of CCL-5, MIP-1β IFN-γ and TNF-α (Figure 5A). To look at the data from a different angle, the majority (65%) of KIR2DL3− NK cells did not secret any cytokine. In contrast, 99% of KIR2DL3+KIR3DL1−KIR2DL1− NK cells secreted at least one cytokine, with one third expressing two cytokines (typically CCL-5+MIP-1β+), another third expressing three cytokines (mostly IFN-γ+MIP-1β+CCL-5+); a substantial fraction (10%) produced four cytokines (Figure 5B).
Figure 5. KIR2DL3+ NK cell subset is responsible for the enhanced pro-inflammatory cytokine production see in HLA-C1C1 individuals.

Peripheral blood NK cells from an AA haplotype HLA-C1C1 healthy donor were sorted for KIR2DL3+KIR3DL1− KIR2DL1− (licensed) and KIR2DL3− (unlicensed) NK subsets, stimulated with PMA/ionomycin, and analyzed using SCBC. (A) 2-D scatter plot of representative cytokine production levels from licensed (red) and unlicensed (blue) NK cell subsets. Axis units are fluorescence intensity, and the value in each gated quadrant is the cell percentage. (B) Polyfunctionality plot showing the composition of NK subsets secreting 0, 1, 2, 3, 4, 5, and > 5 cytokines in licensed (red) and unlicensed (blue) NK cell subsets. The frequency for each major category is shown. (C) Hierarchical clustering of cytokine measurements from single licensed (red) and unlicensed (blue) NK cell subsets. Each column represents one single cell, and each row presents one cytokine. The color scale shows the difference in standard deviation. Results are representative of three independent experiments.
Analysis of ~1,500 single NK cells resolved them into two clusters (hierarchical clustering in Figure 5C and PCA in Supplementary Figure 2). One cluster, predominated by KIR2DL3+KIR3DL1−KIR2DL1− NK cells was polarized towards a pro-inflammatory state (effector proteins such as TNF-α, IFN-γ, and chemokines). A second cluster, predominated by KIR2DL3− NK cells, was polarized towards a more regulatory state (including IL-4, TNF-β, TGF-β1, IL-10). Taken together, licensing mediated by KIR2DL3/HLA-C1 interaction conferred pro-inflammatory immune mediator production program in NK cells.
IFN-γ, TNF-α, and IL-6 account for the capacity of licensed NK cells to augment CD4+ T cell proliferation
To evaluate whether the cytokines produced by licensed NK cells could indeed promote CD4+ T cell proliferation, we neutralized IL-6, IFN-γ, TNF-α, or their combinations in NK-T co-cultures (Figure 6). Neutralization of TNF-α alone had a great impact on CD4+ T cell proliferation, and this effect was specific compared to IgG1κ isotype control. Neutralization of IL-6 or IFN-γ alone had measurable but modest effects, but their combination markedly reduced CD4+ T cell proliferation, suggesting synergistic interaction between them. We further evaluated T cell proliferation in the absence of NK cells, in which exogenous cytokines were added at 20 ng·mL−1, comparable to that produced by licensed NK cells (data not shown). IFN-γ or TNF-α had marginal effects, but the addition of IL-6 or all three greatly facilitated CD4+ T cell proliferation. This indicates that IL-6 might not be necessary to augment CD4+ T cell proliferation in the presence of other cytokines produced by licensed NK cells, but it was sufficient to carry the proliferating effect alone. These cytokine depletion and addition results demonstrated that CD4+ T cell proliferation mediated by NK cells does not rely solely on one particular cytokine, but rather depends on the balance of multiple key cytokines.
Figure 6. Neutralizing IFN-γ, TNF-α, and IL-6 in NK-T cell co-culture ameliorated CD4+ T cell proliferation.

NK and autologous CD4+ T cells were isolated from an AA haplotype licensed individual, stimulated with anti-CD3 and anti-CD28, and co-cultured in 2 ng mL−1 (26 I.U) IL-2 for 3 days. (A) Histograms of CD4+ T cell CFSE dilution without or with the indicated neutralizing antibodies. The number in each histogram indicates the percentage of cells proliferated (gated on CD4+CFSE+ cells). (B) Bar plot of CD4+ T cells division number at NK/T = 1:1 from the AA haplotype healthy individual. (Mean ± SEM, n = 2 to 6, two-tailed student t test, * p < 0.05; ** p < 0.005; *** p < 0.0005). More than three experiments were performed.
Secreted products of NK cells from HLA-C1C1 individuals potently promoted TH17 differentiation
T helper 17 (TH17) cells are crucial drivers for multiple chronic inflammatory diseases, including CD,(33, 34) but there is little information about if or how NK cells might affect TH17 induction or activity. The foregoing results indicated that NK cells from HLA-C1C1 individuals are robust producers of several cytokines, notably IL-6, which is critical for TH17 differentiation.(33, 35, 36) After validating conditions for cytokine induced formation of IL-17A and IL-22 producing TH17 cells (Supplementary Figure 3A), we determined if the supernatant of NK cells from HLA-C1C1 healthy individuals could promote TH17 differentiation from total CD4+ T cells. Indeed, NK supernatants from an HLA-C1C1 healthy individual (AA haplotype), titrated into CD4+ T cell cultures, strongly induced the levels of IL-17A+, IL-22+, and IL-17A+IL-22+ T cells (Figure 7A and B). These effects were observed with licensed NK supernatants alone, or in combination with IL-23, IL-1β, or both IL-1β and IL-23 (Supplementary Figure 3B).
Figure 7. Supernatant of licensed NK cells drives human TH17 cells differentiation in vitro.
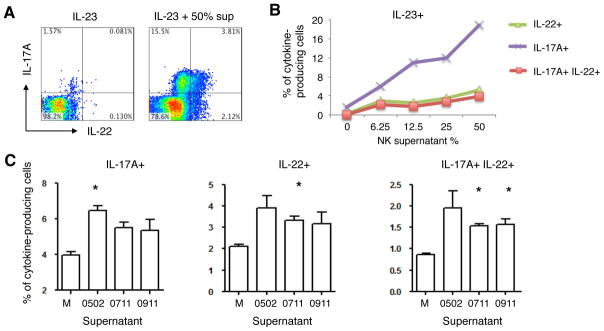
Freshly isolated CD4+ T cells were stimulated with anti-CD3 and anti-CD28, and cultured in the presence of indicated cytokine with or without licensed NK cell supernatants for 6–7 days. CD4+ T cells were expanded for another 6–7 days in 2 ng·mL−1 (26 IU) IL-2 with the same condition provided for priming. (A) 2D scatter plot of IL-17A and IL-22 intracellular production under the conditions indicated (gated on CD4+ cells). Numbers in each quadrant represents the percentage of cell in that quadrant. (B) Line plot of the abundances of IL-22+ (green triangle), IL-17A+ (purple cross), and IL-17A+IL-22+ (red square) populations at different amounts of NK supernatant. This result is representative of three independent experiments. (C) Bar plot of the percentages of IL-17A+ (left panel), IL-22+ (middle panel), and IL-17A+IL-22+ (right panel) CD4+ T cells after differentiating with 50% NK cell supernatants from three licensed healthy donors. M stands for media with the same amount of IL-2 used for NK three-day culture. All assays have been supplemented with 50 ng·mL−1 IL-23. (n = 2, two-tailed student t test, * p < 0.05). (0502 and 0911 are AA haplotype, 0711 has an extra KIR2DL2)
Using the IL-23 plus NK supernatant condition, we analyzed NK cell supernatants from three different healthy subjects with a licensing genotype (AA haplotype, HLA-C1C1). All of them showed strong TH17 differentiation responses (Figure 7C). Among the licensed NK-derived cytokines, IL-6 is a likely candidate to promote Th17 cell differentiation. However, blocking IL-6 alone didn’t detectably affect Th17 differentiation (Supplementary Figure 3C). These findings demonstrate the capacity of licensed NK cells to secrete immune mediators that can strongly promote TH17 differentiation, either alone or synergistically with IL-23 and IL-1β.
Discussion
Through a combination of advances in genotyping technologies, statistical advances and collaborative efforts, there have been spectacular advances in the understanding of the genetic contribution to complex diseases. Arguably, studies into the inflammatory bowel diseases (IBD), Crohn’s disease (CD) and ulcerative colitis (UC), have yielded the most successful results with over 160 susceptibility loci now identified through a succession of genome-wide and more targeted approaches.(34, 37, 38) The rapidity of gene discovery in IBD has far out-paced an understanding of both the functional and clinical consequences of associated variants and bridging this ‘genes to biology’ gap requires significant investment and progress if the full benefits of genetic advances are to be realized. We and others have previously identified associations between IBD and genetic variation at the killer cell immunoglobulin-like receptor (KIR) locus.(13, 14, 39) KIR genes are predominantly expressed by NK cells, and are one element of the receptor repertoire controlling NK cell activation, proliferation, and effector functions that mediate surveillance and host defense for microbial infection and malignancy.(10, 11) The relevance of this locus together with the role of NK cells in the development of IBD has recently been further highlighted with the publication of the IBD genome-wide association studies/Immunochip study.(39)
Besides IBD, the genetic presence of strong NK licensing KIR/ligand pairs (KIR2DL3/HLA-C1 or KIR3DL1/HLA-Bw4) also affects several other important chronic inflammatory diseases: elevated susceptibility to CD, Celiac disease, spondyloarthropathy, psoriatic arthritis; enhanced resolution of Hepatitis C virus (HCV) infection; and, slower progression in HIV-1 infection.(40–46) Understanding the nature of KIR contribution to disease susceptibility or protection is crucial for developing diagnostic and treatment strategies. However, biologic study of KIR-mediated disease association has been challenging due to the polymorphic composition and functions of KIR haplotypes, and the independent assortment of their cognate HLA class I ligands. By focusing on the simplified AA haplotype, which ‘tag’ most of the inhibitory KIRs that are involved in licensing and lack most of the activating KIRs, we were able to identify KIR-mediated licensing as a major mechanism to reprogram NK cell cytokine capacity. We further showed that, in accord with the distinct cytokines produced by licensed NK cells, they have the capacity to augment CD4+ T cell activation and TH17 differentiation, which provides a mechanistic basis for their genetic association to IBD and other chronic inflammatory diseases.
The distinct NK cytokine program induced by KIR licensing appears to be a genetic trait independent of disease status. Thus, NK cell licensing determined cytokine program was preserved in both CD and healthy cohorts (Figures 2–4 and Supplementary Figures 1–2); and functionally, licensed NK cell cytokines from both CD and healthy subjects comparably augmented CD4+ T cell polarization (Figure 1 and 3). The exceptional breadth and pro-inflammatory cytokine profile of licensed NK cell is an important finding of this study, as well as the evidence that this cytokine production lowers the threshold for CD4+ T cell activation. Another striking finding was the selective capacity of licensed NK cell cytokines to efficiently drive IL-17A and IL-22 production. This is in part attributable to NK-derived IL-6; however, other NK-produced cytokines may also be involved, since in several culture conditions, TH17 polarization by NK cell supernatants exceeded that expected for IL-6 alone and blocking IL-6 alone didn’t affect Th17 differentiation (Figure 7 and Supplementary Figure 3). Licensed NK cells synergize with IL-23 and IL-1β to facilitate TH17 differentiation, indicating that licensed NK cell secretory products can collaborate with other cells in the local tissue compartment (dendritic cells or macrophages) to promote a more pro-inflammatory environment shaping CD4+ or CD8+ T cell responses.(47, 48) Further studies of unlicensed and licensed cells from healthy individuals will be required to validate and refine the effects of NK licensing in Th17 differentiation.
NK cells are not abundant and are functionally heterogeneous, posing significant challenges to understand individual cell behavior. We improved and utilized a single cell proteomics microchip for high-throughput, highly multiplexed, tailored analysis of cytokine expression capacity of NK cells. This microfluidic platform permits detection of ~ 40 different protein products per individual cell, and up to 1000 cells in a single experiment; and for the first time, allows us to identify the striking distinctions between licensed and unlicensed NK cell subsets, and the commonality within each subset.
Finally, as the pathogenesis of Crohn’s Disease is ultimately driven by intestinal lymphocytes; it is desirable to investigate properties of licensed NK cells resident in the gastrointestinal tract. However, the practicalities of such a study are quite difficult. Less than 10% of patients are genetically informative (KIR AA haplotype with HLA-C1/C1 genotypes); and even at a major IBD clinical center, intestinal resections from 10 patients would require 2 years to accrue. The alternative of colonscopic biopsy sampling is also technically unsuitable. Due to the low abundance of CD3−CD56+ NK cells in the intraepithelial and lamina propria compartments (~18.5% and ~10%, respectively(49, 50)), and low cellular yield per biopsy (1–2 million lymphocytes per 2 mm2 biopsy(51)), ~20 biopsies from each patient are required for a minimal experiment, which is beyond the number permitted for research sampling. We also note that IBD is a systemic disease with >40% of IBD patients having extra-intestinal manifestations. In this context, the study of NK cells from peripheral compartments is relevant to IBD disease biology.
Bridging the ‘gene to biology’ and ‘bench to bedside’ divides is one of the major challenges currently facing researchers. Our study addresses this challenge through mechanistic finding of the pro-inflammatory role of licensed NK cells on adaptive immunity. This offers a fresh biologic diagram accounting for the impact of KIR-HLA genetics on IBD and other chronic inflammatory diseases.
Supplementary Material
Acknowledgments
This research was performed with material support provided by the Immune Tolerance Network, an international clinical research consortium headquartered at the University of California San Francisco and supported by the National Institute of Allergy and Infectious Diseases and the Juvenile Diabetes Research Foundation.
Footnotes
Funding: This work was supported by NIH grants PO1DK46763 (SRT, DPBM, JB), CA119347 (JRH), 5 UO1 AI067068 (HE, ET, DPBM), DK062413, DK046763-19 (DPBM) UL1TR000124 (SRT, DPBM, JB), and the Cedars-Sinai F. Widjaja Inflammatory Bowel and Immunobiology Institute Research Fund. Project investigators are supported by The Helmsley Charitable Trust (D.P.B.M.), and the European Union (D.P.B.M.).
Author Contributions: L.L. coordinated and processed clinical samples, ex vivo culture, proliferation assay, and TH17 induction experiments. C.M. and L.L. designed the multiplex ELISA and SCBC experiments, and C.M. performed them. L.L. and M.C. performed statistical analysis for cytokine profile data. R.R. performed the HLA and KIR typing on healthy individuals, and E.T. on CD cohort; additional HLA and KIR genotyping data for CD patients was provided by H.E., and E.T. S.R.T., D.P.M., W.B., N.A., and S.Y. coordinated clinical sample collection. L.L. and J.B. conceived the study and directed the experimental design. L.L., C.M., and J.B. wrote the manuscript. All authors reviewed and discussed the manuscript.
References
- 1.Hesslein DG, Lanier LL. Transcriptional control of natural killer cell development and function. Adv Immunol. 2011;109:45–85. doi: 10.1016/B978-0-12-387664-5.00002-9. [DOI] [PubMed] [Google Scholar]
- 2.Elliott JM, Yokoyama WM. Unifying concepts of MHC-dependent natural killer cell education. Trends in immunology. 2011;32:364–372. doi: 10.1016/j.it.2011.06.001. [DOI] [PMC free article] [PubMed] [Google Scholar]
- 3.Vivier E, Tomasello E, Baratin M, Walzer T, Ugolini S. Functions of natural killer cells. Nature immunology. 2008;9:503–510. doi: 10.1038/ni1582. [DOI] [PubMed] [Google Scholar]
- 4.Vivier E, Raulet DH, Moretta A, Caligiuri MA, Zitvogel L, Lanier LL, Yokoyama WM, Ugolini S. Innate or adaptive immunity? The example of natural killer cells. Science. 2011;331:44–49. doi: 10.1126/science.1198687. [DOI] [PMC free article] [PubMed] [Google Scholar]
- 5.Bashirova AA, Thomas R, Carrington M. HLA/KIR restraint of HIV: surviving the fittest. Annual review of immunology. 2011;29:295–317. doi: 10.1146/annurev-immunol-031210-101332. [DOI] [PMC free article] [PubMed] [Google Scholar]
- 6.Khakoo SI, Carrington M. KIR and disease: a model system or system of models? Immunological reviews. 2006;214:186–201. doi: 10.1111/j.1600-065X.2006.00459.x. [DOI] [PubMed] [Google Scholar]
- 7.Jostins L, Ripke S, Weersma RK, Duerr RH, McGovern DP, Hui KY, Lee JC, Schumm LP, Sharma Y, Anderson CA, Essers J, Mitrovic M, Ning K, Cleynen I, Theatre E, Spain SL, Raychaudhuri S, Goyette P, Wei Z, Abraham C, Achkar JP, Ahmad T, Amininejad L, Ananthakrishnan AN, Andersen V, Andrews JM, Baidoo L, Balschun T, Bampton PA, Bitton A, Boucher G, Brand S, Buning C, Cohain A, Cichon S, D’Amato M, De Jong D, Devaney KL, Dubinsky M, Edwards C, Ellinghaus D, Ferguson LR, Franchimont D, Fransen K, Gearry R, Georges M, Gieger C, Glas J, Haritunians T, Hart A, Hawkey C, Hedl M, Hu X, Karlsen TH, Kupcinskas L, Kugathasan S, Latiano A, Laukens D, Lawrance IC, Lees CW, Louis E, Mahy G, Mansfield J, Morgan AR, Mowat C, Newman W, Palmieri O, Ponsioen CY, Potocnik U, Prescott NJ, Regueiro M, Rotter JI, Russell RK, Sanderson JD, Sans M, Satsangi J, Schreiber S, Simms LA, Sventoraityte J, Targan SR, Taylor KD, Tremelling M, Verspaget HW, De Vos M, Wijmenga C, Wilson DC, Winkelmann J, Xavier RJ, Zeissig S, Zhang B, Zhang CK, Zhao H, Silverberg MS, Annese V, Hakonarson H, Brant SR, Radford-Smith G, Mathew CG, Rioux JD, Schadt EE, Daly MJ, Franke A, Parkes M, Vermeire S, Barrett JC, Cho JH IBDGC International. Host-microbe interactions have shaped the genetic architecture of inflammatory bowel disease. Nature. 2012;491:119–124. doi: 10.1038/nature11582. [DOI] [PMC free article] [PubMed] [Google Scholar]
- 8.Hall LJ, Murphy CT, Quinlan A, Hurley G, Shanahan F, Nally K, Melgar S. Natural killer cells protect mice from DSS-induced colitis by regulating neutrophil function via the NKG2A receptor. Mucosal immunology. 2013;6:1016–1026. doi: 10.1038/mi.2012.140. [DOI] [PubMed] [Google Scholar]
- 9.Saha S, Jing X, Park SY, Wang S, Li X, Gupta D, Dziarski R. Peptidoglycan recognition proteins protect mice from experimental colitis by promoting normal gut flora and preventing induction of interferon-gamma. Cell host & microbe. 2010;8:147–162. doi: 10.1016/j.chom.2010.07.005. [DOI] [PMC free article] [PubMed] [Google Scholar]
- 10.Lanier LL. NK cell recognition. Annual review of immunology. 2005;23:225–274. doi: 10.1146/annurev.immunol.23.021704.115526. [DOI] [PubMed] [Google Scholar]
- 11.Fauriat C, Ivarsson MA, Ljunggren HG, Malmberg KJ, Michaelsson J. Education of human natural killer cells by activating killer cell immunoglobulin-like receptors. Blood. 2010;115:1166–1174. doi: 10.1182/blood-2009-09-245746. [DOI] [PubMed] [Google Scholar]
- 12.Du Z, Gjertson DW, Reed EF, Rajalingam R. Receptor-ligand analyses define minimal killer cell Ig-like receptor (KIR) in humans. Immunogenetics. 2007;59:1–15. doi: 10.1007/s00251-006-0168-4. [DOI] [PubMed] [Google Scholar]
- 13.Hollenbach JA, Ladner MB, Saeteurn K, Taylor KD, Mei L, Haritunians T, McGovern DP, Erlich HA, Rotter JI, Trachtenberg EA. Susceptibility to Crohn’s disease is mediated by KIR2DL2/KIR2DL3 heterozygosity and the HLA-C ligand. Immunogenetics. 2009;61:663–671. doi: 10.1007/s00251-009-0396-5. [DOI] [PMC free article] [PubMed] [Google Scholar]
- 14.Wilson TJ, Jobim M, Jobim LF, Portela P, Salim PH, Rosito MA, Damin DC, Flores C, Peres A, Machado MB, Chies JA, Schwartsmann G, Roesler R. Study of killer immunoglobulin-like receptor genes and human leukocyte antigens class I ligands in a Caucasian Brazilian population with Crohn’s disease and ulcerative colitis. Human immunology. 2010;71:293–297. doi: 10.1016/j.humimm.2009.12.006. [DOI] [PubMed] [Google Scholar]
- 15.Jones DC, Edgar RS, Ahmad T, Cummings JR, Jewell DP, Trowsdale J, Young NT. Killer Ig-like receptor (KIR) genotype and HLA ligand combinations in ulcerative colitis susceptibility. Genes and immunity. 2006;7:576–582. doi: 10.1038/sj.gene.6364333. [DOI] [PubMed] [Google Scholar]
- 16.Yokoyama WM, Kim S. How do natural killer cells find self to achieve tolerance? Immunity. 2006;24:249–257. doi: 10.1016/j.immuni.2006.03.006. [DOI] [PubMed] [Google Scholar]
- 17.Anfossi N, Andre P, Guia S, Falk CS, Roetynck S, Stewart CA, Breso V, Frassati C, Reviron D, Middleton D, Romagne F, Ugolini S, Vivier E. Human NK cell education by inhibitory receptors for MHC class I. Immunity. 2006;25:331–342. doi: 10.1016/j.immuni.2006.06.013. [DOI] [PubMed] [Google Scholar]
- 18.Fauriat C, Long EO, Ljunggren HG, Bryceson YT. Regulation of human NK-cell cytokine and chemokine production by target cell recognition. Blood. 2010;115:2167–2176. doi: 10.1182/blood-2009-08-238469. [DOI] [PMC free article] [PubMed] [Google Scholar]
- 19.Hollenbach JA, Nocedal I, Ladner MB, Single RM, Trachtenberg EA. Killer cell immunoglobulin-like receptor (KIR) gene content variation in the HGDP-CEPH populations. Immunogenetics. 2012;64:719–737. doi: 10.1007/s00251-012-0629-x. [DOI] [PMC free article] [PubMed] [Google Scholar]
- 20.Yawata M, Yawata N, Draghi M, Partheniou F, Little AM, Parham P. MHC class I-specific inhibitory receptors and their ligands structure diverse human NK-cell repertoires toward a balance of missing self-response. Blood. 2008;112:2369–2380. doi: 10.1182/blood-2008-03-143727. [DOI] [PMC free article] [PubMed] [Google Scholar]
- 21.Neurath MF, Finotto S, Glimcher LH. The role of Th1/Th2 polarization in mucosal immunity. Nature medicine. 2002;8:567–573. doi: 10.1038/nm0602-567. [DOI] [PubMed] [Google Scholar]
- 22.Bouma G, Strober W. The immunological and genetic basis of inflammatory bowel disease. Nature reviews Immunology. 2003;3:521–533. doi: 10.1038/nri1132. [DOI] [PubMed] [Google Scholar]
- 23.Kim S, Sunwoo JB, Yang L, Choi T, Song YJ, French AR, Vlahiotis A, Piccirillo JF, Cella M, Colonna M, Mohanakumar T, Hsu KC, Dupont B, Yokoyama WM. HLA alleles determine differences in human natural killer cell responsiveness and potency. Proceedings of the National Academy of Sciences of the United States of America. 2008;105:3053–3058. doi: 10.1073/pnas.0712229105. [DOI] [PMC free article] [PubMed] [Google Scholar]
- 24.Shi FD, Van Kaer L. Reciprocal regulation between natural killer cells and autoreactive T cells. Nature reviews Immunology. 2006;6:751–760. doi: 10.1038/nri1935. [DOI] [PubMed] [Google Scholar]
- 25.Narni-Mancinelli E, Jaeger BN, Bernat C, Fenis A, Kung S, De Gassart A, Mahmood S, Gut M, Heath SC, Estelle J, Bertosio E, Vely F, Gastinel LN, Beutler B, Malissen B, Malissen M, Gut IG, Vivier E, Ugolini S. Tuning of natural killer cell reactivity by NKp46 and Helios calibrates T cell responses. Science. 2012;335:344–348. doi: 10.1126/science.1215621. [DOI] [PubMed] [Google Scholar]
- 26.Martin-Fontecha A, Thomsen LL, Brett S, Gerard C, Lipp M, Lanzavecchia A, Sallusto F. Induced recruitment of NK cells to lymph nodes provides IFN-gamma for T(H)1 priming. Nature immunology. 2004;5:1260–1265. doi: 10.1038/ni1138. [DOI] [PubMed] [Google Scholar]
- 27.Assarsson E, Kambayashi T, Schatzle JD, Cramer SO, von Bonin A, Jensen PE, Ljunggren HG, Chambers BJ. NK cells stimulate proliferation of T and NK cells through 2B4/CD48 interactions. Journal of immunology. 2004;173:174–180. doi: 10.4049/jimmunol.173.1.174. [DOI] [PubMed] [Google Scholar]
- 28.Zingoni A, Sornasse T, Cocks BG, Tanaka Y, Santoni A, Lanier LL. Cross-talk between activated human NK cells and CD4+ T cells via OX40-OX40 ligand interactions. Journal of immunology. 2004;173:3716–3724. doi: 10.4049/jimmunol.173.6.3716. [DOI] [PubMed] [Google Scholar]
- 29.Hanna J, Gonen-Gross T, Fitchett J, Rowe T, Daniels M, Arnon TI, Gazit R, Joseph A, Schjetne KW, Steinle A, Porgador A, Mevorach D, Goldman-Wohl D, Yagel S, LaBarre MJ, Buckner JH, Mandelboim O. Novel APC-like properties of human NK cells directly regulate T cell activation. The Journal of clinical investigation. 2004;114:1612–1623. doi: 10.1172/JCI22787. [DOI] [PMC free article] [PubMed] [Google Scholar] [Retracted]
- 30.Ma C, Fan R, Ahmad H, Shi Q, Comin-Anduix B, Chodon T, Koya RC, Liu CC, Kwong GA, Radu CG, Ribas A, Heath JR. A clinical microchip for evaluation of single\immune cells reveals high functional heterogeneity in phenotypically similar T cells. Nature medicine. 2011;17:738–743. doi: 10.1038/nm.2375. [DOI] [PMC free article] [PubMed] [Google Scholar]
- 31.Fan R, Vermesh O, Srivastava A, Yen BK, Qin L, Ahmad H, Kwong GA, Liu CC, Gould J, Hood L, Heath JR. Integrated barcode chips for rapid, multiplexed analysis of proteins in microliter quantities of blood. Nat Biotechnol. 2008;26:1373–1378. doi: 10.1038/nbt.1507. [DOI] [PMC free article] [PubMed] [Google Scholar]
- 32.Valiante NM, Uhrberg M, Shilling HG, Lienert-Weidenbach K, Arnett KL, D’Andrea A, Phillips JH, Lanier LL, Parham P. Functionally and structurally distinct NK cell receptor repertoires in the peripheral blood of two human donors. Immunity. 1997;7:739–751. doi: 10.1016/s1074-7613(00)80393-3. [DOI] [PubMed] [Google Scholar]
- 33.McGeachy MJ, Cua DJ. Th17 cell differentiation: the long and winding road. Immunity. 2008;28:445–453. doi: 10.1016/j.immuni.2008.03.001. [DOI] [PubMed] [Google Scholar]
- 34.Franke A, McGovern DP, Barrett JC, Wang K, Radford-Smith GL, Ahmad T, Lees CW, Balschun T, Lee J, Roberts R, Anderson CA, Bis JC, Bumpstead S, Ellinghaus D, Festen EM, Georges M, Green T, Haritunians T, Jostins L, Latiano A, Mathew CG, Montgomery GW, Prescott NJ, Raychaudhuri S, Rotter JI, Schumm P, Sharma Y, Simms LA, Taylor KD, Whiteman D, Wijmenga C, Baldassano RN, Barclay M, Bayless TM, Brand S, Buning C, Cohen A, Colombel JF, Cottone M, Stronati L, Denson T, De Vos M, D’Inca R, Dubinsky M, Edwards C, Florin T, Franchimont D, Gearry R, Glas J, Van Gossum A, Guthery SL, Halfvarson J, Verspaget HW, Hugot JP, Karban A, Laukens D, Lawrance I, Lemann M, Levine A, Libioulle C, Louis E, Mowat C, Newman W, Panes J, Phillips A, Proctor DD, Regueiro M, Russell R, Rutgeerts P, Sanderson J, Sans M, Seibold F, Steinhart AH, Stokkers PC, Torkvist L, Kullak-Ublick G, Wilson D, Walters T, Targan SR, Brant SR, Rioux JD, D’Amato M, Weersma RK, Kugathasan S, Griffiths AM, Mansfield JC, Vermeire S, Duerr RH, Silverberg MS, Satsangi J, Schreiber S, Cho JH, Annese V, Hakonarson H, Daly MJ, Parkes M. Genome-wide meta-analysis increases to 71 the number of confirmed Crohn’s disease susceptibility loci. Nature genetics. 2010;42:1118–1125. doi: 10.1038/ng.717. [DOI] [PMC free article] [PubMed] [Google Scholar]
- 35.Acosta-Rodriguez EV, Napolitani G, Lanzavecchia A, Sallusto F. Interleukins 1beta and 6 but not transforming growth factor-beta are essential for the differentiation of interleukin 17-producing human T helper cells. Nature immunology. 2007;8:942–949. doi: 10.1038/ni1496. [DOI] [PubMed] [Google Scholar]
- 36.Wilson NJ, Boniface K, Chan JR, McKenzie BS, Blumenschein WM, Mattson JD, Basham B, Smith K, Chen T, Morel F, Lecron JC, Kastelein RA, Cua DJ, McClanahan TK, Bowman EP, de Waal Malefyt R. Development, cytokine profile and function of human interleukin 17-producing helper T cells. Nature immunology. 2007;8:950–957. doi: 10.1038/ni1497. [DOI] [PubMed] [Google Scholar]
- 37.Anderson CA, Boucher G, Lees CW, Franke A, D’Amato M, Taylor KD, Lee JC, Goyette P, Imielinski M, Latiano A, Lagace C, Scott R, Amininejad L, Bumpstead S, Baidoo L, Baldassano RN, Barclay M, Bayless TM, Brand S, Buning C, Colombel JF, Denson LA, De Vos M, Dubinsky M, Edwards C, Ellinghaus D, Fehrmann RS, Floyd JA, Florin T, Franchimont D, Franke L, Georges M, Glas J, Glazer NL, Guthery SL, Haritunians T, Hayward NK, Hugot JP, Jobin G, Laukens D, Lawrance I, Lemann M, Levine A, Libioulle C, Louis E, McGovern DP, Milla M, Montgomery GW, Morley KI, Mowat C, Ng A, Newman W, Ophoff RA, Papi L, Palmieri O, Peyrin-Biroulet L, Panes J, Phillips A, Prescott NJ, Proctor DD, Roberts R, Russell R, Rutgeerts P, Sanderson J, Sans M, Schumm P, Seibold F, Sharma Y, Simms LA, Seielstad M, Steinhart AH, Targan SR, van den Berg LH, Vatn M, Verspaget H, Walters T, Wijmenga C, Wilson DC, Westra HJ, Xavier RJ, Zhao ZZ, Ponsioen CY, Andersen V, Torkvist L, Gazouli M, Anagnou NP, Karlsen TH, Kupcinskas L, Sventoraityte J, Mansfield JC, Kugathasan S, Silverberg MS, Halfvarson J, Rotter JI, Mathew CG, Griffiths AM, Gearry R, Ahmad T, Brant SR, Chamaillard M, Satsangi J, Cho JH, Schreiber S, Daly MJ, Barrett JC, Parkes M, Annese V, Hakonarson H, Radford-Smith G, Duerr RH, Vermeire S, Weersma RK, Rioux JD. Meta-analysis identifies 29 additional ulcerative colitis risk loci, increasing the number of confirmed associations to 47. Nature genetics. 2011;43:246–252. doi: 10.1038/ng.764. [DOI] [PMC free article] [PubMed] [Google Scholar]
- 38.McGovern DP, Gardet A, Torkvist L, Goyette P, Essers J, Taylor KD, Neale BM, Ong RT, Lagace C, Li C, Green T, Stevens CR, Beauchamp C, Fleshner PR, Carlson M, D’Amato M, Halfvarson J, Hibberd ML, Lordal M, Padyukov L, Andriulli A, Colombo E, Latiano A, Palmieri O, Bernard EJ, Deslandres C, Hommes DW, de Jong DJ, Stokkers PC, Weersma RK, Consortium NIG, Sharma Y, Silverberg MS, Cho JH, Wu J, Roeder K, Brant SR, Schumm LP, Duerr RH, Dubinsky MC, Glazer NL, Haritunians T, Ippoliti A, Melmed GY, Siscovick DS, Vasiliauskas EA, Targan SR, Annese V, Wijmenga C, Pettersson S, Rotter JI, Xavier RJ, Daly MJ, Rioux JD, Seielstad M. Genome-wide association identifies multiple ulcerative colitis susceptibility loci. Nature genetics. 2010;42:332–337. doi: 10.1038/ng.549. [DOI] [PMC free article] [PubMed] [Google Scholar]
- 39.Jostins L, Ripke S, Weersma RK, Duerr RH, McGovern DP, Hui KY, Lee JC, Schumm LP, Sharma Y, Anderson CA, Essers J, Mitrovic M, Ning K, Cleynen I, Theatre E, Spain SL, Raychaudhuri S, Goyette P, Wei Z, Abraham C, Achkar JP, Ahmad T, Amininejad L, Ananthakrishnan AN, Andersen V, Andrews JM, Baidoo L, Balschun T, Bampton PA, Bitton A, Boucher G, Brand S, Buning C, Cohain A, Cichon S, D’Amato M, De Jong D, Devaney KL, Dubinsky M, Edwards C, Ellinghaus D, Ferguson LR, Franchimont D, Fransen K, Gearry R, Georges M, Gieger C, Glas J, Haritunians T, Hart A, Hawkey C, Hedl M, Hu X, Karlsen TH, Kupcinskas L, Kugathasan S, Latiano A, Laukens D, Lawrance IC, Lees CW, Louis E, Mahy G, Mansfield J, Morgan AR, Mowat C, Newman W, Palmieri O, Ponsioen CY, Potocnik U, Prescott NJ, Regueiro M, Rotter JI, Russell RK, Sanderson JD, Sans M, Satsangi J, Schreiber S, Simms LA, Sventoraityte J, Targan SR, Taylor KD, Tremelling M, Verspaget HW, De Vos M, Wijmenga C, Wilson DC, Winkelmann J, Xavier RJ, Zeissig S, Zhang B, Zhang CK, Zhao H, Silverberg MS, Annese V, Hakonarson H, Brant SR, Radford-Smith G, Mathew CG, Rioux JD, Schadt EE, Daly MJ, Franke A, Parkes M, Vermeire S, Barrett JC, Cho JH. Host-microbe interactions have shaped the genetic architecture of inflammatory bowel disease. Nature. 2012;491:119–124. doi: 10.1038/nature11582. [DOI] [PMC free article] [PubMed] [Google Scholar]
- 40.Martin MP, Nelson G, Lee JH, Pellett F, Gao X, Wade J, Wilson MJ, Trowsdale J, Gladman D, Carrington M. Cutting edge: susceptibility to psoriatic arthritis: influence of activating killer Ig-like receptor genes in the absence of specific HLA-C alleles. Journal of immunology. 2002;169:2818–2822. doi: 10.4049/jimmunol.169.6.2818. [DOI] [PubMed] [Google Scholar]
- 41.Moodie SJ, Norman PJ, King AL, Fraser JS, Curtis D, Ellis HJ, Vaughan RW, Ciclitira PJ. Analysis of candidate genes on chromosome 19 in coeliac disease: an association study of the KIR and LILR gene clusters. European journal of immunogenetics : official journal of the British Society for Histocompatibility and Immunogenetics. 2002;29:287–291. doi: 10.1046/j.1365-2370.2002.00313.x. [DOI] [PubMed] [Google Scholar]
- 42.Chan AT, Kollnberger SD, Wedderburn LR, Bowness P. Expansion and enhanced survival of natural killer cells expressing the killer immunoglobulin-like receptor KIR3DL2 in spondylarthritis. Arthritis and rheumatism. 2005;52:3586–3595. doi: 10.1002/art.21395. [DOI] [PubMed] [Google Scholar]
- 43.Brodin P, Lakshmikanth T, Karre K, Hoglund P. Skewing of the NK cell repertoire by MHC class I via quantitatively controlled enrichment and contraction of specific Ly49 subsets. Journal of immunology. 2012;188:2218–2226. doi: 10.4049/jimmunol.1102801. [DOI] [PubMed] [Google Scholar]
- 44.Zhi D, Sun C, Sedimbi SK, Luo F, Shen S, Sanjeevi CB. Killer cell immunoglobulin-like receptor along with HLA-C ligand genes are associated with type 1 diabetes in Chinese Han population. Diabetes/metabolism research and reviews. 2011;27:872–877. doi: 10.1002/dmrr.1264. [DOI] [PubMed] [Google Scholar]
- 45.Mehers KL, Long AE, van der Slik AR, Aitken RJ, Nathwani V, Wong FS, Bain S, Gill G, Roep BO, Bingley PJ, Gillespie KM. An increased frequency of NK cell receptor and HLA-C group 1 combinations in early-onset type 1 diabetes. Diabetologia. 2011;54:3062–3070. doi: 10.1007/s00125-011-2299-x. [DOI] [PubMed] [Google Scholar]
- 46.Shastry A, Sedimbi SK, Rajalingam R, Nikitina-Zake L, Rumba I, Wigzell H, Sanjeevi CB. Combination of KIR 2DL2 and HLA-C1 (Asn 80) confers susceptibility to type 1 diabetes in Latvians. International journal of immunogenetics. 2008;35:439–446. doi: 10.1111/j.1744-313X.2008.00804.x. [DOI] [PubMed] [Google Scholar]
- 47.Raue HP, Beadling C, Haun J, Slifka MK. Cytokine-mediated programmed proliferation of virus-specific CD8(+) memory T cells. Immunity. 2013;38:131–139. doi: 10.1016/j.immuni.2012.09.019. [DOI] [PMC free article] [PubMed] [Google Scholar]
- 48.Richer MJ, Nolz JC, Harty JT. Pathogen-specific inflammatory milieux tune the antigen sensitivity of CD8(+) T cells by enhancing T cell receptor signaling. Immunity. 2013;38:140–152. doi: 10.1016/j.immuni.2012.09.017. [DOI] [PMC free article] [PubMed] [Google Scholar]
- 49.Eiras P, Leon F, Camarero C, Lombardia M, Roldan E, Bootello A, Roy G. Intestinal intraepithelial lymphocytes contain a CD3− CD7+ subset expressing natural killer markers and a singular pattern of adhesion molecules. Scandinavian journal of immunology. 2000;52:1–6. doi: 10.1046/j.1365-3083.2000.00761.x. [DOI] [PubMed] [Google Scholar]
- 50.Sips M, Sciaranghella G, Diefenbach T, Dugast AS, Berger CT, Liu Q, Kwon D, Ghebremichael M, Estes JD, Carrington M, Martin JN, Deeks SG, Hunt PW, Alter G. Altered distribution of mucosal NK cells during HIV infection. Mucosal immunology. 2012;5:30–40. doi: 10.1038/mi.2011.40. [DOI] [PMC free article] [PubMed] [Google Scholar]
- 51.Leon F, Roldan E, Sanchez L, Camarero C, Bootello A, Roy G. Human small-intestinal epithelium contains functional natural killer lymphocytes. Gastroenterology. 2003;125:345–356. doi: 10.1016/s0016-5085(03)00886-2. [DOI] [PubMed] [Google Scholar]
Associated Data
This section collects any data citations, data availability statements, or supplementary materials included in this article.