

Abstract
Multiple copies of a gene require enhanced investment on the part of the cell and, as such, call for an explanation. The observation that Escherichia coli has four copies of initiator tRNA (tRNAi) genes, encoding a special tRNA (tRNAfMet) required to start protein synthesis, is puzzling particularly because the cell appears to be unaffected by the removal of one copy. However, the fitness of an organism has both absolute and relative connotations. Thus, we carried out growth competition experiments between E. coli strains that differ in the number of tRNAi genes they contain. This has enabled us to uncover an unexpected link between the number of tRNAi genes and protein synthesis, nutritional status, and fitness. Wild-type strains with the canonical four tRNAi genes are favored in nutrient-rich environments, and those carrying fewer are favored in nutrient-poor environments. Auxotrophs behave as if they have a nutritionally poor internal environment. A heuristic model that links tRNAi gene copy number, genetic stress, and growth rate accounts for the findings. Our observations provide strong evidence that natural selection can work through seemingly minor quantitative variations in gene copy number and thereby impact organismal fitness.
INTRODUCTION
The presence of more than one copy of a gene, and the associated expenditure of energy for maintaining it, poses an evolutionary puzzle, especially in bacteria that divide rapidly. Duplicated bacterial genes generally are rare. Even when found, whether they are functionally equivalent or not is known in very few cases (1). In a famous paper, Muller drew attention to the consequences of differences in gene dosage between the sexes in the fruit fly as evidence for the precision of genetic adaptation (2). Although in Escherichia coli most genes occur in single copies, genes for rRNA and tRNA occur in multiple copies (http://lowelab.ucsc.edu/GtRNAdb/Esch_coli_K12/ and http://rrndb.umms.med.umich.edu/). The presence of multiple rRNA and elongator tRNA genes has been related to the ecology of the cell and the maintenance of optimal growth and translational elongation rates (3–5). However, the evolutionary significance of multiple copies of initiator tRNA (tRNAi) genes remains unknown.
tRNAfMet, encoded by tRNAi, is essential for cell survival and controls the progress of the first and rate-controlling step in translation (6). In eubacteria, tRNAfMet brings formyl-methionine directly to the peptidyl site of the ribosome. E. coli has three identical tRNAi genes which occur together in the metZWV operon at 63.5′ and contribute ∼75% of the total cellular tRNAi content. The fourth gene, metY at 71.5′, makes up the rest (7). The amount of tRNAfMet in the cell is proportional to the number of tRNAi genes (8). In E. coli B, all four tRNAi genes have identical sequences (9). In E. coli K, the metY tRNAi gene possesses A at position 46 (as opposed to m7G in the other tRNAi) with no apparent functional differences.
Either tRNAi locus is sufficient for the viability of E. coli (10, 11). As for the growth rate, deletion of metZWV lowers it, while that of metY appears to leave it unaffected. This raises the question, why keep four tRNAi genes if three will do? A possible explanation is that natural selection acts against strains that carry fewer or more than four tRNAi gene copies. It has been observed that the number of dispensable genes in E. coli varies depending on the growth medium (12).
The present work deals with an adaptation to the nutritional environment displayed by differences in the dosage of a gene responsible for the initiation of protein synthesis in a bacterium. Given that E. coli must compete for nutrients in its natural habitat, we designed growth competition assays to mimic natural conditions and investigate the impact of changing tRNAi gene numbers at the population level. We used a minimally intrusive assay to explore why E. coli might retain four copies of the tRNAi gene and particularly to understand the role of the fourth gene, metY.
MATERIALS AND METHODS
Media and growth conditions.
Unless specified otherwise, bacteria were grown in Luria-Bertani (LB) broth or LB agar plates containing 1.8% Bacto agar (Difco). M9 minimal medium containing 0.4% glucose (or alternate carbon sources as indicated), 1× M9 salts (diluted from a 5× mixture containing 64 g Na2HPO4 · 7H2O, 15 g KH2PO4, 2.5 g NaCl, and 5 g NH4Cl for 1 liter of deionized H2O), 2 mM MgSO4, 0.1 mM CaCl2, and 0.01% vitamin B1 with or without 0.2% Casamino Acids was used as indicated. Unless indicated otherwise, media were supplemented with ampicillin (Amp; 100 μg/ml), chloramphenicol (Cm; 30 μg/ml), kanamycin (Kan; 25 μg/ml), or tetracycline (Tet; 7.5 μg/ml) as required. Strains and plasmids used are described in Table 1.
TABLE 1.
Strains and plasmids
| Strain or plasmid | Genotype/details | Reference or source |
|---|---|---|
| E. coli strains | ||
| KL16 | E. coli K-12; thi1 relA1 spoT1 | 18 |
| KL16ΔmetY::cm | Derivative of KL16 with the metY gene replaced with a 1.1-kb Cmr cassette | 16 |
| KL16ΔmetZWV::kan | Derivative of KL16 with the metZWV genes replaced with a 1.4-kb Kanr cassette | 16 |
| CA274 | E. coli K-12; hfr lacZ125am trpA49am relA1 spoT1 | 19 |
| Su15 | Derivative of CA274; metYCUA | 14 |
| CP78 | E. coli K-12; relA+ spoT+; mutated in leu, arg, his, thr thi, relX | 20 |
| CP78(Tet) | Derivative of CP78; Tetr; ∼70% linkage with metY | Laboratory strain, unpublished |
| CP78(Tet)Su15 | Derivative of CP78; Tetr; ∼70% linkage with metYCUA | Laboratory strain, unpublished |
| CP78ΔmetY::kan | Derivative of CP78 with the metY gene replaced with a 1.4-kb Kanr cassette | This study |
| CP79 | E. coli K-12; spoT+; mutated in leu, arg, his, thr, thi, relA, relX | 20 |
| CP79(Tet) | Derivative of CP79; Tetr | This study |
| CP79(Tet)Su15 | Derivative of CP79; Tetr; ∼70% linkage with metYCUA | This study |
| MG1655 | ilvG rfb-50 rph-1 | 21 |
| MG(Tet) | Derivative of MG1655; Tetr; ∼70% linkage with metY | This study |
| MG(Tet)Su15 | Derivative of MG1655; Tetr; ∼70% linkage with metYCUA | This study |
| MGΔmetY::kan | Derivative of MG1655 with the metY gene replaced with a 1.4-kb Kanr cassette | This study |
| Plasmids | ||
| pCATam1 | Renamed from pRSVCATam1.2.5; pBR322 derivative harboring the CAT reporter gene with UAG as the initiation codon; Ampr | 22 |
| pmetY | Derivative of pCATam1 plasmid encoding the wild-type metY gene and lacking the CAT reporter gene | 16 |
Generation of strains for competition assays.
Strains were transformed with the plasmid pCATam1 and then subjected to transduction to generate the required strains. P1 lysate was raised on the strain CP78 (Tet)Su15, which carries a tetracycline resistance marker with ∼70% linkage with the metY gene. Transductants generated were patched on LB agar selection plates containing Cm, Amp, and Tet. LB agar plates containing Amp and Tet served as the control plate. In each case, 70 to 80% of the Tet-resistant colonies were found to be chloramphenicol resistant. One Cm-, Amp-, and Tet-resistant strain was used as a strain containing three tRNAi genes, and one Cm-sensitive and Amp- and Tet-resistant strain was picked to serve as its isogenic strain bearing four tRNAi genes.
Growth competition assays.
Growth competitions were carried out in LB and M9 minimal medium by competing two isogenic strains differing only in their tRNAi gene numbers. The strains were grown to saturation, subcultured, mixed in equal (or as indicated) amounts by volume, and monitored for numbers using the assay system described in Results. When cultured in minimal medium, the prototrophic strain MG1655 was not supplied with any amino acids. The auxotrophic strains CP78 and CP79 were supplied with 0.2% Casamino Acids, while CA274 and Su15, which are auxotrophic only for Trp, were supplied with Trp as indicated. An inoculum of 1% containing equal volumes of saturated culture from the two strains being competed, for instance, CA274 harboring pCATam1 and Su15 harboring pCATam1, was inoculated in 50 ml medium (also done with 5 ml) containing 100 μg/ml Amp. CP78(Tet) harboring pCATam1 and CP78(Tet)Su15 harboring pCATam1 were similarly inoculated with 100 μg/ml of Amp and 7.5 μg/ml of Tet. At every 12 h, the cultures were streaked on appropriate selection plates in duplicates. Isolated colonies randomly picked from these plates were then patched onto Cm selection plates, with Amp or Amp Tet plates (as required) serving as controls. The number of Cmr and Cms colonies was scored at each time point. The Cmr colonies correspond to strains carrying three tRNAi genes (due to the presence of the Su15-derived metY), while the Cms colonies correspond to the isogenic strain carrying four tRNAi genes. Survival curves were plotted to estimate the relative fitness of the two strains, and a measure of the significance was obtained using Mann-Whitney U tests.
Estimation of viable counts.
Viable counts of the strains under investigation were taken both individually and in mixed culture. An inoculum of 1% containing equal volumes of saturated culture from the two strains under investigation was inoculated in 50 ml of LB with suitable antibiotics. At the required time intervals, 100-μl aliquots of the culture were taken and serial 10-fold dilutions prepared in LB. Viable counts were obtained by dilution plating of two dilutions in duplicate at each time point.
Bacterial cell labeling with [35S]methionine.
An inoculum of 1% using saturated cultures from KL16 and KL16ΔmetZWV was subcultured in 5 ml M9 minimal medium containing 0.2% Casamino Acids. An aliquot containing 50 μCi of [35S]methionine was added to 250 μl culture, taken every 24 h for 3 days. The samples were incubated at 37°C for half an hour (∼one doubling). They were then centrifuged at ∼7,500 × g for 5 min. The supernatant was discarded and the pellet dissolved in 30 μl of 1× SDS sample buffer diluted from 2× buffer (100 mM Tris-HCl [pH 6.8], 200 mM dithiothreitol, 4% SDS, 0.2% bromophenol blue, 20% glycerol). The samples were frozen in liquid nitrogen and stored at −70°C. This was carried out at three time points, after 24, 48, and 60 h. An attempt to use cultures in log phase resulted in very poor labeling, and the 24-h culture was used instead as a representative of a culture in rich medium. Simultaneously, 100 μl of culture was used in dilution plating to determine the viable counts of each strain.
Simulations.
The simulation of bacterial growth described here involves two bacterial clones containing four and three tRNAi genes, respectively, in genetic backgrounds that are otherwise identical. The bacteria are grown in a well-stirred liquid medium. The growth of each clone is represented by the following scheme: net rate of growth ∼ rate of accumulation of biomass − rate of decay = (benefit − cost of carrying n tRNAi genes) − (rate of decay), with (i) both the benefit and cost affected by the number of tRNAi genes carried in a cell and (ii) the rate of decay being partly autonomous and partly dependent on a time-dependent decrease in environmental quality on account of the accumulation of waste products. Equivalently, the time-dependent decrease in environmental quality may be taken to reflect substrate depletion. The following equation was used:
| (1) |
for n = 4 and 3 separately. Here, n is the tRNAi gene copy number of the clone in question, Cn is the cell density of that clone, t is the time, Kn is the carrying capacity of the environment for that clone, and W is a measure of accumulated waste. αn and βn are the specific advantage and specific cost, respectively, per tRNAi gene carried by the cell. Note that cost increases at a rate that is higher than that of the copy number; a preliminary analysis showed that this was a necessary requirement of the model if αn and βn are taken to be the same for both clones, that is, independent of n (see below). rn is the growth rate and δn is the spontaneous rate of cell death; both are clone specific. 1/μn is the level of waste at which the death rate doubles. W is zero to begin with and changes in time according to the following equation:
| (2) |
where λ4 and λ3 are the rates of waste production by the clones containing 4 and 3 tRNAi genes, respectively, and λ0 is the spontaneous rate of degradation of W. Finally, α, the benefit term in the conversion of substrate to biomass, depends on the effective level of the substrate, S. αn = 0 when S = 0, and α reaches a maximum when S is very high. In the model αn = S/(S + S0n); S gets continuously depleted by getting converted into biomass. The decrease in S is modeled by assuming conversion efficiencies, p4 and p3 for 4 and 3 tRNAi genes, respectively, for biomass accumulation by the clones. This assumption translates to the following equation:
| (3) |
where n has been replaced by 4 in the first term on the right and by 3 in the second. Equations 1 (which is a pair), 2, and 3 constitute the system.
In choosing explicit values for the various parameters, while demanding broad agreement with experimental results, we have paid heed to the following qualitative requirements. Most importantly, it was thought desirable to restrict the tRNAi gene copy number dependence of the model to an (α · n − β · n2) term. In other words, having formulated a very general scheme, what we have actually studied in detail is a restricted or minimal model that results when r, K, S0, α, β, δ, λ, and μ all are assumed to be independent of n; that is, they are the same for cells containing 4 and 3 tRNAi genes. The reason for doing so was to avoid making ad hoc assumptions as much as possible. It goes without saying that the scope of the model increases vastly if one discards one or more of the restrictive assumptions. Preliminary studies showed that this was especially true of two of them, namely, μ4 and μ3 being the same (i.e., the two clones are equally sensitive to waste accumulation) and S04 and S03 being the same (i.e., the clones are identical in their substrate uptake efficiencies). In addition to that, we have tried to ensure that (i) when monitored separately, the growth kinetics of the two clones are similar; (ii) when a wild-type pair is examined, by and large C4(t) > C3(t); and (iii) when two auxotrophs are studied, by and large C3(t) > C4(t).
In the simulations, time is measured in minutes and the rates r, δ, and λ are all in inverse minutes. All other parameters are dimensionless. Cell densities are measured relative to the carrying capacity, K. Substrate and waste are measured in arbitrary units. Poor nutrient availability is modeled by raising the value of S0 above a basal level. Differential equations 1 to 3 were solved using FORTRAN and a fourth-order Runge-Kutta numerical integration scheme (13) with a time step of 5 s after the program had been independently validated with an analytically solvable model.
RESULTS
Generation of the strains and the assay system.
To compare the fitness of strains carrying different numbers of tRNAi genes, we exploited E. coli Su15 (14). In this strain, metY is mutated to carry tRNAi with a CUA anticodon (instead of CAU), which disables initiation from the AUG or related codons in native mRNAs. However, the cell invests in making the tRNA and in its aminoacylation and formylation (14). This minimal change in metY avoids the polar effects sometimes associated with gene knockouts. The Su15 tRNAi initiates from the UAG initiation codon in a reporter. The presence of the pCATam1 plasmid, carrying the chloramphenicol acetyltransferase (CAT) gene with a UAG initiation codon, confers Cmr to Su15 but not to the wild-type parent (Fig. 1A). Thus, the abundance of the two strains can be scored by Cmr and Cms phenotypes of the isolated colonies from mixed cultures (see Fig. S1 in the supplemental material). To perform experiments, the Su15 locus was transduced into several strain backgrounds, and isogenic pairs differing only at the metY locus were used. When the parent strain carried a Tet marker used in transduction, its name is appended by “(Tet).” The Su15 strains are called 3-tRNAi-gene strains, because only three of the four tRNAi genes in them cater to cellular needs. Another set of three-tRNAi-gene strains constructed by deleting metY with either Kanr or Cmr cassettes (ΔmetY::kan or ΔmetY::cm) could be identified directly by their Kanr or Cmr phenotype, respectively (Fig. 1B).
FIG 1.

Assays to distinguish three- and four-tRNAi-gene strains in mixed cultures. (A) Parent E. coli (left) and its Su15 derivative (right) containing pCATam1. The parent with all wild-type tRNAi genes producing no CAT from CATam1 mRNA is Cms. The Su15 derivative where metY carries mutant tRNAfMet initiating from CATam1 is Cmr. (B) The parent strain is Kans Cms, whereas the one where metY is deleted is Kanr (ΔmetY::kan) or Cmr (ΔmetY::cm).
Strains with three or four tRNAi genes show comparable profiles in independent growth.
Growth profiles obtained by viable counts of the isogenic strain pairs of E. coli MG1655 carrying three or four tRNAi genes are nearly identical, both in the case of the Su15 derivatives and in the strain that actually lacks metY (see Fig. S2 in the supplemental material). The same was observed across strains with different genetic backgrounds when culture absorbances were monitored (see Fig. S3), corroborating earlier reports of comparable growth profiles of such strains (10).
In mixed cultures, strains with four tRNAi genes outcompete the strains with three.
In its natural environment, E. coli coexists with other bacteria, likely including mutants of the same strain. Hence, to investigate the role of the fourth gene, metY, we used growth competition experiments extending into late stationary phase, where resources are limiting. We cocultured isogenic strain pairs of MG1655 with three and four tRNAi genes and monitored their relative numbers. Unlike the independent cultures (see Fig. S2 in the supplemental material), there is a dramatic difference in their relative numbers within 48 h. The strain carrying four tRNAi genes comprehensively outcompetes the one with three in ∼40 h in LB (Fig. 2A). The phenomenon remained true even in minimal medium (Fig. 2B) and when the initial inoculum was biased in favor of the loser (Fig. 2C). An interpretation for this observation could be that under nutrient-rich conditions where carbon and nitrogen sources are ample in the medium, a strain with four tRNAi genes is favored. At least in principle, it could be argued that spurious initiation from UAG codons (located downstream of SD-like sequences) in some mRNAs disadvantaged the Su15 strain in unknown ways. However, we were able to rule out this possibility (see below).
FIG 2.
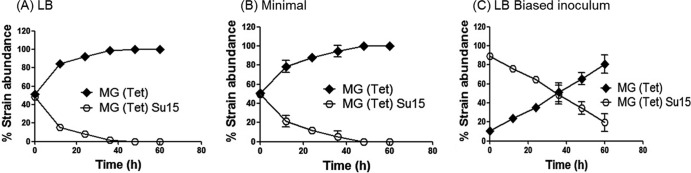
Growth competition between isogenic E. coli strains with four and three tRNAi genes. Coculturing of equal inocula of MG(Tet) and MG(Tet)Su15 harboring pCATam1 in LB (A) and in minimal medium (B). (C) Coculturing of biased inoculum of MG(Tet)Su15 at ∼90% and MG(Tet) at ∼10% harboring pCATam1 in LB. P < 0.01 by Mann-Whitney U test. The mean values from three independent experiments are shown along with standard deviations.
Further depletion of tRNAi leads to environment-specific growth defects.
To better understand the growth phenotypes in the mixed cultures and the reason for the competitive advantage observed, we further depleted the tRNAi content in the cell by deleting three of the four tRNAi genes. Relative to the strain with four tRNAi genes, the strain with a single tRNAi gene shows a growth defect in rich medium (Fig. 3A). The difference in the growth of the two strains was lessened in minimal medium lacking amino acids (Fig. 3B). Likewise, when the protein synthesis rates of the two strains are compared by in vivo labeling with [35S]methionine, the same trend is reflected, with the difference between the two rates being higher in log phase (when the nutrients are still plenty) than in stationary phase (Fig. 3C). Taken together, these observations suggested an advantage to the four-tRNAi-gene strain under nutrient-rich conditions and suggested that this advantage decreased in magnitude as the medium grew poorer.
FIG 3.
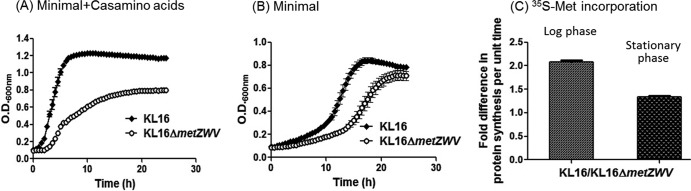
Environment-specific growth defects. Independent growth of E. coli KL16 and KL16ΔmetZWV in minimal medium with (A) or without (B) Casamino Acids. (C) The strains were grown for 24 h (log phase) and 48 h (stationary phase) and subjected to labeling with [35S]methionine to measure rates of protein synthesis. The means with SEM of the fold differences in [35S]methionine incorporation per cell (normalized with viable counts) during the log and stationary phases are plotted as shown. Growth curves were carried out using a Bioscreen kinetic growth reader.
Simulations.
The experiments described in Fig. S2 in the supplemental material indicate that by themselves, strains that differ by one tRNAi gene grow at comparable rates. However, when competed against each other, there are striking differences (Fig. 2). In order to check whether such a situation could reasonably arise out of a slightly higher growth rate of one strain not manifested during separate growth but leading to better nutrient uptake in mixed culture, we carried out mathematical simulations with minimal assumptions. The simulations attempt to address the following question: what is the minimal model relating tRNAi gene copy number to growth that can mimic the observations? To begin with, we assumed that exponential growth is limited by the maximum number of individuals of a particular species that can be sustained stably in a given environment (i.e., the carrying capacity of the environment). The rate of increase in cell number is taken to depend on the efficiency of protein synthesis, which in turn is taken to reflect the rate of translation initiation and the number of functional tRNAi genes available. At the same time, the growth rate contains a term corresponding to the energetic cost of maintaining extra copies of DNA (in the form of tRNAi genes). Finally, in order to account for the fact that cell numbers decrease after reaching a maximum, the net growth rate includes a decay term. It is made up of spontaneous (probabilistic) cell death augmented by the release of toxic factors from cells or by the depletion of nutrients; the formal scheme does not distinguish between these two possibilities. The resulting differential equations were solved by means of a FORTRAN program with the help of a standard fourth-order Runge-Kutta procedure for numerical integration (13) that was validated using analytically solvable schemes (for details, see Materials and Methods). The simulations show that when grown independently, the strains carrying four and three tRNAi genes look nearly identical (Fig. 4A and B). In competition, normally the strain with four tRNAi genes overtakes the one with three (Fig. 4C). Interestingly, when nutrients were limiting, even though the four-tRNAi-gene strain does better than the one with three copies initially, the eventual outcome is the other way around (Fig. 4D).
FIG 4.

Simulated growth experiments. Outcomes of simulated competitions between pairs of E. coli strains containing 4 or 3 tRNAi genes in nutrient-rich (A and C) and nutrient-poor (B and D) environments. (A and B) Growth curves when the two strains are grown independently. (C and D) Relative proportions when the strains share an environment. The actual cell densities in panels C and D are lower than those in panels A and B, respectively (see the supplemental material). The 4- and 3-tRNAi-gene strains have almost identical growth profiles by themselves but behave very differently when forced to compete. At the start of a simulation, cell density was 105 cells/ml, the nutrient density was 25 (arbitrary units), and the waste density was zero. The graphs represent the proportions of the two competing strains as a function of time in minutes. Except for tRNAi gene copy numbers, the competing strains were assumed to possess identical physiological parameters (see equations 1 to 3 in Materials and Methods). For panel A, the following values were used: minimum cell doubling time during exponential growth (T2), 20 min; maximum value of (linear) benefit to growth rate per tRNAi gene copy (α), 0.858; (quadratic) cost to growth rate per tRNAi gene copy (β), 0.101; autonomous cell death rate (i.e., with no waste) (δ), 0.0017 min−1; substrate level at which the efficiency of substrate utilization drops by half (S0), 0.5; rate of waste production per unit of cell density (λ), 0.05; rate of waste decay (λ0) = 0; reciprocal of the waste density at which the death rate doubles (μ), 1.0 and λ0 = 0 (see equation 2). Except for S0, which has been raised from 0.5 to 4.5, the simulation outputs shown in panel B are based on the same parameter values.
Prototrophs with three tRNAi genes take over those with four in non-glucose carbon sources.
In addition to supporting the experimental observations, the simulations (Fig. 4A to C) made an additional prediction (Fig. 4D) that, under nutrient-limiting conditions, the relative growth advantages of four- and three-tRNAi-gene strains should be reversed. To test this, we carried out growth competitions in non-glucose carbon sources, like glycerol, that are known to retard the doubling times of E. coli (15), and we found that strains carrying three tRNAi genes (Su15 derivatives) indeed dominated over strains carrying four (Fig. 5A). Additionally, we generated a knockout of metY, replacing it with a chloramphenicol resistance marker (ΔmetY::cm), and the results remained the same (Fig. 5B). Thus, contrary to the observation made in Fig. 2, the three-tRNAi-gene strains were at an advantage under nutrient-limiting conditions. Such an advantage for both the Su15 strain and the ΔmetY::cm strain (where initiation from the UAG codon does not occur) ruled out the possibility of spurious initiation from UAG as the reason for the disadvantage to the three-tRNAi-gene strain shown in Fig. 2. We should add that while within themselves the Su15 and the ΔmetY::cm strains may show differences in fitness (see Discussion), as far as their comparison to the four-tRNAi-gene strain is concerned, they behave similarly.
FIG 5.
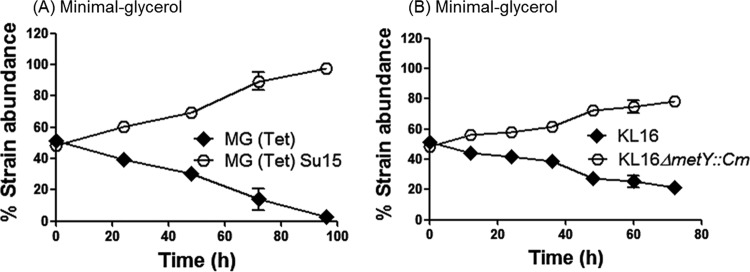
Strains carrying three tRNAi genes outcompete strains carrying four when the wild-type strain is cultured in a poor carbon source. Growth competition of E. coli strain derivatives in poor carbon sources. (A) MG(Tet) and MG(Tet)Su15 harboring pCATam1 were subjected to growth competition in minimal medium using 0.1% glycerol as the carbon source. The two strains show significantly different endpoints (P < 0.01 by Mann-Whitney U test). (B) KL16 and KL16ΔmetY::cm were subjected to growth competition in minimal medium using 0.1% glycerol as the carbon source. The two strains show significantly different endpoints (P < 0.01 by Mann-Whitney U test). The mean values from three independent experiments are shown along with standard deviations.
Auxotrophs with three tRNAi genes outcompete those with four in long-term growth.
The results described above indicated that strains carrying fewer tRNAi genes have an advantage in nutrient-depleted environments. We decided to examine this hypothesis using strains auxotrophic (internally limited) for multiple amino acids. The strain carrying three tRNAi genes outcompeted the one carrying four in LB (Fig. 6A). To rule out the possibility that this fitness advantage, which appeared after 3 days, was due to beneficial secondary mutation(s), we carried out competitions using new and old colonies where bacteria from the end of an experiment were competed with fresh ones. The results (see Fig. S4 in the supplemental material) were unchanged, suggesting that functionally, strain identities were preserved during our experiments. Also, the mathematical model (Fig. 4) which did not invoke any mutations showed a similar outcome, suggesting that the consistent and reversible growth advantages we see are bona fide consequences of altered fitness due to a change in tRNAi gene numbers.
FIG 6.

Long-term competitions with isogenic auxotrophs bearing three or four tRNAi genes. E. coli CP78(Tet) and CP78(Tet)Su15 harboring pCATam1 were cocultured in LB (A) and in minimal medium carrying 0.2% Casamino Acids (B). The arrow indicates the point at which the two strains begin to diverge. (C) Growth competition between CP78(Tet) and CP78ΔmetY::kan in LB. Also shown is growth competition between CP78(Tet) and CP78(Tet)Su15 harboring pCATam1 upon hourly subculturing in LB (D), subculturing in minimal medium with 0.2% Casamino Acids (E), and subculturing in LB with a biased starting inoculum (F). P < 0.01 for panels A to C and P < 0.05 for panels D to F (Mann-Whitney U test). The mean values of three independent experiments are shown along with standard deviations.
Two predictions follow from these findings: (i) the greater the nutrient depletion, the earlier the takeover by the three-tRNAi-gene strain; (ii) the phenomenon must be reversible if a constant supply of nutrients is kept up. Both of these predictions have been realized. In minimal medium supplemented with a maintenance level of Casamino Acids, the decisive takeover occurs 24 to 36 h earlier than it does in rich medium (compare Fig. 6B to A). A similar trend follows when a strain deleted for metY (ΔmetY::kan) is used instead of Su15 (Fig. 6C). To test the second prediction, a mixture of the two auxotrophic cultures was subcultured every 1 h (optical density at 600 nm [OD600] of ∼0.5) into fresh medium at the same temperature. The four-tRNAi-gene strain now did better (Fig. 6D). A similar result is seen in minimal medium (Fig. 6E) or when the inoculum is biased in favor of the three-tRNAi-gene strain (Fig. 6F). Furthermore, the auxotrophic strain harboring a multicopy metY plasmid was disadvantaged relative to the same strain carrying a plasmid with no tRNA genes (see Fig. S5 in the supplemental material). These observations suggest that there is indeed a fitness advantage to carrying fewer tRNAi genes under nutrient deficiency.
Single-amino-acid levels can determine the direction of growth advantage.
All auxotrophs used so far were deficient in the biosynthesis of multiple amino acids. Hence, we used E. coli CA274, a strain auxotrophic for tryptophan (Trp), alone to carry out competitions with a range of concentrations of Trp in minimal medium (with no other amino acids added). Strikingly, while at Trp concentrations of 0.05 μg/ml and 0.1 μg/ml the strain carrying three tRNAi genes did better (Fig. 7A and B), upon raising the Trp to 0.4 μg/ml, the advantage was reversed and the strain carrying four dominated once again (Fig. 7C). Switching of the direction of the growth advantage in this manner indicates that the nutrient availability-based advantage or disadvantage, at least under these conditions, was exclusively an outcome of functional tRNAi gene numbers in the strain.
FIG 7.

Dependence of the direction of growth advantage on the concentration of a single amino acid. Coculturing of E. coli CA274 (auxotrophic for Trp) and its Su15 derivative carrying pCATam1 in minimal medium supplemented with Trp alone at 0.05 μg/ml (A), 0.1 μg/ml (B), and 0.4 μg/ml (C) (P < 0.01 by Mann-Whitney U test). The mean values from three independent experiments are shown along with standard deviations.
DISCUSSION
The presence of multiple tRNAi genes in E. coli has long been a puzzle. Studies have suggested their role in controlling growth rate and in maintaining the fidelity of protein synthesis (8, 16). However, no direct comparison of the fitness of strains carrying different numbers of tRNAi genes had been attempted. Deletion of more than one tRNAi gene renders the strains significantly slower growing, making them unsuited to competition analyses. We find that the gene metY is not redundant. It plays a critical role in deciding the fate of the cell in a mixed environment. Our study also indicates that the conventional view of starvation through external limitation (via the environment) can be extended to include an internal limitation represented by auxotrophy.
In wild-type (prototrophic) E. coli, growth competition experiments showed that the canonical number of four tRNAi genes is optimal. It may be argued that the competitive advantage of the wild-type strain vis-á-vis a strain lacking one tRNAi gene could have been an outcome of a novel phenomenon in mixed culture, such as different amounts of a secreted factor (an entirely new factor is implausible given that the competing strains are isogenic; in fact, one is derived from the other). However, the fact that the advantages are (i) dependent on the internal and external nutrient environment, (ii) reversible by manipulating the external environment, (iii) consistent over several experiments and genetic backgrounds, and (iv) achievable by changing the concentration of a single amino acid all make it a highly unlikely possibility. By keeping apart the competing cultures by a membrane filter, we could show that cell-to-cell contact does not play a role in mediating the competitive advantages (see Fig. S6 in the supplemental material). In addition, the outcome of our simulation is the same when there is no cell-to-cell interaction via waste production, and growth rates respond independently to nutrient depletion in the environment (Fig. 4). The simulations model nutrient limitation, which could be external or internal. In effect, the assumption is that for the same level of external substrate an auxotroph's metabolic machinery has access to a much smaller amount of substrate internally than the wild type. An implication of this way of modeling auxotrophy is that the growth kinetics of a wild-type cell in a nutritionally poor external environment mimics that of the auxotroph in a nutritionally richer environment.
With prototrophic E. coli, for the most part, a four-tRNAi-gene strain does better than one containing three genes (except when the strains are cultured in a poor carbon source, such as glycerol) (Fig. 5). Strikingly, the exact opposite is observed in auxotrophs. The inability to produce some amino acids very likely leads to a relatively early onset of starvation. The growth disadvantage conferred by this defect appears to make it favorable for the bacterium to restrict its caloric intake and thereby reduce overall protein synthesis. In other words, for an auxotrophic strain, having three rather than four tRNAi genes appears to serve as an adaptive response to starvation. Only under conditions where the strains were subcultured every 1 h (and not 6 or even 3 h) was it possible to counter this outcome. Thus, there is a narrow window of nutrient sufficiency within which the advantages can be reversed. When three tRNAi genes are deleted, there is a clear growth compromise and a significant drop in the rate of protein synthesis. Both effects are drastically reduced when the growth medium is depleted of amino acids (Fig. 3). Therefore, it would appear that having fewer than four tRNAi genes is a good strategy for the cell under nutrient limitation. RelA, a sensor of amino acid starvation in E. coli, does not seem to influence the growth advantages in our experiments. This suggests that RelA affects both strains similarly; therefore, it may not have significant consequences here (see Fig. S7 in the supplemental material).
What do our observations imply? Can E. coli exist in nature as cells containing different numbers of tRNAi genes, and can a cell change the number in response to a fluctuating environment? An earlier study (17) showed that defective formylation of tRNAfMet in S. enterica led to spontaneous duplications of the metZWV genes. The NCBI database also includes two novel E. coli genome sequences, one with five (HS) and another with three (IAI39) genes rather than the canonical number of four tRNAi genes. Interestingly, the strain with the smaller number was isolated from a urinary tract infection and could be thought of as being in a nutritionally stressful environment. The one with five tRNAi genes was a gut isolate and could be thought of as being in a nutrient-rich environment. This correlative evidence adds further weight to our hypothesis that E. coli bearing fewer than four tRNAi genes is at an advantage in nutrient-poor environments, and a dynamic copy number change and selection for such mutants may well be operating in natural habitats. Can E. coli modulate its tRNAi gene copy number in response to environmental cues? We attempted to knock out individual genes from the metZWV operon under several nutrient conditions but were only successful in obtaining a deletion of the metZ and metW genes together (16), suggesting that the metZWV locus is not readily amenable to change under laboratory conditions. Although this question remains open, we have uncovered an unexpected link between the copy number, an element crucial to both the quality and quantity of protein synthesis and to survival, and the effective level of available nutrient. A careful comparison of Fig. 5A with 5B and Fig. 6A with 6C shows that even though strains with an inactivated metY gene and a deleted metY gene are both nominally three-tRNAi-gene strains, their behavior is not identical. The growth of the deletion strain appears to be better than that of the one carrying the inactivated gene. This observation provides an unexpected vindication of the model, according to which the deletion strain is expected to be spared the metabolic cost of carrying an extra stretch of DNA that is present in its counterpart (see the αn and βn terms in equation 1). Our findings have led to an insight concerning the impact of auxotrophy on the survival of bacterial populations. In addition, they reiterate that (i) gene dosage is a signature of the precision of adaptation (2) and (ii) fitness is a relative concept.
Supplementary Material
ACKNOWLEDGMENTS
We thank many of our friends and laboratory colleagues for their helpful suggestions on the manuscript.
This work was supported by grants from the Departments of Science and Technology (DST) and Biotechnology (DBT), New Delhi, India. U.V. is a J. C. Bose fellow of DST.
Footnotes
Published ahead of print 9 May 2014
Supplemental material for this article may be found at http://dx.doi.org/10.1128/JB.01620-14.
REFERENCES
- 1.Gevers D, Vandepoele K, Simillon C, Van de Peer Y. 2004. Gene duplication and biased functional retention of paralogs in bacterial genomes. Trends Microbiol. 12:148–154. 10.1016/j.tim.2004.02.007 [DOI] [PubMed] [Google Scholar]
- 2.Muller HJ. 1948. Evidence of the precision of genetic adaptation. Harvey Lect. 43:165–229 [Google Scholar]
- 3.Stevenson BS, Schmidt TM. 2004. Life history implications of rRNA gene copy number in Escherichia coli. Appl. Environ. Microbiol. 70:6670–6677. 10.1128/AEM.70.11.6670-6677.2004 [DOI] [PMC free article] [PubMed] [Google Scholar]
- 4.Dong H, Nilsson L, Kurland CG. 1996. Co-variation of tRNA abundance and codon usage in Escherichia coli at different growth rates. J. Mol. Biol. 260:649–663. 10.1006/jmbi.1996.0428 [DOI] [PubMed] [Google Scholar]
- 5.Yona AH, Bloom-Ackermann Z, Frumkin I, Hanson-Smith V, Charpak-Amikam Y, Feng Q, Boeke JD, Dahan O, Pilpel Y. 2013. tRNA genes rapidly change in evolution to meet novel translational demands. eLife 2:e01339. 10.7554/eLife.01339 [DOI] [PMC free article] [PubMed] [Google Scholar]
- 6.Gualerzi C, Risuleo G, Pon CL. 1977. Initial rate kinetic analysis of the mechanism of initiation complex formation and the role of initiation factor IF-3. Biochemistry 16:1684–1689. 10.1021/bi00627a025 [DOI] [PubMed] [Google Scholar]
- 7.Kenri T, Imamoto F, Kano Y. 1994. Three tandemly repeated structural genes encoding tRNA(f1Met) in the metZ operon of Escherichia coli K-12. Gene 138:261–262. 10.1016/0378-1119(94)90821-4 [DOI] [PubMed] [Google Scholar]
- 8.Kapoor S, Das G, Varshney U. 2011. Crucial contribution of the multiple copies of the initiator tRNA genes in the fidelity of tRNA(fMet) selection on the ribosomal P-site in Escherichia coli. Nucleic Acids Res. 39:202–212. 10.1093/nar/gkq760 [DOI] [PMC free article] [PubMed] [Google Scholar]
- 9.Mandal N, Raj Bhandary UL. 1992. Escherichia coli B lacks one of the two initiator tRNA species present in E. coli K-12. J. Bacteriol. 174:7827–7830 [DOI] [PMC free article] [PubMed] [Google Scholar]
- 10.Kenri T, Imamoto F, Kano Y. 1992. Construction and characterization of an Escherichia coli mutant deficient in the metY gene encoding tRNA(f2Met): either tRNA(f1Met) or tRNA(f2Met) is required for cell growth. Gene 114:109–114. 10.1016/0378-1119(92)90715-2 [DOI] [PubMed] [Google Scholar]
- 11.Kenri T, Kohno K, Goshima N, Imamoto F, Kano Y. 1991. Construction and characterization of an Escherichia coli mutant with a deletion of the metZ gene encoding tRNA (f1Met). Gene 103:31–36. 10.1016/0378-1119(91)90387-Q [DOI] [PubMed] [Google Scholar]
- 12.Edwards JS, Palsson BO. 2000. The Escherichia coli MG1655 in silico metabolic genotype: its definition, characteristics, and capabilities. Proc. Natl. Acad. Sci. U. S. A. 97:5528–5533. 10.1073/pnas.97.10.5528 [DOI] [PMC free article] [PubMed] [Google Scholar]
- 13.Press WH, Teukolsky SA, Vetterling WT, Flannery BP. 1992. Numerical recipes in Fortran. Cambridge University Press, New York, NY [Google Scholar]
- 14.Das G, Dineshkumar TK, Thanedar S, Varshney U. 2005. Acquisition of a stable mutation in metY allows efficient initiation from an amber codon in Escherichia coli. Microbiology 151:1741–1750. 10.1099/mic.0.27915-0 [DOI] [PubMed] [Google Scholar]
- 15.Liu M, Durfee T, Cabrera JE, Zhao K, Jin DJ, Blattner FR. 2005. Global transcriptional programs reveal a carbon source foraging strategy by Escherichia coli. J. Biol. Chem. 280:15921–15927. 10.1074/jbc.M414050200 [DOI] [PubMed] [Google Scholar]
- 16.Samhita L, Shetty S, Varshney U. 2012. Unconventional initiator tRNAs sustain Escherichia coli. Proc. Natl. Acad. Sci. U. S. A. 109:13058–13063. 10.1073/pnas.1207868109 [DOI] [PMC free article] [PubMed] [Google Scholar]
- 17.Nilsson AI, Zorzet A, Kanth A, Dahlstrom S, Berg OG, Andersson DI. 2006. Reducing the fitness cost of antibiotic resistance by amplification of initiator tRNA genes. Proc. Natl. Acad. Sci. U. S. A. 103:6976–6981. 10.1073/pnas.0602171103 [DOI] [PMC free article] [PubMed] [Google Scholar]
- 18.Low B. 1968. Formation of merodiploids in matings with a class of Rec- recipient strains of Escherichia coli K12. Proc. Natl. Acad. Sci. U. S. A. 60:160–167. 10.1073/pnas.60.1.160 [DOI] [PMC free article] [PubMed] [Google Scholar]
- 19.Brenner S, Beckwith JR. 1965. Ochre mutants: a new class of suppressible nonsense mutants. J. Mol. Biol. 13:629–637. 10.1016/S0022-2836(65)80131-0 [DOI] [Google Scholar]
- 20.Fiil N, Friesen JD. 1968. Isolation of “relaxed” mutants of Escherichia coli. J. Bacteriol. 95:729–731 [DOI] [PMC free article] [PubMed] [Google Scholar]
- 21.Bachmann BJ. 1972. Pedigrees of some mutant strains of Escherichia coli K-12. Bacteriol. Rev. 36:525–557 [DOI] [PMC free article] [PubMed] [Google Scholar]
- 22.Varshney U, Raj Bhandary UL. 1990. Initiation of protein synthesis from a termination codon. Proc. Natl. Acad. Sci. U. S. A. 87:1586–1590. 10.1073/pnas.87.4.1586 [DOI] [PMC free article] [PubMed] [Google Scholar]
Associated Data
This section collects any data citations, data availability statements, or supplementary materials included in this article.