

Abstract
Attention–deficit hyperactivity disorder (ADHD) is a heterogeneous psychiatric disorder affecting 5-10% of children. One of the suggested mechanisms underlying the pathophysiology of ADHD is insufficient energy supply to neurons. Here, we investigated the role of omega 3 fatty acids in altering neural energy metabolism and behavior of spontaneously hypertensive rats (SHR), which is an animal model of ADHD. To this end, we employed Proton Magnetic Resonance Spectroscopy (1H MRS) to evaluate changes in brain neurochemistry in the SHR following consumption of one of three experimental diets (starting PND 21): Fish Oil Enriched (FOE), Regular (RD) and Animal Fat Enriched (AFE) diet. Behavioral tests were performed to evaluate differences in locomotor activity and risk-taking behavior (starting PND 44). Comparison of frontal lobe metabolites showed that increased amounts of omega 3 fatty acids decreased total Creatine levels (tCr), but did not change glutamate (Glu), total N-acetylaspartate (tNAA), Lactate (Lac), Choline (Cho) or Inositol (Ino) levels. Although behavior was not significantly affected by different diets, significant correlations were observed between brain metabolites and behavior in the open field and elevated plus maze. SHR with higher levels of brain tCr and Glu exhibited greater hyperactivity in a familiar environment. On the other hand, risk-taking exploration of the elevated plus maze's open arms correlated negatively with forebrain tNAA and Lac levels. These findings support the possible alteration in energy metabolites in ADHD, correlating with hyperactivity in the animal model. The data also suggest that omega 3 fatty acids alter brain energy and phospholipid metabolism.
Introduction
Attention–deficit hyperactivity disorder (ADHD) is a heterogeneous psychiatric disorder characterized by three core symptoms, namely inattention, hyperactivity and impulsivity. It affects approximately 5%-10% of children worldwide [1] with an onset in childhood and can persist into adulthood. ADHD can result in impairments in social relations, academic performance and execution of daily activities. In some cases it is accompanied by learning disabilities, anxiety, conduct disorder and mood disorders [1].
Although the pathophysiology of ADHD remains unclear [2], several factors have been implicated in its etiology. One hypothesis suggests that ADHD is the consequence of neural energy dysregulation, due to a malfunction in the astrocyte/neuron lactate shuttle leading to reduced availability of lactate (Lac). The immediate effect of such a deficit is that during tasks that demand rapid, sustained neuronal firing, neurons may lack the energetic resources to maintain a rapid, precisely-timed, firing pace. The long-term consequence can be developmental impairments in myelination of axons due to decreases in Lac levels influencing oligodendrocyte synthesis of fatty acids and myelin [3, 4].
Other studies have implicated glutamate (Glu), an excitatory neurotransmitter, in the pathophysiology of ADHD, possibly due to its interaction with dopamine and norepinephrine [5] and/or its link to glycolysis and the astrocyte/neuron lactate shuttle [6]. In addition, several neuroimaging studies conducted in human populations with ADHD have utilized Proton Magnetic Resonance Spectroscopy (1H MRS), which is a non-invasive method to quantify brain metabolites including Glu, and showed higher Glutamate+Glutamine (Glx) to total creatine (tCr) ratio (Glx/tCr) and Glu/tCr ratio in the prefrontal cortex and striatum, and lower Glx to inositol (Ino) ratio (Glx/Ino) in the anterior cingulate cortex (ACC) compared to healthy controls [7-9].
Yet another factor that has been implicated in the pathophysiology of ADHD is diet. Currently in western society, we consume a great quantity of highly processed foods, rich in sugar, sodium and saturated fat and low in omega 3 fatty acids, starting from a very early age. The “Western diet” has been implicated in increased hyperactivity, as well as increased odds of having ADHD [10, 11]. Fatty acids that are often low in the Western diet are essential for brain development. Deficits in omega 3 fatty acids have been linked to different health and neurodevelopmental problems including ADHD, and a deficiency in omega 3 fatty acids produces symptoms such as a lack of attention or hyperactivity. Indeed, children with ADHD have been found to have reduced red blood cell omega 3 fatty acids compared to typically developing children [12-15]. Deficits in dietary omega 3 fatty acid have also been linked to alterations in glutamatergic and serotoninergic neurotransmission, as well as mesocortical and mesolimbic dopaminergic system dysfunction [16, 17]. Furthermore, animal studies have shown that dopamine neurotransmission is also affected in animals with diets deficient in omega 3 fatty acids or offspring of animals deficient in omega 3 fatty acids, with an important decreases in dopaminergic transmission in the prefrontal cortex consistent with the findings in ADHD [17, 18].
Since the pathophysiology of ADHD remains unknown and many families refuse classical psychopharmacological treatment with psychostimulants for their children, we set out to explore the role of omega 3 fatty acids in an animal model of ADHD to determine whether dietary management may hold potential treatment benefits [19]. In this study, we hypothesized that feeding a diet supplemented with omega 3 fatty acids, with an increased omega 3 to omega 6 fatty acid ratio, would improve energy metabolism and thereby impact on monoaminergic and glutamatergic systems and improve myelination.
To perform these studies, we utilized an animal model of ADHD, the spontaneously hypertensive rat (SHR), which presents with the behavioral characteristics of inattention, impulsivity and hyperactivity [20, 21]. Although this model has some weaknesses, such as the incoherence of results in response to Methylphenidate [22, 23], no animal model can fully mimic a human psychiatric disorder. The SHR animal model meets many of the criteria necessary for consideration as an adequate animal model of ADHD [24, 25]. Additionally, it has been shown that SHR have less Polyunsaturated Fatty Acids (PUFA), specifically Docosahexaenoic Acid (DHA), in brain membrane, when compared to the control strain Wistar Kyoto Rats (WKY) [26].
To test our hypothesis, we applied 1H MRS techniques to assess the neurochemistry, through measurement of total Cr and Glu levels within the frontal cortex and behavioral alterations (hyperactivity and risk-taking behavior) in the SHR animal model fed a diet supplemented with fish oil and rich in omega 3 fatty acids (FOE). We focused on the frontal cortex due to its involvement in the pathophysiology of ADHD [27-29]. According to our hypothesis, we expected to see changes in total Cr as the main metabolite implicated in energy metabolism as well as in Glu due to its role in stimulating glycolysis and the astrocyte/neuron lactate shuttle [6]. We expected that these changes would be in agreement with those observed in human studies. To the best of our knowledge, there has been no MRS study investigating neurochemical changes in the brain of the SHR animal model related to diet. As secondary findings, we expected to uncover changes in N-acetylaspartate (NAA) and choline compounds (Cho) levels as markers of improved myelination and in lactate (Lac) levels as a result of increased availability and more efficient neurotransmission due to the FOE diet. Lastly, we expected to see an improvement in the behavior - that is decreased hyperactivity - in the group fed a diet supplemented with omega 3 fatty acids.
Methods
Animal Preparation
Male SHR (n=35), weighing 25-35 g (post natal day, PND, 21), were obtained from Harlan Laboratories. They were housed in pairs in Plexiglas cages in an environment controlled for temperature (22-24°C) and humidity, with a reversed 12 hour light/dark schedule (lights off at 09:00 and on at 21:00). Food and water were provided ad libitum. The rats were randomly divided into three groups upon arrival and each group was fed with one of three different diets from their day of arrival to the completion of the experiments: Fish Oil Enriched Diet, (FOE, n=12); Regular Diet, (Prolab IsoPro RMH 3000) (RD, n=11); Animal Fat Enriched Diet, (AFE, n=12). The three test diets were provided by TestDiet and LabDiet, FOE and AFE were custom-made diets whereas RD was a typical laboratory diet. Caloric distribution was calculated based on the diet formulation. All three diets were analyzed for fatty acids via gas chromatography (Table 1) at the Diagnostic Center for Population and Animal Health, Michigan State University (East Lansing, MI). All the experiments were done during the day, which was night time for these animals, i.e. their active time.
Table 1.
Caloric distribution and fatty acid composition of the three diets.
| 5% Fish Oil Enriched (FOE) | Regular Diet (RD) | 5% Animal Fat Enriched (AFE) | |
|---|---|---|---|
| Calories provided by | |||
| Energy (Kcal/g) | 3.62 | 3.46 | 3.62 |
| Protein | 24.6% | 26% | 24.6% |
| Fat | 20.7% | 14% | 20.7% |
| Carbohydrates | 54.7% | 60% | 54.7% |
| Fatty acids (% of fat) | |||
| Omega 3 Total | 16.71% | 2.77% | 1.56% |
| Docosahexaenoic Acid (DHA) | 6.67% | 1.03% | 0.53% |
| Eicosapentaenoic Acid (EPA) | 8.33% | 1.17% | 0.75% |
| Docosapentaenoic Acid (DPA) | 1.59% | 0.27% | 0.21% |
| Omega 6 Total | 24.59% | 38.01% | 33.01% |
| Linoleic Acid | 23.30% | 37.16% | 30.85% |
| Arachidonic Acid | 0.73% | 0.35% | 0.38% |
| Ratio n6:n3 | 1.47:1 | 31.65:1 | 21.22:1 |
Rats were weighed on PND 58. All rats were acquired and cared for in accordance with the guidelines published in the NIH Guide for the Care and Use of Laboratory Animals. This study was approved by IACUC Committee of the University of Massachusetts Medical School.
Imaging Data Acquisition and Analysis
All imaging experiments were performed using a 4.7T/40cm horizontal magnet (Oxford, UK) equipped with 450 mT/m magnetic field gradients and interfaced with a Biospec Bruker console (Bruker, Germany). A 1H radiofrequency (RF) coil configuration (Insight NeuroImaging Systems, Worcester, MA) with 12 cm inner diameter was used. Throughout the imaging experiment, rats were anesthetized with isoflurane (1-1.5%) delivered through a nose cone and custom-fitted with a head restrainer containing a built-in saddle coil. The body temperature of the animal was monitored and maintained at 37°C with a feedback controlled heating pad. The imaging sessions took place at least 72 hours after the completion of the final behavioral experiment (PND 63-65).
For each imaging session, anatomical images were acquired using a multi-slice fast spin-echo sequence (RARE) (TR: 3000 ms, TE: 48 ms, RARE factor: 8, matrix size: 256 × 256, FOV: 3.2 cm × 3.2 cm, slice number: 18, slice thickness: 1 mm). For the Proton Magnetic Resonance Spectroscopy (1H MRS) data acquisition was performed using single voxel Point-REsolved Spectroscopy Sequence (PRESS) (TR: 2500 ms, TE: 20 ms, Naverage: 256) with VAPOR for water suppression, following shimming using the FASTMAP sequence. The voxel (4 mm × 4 mm × 4 mm) was placed at the frontal cortex of each animal using high-resolution anatomical images (Fig. 1a). PRESS was run with exactly the same voxel placement and parameters except for water suppression was off and the Naverage was set to 16.
Fig. 1.
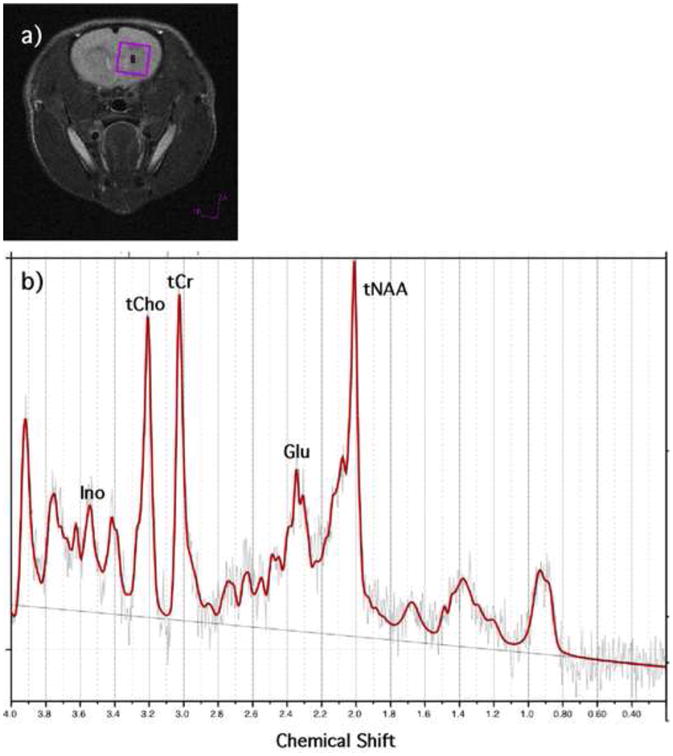
a) Representative voxel placement for PRESS sequence. b) Representative 1H MRS spectrum (TR: 2500 ms, TE: 20 ms, Naverage: 256).
The proton spectra were fit using LCModel (Version 6.3.0). LCModel analyzes in vivo proton spectrum as a linear combination of model in vitro spectra from individual metabolite solutions [30, 31]. LCModel has a built-in (simulated) radial basis sets for the PRESS sequence we are using. LCModel produces absolute fits (for L-Alanine (Ala), Aspartate (Asp), Creatine (Cr), PhosphoCreatine (PCr), GABA (γ-Aminobutyric acid), Glucose (Glc), Glutamine (Gln), Glutamate (Glu), Glycerophosphocholine (GPC), PhosphoCholine (PCh), Glutathione (GSH), Inositol (Ino), L-Lactate (Lac), N-Acetylaspartate (NAA), N-Acetylaspartylglutamate (NAAG), scyllo-Inositol (Scyllo), Taurine (Tau), total Choline (tCh), total N-Acetylaspartate (tNAA), total Creatine (tCr), Glutamate and Glutamine (Glx), lipids and macromolecules), metabolite quantifications (in Institutional Units), and percent standard deviation of the estimated concentration of each metabolite (CRLB) as a measure of the reliability of the fit. The spectral inclusion criteria (CRLB) were total Creatine (tCr), Glutamate (Glu), total N-acetyl aspartate (tNAA), and total Choline (tCho) less than 15% and Inositol (Ino) less than 25%. Fig. 1b demonstrates a sample fitted spectrum. In addition, previous work has shown that omega 3 fatty acids alter the fluidity of cell membranes resulting in increases in T2 [31]. To account for the possible T2 relaxation effect, the absolute metabolite quantities were corrected by a factor of 1/fwhm (for each individual fit estimated by LCModel using the unsuppressed water peak). Data from two rats (one from FOE and another one from RD) were excluded because their T2 values were more than 2 standard deviations from the mean for their groups.
Behavioral Experiments
Open Field
Locomotor activity was measured using the open field test. The apparatus consisted of a black Plexiglas open-field box (100 cm × 100 cm × 40 cm). Rats were placed within the box for 30 min and were allowed to explore freely while their motion was video-tracked. Rats were habituated by introducing them to the open field starting at PND 23 and PND 24, then at PND 38 to 42 for five days. At PND 55, they were reintroduced to the open field for five consecutive days. Only the last day was considered a testing day; this method was chosen since children with ADHD showed more hyperactivity in familiar environments compared to a novel environments [32]. Moreover, previous studies showed that test animals, habituated to testing apparatus, behave similarly to humans [23, 33]. Observer 5.0 for Windows software (Noldus Information Technology, Waginingen, Netherlands) was utilized to analyze parameters such as total distance travelled and time spent in certain regions of the open field. For our behavioral data analysis, the total arena as well as a thigmotaxis zone, a region between the wall of the arena to 10 cm off the wall was recorded. In addition, the experimental groups were randomized and the arena was cleaned between animals.
Elevated Plus Maze
We measured risk-taking behavior using the elevated plus maze test [34-39]. Each rat was placed in the center of a raised plus-shaped maze with two opposite arms enclosed with walls and the other two arms exposed. The animal was allowed to explore freely for 5 min, during which time its movement was video-recorded. The rats were tested on the elevated plus maze test at PND 44. Quantification of the time spent in each arm of the maze was assessed.
Statistical Analysis
Descriptive analysis followed by the D'Agostino & Pearson omnibus normality test was performed to ensure normal distribution of the data. For the metabolite concentrations, we performed an outlier analysis and excluded the data that were more than 2 standard deviations from the mean. One-way ANOVA (with covariant of weight at PND 58) were performed to compare the behavioral measures as well as the brain metabolite levels across the three animal groups fed with different diets. Co-varying by weight was necessary due to the effect of the animal's weight on the coil loading, and this effect was needed to be taken into account for “absolute quantification”. Pearson correlation coefficients were used to investigate the relationship between the brain metabolite levels and the behavioral measures. All statistical analyses were performed using SPSS 20 software packages. All data are presented as mean ± standard error. A p value of less than 0.05 was considered significant.
Results
Diet Effect on Weight
There was no significant effect of the diet on the weight of the rats in the three groups (Table 2).
Table 2.
Average weights (± standard error) of the rats at PND58.
| FOE (N = 10) | RD (N = 9) | AFE (N = 12) | |
|---|---|---|---|
| Weight (g) | 212.7 ± 4.17 | 217.0 ± 4.77 | 216.7 ± 2.06 |
Imaging Experiments
One-way ANOVA revealed that tCr levels were significantly different among the three groups of rats receiving different diets (F(2,27) = 3.58; p < 0.042, Table 3). Rats fed the FOE diet with the highest omega 3 content had the lowest levels of Cr. There was no difference among the other metabolite levels of rats fed with the different diets (Table 3).
Table 3. Average concentrations (± standard error) of selected metabolites as determined by 1H MRS in frontal lobe of SHR fed three different diets (Institutional Units).
| FOE (N = 10) | RD (N = 9) | AFE (N = 12) | |
|---|---|---|---|
| tCr* | 7.59 ± 0.64 | 8.45 ± 0.26 | 9.22 ± 0.43 |
| Glu | 14.19 ± 1.19 | 15.72 ± 0.49 | 16.29 ± 0.80 |
| tNAA | 9.41 ± 0.70 | 10.77 ± 0.45 | 10.92 ± 0.55 |
| Ino | 4.24 ± 0.46 | 5.20 ± 0.16 | 5.28 ± 0.33 |
| tCho | 1.74 ± 0.12 | 1.89 ± 0.07 | 2.04 ± 0.14 |
| Lac | 3.13 ± 0.47 (N = 7) | 2.70 ± 0.41 (N=3) | 4.18 ± 0.63 (N = 9) |
Behavioral Experiments
Open Field
No differences were observed in behavioral measures such as total distance travelled, distance travelled in the thigmotaxis zone, and the total time spent within the different regions of the open field, between animals fed with different diets (Table 4).
Table 4.
Average measurements (± standard error) from the behavioral tests.
| FOE (N = 10) | RD (N = 9) | AFE (N = 12) | |
|---|---|---|---|
| Open Field Total distance (cm) | 13,356 ± 938 | 14,389 ± 780 | 13,938 ± 997 |
| Distance in the thigmotaxis zone (cm) | 9,471 ± 685 | 9,451 ± 725 | 9,163 ± 882 |
| Time in the thigmotaxis zone (sec) | 1,332 ± 76.58 | 1,230 ± 70.60 | 1,112± 94.81 |
| Elevated Plus Maze Time in the open arm (sec) | 21.90 ± 4.73 | 13.78 ± 4.03 | 13.83 ± 2.90 |
Elevated Plus Maze (EPM)
One-way ANOVA did not reveal significant differences in time spent in the open and closed arms of the elevated plus maze by the different groups of rats (Table 4).
Multi-modal Analysis
We tested for possible correlations between the brain metabolite levels obtained from 1H MRS spectra and the behavioral measurements in the open field and EPM to explore the potential link between brain neurochemistry and behavior.
We found that total distance travelled within the open field correlated positively with tCr (r=0.43, p<0.02, Fig. 2a), Glu (r=0.37, p<0.04, Fig. 2b), Ino (r=0.42, p<0.02, Fig. 2c), and tCho (r=0.45, p<0.01, Fig. 2d) levels. In addition, for the elevated plus maze test, the time in the open arms correlated negatively with tNAA (r=-0.44, p<0.01, Fig. 2e) and Lac (r=-0.72, p<0.001, Fig. 2f) levels.
Fig. 2.
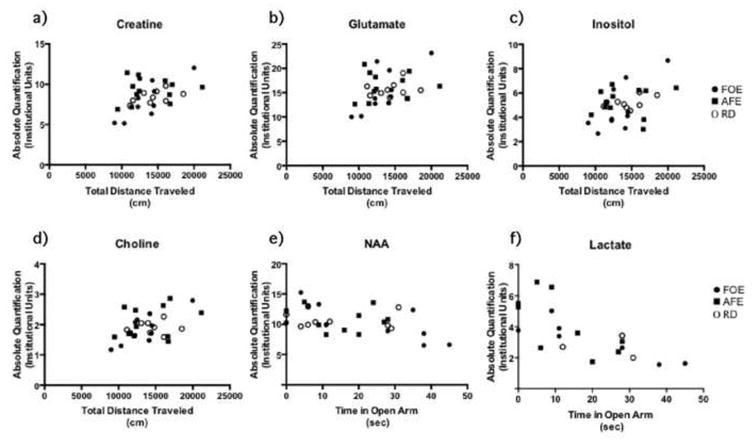
Frontal cortex brain metabolite levels plotted against the behavioral measurements, showing positive correlation with the total distance travelled in the open field and negative correlation with the time spent in the open arms of the EPM test. a) Frontal cortex total Cr levels correlated with the total distance travelled in open field test (r = 0.43, p < 0.02). b) Frontal cortex Glu levels correlated with the total distance travelled in the open field test (r = 0.37, p < 0.04). c) Frontal cortex Ino levels correlated with the total distance travelled in the open field test (r = 0.42, p < 0.02). d) Frontal cortex tCho levels correlated with the total distance travelled in the open field test (r = 0.45, p<0.01). e) Frontal cortex total NAA levels correlated negatively with time spent in the open arms of the EPM (r = -0.44, p < 0.01). f) Frontal cortex Lac levels correlated negatively with time spent in the open arms of the EPM (r = -0.72, p < 0.001). For this analysis, data from all the experimental groups were pooled.
Discussion
The present study provides new insights into the effect of a diet enriched with omega 3 fatty acids on the behavior and the neurochemistry of the SHR animal model of ADHD. The SHR received three food sources that differed mainly in their omega 3 fatty acid concentration and in the ratio of omega 6 to omega 3 fatty acids. The AFE diet was used, as it resembles the FOE diet in terms of calories from fat, thereby constituting another control group to investigate a possible bias in behavioral results due to an increased amount of fat. To the authors' knowledge, this is the first study that has utilized assessment of in vivo brain metabolites using 1H MRS in this animal model, exhibiting symptoms similar to ADHD.
Neural Energy Dysfunction
In agreement with our hypothesis that supplementing omega 3 fatty acids, and an adequate ratio of omega 3 to omega 6 would improve energy metabolism, a potential deficit in ADHD [3, 4], we demonstrated significant differences in total Cr concentrations among groups, with increased concentrations in the AFE group and reduced concentrations in the FOE group. The reported total Cr concentration is composed of Creatine and PhosphoCreatine - (PCr). Cr is a critical part of the energy supply mechanism within the cell. ATP and Cr are byproducts of a reaction between PCr and ADP which is mediated by cytokine kinase (in a reversible enzyme reaction) [40, 41]. If the cell has an increase in energy demand, more ATP will be needed and hence there will be a higher need for PCr. Unfortunately with 1H MRS we can only measure the total Cr and we are not able to distinguish between the contributions of Cr and PCr. However, it is possible that the increase in total Cr could be mediated by PCr in order to generate more ATP which can potentially counterbalance the energy deficit that may exist in ADHD [3, 4]. On the other hand, it also has been shown that Cr can be neuroprotective in neurons, minimizing the neurotoxicity that can be caused by an increase of Glu [42], thus we can speculate that the higher concentration of total Cr for RD and AFE groups could be a compensatory mechanism to counterbalance the neurotoxic effect of excess of Glutamate (Glu) observed in ADHD.
The decrease of Cr levels in the FOE group could be a consequence of one of two possible mechanisms: one mechanism could be mediated through monoaminergic transmission, which is dysregulated in the SHR. Joardar (2006) showed that administration of DHA to astrocytes in cell culture upregulated β-adrenergic transmission, and increased the glycogen cumulated in the astrocytes [43]. This extra glycogen can then be converted to Lac by glycogenolysis/glycolysis and subsequently will increase the availability of energetic resources, rendering the compensatory mechanism no longer necessary. This hypothetical framework is reinforced by observations from humans using 1H MRS, where Cr was decreased in ADHD patients after or during treatment with methylphenidate (MPH) [9, 44], which is known to influence the monoaminergic system [45]. It should be noted that our results were based on the frontal cortex, and some of the above listed findings were from other brain regions, such as the dorsolateral prefrontal cortex and cerebellum [44], and striatum [9]. Although, Carrey (2007) reported nonsignificant differences in Cr concentrations within prefrontal cortex after MPH treatment, Yang (2010) reported lower levels of Cr in ADHD subjects than in healthy controls [46]. A second possible explanation could be that in the group fed the FOE diet, there was improvement in myelination as a result of the increased availability of DHA, since it is known to play an important role in myelination in early life [47]. One would speculate that myelination in ADHD will be altered due to impairment of the energy supply to the oligodendrocytes [3], so an improvement in myelination will lead to better and more efficient neurotransmission. Such an increase in efficiency would translate into a more proficient use of resources leading to a restoration of the energetic balance and thereby rendering the compensatory mechanism no longer necessary.
Role of Glutamate in Neural Energy Dysfunction
We also observed changes in Glu concentrations with the different diets; although our results did not reach statistically significant levels, Glu levels were reduced in the FOE group. Deficit in ATP (necessary to restore the gradients) could disturb the normal function of the Na+/K+ pump, required for Glu uptake [48], resulting in an accumulation of extracellular Glu. To sustain glycolysis, Glu uptake is necessary for the activation of the astrocyte-neuron-lactate shuttle [6]. The decrease in Glu levels seen with our FOE diet could be explained by our diet affecting different targets, i.e. restoration of energy dysregulation, as explained above. In addition, PUFA have different functions in the central nervous system: they can have anti-inflammatory actions, modulate ion channels, influence genetic transcription, signal transduction [47, 49], and the fluidity of membranes, since the functional activity of the Na+/K+ ATPase is influenced by the fatty acid composition of the membrane [50]. Indeed any one of these mechanisms could be implicated in Glu uptake regulation. Altogether, our results are in agreement with another recent study with the SHR animal model fed a diet enriched in omega 3 fatty acids, that revealed decreased levels of Glu in the striatum (measured using HPLC), coupled with decreased spontaneous locomotion [51]. Furthermore, our results are also in agreement with the findings in humans, showing an increase in Glu/Cr ratio and Glx/Cr ratio in an ADHD population compared to healthy controls [7, 8, 46, 52]. Other reports demonstrated a decreased Glu to Cr ratio after treatment with MPH [9, 53, 54].
Relationship between Brain Metabolites and Behavior
Along with MRS measures we also performed behavioral experiments, to investigate the locomotor activity and levels of risk taking for all groups. The locomotor measurements, within a familiar environment did not reveal any significant differences among the experimental groups fed different diets. However, our results show strong correlation between the total distance traveled and the brain Cr and Glu levels. The rats with higher levels of brain Cr and Glu exhibited more hyperlocomotion in a familiar environment. This finding supports the hypothesis and observation that there is an alteration in Glu levels and possibly energy metabolism related to hyperactivity. Moreover, the data also show a positive correlation between the brain Ino and tCho levels and distance travelled in the open field. tCho is the precursor of Acetylcholine and a marker of membrane turnover, the major contributors to the tCho peak are Phosphocholine, Glycerophosphocoline and free Choline. Inositol participates in phospholipid metabolism and is considered to be a glial marker [55, 56]. ADHD studies show a decrease in tCho compounds in ADHD children [44, 57], an increase in tCho [58] or altered phospholipid turnover [59]. The variability in these results can be accounted for by the different brain regions studied, methodologies, and the influence of medication. Studies of Ino also yielded disparate results such a decrease of Ino in ADHD [44, 57] or a decrease after pharmacological treatment [53]. Our results would support the latter, since increased hyperactivity was found to correlate with increased Ino. On the other hand, increased tCho and Ino have been observed in inflammatory processes such as gliosis which could lead to an alteration of astrocyte function [60]. Our results suggest that the correlation between the level of tCho and Ino and behavioral activity could be the consequence of an astroglyosis. Dysfunction in astrocytes can lead to a cascade of consequences which impact at several levels, i.e. energetic metabolism or monoaminergic transmission [61]. Inflammatory mechanisms have been proposed to be possible factors in ADHD [62, 63]; nonetheless it remains unclear. Although our results are not significant, it has been shown that PUFA can prevent inflammation in astrocytes [64].
In order to study risk taking behaviors, that is one feature of ADHD [65, 66], we measured thigmotaxis in the open field as well as the time spent in the open arm of the EPM test. Neither test yielded significant differences among experimental groups fed different diets. Nonetheless, when we correlated the risk taking measures with the brain metabolites, we found a significant negative correlation between time spent in the open arm and NAA and Lac levels. Rats that displayed increased exploratory activity had the lowest brain Lac levels, consistent with the hypothesis that ADHD-like behavior is a consequence of deficient Lac supply to neurons [67]. A long-term consequence of a deficiency in NAA and Lac can be developmental impairments in myelination of axons, since oligodendrocytes use NAA and Lac to synthesize myelin, which is also in agreement with the energy deficiency hypothesis of ADHD [67, 68].
Limitations
The major limitation of this study was that the animals started their special diets, enriched in animal fat or fish oil, after weaning, which may be late to induce large changes in neuroplasticity. Although based on the work from Morgan and colleagues [69], the time frame in our study may be sufficient to reflect brain metabolite changes; however, others [70] have shown that in animals born with depletion in omega 3 fatty acids, the effects could possibly be reversed with supplemental diet when the supplementation was given from birth, but when the diet was given starting at weaning, recovery was only partial [70]. The onset of feeding (at weaning) and the duration of the diet (almost 6 weeks) may account for the lack of significant behavioral differences. In addition, hypertension, which is an inherent characteristic of the utilized animal model, could be considered as a confounding factor, SHR animals start developing hypertension at about 6 weeks of age, and hypertension continues to increase gradually with age. Our data acquisition was started at PND 44 and was completed by 9 weeks of age, thus making hypertension not a relevant factor, for the scope of this study. Moreover, studies suggest that hypertension does not impact behavior or memory in young animals [21, 25, 71, 72].
Summary
Our study is an example of how non-invasive techniques, like 1H MRS, can be utilized to further validate animal models and to investigate treatment responses. These studies confirm the feasibility of employing animal models within a translational framework to explore underlying mechanism in psychiatric disorders.
In summary our study shows that a diet rich in omega 3 fatty acids produced changes in brain metabolites and phospholipids, which are in agreement with findings reported in the human literature after classic treatment. Furthermore we demonstrated a relationship between brain metabolites and behavior that reinforces the hypothesis of an energetic dysfunction in ADHD as well as providing evidence to support inflammation as a possible mechanism in the pathophysiology of ADHD.
Highlights.
Spontaneously hypertensive rats (SHR) are utilized as an animal model of ADHD.
Studied omega 3 fatty acids in altering neural energy metabolism / behavior in SHR.
The increase in omega 3 fatty acids associated with a reduction in Creatine levels.
Omega 3 fatty acids possibly altering brain energy and phospholipid metabolism.
Significant correlations were observed between brain metabolites and behavior.
Acknowledgments
Funding for this study was provided by NIMH (MH073998 – CMM), NIDA (DA025690 - JAK) and Swiss National Science Foundation (PBGEP3-134252 and PBGEP3-139835 to AALN). We thank Meghan Heffernan for her assistance during the behavioral tests.
Footnotes
Publisher's Disclaimer: This is a PDF file of an unedited manuscript that has been accepted for publication. As a service to our customers we are providing this early version of the manuscript. The manuscript will undergo copyediting, typesetting, and review of the resulting proof before it is published in its final citable form. Please note that during the production process errors may be discovered which could affect the content, and all legal disclaimers that apply to the journal pertain.
References
- 1.Biederman J, Faraone SV. Attention-deficit hyperactivity disorder. Lancet. 2005;366:237–48. doi: 10.1016/S0140-6736(05)66915-2. [DOI] [PubMed] [Google Scholar]
- 2.Curatolo P, Paloscia C, D'Agati E, Moavero R, Pasini A. The neurobiology of attention deficit/hyperactivity disorder. Eur J Paediatr Neurol. 2009;13:299–304. doi: 10.1016/j.ejpn.2008.06.003. [DOI] [PubMed] [Google Scholar]
- 3.Russell VA, Oades RD, Tannock R, Killeen PR, Auerbach JG, Johansen EB, et al. Response variability in Attention-Deficit/Hyperactivity Disorder: a neuronal and glial energetics hypothesis. Behav Brain Funct. 2006;2:30. doi: 10.1186/1744-9081-2-30. [DOI] [PMC free article] [PubMed] [Google Scholar]
- 4.Todd RD, Botteron KN. Is attention-deficit/hyperactivity disorder an energy deficiency syndrome? Biol Psychiatry. 2001;50:151–8. doi: 10.1016/s0006-3223(01)01173-8. [DOI] [PubMed] [Google Scholar]
- 5.Lesch KP, Merker S, Reif A, Novak M. Dances with black widow spiders: dysregulation of glutamate signalling enters centre stage in ADHD. Eur Neuropsychopharmacol. 2013;23:479–91. doi: 10.1016/j.euroneuro.2012.07.013. [DOI] [PubMed] [Google Scholar]
- 6.Pellerin L, Magistretti PJ. Glutamate uptake into astrocytes stimulates aerobic glycolysis: a mechanism coupling neuronal activity to glucose utilization. Proc Natl Acad Sci U S A. 1994;91:10625–9. doi: 10.1073/pnas.91.22.10625. [DOI] [PMC free article] [PubMed] [Google Scholar]
- 7.Macmaster F, Carrey N, Sparkes S, Kusumakar V. Proton spectroscopy in medication-free pediatric attention-deficit/hyperactivity disorder. Biol Psychiatry. 2003;53:184–7. doi: 10.1016/s0006-3223(02)01401-4. [DOI] [PubMed] [Google Scholar]
- 8.Courvoisie H, Hooper SR, Fine C, Kwock L, Castillo M. Neurometabolic functioning and neuropsychological correlates in children with ADHD-H: preliminary findings. J Neuropsychiatry Clin Neurosci. 2004;16:63–9. doi: 10.1176/jnp.16.1.63. [DOI] [PubMed] [Google Scholar]
- 9.Carrey NJ, MacMaster FP, Gaudet L, Schmidt MH. Striatal creatine and glutamate/glutamine in attention-deficit/hyperactivity disorder. J Child Adolesc Psychopharmacol. 2007;17:11–7. doi: 10.1089/cap.2006.0008. [DOI] [PubMed] [Google Scholar]
- 10.Wiles NJ, Northstone K, Emmett P, Lewis G. ‘Junk food’ diet and childhood behavioural problems: results from the ALSPAC cohort. Eur J Clin Nutr. 2009;63:491–8. doi: 10.1038/sj.ejcn.1602967. [DOI] [PMC free article] [PubMed] [Google Scholar]
- 11.Howard AL, Robinson M, Smith GJ, Ambrosini GL, Piek JP, Oddy WH. ADHD is associated with a “Western” dietary pattern in adolescents. J Atten Disord. 2011;15:403–11. doi: 10.1177/1087054710365990. [DOI] [PubMed] [Google Scholar]
- 12.McNamara RK, Carlson SE. Role of omega-3 fatty acids in brain development and function: potential implications for the pathogenesis and prevention of psychopathology. Prostaglandins Leukot Essent Fatty Acids. 2006;75:329–49. doi: 10.1016/j.plefa.2006.07.010. [DOI] [PubMed] [Google Scholar]
- 13.Antalis CJ, Stevens LJ, Campbell M, Pazdro R, Ericson K, Burgess JR. Omega-3 fatty acid status in attention-deficit/hyperactivity disorder. Prostaglandins Leukot Essent Fatty Acids. 2006;75:299–308. doi: 10.1016/j.plefa.2006.07.004. [DOI] [PubMed] [Google Scholar]
- 14.Richardson AJ, Puri BK. The potential role of fatty acids in attention- deficit/hyperactivity disorder. Prostaglandins Leukot Essent Fatty Acids. 2000;63:79–87. doi: 10.1054/plef.2000.0196. [DOI] [PubMed] [Google Scholar]
- 15.Colter AL, Cutler C, Meckling KA. Fatty acid status and behavioural symptoms of attention deficit hyperactivity disorder in adolescents: a case-control study. Nutr J. 2008;7:8. doi: 10.1186/1475-2891-7-8. [DOI] [PMC free article] [PubMed] [Google Scholar]
- 16.Borsonelo EC, Galduroz JC. The role of polyunsaturated fatty acids (PUFAs) in development, aging and substance abuse disorders: review and propositions. Prostaglandins Leukot Essent Fatty Acids. 2008;78:237–45. doi: 10.1016/j.plefa.2008.03.005. [DOI] [PubMed] [Google Scholar]
- 17.Chalon S. Omega-3 fatty acids and monoamine neurotransmission. Prostaglandins Leukot Essent Fatty Acids. 2006;75:259–69. doi: 10.1016/j.plefa.2006.07.005. [DOI] [PubMed] [Google Scholar]
- 18.Levant B, Radel JD, Carlson SE. Decreased brain docosahexaenoic acid during development alters dopamine-related behaviors in adult rats that are differentially affected by dietary remediation. Behav Brain Res. 2004;152:49–57. doi: 10.1016/j.bbr.2003.09.029. [DOI] [PubMed] [Google Scholar]
- 19.Bloch MH, Qawasmi A. Omega-3 Fatty Acid supplementation for the treatment of children with attention-deficit/hyperactivity disorder symptomatology: systematic review and meta-analysis. J Am Acad Child Adolesc Psychiatry. 2011;50:991–1000. doi: 10.1016/j.jaac.2011.06.008. [DOI] [PMC free article] [PubMed] [Google Scholar]
- 20.Sagvolden T, Johansen EB, Woien G, Walaas SI, Storm-Mathisen J, Bergersen LH, et al. The spontaneously hypertensive rat model of ADHD--the importance of selecting the appropriate reference strain. Neuropharmacology. 2009;57:619–26. doi: 10.1016/j.neuropharm.2009.08.004. [DOI] [PMC free article] [PubMed] [Google Scholar]
- 21.Russell VA. Overview of animal models of attention deficit hyperactivity disorder (ADHD) Curr Protoc Neurosci. 2011;Chapter 9 doi: 10.1002/0471142301.ns0935s54. Unit9 35. [DOI] [PubMed] [Google Scholar]
- 22.Russell VA. Reprint of “Neurobiology of animal models of attention-deficit hyperactivity disorder”. J Neurosci Methods. 2007;166:I–XIV. doi: 10.1016/j.jneumeth.2006.12.020. [DOI] [PubMed] [Google Scholar]
- 23.Wickens JR, Hyland BI, Tripp G. Animal models to guide clinical drug development in ADHD: Lost in translation? Br J Pharmacol. 2011 doi: 10.1111/j.1476-5381.2011.01412.x. [DOI] [PMC free article] [PubMed] [Google Scholar]
- 24.Sagvolden T, Russell VA, Aase H, Johansen EB, Farshbaf M. Rodent models of attention-deficit/hyperactivity disorder. Biol Psychiatry. 2005;57:1239–47. doi: 10.1016/j.biopsych.2005.02.002. [DOI] [PubMed] [Google Scholar]
- 25.Sontag TA, Tucha O, Walitza S, Lange KW. Animal models of attention deficit/hyperactivity disorder (ADHD): a critical review. Atten Defic Hyperact Disord. 2010;2:1–20. doi: 10.1007/s12402-010-0019-x. [DOI] [PubMed] [Google Scholar]
- 26.Wei JW, Yang LM, Sun SH, Chiang CL. Phospholipids and fatty acid profile of brain synaptosomal membrane from normotensive and hypertensive rats. Int J Biochem. 1987;19:1225–8. doi: 10.1016/0020-711x(87)90107-8. [DOI] [PubMed] [Google Scholar]
- 27.Liston C, Malter Cohen M, Teslovich T, Levenson D, Casey BJ. Atypical Prefrontal Connectivity in Attention-Deficit/Hyperactivity Disorder: Pathway to Disease or Pathological End Point? Biol Psychiatry. 2011 doi: 10.1016/j.biopsych.2011.03.022. [DOI] [PubMed] [Google Scholar]
- 28.Durston S, van Belle J, de Zeeuw P. Differentiating frontostriatal and fronto- cerebellar circuits in attention-deficit/hyperactivity disorder. Biol Psychiatry. 2011;69:1178–84. doi: 10.1016/j.biopsych.2010.07.037. [DOI] [PubMed] [Google Scholar]
- 29.Bush G. Cingulate, Frontal, and Parietal Cortical Dysfunction in Attention- Deficit/Hyperactivity Disorder. Biol Psychiatry. 2011 doi: 10.1016/j.biopsych.2011.01.022. [DOI] [PMC free article] [PubMed] [Google Scholar]
- 30.Provencher SW. Automatic quantitation of localized in vivo 1H spectra with LCModel. NMR Biomed. 2001;14:260–4. doi: 10.1002/nbm.698. [DOI] [PubMed] [Google Scholar]
- 31.Hirashima F, Parow AM, Stoll AL, Demopulos CM, Damico KE, Rohan ML, et al. Omega-3 fatty acid treatment and T(2) whole brain relaxation times in bipolar disorder. Am J Psychiatry. 2004;161:1922–4. doi: 10.1176/ajp.161.10.1922. [DOI] [PubMed] [Google Scholar]
- 32.Sleator EK, Ullmann RK. Can the physician diagnose hyperactivity in the office? Pediatrics. 1981;67:13–7. [PubMed] [Google Scholar]
- 33.Russell SJ, McVeigh J. Next generation challenges: an overview of Harm Reduction 2010, IHRA's 21st conference. Int J Drug Policy. 2011;22:82–6. doi: 10.1016/j.drugpo.2010.10.005. [DOI] [PubMed] [Google Scholar]
- 34.Cortese BM, Mitchell TR, Galloway MP, Prevost KE, Fang J, Moore GJ, et al. Region-specific alteration in brain glutamate: possible relationship to risk-taking behavior. Physiol Behav. 2010;99:445–50. doi: 10.1016/j.physbeh.2009.12.005. [DOI] [PMC free article] [PubMed] [Google Scholar]
- 35.Davis JF, Krause EG, Melhorn SJ, Sakai RR, Benoit SC. Dominant rats are natural risk takers and display increased motivation for food reward. Neuroscience. 2009;162:23–30. doi: 10.1016/j.neuroscience.2009.04.039. [DOI] [PubMed] [Google Scholar]
- 36.Lofgren M, Johansson IM, Meyerson B, Turkmen S, Backstrom T. Withdrawal effects from progesterone and estradiol relate to individual risk-taking and explorative behavior in female rats. Physiol Behav. 2009;96:91–7. doi: 10.1016/j.physbeh.2008.08.015. [DOI] [PubMed] [Google Scholar]
- 37.Mikics E, Barsy B, Barsvari B, Haller J. Behavioral specificity of non-genomic glucocorticoid effects in rats: effects on risk assessment in the elevated plus-maze and the open-field. Hormones and behavior. 2005;48:152–62. doi: 10.1016/j.yhbeh.2005.02.002. [DOI] [PubMed] [Google Scholar]
- 38.Langen B, Dost R. Comparison of SHR, WKY and Wistar rats in different behavioural animal models: effect of dopamine D1 and alpha2 agonists. Atten Defic Hyperact Disord. 2011;3:1–12. doi: 10.1007/s12402-010-0034-y. [DOI] [PubMed] [Google Scholar]
- 39.Howells FM, Bindewald L, Russell VA. Cross-fostering does not alter the neurochemistry or behavior of spontaneously hypertensive rats. Behav Brain Funct. 2009;5:24. doi: 10.1186/1744-9081-5-24. [DOI] [PMC free article] [PubMed] [Google Scholar]
- 40.Wyss M, Kaddurah-Daouk R. Creatine and creatinine metabolism. Physiol Rev. 2000;80:1107–213. doi: 10.1152/physrev.2000.80.3.1107. [DOI] [PubMed] [Google Scholar]
- 41.Wallimann T, Wyss M, Brdiczka D, Nicolay K, Eppenberger HM. Intracellular compartmentation, structure and function of creatine kinase isoenzymes in tissues with high and fluctuating energy demands: the ‘phosphocreatine circuit’ for cellular energy homeostasis. Biochem J. 1992;281(Pt 1):21–40. doi: 10.1042/bj2810021. [DOI] [PMC free article] [PubMed] [Google Scholar]
- 42.Brewer GJ, Wallimann TW. Protective effect of the energy precursor creatine against toxicity of glutamate and beta-amyloid in rat hippocampal neurons. J Neurochem. 2000;74:1968–78. doi: 10.1046/j.1471-4159.2000.0741968.x. [DOI] [PubMed] [Google Scholar]
- 43.Joardar A, Sen AK, Das S. Docosahexaenoic acid facilitates cell maturation and beta-adrenergic transmission in astrocytes. J Lipid Res. 2006;47:571–81. doi: 10.1194/jlr.M500415-JLR200. [DOI] [PubMed] [Google Scholar]
- 44.Soliva JC, Moreno A, Fauquet J, Bielsa A, Carmona S, Gispert JD, et al. Cerebellar neurometabolite abnormalities in pediatric attention/deficit hyperactivity disorder: a proton MR spectroscopic study. Neurosci Lett. 2010;470:60–4. doi: 10.1016/j.neulet.2009.12.056. [DOI] [PubMed] [Google Scholar]
- 45.Pliszka SR. The neuropsychopharmacology of attention-deficit/hyperactivity disorder. Biol Psychiatry. 2005;57:1385–90. doi: 10.1016/j.biopsych.2004.08.026. [DOI] [PubMed] [Google Scholar]
- 46.Yang P, Wu MT, Dung SS, Ko CW. Short-TE proton magnetic resonance spectroscopy investigation in adolescents with attention-deficit hyperactivity disorder. Psychiatry Res. 2010;181:199–203. doi: 10.1016/j.pscychresns.2009.10.001. [DOI] [PubMed] [Google Scholar]
- 47.Uauy R, Mena P, Rojas C. Essential fatty acids in early life: structural and functional role. Proc Nutr Soc. 2000;59:3–15. doi: 10.1017/s0029665100000021. [DOI] [PubMed] [Google Scholar]
- 48.Anderson CM, Swanson RA. Astrocyte glutamate transport: review of properties, regulation, and physiological functions. Glia. 2000;32:1–14. [PubMed] [Google Scholar]
- 49.Haag M. Essential fatty acids and the brain. Can J Psychiatry. 2003;48:195–203. doi: 10.1177/070674370304800308. [DOI] [PubMed] [Google Scholar]
- 50.Gerbi A, Zerouga M, Maixent JM, Debray M, Durand G, Bourre JM. Diet deficient in alpha-linolenic acid alters fatty acid composition and enzymatic properties of Na+, K+-ATPase isoenzymes of brain membranes in the adult rat. J Nutr Biochem. 1999;10:230–6. doi: 10.1016/s0955-2863(99)00002-9. [DOI] [PubMed] [Google Scholar]
- 51.Dervola KS, Roberg BA, Woien G, Bogen IL, Sandvik TH, Sagvolden T, et al. Marine Omicron-3 polyunsaturated fatty acids induce sex-specific changes in reinforcer-controlled behaviour and neurotransmitter metabolism in a spontaneously hypertensive rat model of ADHD. Behav Brain Funct. 2012;8:56. doi: 10.1186/1744-9081-8-56. [DOI] [PMC free article] [PubMed] [Google Scholar]
- 52.Moore CM, Biederman J, Wozniak J, Mick E, Aleardi M, Wardrop M, et al. Differences in brain chemistry in children and adolescents with attention deficit hyperactivity disorder with and without comorbid bipolar disorder: a proton magnetic resonance spectroscopy study. Am J Psychiatry. 2006;163:316–8. doi: 10.1176/appi.ajp.163.2.316. [DOI] [PMC free article] [PubMed] [Google Scholar]
- 53.Wiguna T, Guerrero AP, Wibisono S, Sastroasmoro S. Effect of 12-week administration of 20-mg long-acting methylphenidate on Glu/Cr, NAA/Cr, Cho/Cr, and mI/Cr ratios in the prefrontal cortices of school-age children in Indonesia: a study using 1H magnetic resonance spectroscopy (MRS) Clin Neuropharmacol. 2012;35:81–5. doi: 10.1097/WNF.0b013e3182452572. [DOI] [PubMed] [Google Scholar]
- 54.Carrey N, MacMaster FP, Fogel J, Sparkes S, Waschbusch D, Sullivan S, et al. Metabolite changes resulting from treatment in children with ADHD: a 1H-MRS study. Clin Neuropharmacol. 2003;26:218–21. doi: 10.1097/00002826-200307000-00013. [DOI] [PubMed] [Google Scholar]
- 55.Moore CM, Breeze JL, Gruber SA, Babb SM, Frederick BB, Villafuerte RA, et al. Choline, myo-inositol and mood in bipolar disorder: a proton magnetic resonance spectroscopic imaging study of the anterior cingulate cortex. Bipolar Disord. 2000;2:207–16. doi: 10.1034/j.1399-5618.2000.20302.x. [DOI] [PubMed] [Google Scholar]
- 56.Cecil KM. Proton magnetic resonance spectroscopy: technique for the neuroradiologist. Neuroimaging Clin N Am. 2013;23:381–92. doi: 10.1016/j.nic.2012.10.003. [DOI] [PMC free article] [PubMed] [Google Scholar]
- 57.Tafazoli S, O'Neill J, Bejjani A, Ly R, Salamon N, McCracken JT, et al. 1H MRSI of middle frontal gyrus in pediatric ADHD. J Psychiatr Res. 2013;47:505–12. doi: 10.1016/j.jpsychires.2012.11.011. [DOI] [PMC free article] [PubMed] [Google Scholar]
- 58.Jin Z, Zang YF, Zeng YW, Zhang L, Wang YF. Striatal neuronal loss or dysfunction and choline rise in children with attention-deficit hyperactivity disorder: a 1H- magnetic resonance spectroscopy study. Neurosci Lett. 2001;315:45–8. doi: 10.1016/s0304-3940(01)02315-1. [DOI] [PubMed] [Google Scholar]
- 59.Stanley JA, Kipp H, Greisenegger E, MacMaster FP, Panchalingam K, Pettegrew JW, et al. Regionally specific alterations in membrane phospholipids in children with ADHD: An in vivo 31P spectroscopy study. Psychiatry Res. 2006;148:217–21. doi: 10.1016/j.pscychresns.2006.08.003. [DOI] [PubMed] [Google Scholar]
- 60.Bertholdo D, Watcharakorn A, Castillo M. Brain proton magnetic resonance spectroscopy: introduction and overview. Neuroimaging Clin N Am. 2013;23:359–80. doi: 10.1016/j.nic.2012.10.002. [DOI] [PubMed] [Google Scholar]
- 61.Sofroniew MV, Vinters HV. Astrocytes: biology and pathology. Acta Neuropathol. 2010;119:7–35. doi: 10.1007/s00401-009-0619-8. [DOI] [PMC free article] [PubMed] [Google Scholar]
- 62.Donev R, Thome J. Inflammation: good or bad for ADHD? Atten Defic Hyperact Disord. 2010;2:257–66. doi: 10.1007/s12402-010-0038-7. [DOI] [PubMed] [Google Scholar]
- 63.Buske-Kirschbaum A, Schmitt J, Plessow F, Romanos M, Weidinger S, Roessner V. Psychoendocrine and psychoneuroimmunological mechanisms in the comorbidity of atopic eczema and attention deficit/hyperactivity disorder. Psychoneuroendocrinology. 2013;38:12–23. doi: 10.1016/j.psyneuen.2012.09.017. [DOI] [PubMed] [Google Scholar]
- 64.Gupta S, Knight AG, Keller JN, Bruce-Keller AJ. Saturated long-chain fatty acids activate inflammatory signaling in astrocytes. J Neurochem. 2012;120:1060–71. doi: 10.1111/j.1471-4159.2012.07660.x. [DOI] [PMC free article] [PubMed] [Google Scholar]
- 65.Ramos Olazagasti MA, Klein RG, Mannuzza S, Belsky ER, Hutchison JA, Lashua-Shriftman EC, et al. Does childhood attention-deficit/hyperactivity disorder predict risk-taking and medical illnesses in adulthood? J Am Acad Child Adolesc Psychiatry. 2013;52:153–62 e4. doi: 10.1016/j.jaac.2012.11.012. [DOI] [PMC free article] [PubMed] [Google Scholar]
- 66.Barkley RA, Fischer M, Smallish L, Fletcher K. Young adult outcome of hyperactive children: adaptive functioning in major life activities. J Am Acad Child Adolesc Psychiatry. 2006;45:192–202. doi: 10.1097/01.chi.0000189134.97436.e2. [DOI] [PubMed] [Google Scholar]
- 67.Killeen PR, Russell VA, Sergeant JA. A behavioral neuroenergetics theory of ADHD. Neurosci Biobehav Rev. 2013;37:625–57. doi: 10.1016/j.neubiorev.2013.02.011. [DOI] [PubMed] [Google Scholar]
- 68.Moffett JR, Ross B, Arun P, Madhavarao CN, Namboodiri AM. N-Acetylaspartate in the CNS: from neurodiagnostics to neurobiology. Prog Neurobiol. 2007;81:89–131. doi: 10.1016/j.pneurobio.2006.12.003. [DOI] [PMC free article] [PubMed] [Google Scholar]
- 69.Morgan JJ, Kleven GA, Tulbert CD, Olson J, Horita DA, Ronca AE. Longitudinal (1) H MRS of rat forebrain from infancy to adulthood reveals adolescence as a distinctive phase of neurometabolite development. NMR Biomed. 2013 doi: 10.1002/nbm.2913. [DOI] [PMC free article] [PubMed] [Google Scholar]
- 70.Kodas E, Vancassel S, Lejeune B, Guilloteau D, Chalon S. Reversibility of n-3 fatty acid deficiency-induced changes in dopaminergic neurotransmission in rats: critical role of developmental stage. J Lipid Res. 2002;43:1209–19. [PubMed] [Google Scholar]
- 71.Meneses A, Perez-Garcia G, Ponce-Lopez T, Tellez R, Gallegos-Cari A, Castillo C. Spontaneously hypertensive rat (SHR) as an animal model for ADHD: a short overview. Rev Neurosci. 2011 doi: 10.1515/RNS.2011.024. [DOI] [PubMed] [Google Scholar]
- 72.Tayebati SK, Tomassoni D, Amenta F. Spontaneously hypertensive rat as a model of vascular brain disorder: microanatomy, neurochemistry and behavior. J Neurol Sci. 2012;322:241–9. doi: 10.1016/j.jns.2012.05.047. [DOI] [PubMed] [Google Scholar]