

Abstract
The FTIR spectra for alkyl isocyanides (CNRs) change from a single νCN band centered at ~2175 cm−1 to two peaks at ~2075 and ~2125 cm−1 upon binding to sperm whale myoglobin (Mb). The low and high frequency peaks have been assigned to in and out conformations, respectively. In the in conformation, the ligand is pointing toward the protein interior, and the distal His64(E7) is in a closed position, donates a H-bond to the bound isocyano group, enhances back bonding, and lowers the C-N bond order. In the out conformation, the ligand side chain points toward solvent through a channel opened by outward rotation of His64. Loss of positive polarity near the binding site causes an increase in C-N bond order. Support for this interpretation is three-fold: (1) similar shifts to lower frequency occur for MbCO complexes when H-bond donation from His64(E7) occurs; (2) only one peak at ~2125 cm−1, indicative of an apolar environment, is observed for CNRs bound to H64A or H64L Mb mutants or to chelated protoheme in soap micelles; and (3) the fraction of in conformation based on FTIR spectra correlates strongly with the fraction of geminate recombination after nanosecond laser photolysis. The in alkyl side chain conformation causes the photodissociated ligand to be “stuck” in the distal pocket, promoting internal rebinding, whereas the out conformation inhibits geminate recombination because part of the ligand is already in an open E7 channel, poised for rapid escape.
Keywords: myoglobin, alkyl isocyanide, isonitrile, model heme, soap micelle, FTIR, infrared, vibrational spectroscopy, Fermi resonance, geminate recombination, iron coordination
Alkyl isocyanides (CNRs) were the first chemical probes of the size of the ligand binding pockets in hemoglobins (Hb) and myoglobins (Mb) (1, 2). These compounds are Lewis bases that form strong coordinate bonds to Fe(II) through the: C(−)≡N(+)-R isocyano group. They have a configurable organic (R) side chain and have been used for nearly 60 years in increasingly refined and varied biophysical studies to measure steric constraints within the binding pockets of wild type and mutant Mbs and Hbs.
Linus Pauling’s group measured the affinity of branched-chain alkyl isocyanides for Mb and Hb to establish that their heme groups are not solvent exposed, but rather are buried within the protein matrix (1, 2). Brunori and coworkers studied the effects of cooperativity and allosteric effectors on the reactivity and accessibility of the heme iron by varying the ligand size (3, 4). Evidence for a large open binding pocket in soybean leghemoglobin was provided by Stetzkowski et al. (5). Thirteen branched and straight-chain isocyanides were used by Olson and coworkers to create a free energy map of the protein constraints within the binding pockets of a wide variety of Mbs, Hbs, and cytochromes (6, 7). Over the subsequent ten years, the roles played by individual distal pocket amino acids in controlling ligand binding were explored using nanosecond and bimolecular rebinding measurements for series of isocyanides and Mb mutants (8–18). However, these studies did not account for the possibility of alternate conformations and rebinding reactions for the larger CNRs.
In the 1990s, Johnson, Smith, Phillips, and Olson (19, 20) determined multiple MbCNR and HbCNR crystal structures in an attempt to provide structural interpretations of the earlier ligand binding results. The structure of ethyl isocyanide (CNC2) bound to native Mb in P21 crystals at pH 5.6 provided evidence that the side chain of the distal histidine His64(E7) acted as a swinging gate to provide access for ligands to the binding pocket (21). Mb and HbCNC2 structures were used to explain the differing rates of NO-induced autooxidation by the oxygenated forms of these proteins (22).
Unexpectedly, the conformations of the larger isocyanides (CNC3 and CNC4) bound to Mb were markedly dependent on crystallographic conditions (23), and therefore their usefulness in explaining solution based measurements was limited. As a supplement to these kinetic and structural studies and in an effort to understand the complex X-ray crystallographic data, we tried to acquire FTIR spectra of n-butyl isocyanide (CNC4) bound to native Mb (Li, T. and Olson, J. S. unpublished). The absorbance of the bound C≡N stretching frequency (νCN) was weak, broad, and discouraging compared to the results that were concurrently being obtained for MbCO complexes (24, 25). However, in 2001, Lee et al. (26) observed well-resolved single peaks for CNC4 bound to P450cam and P450nor, which prompted us to repeat our experiments with Mb isocyanide complexes using newer Fourier transform IR instrumentation and an expanded series of ligands and mutant proteins.
The FTIR spectra for each MbCNR complex tested (CNC1-CNC6) contain at least two broad but resolvable νCN absorbances near 2075 cm−1 and 2125 cm−1, and their intensities are dependent on the CNR size. The peaks can be assigned to in and out conformations of the ligand side chain. The relative occupancies of these conformations appear to depend on a combination of distal pocket crowding, hydrogen bonding, and unfavorable hydrophobic interactions.
This observation of two interconverting bound CNR conformations in solution explains: (a) the originally puzzling X-ray crystallographic data of Johnson (19) and Smith (20) that is now presented in the second article of this series (23); (b) the dependence of ligand affinity on the length of the alkyl side chain (7); and (c) the dependence of the fraction of nanosecond geminate recombination on ligand size (27). Together, these results confirm that CNRs enter and exit the binding pocket by way of the His64(E7) channel and imply that the FTIR spectra of globin-bound CNRs may be used to report on the binding pocket size and the ease of opening of the distal histidine gate, as shown for Mb mutants in the third article of this series (28).
MATERIALS AND METHODS
Myoglobin samples
Wild-type recombinant Mb was expressed in E. coli and purified as described by Springer and Sligar (29) and modified by Carver et al. (18). Its sequence differs from the native protein by the addition of an N-terminal methionine to allow translation in E. coli and an originally incorrect D122N substitution. These amino acid changes do not significantly change the solution ligand binding kinetics for gaseous and CNR ligands (10) or FTIR spectral properties of MbCO (30).
Alkyl isocyanides, gases, and model heme
The alkyl isocyanides were synthesized by our group or by the Mark Hargrove’s group at Iowa State University using the methods of Casanova et al. (6, 31, 32), and their purity was assessed by NMR. [2H5]ethyl amine (Merck Sharp & Dohme, Canada; 98% 2H incorporation) was used to make the perdeuterated ethyl isocyanide (32). The CNRs were stored at −20 °C. Cylinders of O2, CO, and NO were purchased from Matheson Tri-gas (Parsippany, NJ) in ultra high purity form. The model heme protoheme mono-3-(1-imidazoyl) propylamide monomethyl ester (Hm) was prepared following the procedure of Traylor et al. (33, 34).
Suspensions of Hm in soap micelles were prepared by stirring overnight ~0.2 mg of Hm with 150 μl of 5% (w/v) sodium dodecyl sulfate (SDS) or trimethyl (tetradecyl)ammonium bromide (TMTA) in 100 mM sodium phosphate, 1 mM EDTA, pH 7.0 buffer. The suspension was then filtered and gave a final concentration of ~1 to 2 mM hemin, as assessed by diluting a small volume in an anaerobic 5% soap solution containing a few crystals of sodium dithionite and measuring the UV-Vis spectrum (ε=114 mM−1cm−1 at 430 nm (33)). HmCO samples were prepared by blowing 1 atm of CO over the hemin solutions and then reducing the sample anaerobically by the addition of ~10 mM sodium dithionite. The HmCNR samples were prepared by adding a sufficient volume of 20 mM CNR in the same phosphate buffer to an anaerobic Hm-soap suspension to make the CNR to Hm ratio 1:1. Larger ratios were used for the HmCNR titration studies. SDS and TMTA were purchased from Sigma-Aldrich (St. Louis MO, USA).
MbCNR Geminate Recombination Measurements
To prepare the photolysis samples, N2-equilibrated, 100 mM potassium phosphate, 1 mM EDTA, pH 7.0 buffer was added by syringe to N2-equilibrated, septum-stoppered, 1 mm path length laser cuvettes containing a few grains of sodium dithionite. Stock solutions of 1–2 mM Mb and 20 mM CNR were added to give final concentrations of 50–100 μM for heme and 100 to 1000 μM for the ligand. The Mb-CNR photolysis reaction was (a) initiated by a 7 ns pulse from a frequency-doubled YAG laser (YM600, Lumonics, Inc., Billerica, MA), (b) illuminated by a pulsed Xe arc lamp (model 03-102, Applied Photophysics, Inc, Leatherhead, UK), and (c) followed at 442 nm with a PMT with a 0.9 ns response time (R-1913, Hamamatsu, Japan). The PMT output was recorded with a digital Tektronix TDS3052 oscilloscope and transferred to a PC computer for analysis and fitting. A pulse/delay generator (model 555, Berkeley Nucleonics Corp., San Rafael, CA) was used to synchronize the laser, light pulser and oscilloscope triggers. The data used for fitting were an average of multiple time courses (~16–32) that were collected at 20–22 °C.
FTIR Measurements
The samples were prepared by adding the following solutions by syringe to a N2-purged 250 μl PCR tube fitted with a rubber septum: ~20 μl of 2–5 mM Mb or 1–2 mM Hm, and sufficient volumes of 20 mM CNR and 200 mM sodium dithionite (prepared in N2-bubbled buffer) to give a Hm:CNR:dithionite molar ratio of 1:1:5. A typical preparation involved adding 20 μl of 2 mM Mb, 2 μl of 20 mM CNR, and 1 μl of 200 mM dithionite. All reagent pH conditions were maintained using 100 mM potassium phosphate, 1mM EDTA buffer. After gentle vortexing, the 20–30 μl solution was quickly transferred by pipet and sandwiched between the CaF2 windows of a BioCell IR cell (BioTools, Inc., Canada) with a 40 μm well. The FTIR spectra were collected in a N2-purged Nicolet Nexus 470 FTIR spectrometer with a liquid-N2-cooled mercury cadmium telluride (MCT) detector and an 1800 cm−1 to 2400 cm−1 band pass filter in the light path. The sample preparations and data collection were carried out at room temperature (20–22 °C). The final Fourier transformed spectra were produced from 64 averaged interferograms and have at a 1 or 2 cm−1 resolution. Residual water vapor peaks were subtracted from the spectra using a control spectrum taken with buffer alone. Baseline corrections were carried out in Microsoft Excel by fitting to and subtracting from the raw baseline a 5th power polynomial.
RESULTS
IR Spectra of Alkyl Isocyanides Bound to Mb
There are two broad overlapping peaks in the FTIR spectra of myoglobin-alkyl isocyanide (MbCNR) complexes, typically with widths at half height of 35–55 cm−1 (Figs. 1 and 2). Methyl isocyanide (CNC1) bound to myoglobin has absorbance maxima at 2083 and 2139 cm−1, with a small high frequency shoulder at 2156 cm−1. The peaks for bound ethyl isocyanide (CNC2) are red shifted relative to those of methyl isocyanide and occur at 2065 and 2106 cm−1. For the longer straight-chain isocyanides (CNC3 through CNC6), the lower wavenumber absorbance is consistently at ~2080 cm−1, but the higher wavenumber peak increases with ligand chain length from 2111 cm−1 for n-propyl isocyanide to 2137 cm−1 for n-hexyl isocyanide (Table 1; Figs. 1 and 4A).
Figure 1.

Dependence of the isocyano stretching frequency, νCN in cm−1, on solvent environment, chelation to a model heme, and binding to wt Mb. The solid black line spectra represent CNRs bound to wt sperm whale Mb. The two absorbance bands in the MbCNR spectra are interpreted to be structures V and VI in the right panel. The black dashed spectra represent CNRs bound to protoheme mono-3-(1-imidazoyl) propylamide mono-methyl ester (Hm) solubilized in trimethyl(tetradecyl)ammonium bromide (TMTA) micelles. The light and dark gray spectra represent free CNRs and n-butyl nitrile in 100 mM potassium phosphate, 1 mM EDTA, pH 7 aqueous buffer and in chloroform (CHCl3), respectively. Splitting of the νCN peak for free and Hm-bound CNC2 is due to Fermi resonance (see Supplement). The FTIR spectra are normalized by total area, except for the wt Mb spectra, which are shown at 2x area to aid in visual comparisons. The spectra were collected at room temperature (22–25°C). CNtC4 refers to tert-butyl isocyanide and NCC4 to n-butyl nitrile.
Figure 2.
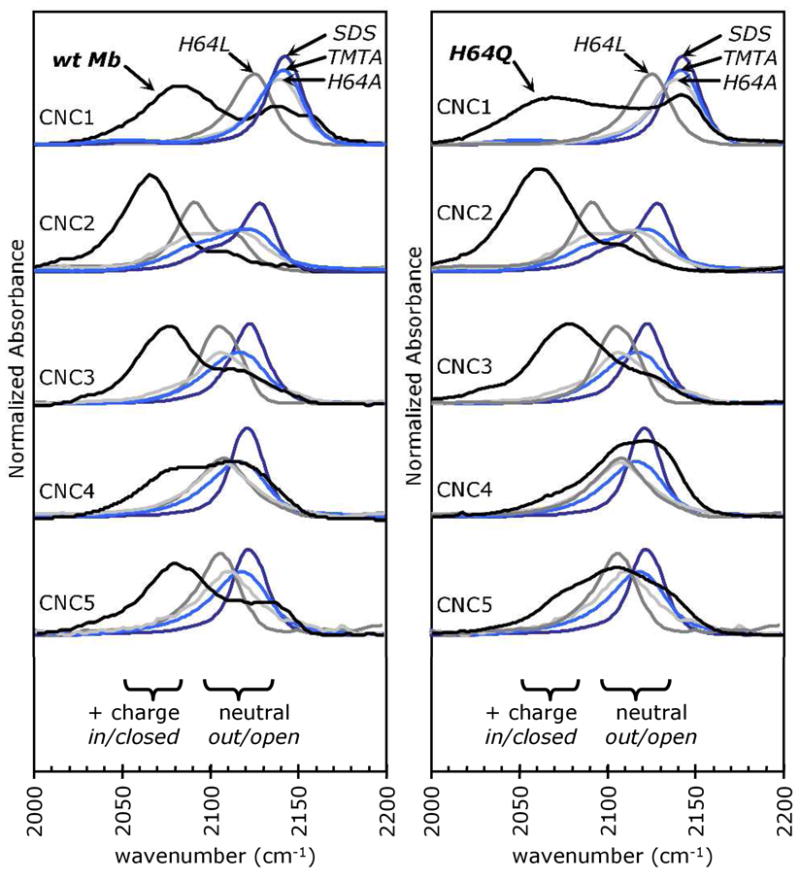
The high frequency νCN peak in the MbCNR spectra is due to a population of the bound ligands in an apolar environment. The black lines represent FTIR spectra for the homologous series methyl isocyanide (CNC1) through pentyl isocyanide (CNC5) bound to wt Mb (left panel) and H64Q Mb (right panel). These spectra were compared to those of CNRs complexed to H64A (light gray) and H64L (dark gray) Mb and to Hm in SDS (dark blue) and TMTA (light blue) micelles, all of which have apolar binding environments. Note that splitting of the νCN peak for CNC2 bound to H64A Mb, H64L Mb, and Hm is due to Fermi resonance (see Supplement). The wt and H64Q Mb spectra are shown at 2x their normalized area to allow better comparisons with the spectra containing narrow single peaks.
Table 1.
| CNR/conditions | ν1 (cm−1) | ν2 (cm−1) | ν3 (cm−1) | ν4 (cm−1) | ν5 (cm−1) |
|---|---|---|---|---|---|
| phosphate bufferb | |||||
| NCC4 | 2254 | ||||
| CNC1 | 2187 | ||||
| CNC2 | 2168/2185c | ||||
| CNC3 | 2173 | ||||
| CNC4 | 2173 | ||||
| CNC5 | 2173 | ||||
| CNtC4 | 2158 | ||||
| chloroform | |||||
| NCC4 | 2252 | ||||
| CNC1 | 2170 | ||||
| CNC2 | 2156/2179c | ||||
| CNC3 | 2157 | ||||
| CNC4 | 2154 | ||||
| Hm in 5% TMTA micelles | |||||
| CNC1 | 2142 | ||||
| CNC2 | 2094/2120c | ||||
| CNC3 | 2117 | ||||
| CNC4 | 2117 | ||||
| CNC5 | 2118 | ||||
| Hm in 5% SDS micelles | |||||
| CNC1 | 2143 | ||||
| CNC2 | 2100/2128c | ||||
| CNC3 | 2122 | ||||
| CNC4 | 2121 | ||||
| CNC5 | 2122 | ||||
| H64A Mb | |||||
| CNC1 | 2140 | ||||
| CNC2 | 2092/2114c | ||||
| CNC3 | 2106 | ||||
| CNC4 | 2108 | ||||
| CNC5 | 2112 | ||||
| H64L Mb | |||||
| CNC1 | 2125 | ||||
| CNC2 | 2090 | ||||
| CNC3 | 2114 | ||||
| CNC4 | 2106 | ||||
| CNC5 | 2108 | ||||
| wt Mb | |||||
| CNC1 | 2083 | 2139d | |||
| CNC2 | 2065 | 2106 | |||
| CNC3 | 2077 | 2112 | |||
| CNC4 | 2083 | 2113 | |||
| CNC5 | 2081 | 2131e | |||
| CNC6 | 2078 | 2137 | |||
| H64Q Mb | |||||
| CNC1 | 2068 | 2142 | |||
| CNC2 | 2061 | 2108 | |||
| CNC3 | 2079 | 2125 | |||
| CNC4 | N.D.f | 2105/2127g | |||
| CNC5 | 2073 | 2106/2138g | |||
Wavenumbers are measured from spectra with resolutions of ± 1 or ± 2 cm−1.
Aqueous solutions include 100 mM KPi (NaPi for micelles), 1 mM EDTA, pH 7.0.
This peak is split due to Fermi resonance (see Supplementary Material).
This peak has a small shoulder at 2156 cm−1.
The high frequency peak of pentyl isocyanide is a crude estimate because the band occurs as a long flat shoulder with no clear maximum.
None detected.
Two peaks appear above 2100 cm−1.
Figure 4.

A. FTIR spectra of the wt MbCNR complexes. The blue arrow shows the increase in intensity of the high frequency absorbance for the CNC2 to CNC4 complexes and the red arrow shows the reverse trend for the CNC4 to CNC6 complexes. FTIR samples contained 3–4 mM MbCNR in 0.1 M potassium phosphate buffer at pH 7.0, 20–22°C. B. Geminate recombination of MbCNRs following photolysis by a 7 ns YAG laser flash. Photodissociated CNRs either rebind geminately on 300 ns time scales (as shown) or escape to solvent and then rebind in a bimolecular process on μs to ms timescales (not shown). The blue arrow shows that Fgem decreases for the series CNC2-CNC4 and the red arrows shows that this trend reverses for the series CNC4-CNC6 (red arrow). These samples contained 0.1 mM Mb and 1 mM CNR in the same buffer.
Working from the MbCNR crystal structures of Johnson and Smith (19, 20, 23), we hypothesized that the lower frequency νCN bands for the MbCNR complexes are due to the alkyl side chain of the CNR pointing into the back of the distal pocket. This ligand orientation allows the distal histidine to hydrogen bond to the isocyano group (the in conformer; V in Fig. 1), which enhances back bonding and lowers the order of the C-N bond and νCN. The higher frequency νCN peak is due to the alkyl side chain pointing toward solvent and pushing the distal histidine out and away from the bound isocyano group (the out conformer; VI in Figure 1). This second conformation leaves the isocyano group in an apolar environment analogous to that seen for the model heme complexes (IV in Fig. 1). These interpretations are analogous to those made for the various νCO bands seen for MbCO complexes (24, 35, 36 and references therein).
The FTIR spectrum of methyl isocyanide bound to Mb suggests a unique electronic structure and more conformational disorder than that observed for the larger CNRs. The low frequency peak at 2083 cm−1, assigned to the in conformation, is comparatively broad, and the out conformation peak at 2139 cm−1 has a shoulder at higher frequency for MbCNC1. The addition of alkyl substituents to the CNR C1 atom decreases the bond strength of the zwitterionic isocyanide group through internal steric and inductive effects (37), as indicated by decreases in νCN of 10 and 30 cm−1 for free ethyl and t-butyl isocyanides, respectively, from the 2187 cm−1 CNC1 peak for these molecules in water (Fig. 1, left panel; Table 1). Thus, compared to ethyl isocyanide, CNC1 bound to Mb has a less stable in conformation because it has a more upright geometry with respect to the heme plane, which causes steric clashes with His64 in the closed conformation, and there is increased positive charge on the nitrogen of the zwitterionic form of the isocyanide group, which disrupts hydrogen bond donation from the His64 side chain. Comparisons among the longer CNR homologs are simplified by their similar electronic and bonding properties.
For the intermediately sized, bound isocyanides, CNC2, CNC3, and CNC4, the height of the low frequency peak relative to that of the high frequency peak is roughly proportional to the length of the ligand (Figs. 1 and 4A). This trend is consistent with the low and high frequency peaks being due to in and out conformers, respectively (Fig. 1, structures V and VI) because the larger ligand side chains are expected to be more sterically restricted within the Mb binding pocket and therefore less stable in the in conformation.
The low frequency peaks for MbCNC5 and MbCNC6 have greater absorbances than that observed for MbCNC4 in spite of their larger sizes (Figs. 2 and 4A). As discussed below and in the third paper of this series (28), CNC5 and CNC6 are long enough to reach the solvent phase outside the His(E7) gate, where their terminal carbons encounter unfavorable hydrophobic forces. Reisberg (38) and Mims et al. (7) found that the free energy penalty due to steric hindrance is similar for Mb binding to CNC4, CNC5 or CNC6. Presumably, the Xe4 cavity, which is contiguous with the distal pocket, provides the space needed to hold the fifth and sixth alkyl carbons for these longer ligands in the in conformation.
We considered other possible origins of the two peaks in the MbCNR FTIR spectra, including the presence of unbound ligands in the hydrophobic protein interior, formation of bis-CNR heme complexes, and Fe(III)-CNR coordination due to oxidation of the sample. To rule out these possibilities, FTIR spectra were collected for CNRs free in aqueous solution, in organic solvents and in soap micelles and for CNRs bound to a pentacoordinate model heme with a covalently attached imidazole group that acts as a proximal ligand. These data and the arguments against alternative interpretations of the multiple νCN bands for the MbCNR complexes are presented in detail in the Supplementary Material.
The key observations from these control experiments are as follows. (a) The free isocyanides in apolar solvents, which should mimic non-covalently bound CNRs in the protein matrix, show bands in the 2150 to 2170 cm−1 region. The position of these free isocyanide bands are 20–30 cm−1 higher than the highest frequency νCN peaks seen in the spectra for the MbCNRs complexes (Table 1, Fig 1). (b) The splitting of the free CNC2 νCN band in buffer is due to Fermi resonance with a vibrational mode of the ethyl side chain, and this splitting can sometimes complicate interpretation of data for mutant complexes (Fig. 1 in the Supplement). (c) The νCN band for the bis-CNC4-heme complex of the model heme is at 2142 cm−1, which is 30 cm−1 higher than the second band seen in the MbCNC4 spectra (Table 1; Fig. 2 in the Supplement). (d) The νCN band for CNC4 bound to the ferric form of the model heme is at 2230 cm−1 and very weak (Fig. 2 in the Supplement).
Evidence Supporting Assignment of the νCN Peaks to the in and out Conformations in wt MbCNRs
The out conformation of MbCNR places the isocyano bond in an apolar environment that can be modeled with isocyanides bound to the pentacoordinate model heme in micelles. The single νCN peaks for the HmCNRs in micelles coincide with the higher νCN ≈ 2125 cm−1 frequency bands observed for the MbCNRs (Fig. 2; Table 1). These results strongly support assignment of the high frequency band of MbCNRs to the out conformation (Fig. 1, Structure VI). No polar residues are near the isocyano group when its alkyl side chain points outward because the distal histidine side chain is pushed out into solvent, opening the His(E7) gate. When the ligand side chain points inward and His(E7) is rotated into the distal pocket, the imidazole Nε-H appears to donate a strong hydrogen bond to the bound CNR, which increases back bonding, and decreases the C≡N bond order and νCN. The presence of this electrostatic interaction provides a simple explanation of the low frequency νCN peak assigned to the in conformation.
Further proof of the assignment of the high frequency band was achieved by examining Mb mutants, in which the distal histidine was replaced by leucine and alanine, creating an apolar active site regardless of the orientation of the ligand side chain. As shown in Fig. 2, the νCN values for CNC1 through CNC5 bound to H64L and H64A Mb are near those for the peaks seen for the HmCNRs and overlap with the high frequency peaks of the corresponding wt MbCNR complexes. The variation of the νCN peak values among the HmCNR, H64A MbCNR and H64L MbCNR complexes is due to small differences in the mechanical and electric forces acting upon the bound isocyano group. Changing the size and shape of the E7 side chain can alter the Fe-ligand bond angles through direct steric hindrance. Although the binding sites of these complexes are mostly apolar, H64A Mb allows water molecules to approach the bound ligand through the E7 opening and the negatively charged SDS and positively charged TMTA head groups alter the electric fields near the surface of their respective micelles. However, none of these complexes have a second, low frequency νCN peak, which appears in the FTIR spectra of wt MbCNRs due to a hydrogen bond between His(E7) and the CNR ligand in the in conformation.
The more conservative H64Q mutation was used to test the importance of hydrogen bond donation from residue E7 in the Stark splitting observed for the νCN peak of MbCNRs. As shown in the right panels in Fig. 2, both high and low frequency peaks appear in the FTIR spectra of H64Q MbCNC1-5. A “third” peak between the low and high frequency peaks is present in the spectra for the longer ligands, CNC4 and CNC5. An interpretation of this middle peak is not immediately evident, but the greater flexibility of the glutamine side chain may create multiple electrostatic environments for the bound isocyano group. The general pattern of in and out peak intensities for the H64Q Mb-CNC1 through -CNC5 series is similar to that for the wt MbCNRs. Bound CNC1 has a relatively large high frequency νCN peak. Increasing the ligand side chain from C2 to C4 increases the intensity of the high frequency out peak, presumably due to a more effective expulsion of the Gln(E7) side chain outward into solvent and a progressively greater occupancy of the E7 channel by the CNR alkyl group. The hydrophobic force acting on the out CNC5 conformer causes this trend to reverse, and H64Q MbCNC5 has a larger low frequency νCN component than does the CNC4 complex.
As a final test of the peak assignments, we examined the effects of pH on the FTIR spectra of wt MbCNR. There are no changes between pH 7 and 9, but significant increases in the high frequency out conformation are observed as the solutions are acidified (Fig. 3). As pH is lowered from 7.0, an increased proportion of the distal histidine side chains become protonated and swing outward to become solvated. This conformational change was observed in MbCO crystals at pH 4.0 (39), and the apparent pKa of His(E7) has been estimated to be ~5 based on pH dependent changes in MbCO IR and RR spectra and in rates of ligand binding (40–42). The increase in intensity of the high frequency band of the MbCNR complexes at lower pH confirms its assignment to an out conformation, with His(E7) pointing out into solvent. Unfortunately, the MbCNR complexes are unstable at pH values below ~5.5. At lower pH values, bis-CNR complexes form, leading to heme extraction, and precipitation of the globin. The bis-CNR heme complex is extremely stable. Even small increases in proximal His(F8) protonation facilitate the binding of a second isocyanide, and these reactions become faster and more dominant for the more hydrophobic long-chain CNRs (11).
Figure 3.

FTIR spectra for CNC1, CNC3 and CNC5 bound to Mb at neutral and low pH. The spectra for the complexes at pH 7.0 (black lines) are overlaid with those at low pH (5.9, 5.4 and 5.9, respectively; gray lines). Acidic pH increases the percentage of protonated His(E7) side chains and causes the imidazole side chain to rotate away from the bound ligand and into solution (39, 43). The samples contained 3–4 mM MbCNR in 0.1 M potassium phosphate buffer and were analyzed at room temperature.
Ligand Recombination versus Escape after Flash Photolysis Supports the in versus out IR Peak Assignments
Femtosecond to sub-microsecond laser excitation pulses have been used to study both internal and bimolecular ligand reactions with heme proteins. Sommer et al. (8) and Gibson et al. (27) described a series of kinetic states for photolyzed MbCNR complexes, including the bound ligand, one or two transient intermediates that are non-covalently trapped within the protein on nanosecond timescales, and the fully dissociated ligand in solution. The laser pulse photolyzes the iron-ligand bond with a quantum yield of ~1.0 (8, 27) and creates a geminate state, in which the ligand is still in the protein but no longer covalently bound. The ligand then either escapes to bulk solution or rebinds to the heme iron. The fraction of ligands that geminately rebind, Fgem, is directly measured by monitoring changes in the heme absorbance spectrum and depends on the rate of ligand escape, kescape, and the rate of iron-ligand bond formation, kbond (i.e. Fgem= kbond/[kbond+kescape]) (9, 44–46). These rates and Fgem depend on the intrinsic reactivity of the ligand, on the ease of in-plane movement of the heme iron-proximal His(F8) complex, and on steric constraints imposed by amino acid side chains in the distal portion of the heme pocket (44). The n-alkyl isocyanides all have the same intrinsic reactivity with the heme group, as demonstrated in model heme studies (34), and the proximal geometries are the same for all the wt MbCNR complexes. Thus any changes in Fgem as a function of ligand size must be attributed to steric constraints or alternate conformations within the binding pocket (27).
A complete set of geminate rebinding traces for the Mb complexes of CNC1 through CNC6 is shown in Fig. 4B. The observed pattern for the fraction of geminate rebinding correlates with the fraction of in versus out conformations measured in the FTIR spectra of the corresponding MbCNR complexes (Table 2, Figs. 4 and 5). The extent of geminate rebinding, Fgem, was defined as the absorbance change for internal rebinding measured after all internal rebinding phases were complete (usually at 1–2 μs after photolysis) divided by the total absorbance change generated by the excitation pulse. Multiple geminate rebinding phases were analyzed for CNC3 and CNC4 by multiple exponential fitting but not considered separately. For this analysis, the total Fgem values decrease in the order CNC2 > CNC3 > CNC4 with values of 0.95, 0.79, and 0.63, respectively. Then the trend reverses, with Fgem increasing in the order CNC4 (0.63) < CNC5 (0.89) < CNC6 (0.97). These trends follow closely those observed for the in/out ratio of νCN peaks in the FTIR spectra of the MbCNRs (Fig. 4A).
Table 2.
The fraction of low frequency in conformation (Fin), the fraction of geminate recombination (Fgem) and the overall rate and equilibrium constants for CNR binding to wt Mb.a
Figure 5.

A. Dependence of Fgem (open circles), Fin (filled circles) and Ka (filled triangles) on alkyl isocyanide length for wt MbCNR complexes. The equilibrium association constants, Ka, were taken from (10) and (7). All three parameters have the same undulating pattern, which arises from a combination of steric pressure and hydrophobic forces acting on the alkyl side chain. B. Correlations between Fin and Fgem, and between Fin and Ka. The three independent measurements and the strong correlations among them can be interpreted in terms of an equilibrium between the in and out conformations for each bound CNR and the hypothesis that non-covalently bound CNRs only escape rapidly from the distal binding pocket when the alkyl side chain is pointing out and the His(E7) gate is open (see text).
The proportion of isocyanide side chains in the in conformation was quantified from the FTIR spectra for each MbCNR complex as the fraction in, Fin=Absin/(Absin+Absout), where Absin and Absout are the absorbances of the low and high frequency peaks, respectively. The FTIR spectra, particularly those of Mb mutants analyzed in the third paper of this series (28) could not be fit with two symmetric peaks with mixed lorenzian/gaussian shapes. Therefore we chose to use the aborbance intensities at the peak maxima to indicate the relative proportions of the in and out populations.
Correlations between Fin from the FTIR spectra and Fgem from the laser photolysis data are presented in Fig. 5. An undulating pattern with increasing ligand size is seen in both measurements (Fig. 5A), and there is a correlation with a slope of ~1 between the two fractions with R2=0.89 (Fig. 5B). This correlation between Fin and Fgem argues strongly that these properties depend on the same structural features. The simplest interpretation is that, when the ligand side chain adopts the in conformation with the alkyl chain pointing toward the protein interior, the ligand is much more likely to be retained in the protein and rebind to the iron atom rapidly. When the bound ligand side chain points out, with the His(E7) side chain rotated outward into the open-gate conformation, the isocyanide escapes much more readily from the distal pocket after photolysis.
DISCUSSION
Interpretation of the CNR and MbCNR FTIR spectra
The νCN stretching frequency peak for free C≡NR has a significant dependence on solvent polarity because the isocyano group is a mixture of a double bonded neutral isomer, which is favored in apolar solvents, and a triple bonded zwitterionic isomer, which is favored in polar solvents (Fig. 1, structures I and II). As a result, the νCN peak for the free larger CNRs decreases from 2173 cm−1 in H2O to 2154 cm−1 in CHCl3 (Fig. 1 left panel; Table 1).
For CNRs bound to heme, back bond donation strengthens the Fe-C coordinate bond and weakens the C≡N triple bond so that νCN is red-shifted to ~2125 cm−1 for HmCNRs dissolved in the hydrocarbon interior of a soap micelle (Table 1). In Mb, the extent of back bonding is dependent on the polarity of residues within the distal pocket. For example, the νCN peak for HmCNC2 in SDS micelles is at 2128 cm−1, but is decreased by ~50 cm−1 to 2065 cm−1 for CNC2 bound to wt Mb, where His(E7) donates a strong hydrogen bond to the ligand’s C≡N group when the alkyl side chain is pointing inward.
However, in general the FTIR spectra of wt MbCNR complexes show two bands at ~2075 cm−1 and ~2125 cm−1. These peaks indicate the presence of two conformations that are consistent with those discovered in wt and native MbCNR crystal structures described in detail in Smith et al. (23). For the in conformation, the alkyl group of the ligand points into the back of the binding pocket and His(E7) forms a hydrogen bond with the bound C≡N group, giving rise to the low frequency νCN peak at ~2075 cm−1. For the out conformation, the CNR alkyl group points toward solvent and pushes the His(E7) side chain into the open position, which disrupts the His(E7) hydrogen bond and places the isocyano group in an apolar environment.
Our interpretation of the FTIR spectra allows a calculation of the in versus out conformational equilibrium of CNRs bound to wt Mb in solution from the intensities of the low and high frequency νCN peaks. Fin decreases with ligand size for ethyl through n-butyl isocyanide as a significant population the larger side chains rotate ~180° and point outward. This decrease in Fin correlates strongly with a decrease in the fraction of photodissociated isocyanides that rebind geminately on ns time scales. The ligands that are pointing inward are “stuck” in the protein interior, which facilitates internal rebinding, whereas the ligands pointing outward rapidly escape through the open His(E7) gate after photolysis (Table 2; Fig. 4). As the size of the ligand is increased further from n-butyl to n-hexyl isocyanide, both Fgem and Fin increase. The alkyl groups of these longer CNRs are forced into the back of the distal pocket by the hydrophobic effect as described below.
Correlations of Fin and Fgem with Overall CNR Affinities for Mb
The dependence of CNR affinity on ligand size has been used to examine steric constraints within the ligand binding pockets of Mb and Hb. In 1951 St. George and Pauling argued that the heme groups in hemoglobin are buried within the protein matrix and probably not bound at its surface based on alkyl isocyanide binding studies (2). They used ethyl, isopropyl and tert-butyl isocyanides to increase the size and rigidity of the alkyl side chain and found that, although the affinity of these ligands did not vary significantly for free heme, their affinity for Hb decreased markedly with increasing ligand size. These results suggested that the heme group is buried in Hb, sterically restricted by the protein, and not bound at its solvent exposed surface.
The more detailed analysis of Reisberg (38) and Mims et al. (7) allowed mapping of the free energy of steric constraints within the binding pockets of mammalian hemoglobins and myoglobins using a series of both straight-chain and branched alkyl isocyanides. The affinities of the straight-chain isocyanides for native Mb show an undulating pattern that correlates with both Fin and Fgem values (Fig. 5A). Increasing the size of the ligand from CNC1 to CNC2 results in a relatively large increase in the ligand affinity due to the favorable hydrophobic effect for partitioning a second alkyl carbon atom into the protein (7) and to the minimal steric constraints on the second alkyl carbon in the distal pocket (21, 22). The ethyl side chain fits well into the back of the distal pocket, which contains a water molecule in deoxy Mb (47) and captures CO following its photodissociation from the heme iron (48). This “good” fit accounts for why >80% of CNC2 side chains are pointing inward, ≥90% of photodissociated CNC2 geminately rebinds, and CNC2 has such a high affinity for Mb.
Increasing the size of the isocyanide side chain from an ethyl to an n-butyl group results in a progressive decrease in ligand affinity from ~0.3 to ~0.05 μM−1, which is accompanied by a progressive decrease in both the fraction of ligands that point inward and the fraction of geminate recombination. In these cases, the steric restrictions in the distal pocket push the CNR side chain outward, which in turn forces the His(E7) side chain to rotate outward, opening the channel to solvent. In the case of MbCNC4, the free energy barrier to maintain the n-butyl group within the distal pocket is roughly equal to the barrier for pushing His(E7) into the open conformation. As a result, ~50% of CNC4 side chains appear to occupy the open E7 channel. These steric pressures and direct access of half of the ligand side chains to solvent account for the large fraction of escape from MbCNC4 after laser photolysis.
Further increases in the alkyl side chain to CNC5 and CNC6 reverse the trend. For the series CNC4, CNC5 and CNC6, the affinities increase with increasing ligand size. The apolar pentyl and hexyl side chains would extend directly into the solvent phase in the out ligand conformation, making this orientation less favored. As a result of this unfavorable hydrophobic effect, the out conformation is poorly populated, and the MbCNC5 and MbCN6 complexes have dominant low frequency, in peaks in their FTIR spectra. As described in Results, Mims et al. (7) found that the energy penalty due to steric constraints within the protein is small for the addition of the fifth and sixth alkyl carbon. The terminal alkyl carbons of these longer ligands most likely “fit” into the Xe4 cavity. In Mb, this space is contiguous with the distal pocket, accommodates a Xe atom at high partial pressures (49), and transiently contains photodissociated CO in time resolved crystallography studies (50–53). This interpretation for the MbCNC5 and MbCNC6 complexes is consistent with their high ligand affinities, their large fractions of in conformations based on FTIR spectra, their ≥95% geminate rebinding, and the linear correlations between Ka, Fgem, and Fin shown in Fig. 5B.
Bound alkyl isocyanides and pathways for ligand movement
The direct correlation between the fraction of geminate recombination, Fgem, following laser photolysis of MbCNR complexes and the fraction of the low frequency in conformer measured by FTIR spectroscopy suggest that the side chains of bound CNRs may serve to identify pathways for the movement of thermally and photodissociated diatomic ligands within Mb. In the in conformer, the ligand alkyl carbon atoms occupy positions observed for photodissociated CO in time resolved X-ray crystallography experiments (i.e. the B and C states; (52, 54)). In the out conformer, these atoms lie along the channel created when the His(E7) side chain rotates outward into solvent, which we and other workers (45, 46, 55, 56) feel is the major pathway for ligand entry. These ideas and interpretations are tested in greater structural detail in the two accompanying papers, which explore the crystal structures and effects of packing on the conformations of bound alkyl isocyanides (23) and the effects of extensive distal pocket mutagenesis on the spectral and kinetic properties of MbCNR complexes in solution (28).
Supplementary Material
Acknowledgments
We would like to thank Antony Mathews and Scott Premer in the laboratory of Mark Hargrove for synthesizing and providing some of the alkyl isocyanides.
Abbreviations
- Mb
myoglobin
- wt
wild-type
- Hm and model heme
protoheme mono-3-(1-imidazoyl) propylamide monomethyl ester
- CNR
alkyl isocyanide, where R= C1, C2, C3, C4, C5 and C6 for methyl, ethyl, n-propyl, n-butyl, n-pentyl and n-hexyl groups
- FTIR
Fourier-transform infrared spectroscopy
- νCN
isocyano group stretching frequency
- Fin
fraction of CNRs that point into the Mb binding pocket as measured by FTIR
- k′
association rate
- k
dissociation rate
- Ka
equilibrium association constant calculated as k′/k
- Fgem
fraction of geminate recombination
Footnotes
Supported by U.S. Public Health Service Grants GM 35649 (J.S.O.) and HL 47020 (J.S.O.), and Grant C-612 (J.S.O.) from the Robert A. Welch Foundation. G. C. B. was the recipient of a traineeship from The Houston Area Molecular Biophysics Predoctroral Training Grant GM08280.
Supporting Information Available. FTIR spectra that show Fermi resonance causes the νCN peak of ethyl isocyanide to split, and FTIR spectra for alky isocyanides bound to ferric model heme (Hm) and in bis-complexes to ferrous model heme (Hm). This material is available free of charge via the Internet at http://pubs.acs.org.
References
- 1.Lein A, Pauling L. The Combining Power of Myoglobin for Alkyl Isocyanides and the Structure of the Myoglobin Molecule. Proc Natl Acad Sci U S A. 1956;42:51–54. doi: 10.1073/pnas.42.2.51. [DOI] [PMC free article] [PubMed] [Google Scholar]
- 2.St George RC, Pauling L. The combining power of hemoglobin for alkyl isocyanides, and the nature of the heme-heme interactions in hemoglobin. Science. 1951;114:629–634. doi: 10.1126/science.114.2972.629. [DOI] [PubMed] [Google Scholar]
- 3.Talbot B, Brunori M, Antonini E, Wyman J. Studies on the reaction of isocyanides with haemproteins. I. Equilibria and kinetics of the binding to the isolated chains of human haemoglobin. J Mol Biol. 1971;58:261–276. doi: 10.1016/0022-2836(71)90245-2. [DOI] [PubMed] [Google Scholar]
- 4.Brunori M, Talbot B, Colosimo A, Antonini E, Wyman J. Studies on the reaction of isocyanides with haemproteins. II. Binding to normal and modified human haemoglobins. J Mol Biol. 1972;65:423–434. doi: 10.1016/0022-2836(72)90199-4. [DOI] [PubMed] [Google Scholar]
- 5.Stetzkowski F, Cassoly R, Banerjee R. Binding of alkylisocyanides with soybean leghemoglobin. Comparisons with sperm whale myoglobin. J Biol Chem. 1979;254:11351–11356. [PubMed] [Google Scholar]
- 6.Reisberg PI, Olson JS. Equilibrium binding of alkyl isocyanides to human hemoglobin. J Biol Chem. 1980;255:4144–4130. [PubMed] [Google Scholar]
- 7.Mims MP, Porras AG, Olson JS, Noble RW, Peterson JA. Ligand binding to heme proteins. An evaluation of distal effects. J Biol Chem. 1983;258:14219–14232. [PubMed] [Google Scholar]
- 8.Sommer JH, Henry ER, Hofrichter J. Geminate recombination of n-butyl isocyanide to myoglobin. Biochemistry. 1985;24:7380–7388. doi: 10.1021/bi00346a053. [DOI] [PubMed] [Google Scholar]
- 9.Carver TE, Rohlfs RJ, Olson JS, Gibson QH, Blackmore RS, Springer BA, Sligar SG. Analysis of the kinetic barriers for ligand binding to sperm whale myoglobin using site-directed mutagenesis and laser photolysis techniques. J Biol Chem. 1990;265:20007–20020. [PubMed] [Google Scholar]
- 10.Rohlfs RJ, Mathews AJ, Carver TE, Olson JS, Springer BA, Egeberg KD, Sligar SG. The effects of amino acid substitution at position E7 (residue 64) on the kinetics of ligand binding to sperm whale myoglobin. J Biol Chem. 1990;265:3168–3176. [PubMed] [Google Scholar]
- 11.Smerdon SJ, Krzywda S, Wilkinson AJ, Brantley RE, Jr, Carver TE, Hargrove MS, Olson JS. Serine92 (F7) contributes to the control of heme reactivity and stability in myoglobin. Biochemistry. 1993;32:5132–5138. doi: 10.1021/bi00070a023. [DOI] [PubMed] [Google Scholar]
- 12.Campbell BF, Chance MR, Friedman JM. Ligand binding channels reflected in the resonance Raman spectra of cryogenically trapped species of myoglobin. J Biol Chem. 1987;262:14885–14890. [PubMed] [Google Scholar]
- 13.Jongeward KA, Magde D, Taube DJ, Marsters JC, Traylor TG, Sharma VS. Picosecond and nanosecond geminate recombination of myoglobin with CO, O2, NO, and isocyanides. J Amer Chem Soc. 1988;110:380–387. [Google Scholar]
- 14.Chatfield MD, Walda KN, Magde D. Activation parameters for ligand escape from myoglobin proteins at room temperature. J Amer Chem Soc. 1990;112:4680–4687. [Google Scholar]
- 15.Egeberg KD, Springer BA, Sligar SG, Carver TE, Rohlfs RJ, Olson JS. The role of Val68(E11) in ligand binding to sperm whale myoglobin. Site-directed mutagenesis of a synthetic gene. J Biol Chem. 1990;265:11788–11795. [PubMed] [Google Scholar]
- 16.Carver TE, Olson JS, Smerdon SJ, Krzywda S, Wilkinson AJ, Gibson QH, Blackmore RS, Ropp JD, Sligar SG. Contributions of residue 45(CD3) and heme-6-propionate to the biomolecular and geminate recombination reactions of myoglobin. Biochemistry. 1991;30:4697–4705. doi: 10.1021/bi00233a009. [DOI] [PubMed] [Google Scholar]
- 17.Smerdon SJ, Dodson GG, Wilkinson AJ, Gibson QH, Blackmore RS. Distal pocket polarity in ligand binding to myoglobin: structural and functional characterization of a threonine68(E11) mutant. Biochemistry. 1991;30:6252–6260. doi: 10.1021/bi00239a025. [DOI] [PubMed] [Google Scholar]
- 18.Carver TE, Brantley RE, Jr, Singleton EW, Arduini RM, Quillin ML, Phillips GN, Jr, Olson JS. A novel site-directed mutant of myoglobin with an unusually high O2 affinity and low autooxidation rate. J Biol Chem. 1992;267:14443–14450. [PubMed] [Google Scholar]
- 19.Johnson K. Ph D Dissertation. Rice University; Houston, TX: 1993. High resolution X-ray structures of myoglobin and hemoglobin alkyl isocyanide complexes. [Google Scholar]
- 20.Smith RD. Biochemistry & Cell Biology. Rice University; Houston, TX: 1999. p. 203. [Google Scholar]
- 21.Johnson K, Olson J, Phillips GJ. Structure of myoglobin-ethyl isocyanide: histidine as a swinging door for ligand entry. J Mol Biol. 1989;207:459–463. doi: 10.1016/0022-2836(89)90269-6. [DOI] [PubMed] [Google Scholar]
- 22.Eich RF, Li T, Lemon DD, Doherty DH, Curry SR, Aitken JF, Mathews AJ, Johnson KA, Smith RD, Phillips GN, Jr, Olson JS. Mechanism of NO-induced oxidation of myoglobin and hemoglobin. Biochemistry. 1996;35:6976–6983. doi: 10.1021/bi960442g. [DOI] [PubMed] [Google Scholar]
- 23.Smith RD, Blouin GC, Johnson KA, Phillips GN, Jr, Olson JS. Straight-Chain Alkyl Isocyanides Open the Distal Histidine Gate in Crystal Structures of Myoglobin. Biochemistry. 2010 doi: 10.1021/bi1001739. to be co-published with this article. [DOI] [PMC free article] [PubMed] [Google Scholar]
- 24.Li T, Quillin ML, Phillips GN, Jr, Olson JS. Structural determinants of the stretching frequency of CO bound to myoglobin. Biochemistry. 1994;33:1433–1446. doi: 10.1021/bi00172a021. [DOI] [PubMed] [Google Scholar]
- 25.Phillips GN, Jr, Teodoro M, Li T, Smith B, Gilson MM, Olson JS. Bound CO is a Molecular Probe of Electrostatic Potential in the Distal Pocket of Myoglobin. J Phys Chem B. 1999;103:8817–8829. [Google Scholar]
- 26.Lee DS, Park SY, Yamane K, Obayashi E, Hori H, Shiro Y. Structural characterization of n-butyl-isocyanide complexes of cytochromes P450nor and P450cam. Biochemistry. 2001;40:2669–2677. doi: 10.1021/bi002225s. [DOI] [PubMed] [Google Scholar]
- 27.Gibson QH, Olson JS, McKinnie RE, Rohlfs RJ. A kinetic description of ligand binding to sperm whale myoglobin. J Biol Chem. 1986;261:10228–10239. [PubMed] [Google Scholar]
- 28.Blouin GC, Schweers RL, Olson JS. Alkyl Isocyanides Serve as Transition State Analogs for Ligand Entry and Exit in Myoglobin. Biochemistry. 2010 doi: 10.1021/bi1001745. to be co-published with this article. [DOI] [PMC free article] [PubMed] [Google Scholar]
- 29.Springer BA, Sligar SG. High-level expression of sperm whale myoglobin in Escherichia coli. Proc Natl Acad Sci U S A. 1987;84:8961–8965. doi: 10.1073/pnas.84.24.8961. [DOI] [PMC free article] [PubMed] [Google Scholar]
- 30.Braunstein D, Ansari A, Berendzen J, Cowen BR, Egeberg KD, Frauenfelder H, Hong MK, Ormos P, Sauke TB, Scholl R, et al. Ligand binding to synthetic mutant myoglobin (His-E7----Gly): role of the distal histidine. Proc Natl Acad Sci U S A. 1988;85:8497–8501. doi: 10.1073/pnas.85.22.8497. [DOI] [PMC free article] [PubMed] [Google Scholar]
- 31.Casanova J, Jr, Schuster RE, Werner ND. Synthesis of aliphatic isocyanides. Journal of the Chemical Society. 1963:4280–4281. [Google Scholar]
- 32.Mims MP, Olson JS, Russu IM, Miura S, Cedel TE, Ho C. Proton nuclear magnetic resonance studies of isonitrile-heme protein complexes. J Biol Chem. 1983;258:6125–6134. [PubMed] [Google Scholar]
- 33.Traylor TG, Chang CK, Geibel J, Berzinis A, Mincey T, Cannon J. Syntheses and NMR characterization of chelated heme models of hemoproteins. Journal of the American Chemical Society. 1979;101:6716–6731. [Google Scholar]
- 34.Olson JS, McKinnie RE, Mims MP, White DK. Mechanisms of ligand binding to pentacoordinate protoheme. Journal of the American Chemical Society. 1983;105:1522–1527. [Google Scholar]
- 35.Ray GB, Li XY, Ibers JA, Sessler JL, Spiro TG. How far can proteins bend the FeCO unit? Distal polar and steric effects in heme proteins and models. Journal of the American Chemical Society. 1994;116:162–176. [Google Scholar]
- 36.Spiro TG, Wasbotten IH. CO as a vibrational probe of heme protein active sites. J Inorg Biochem. 2005;99:34–44. doi: 10.1016/j.jinorgbio.2004.09.026. [DOI] [PubMed] [Google Scholar]
- 37.Stephany RW, De Bie MJA, Drenth W. Carbon-13 NMR and infrared study of isocyanides and their complexes. Organic Magnetic Resonance. 1974;6:45–47. [Google Scholar]
- 38.Reisberg PI. Ph D Dissertation. Rice University; Houston, TX: 1980. [Google Scholar]
- 39.Yang F, Phillips GN., Jr Crystal structures of CO-, deoxy- and met-myoglobins at various pH values. J Mol Biol. 1996;256:762–774. doi: 10.1006/jmbi.1996.0123. [DOI] [PubMed] [Google Scholar]
- 40.Tian WD, Sage JT, Champion PM. Investigations of ligand association and dissociation rates in the “open” and “closed” states of myoglobin. J Mol Biol. 1993;233:155–166. doi: 10.1006/jmbi.1993.1491. [DOI] [PubMed] [Google Scholar]
- 41.Morikis D, Champion PM, Springer BA, Sligar SG. Resonance Raman investigations of site-directed mutants of myoglobin: Effects of distal histidine replacement. Biochemistry. 1989;28:4791–4800. doi: 10.1021/bi00437a041. [DOI] [PubMed] [Google Scholar]
- 42.Fuchsman WH, Appleby CA. CO and O2 complexes of soybean leghemoglobins: pH effects upon infrared and visible spectra. Comparisons with CO and O2 complexes of myoglobin and hemoglobin. Biochemistry. 1979;18:1309–1321. doi: 10.1021/bi00574a030. [DOI] [PubMed] [Google Scholar]
- 43.Shimada H, Caughey WS. Dynamic protein structures. Effects of pH on conformer stabilities at the ligand-binding site of bovine heart myoglobin carbonyl. J Biol Chem. 1982;257:11893–11900. [PubMed] [Google Scholar]
- 44.Olson JS, Phillips GN., Jr Kinetic Pathways and Barriers for Ligand Binding to Myoglobin. J Biol Chem. 1996;271:17596. [PubMed] [Google Scholar]
- 45.Scott EE, Gibson QH, Olson JS. Mapping the pathways for O2 entry into and exit from myoglobin. J Biol Chem. 2001;276:5177–5188. doi: 10.1074/jbc.M008282200. [DOI] [PubMed] [Google Scholar]
- 46.Olson JS, Soman J, Phillips GN., Jr Ligand pathways in myoglobin: a review of Trp cavity mutations. IUBMB Life. 2007;59:552–562. doi: 10.1080/15216540701230495. [DOI] [PubMed] [Google Scholar]
- 47.Quillin ML, Arduini RM, Olson JS, Phillips GN., Jr High-resolution crystal structures of distal histidine mutants of sperm whale myoglobin. J Mol Biol. 1993;234:140–155. doi: 10.1006/jmbi.1993.1569. [DOI] [PubMed] [Google Scholar]
- 48.Schlichting I, Berendzen J, Phillips GN, Jr, Sweet RM. Crystal structure of photolysed carbonmonoxy-myoglobin. Nature. 1994;371:808–812. doi: 10.1038/371808a0. [DOI] [PubMed] [Google Scholar]
- 49.Tilton RF, Jr, Kuntz ID, Jr, Petsko GA. Cavities in proteins: Structure of a metmyoglobin-xenon complex solved to 1.9 Å. Biochemistry. 1984;23:2849–2857. doi: 10.1021/bi00308a002. [DOI] [PubMed] [Google Scholar]
- 50.Brunori M, Vallone B, Cutruzzola F, Travaglini-Allocatelli C, Berendzen J, Chu K, Sweet RM, Schlichting I. The role of cavities in protein dynamics: crystal structure of a photolytic intermediate of a mutant myoglobin. Proc Natl Acad Sci U S A. 2000;97:2058–2063. doi: 10.1073/pnas.040459697. [DOI] [PMC free article] [PubMed] [Google Scholar]
- 51.Ostermann A, Waschipky R, Parak FG, Nienhaus GU. Ligand binding and conformational motions in myoglobin. Nature. 2000;404:205–208. doi: 10.1038/35004622. [DOI] [PubMed] [Google Scholar]
- 52.Schotte F, Soman J, Olson JS, Wulff M, Anfinrud PA. Picosecond time-resolved X-ray crystallography: probing protein function in real time. J Struct Biol. 2004;147:235–246. doi: 10.1016/j.jsb.2004.06.009. [DOI] [PubMed] [Google Scholar]
- 53.Aranda Rt, Levin EJ, Schotte F, Anfinrud PA, Phillips GN., Jr Time-dependent atomic coordinates for the dissociation of carbon monoxide from myoglobin. Acta Crystallogr D Biol Crystallogr. 2006;62:776–783. doi: 10.1107/S0907444906017318. [DOI] [PubMed] [Google Scholar]
- 54.Srajer V, Ren Z, Teng TY, Schmidt M, Ursby T, Bourgeois D, Pradervand C, Schildkamp W, Wulff M, Moffat K. Protein conformational relaxation and ligand migration in myoglobin: a nanosecond to millisecond molecular movie from time-resolved Laue X-ray diffraction. Biochemistry. 2001;40:13802–13815. doi: 10.1021/bi010715u. [DOI] [PubMed] [Google Scholar]
- 55.McNaughton L, Hernandez G, LeMaster DM. Equilibrium O2 distribution in the Zn2+-protoporphyrin IX deoxymyoglobin mimic: application to oxygen migration pathway analysis. J Am Chem Soc. 2003;125:3813–3820. doi: 10.1021/ja028064s. [DOI] [PubMed] [Google Scholar]
- 56.Schmidt M, Nienhaus K, Pahl R, Krasselt A, Anderson S, Parak F, Nienhaus GU, Srajer V. Ligand migration pathway and protein dynamics in myoglobin: a time-resolved crystallographic study on L29W MbCO. Proc Natl Acad Sci U S A. 2005;102:11704–11709. doi: 10.1073/pnas.0504932102. [DOI] [PMC free article] [PubMed] [Google Scholar]
Associated Data
This section collects any data citations, data availability statements, or supplementary materials included in this article.