Abstract
To perform experimental validation of computational fluid dynamics (CFD) applied to patient specific coronary aneurysm anatomy of Kawasaki disease. We quantified hemodynamics in a patient-specific coronary artery aneurysm physical phantom under physiologic rest and exercise flow conditions. Using phase contrast MRI (PCMRI), we acquired 3-component flow velocity at two slice locations in the aneurysms. We then performed numerical simulations with the same geometry and inflow conditions, and performed qualitative and quantitative comparisons of velocities between experimental measurements and simulation results. We observed excellent qualitative agreement in flow pattern features. The quantitative spatially and temporally varying differences in velocity between PCMRI and CFD were proportional to the flow velocity. As a result, the percent discrepancy between simulation and experiment was relatively constant regardless of flow velocity variations. Through 1D and 2D quantitative comparisons, we found a 5–17% difference between measured and simulated velocities. Additional analysis assessed wall shear stress differences between deformable and rigid wall simulations. This study demonstrated that CFD produced good qualitative and quantitative predictions of velocities in a realistic coronary aneurysm anatomy under physiological flow conditions. The results provide insights on factors that may influence the level of agreement, and a set of in vitro experimental data that can be used by others to compare against CFD simulation results. The findings of this study increase confidence in the use of CFD for investigating hemodynamics in the specialized anatomy of coronary aneurysms. This provides a basis for future hemodynamics studies in patient-specific models of Kawasaki disease.
Keywords: Experimental, Flow phantom, Kawasaki, CFD, PCMRI, Quantitative comparison, Validation
INTRODUCTION
Kawasaki disease (KD) is an acute vasculitis occurring mostly in children younger than 5 years of age. With an annual incidence of over 5500 cases in the US,10 and 1 in every 150 children in Japan,23 it is the leading cause of acquired pediatric heart disease. The most serious complications of KD are coronary aneurysms which occur in approximately 25% of untreated KD cases,11 and 3–5% of intravenous immunoglobulin treated cases.24 Patients with coronary aneurysms caused by KD are at risk of thrombosis in the aneurysm, which can lead to myocardial infarction and sudden death.8
Recent work suggests that flow patterns and other hemodynamic parameters in aneurysms caused by KD can provide an estimate for the risk of thrombosis, and thus have potential to improve patient selection for treatments such as systemic anticoagulation and coronary artery bypass surgery25 for otherwise asymptomatic patients. Current clinical imaging techniques such as PCMRI do not have sufficient spatial and temporal resolution to capture coronary hemodynamics, due to the small size and significant movements of the coronaries. Other techniques such as CT angiography can only provide anatomical data with no hemodynamic information.
Image-based computational fluid dynamics (CFD) is a powerful approach to investigate blood flow in the coronaries with high spatial and temporal resolution.13,32 However, it is important to validate these computational methods against experimental data to assess their agreement with the actual measured physical quantities. Previous experimental validations of CFD have investigated anatomies such as the carotid bifurcation,3,21,26,36 cerebral aneurysm,6,9 total cavopulmonary connection,12,27,28,34 and abdominal aortic aneurysm,7,17 but none have investigated KD coronary aneurysm anatomies. Furthermore, quantitative comparisons between CFD results and experimental measurements have commonly been omitted, and only qualitative comparisons presented in many previous studies.1,6,7,17 The aim of this work is therefore twofold: (1) to provide a baseline validation that supports future simulation efforts exploring clinical decision making in Kawasaki disease, and (2) to provide direct quantitative comparisons of a custom finite element flow solver in a representative complex patient specific geometry.
In this study, we performed experimental validation of CFD using a patient-specific KD coronary aneurysm physical phantom operating under realistic resting and exercise flow conditions. Using a high field-strength, high resolution MR scanner, and a phase contrast MRI (PCMRI) sequence, we acquired 3-component flow velocity information at two slice locations in the coronary aneurysm geometry. We then performed numerical CFD simulations using the same geometry and inflow conditions, and present qualitative and quantitative comparisons of velocities between experimental measurements and simulation results. In addition, we also make a direct comparison between simulations with rigid and deformable walls to quantify the resulting differences in wall shear stress (WSS).
METHODS
Patient-Specific Anatomical Phantom
Based on patient imaging data, we constructed a patient-specific physical phantom representing the aneurysmal region of a right-coronary artery in a KD patient that had been examined in a previous simulation study.32 The anatomical data was obtained from a clinical CT angiogram (64-slice CT General Electric) in a 10 year old male patient whom suffered KD at the age of 3. To construct the physical flow phantom (Fig. 1), a 3D anatomical model was first built from the imaging data through the creation of centerline paths in each vessel of interest, segmentation of the vessel lumen using 2D level set methods, and lofting of the 2D segmentations to create a 3D model. The anatomical model construction was done using a customized version of the open sourced Simvascular software package (www.simtk.org) as is standard in our laboratory.31 The right coronary artery was then isolated from the 3D model, an inlet section was added for the flow experiment, and the physical phantom was constructed based on the 3D coronary model. The anatomical domain extends from the mouth of the right coronary artery to the first distal branch, and includes a bi-lobed aneurysm. The physical flow phantom for MR imaging was built at the W.M. Keck Center in the University of Texas El Paso using a stereolithography technique (Viper™ Si2 stereolithography machine, 3D Systems Corporation, Rock Hill, SC) and MR-compatible resin (WaterShed® XC 11120, DSM Somos®, Elgin, IL).
FIGURE 1.
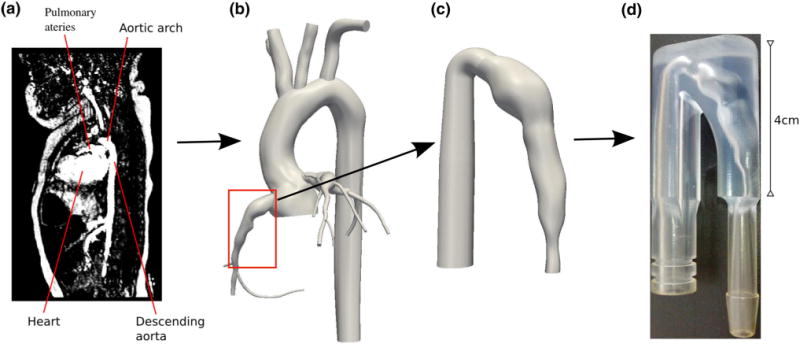
3D Anatomical Model and Phantom Construction Pipeline (a) Medical imaging data, (b) Patient-specific 3D model, (c) Coronary model with inlet, d) Physical phantom.
In Vitro Flow Experimental Setup
The single-inlet, single-outlet physical phantom was placed in a series flow loop where resting and exercise flow waveforms (Fig. 2a) were produced by a computer-programmable pulsatile pump (CompuFlow 1000, Shelley Medical Imaging Technologies, London, ON). We attached a one-meter straight and rigid tubing at the inlet of phantom to provide entrance flow conditioning to generate a fully developed Womersley flow profile at the phantom inlet. With a phantom inlet diameter of 0.7 cm, the entrance length is sufficiently long (approximately 140 diameters) to ensure proper flow conditioning. For the resting inlet flow waveform, we used a right coronary flow waveform that was based on a previous CFD simulation of the same patient, where the CFD domain contained an expanded aortic and coronary anatomy (Fig. 1b), and boundary conditions of the 3D model were assigned to match the patient-specific clinical measurements.32 For the exercise flow waveform, we doubled the mean flow rate and heart rate (60–120 bpm) to approximate a mild exercise condition such as light walking. The shape of the exercise flow waveform was adopted from previous literature of CFD simulation of coronary flow during exercise.13 The working fluid in the flow experiment was a 40% glycerol solution with a dynamic viscosity and density similar to that of blood, and contained 0.5% gadopentetate dimeglumine as MR imaging contrast agent (Magnevist, Bayer HealthCare, Wayne, NJ).
FIGURE 2.
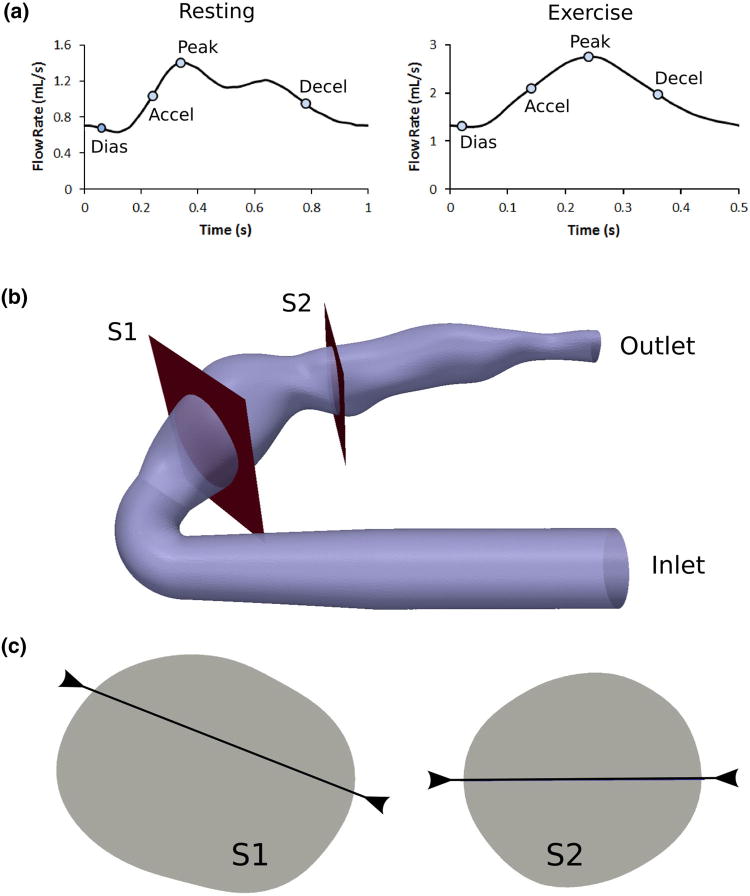
(a) Flow waveforms with time points, (b) Slice locations, and (c) Line locations, examined for validation analysis.
Ultrasonic Flow Probe Measurement
Volumetric flow rate through the phantom was monitored using a MR-compatible ultrasonic transit-time flow probe (ME2PXL, Transonic Systems, NY) externally clamped around a short section of Tygon tubing R3603 immediately upstream of the one-meter flow conditioning rigid tubing. Signals from the flow probe fed into a flowmeter (TS410, Transonic Systems, NY) with its low pass filter setting at 160 Hz, and then into a data acquisition unit (DT9806, Data Translation, Marlboro, MA), which we used along with a Matlab program to record the flow data at a sample rate of 100 Hz. We acquired flow rate data at 2 time points during the resting flow experiment and 3 time points during the exercise flow experiment. For each acquisition we averaged approximately 50 cycles of data to obtain one averaged cycle, we then averaged the acquisitions to obtain one cycle of flow rate data to represent each flow condition. The cycles of flow rate measurements were stable both in between the cycles of one acquisition and between the different acquisitions throughout the experiment.
PCMRI Imaging
We acquired flow velocity data at two different slice locations within the phantom (Fig. 2b) using a cardiac-gated 2D three-component cine PCMRI sequence in a 7T Bruker horizontal MR scanner with Avance II hardware (BrukerBiospin Corp., Fremont, CA) and a quadrature volume coil with a 3.5 cm inside diameter (V-HQ-070-AAK-001 V01, Rapid MR International, Columbus, OH). We assigned the imaging slices to the mid-aneurysm location for each lobe of the bi-lobed coronary aneurysm anatomy. The imaging parameters were 1 mm slice thickness, TR = 19.8 ms, TE = 7.22 ms, 30° flip angle, and NEX = 3. Acquisition matrices for slice locations S1 and S2 were 56 × 64 with pixel width 0.2315 × 0.2494 mm, and 44 × 48 with pixel width 0.2264 × 0.2284 mm, respectively. Figure 3 shows representative examples of the magnitude and phase images acquired by the PCMRI. The pulsatile flow pump produced a trigger signal to the MR scanner for cardiac gating, and 50 and 25 time points per cardiac cycle synchronized to this trigger signal were reconstructed for the resting and exercise experiments, respectively. We used a custom Matlab program capable of performing anti-aliasing to extract the velocity information from the PCMRI DICOM data. This allowed for the use of low velocity encoding (Venc) settings during the MRI acquisitions which produced good velocity resolution. The Venc in all directions for the resting and exercise conditions were 4 and 10 cm/s, respectively. No background correction was applied to the PCMRI data.
FIGURE 3.

Representative MR images acquired during flow experiments: (a) magnitude image, (b) phase image of through-plane velocities, and (c) phase image of in-plane velocities. Images shown are raw DICOM data prior to anti-aliasing processing, and represent the S1 location.
Numerical Simulations
We discretized the 3D geometry in Fig. 1c into an isotropic finite element mesh containing approximately 600,000 linear tetrahedral elements with maximum edge size 0.3 mm using commercial mesh generation software (MESHSIM, Simmetrix, Inc., NY). This mesh resolution was similar or finer than those in previous studies.9,15,17,26 Employing a Womersley velocity profile, we mapped the PCMRI measured flow waveform averaged between S1 and S2 to the inlet of the numerical domain as a Dirichlet boundary condition. For the rigid-wall simulations, we prescribed zero pressure boundary condition at the outlet face since (1) the numerical domain has one single outlet thus there is no concern for the flow split to different outlets, and (2) in a rigid phantom the pressure offset in the domain does not influence flow velocity which is the quantity of interest in this study. For the deformable-wall simulation, we simulated the resting case and prescribed a time-varying resistance at the outlet boundary. The resistance waveform was derived using the pressure and flow waveforms from the same previous CFD simulation described above which was tuned to patient-specific clinical measurements.32 The vessel wall thickness and Young’s modulus was set to 0.8 mm and 4 × 10⁶ dynes/cm2, respectively, which are values in the same range as previous literature reports.13,20 The rigid simulations were used to compare against the experimental measurements as part of the validation, and the deformable simulation was compared against the corresponding rigid simulation to quantify the effects of adding deformability. We performed the CFD simulations using a custom stabilized finite element software (Simvascular, www.simtk.org) to solve the incompressible Navier–Stokes equations, assuming a Newtonian fluid with a density of 1.1 g/cm3 and a dynamic viscosity of 0.045 dyn s/cm2 reflecting the properties of the blood mimic used in the experiment. The deformability of the wall was incorporated using a coupled momentum method which adopts a fixed fluid mesh with nonzero fluid velocities at the fluid–solid interface, and a linearized kinematics formulation for the solid domain.5 For each rigid-wall simulation we simulated 4000 time steps using 1 ms time step size. For the deformable-wall simulation we simulated 12,000 time steps using 0.5 ms time step size. The last cardiac cycle of data where periodicity had stabilized were used in the final analysis.
2D QUANTITATIVE ANALYSIS
An image subtraction method was used to obtain 2D quantitative comparisons between simulated and measured velocities. For each slice location, we used open source software Paraview (www.paraview.org) to perform manual alignment of the VTK files compiled from simulation results and PCMRI data. The resulting 2D maps of through-plane velocities at each slice location were saved as greyscale TIF images with a pixel intensity resolution of 400, which corresponds to a velocity resolution of Venc/200. We then subtracted the TIF images resulting from the simulation results and PCMRI data to obtain the through-plane velocity difference maps.
RESULTS
Figure 4 shows volumetric flow rate comparisons between PCMRI measurements at the two slice locations, and ultrasonic flow probe measurements. There is good agreement between all three measurements. The average flow measured at S1, S2, and by the flow probe are 1.0, 0.99, and 1.02 cc/s, respectively (3.7% maximum difference), for the resting condition, and 1.92, 1.98, and 1.97 cc/s, respectively (2.85% maximum difference), for the exercise condition. The maximum difference between any of the three flow rate measurements for both flow conditions at any time points is always less than 10%.
FIGURE 4.
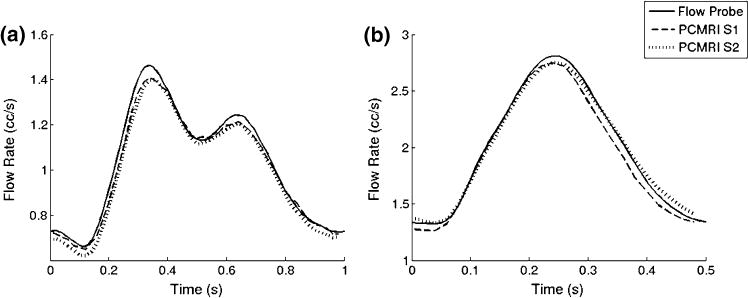
Flow rates measured by PCMRI at different slice planes, and by ultrasonic flow probe for (a) resting condition and (b) exercise condition.
Figure 5 shows 2D 3-component flow velocity comparisons between PCMRI measurements and CFD simulation, as well as the corresponding velocity difference maps, under resting flow condition. There is in general good qualitative agreement in the flow patterns. For the S1 location, the shape and size of regions of higher and lower velocities agree at all of the time points, and also show good agreement in magnitudes. Both CFD and PCMRI clearly show in-plane counter-directional swirls that form at peak flow. The difference maps show that the velocity discrepancy is higher in regions with higher velocities. The S2 location has higher velocities in general, due to its smaller area. Since the aneurysm at the S2 location is smaller, the flow pattern is simpler and more similar to normal flow in blood vessels. The velocity differences between PCMRI and CFD are smaller than at the S1 location, and the difference is not augmented in the higher velocity regions. There is a thin partial ring of higher differences around the edge of the slice, possibly due to slight spatial misalignment of the PCMRI and CFD data.
FIGURE 5.
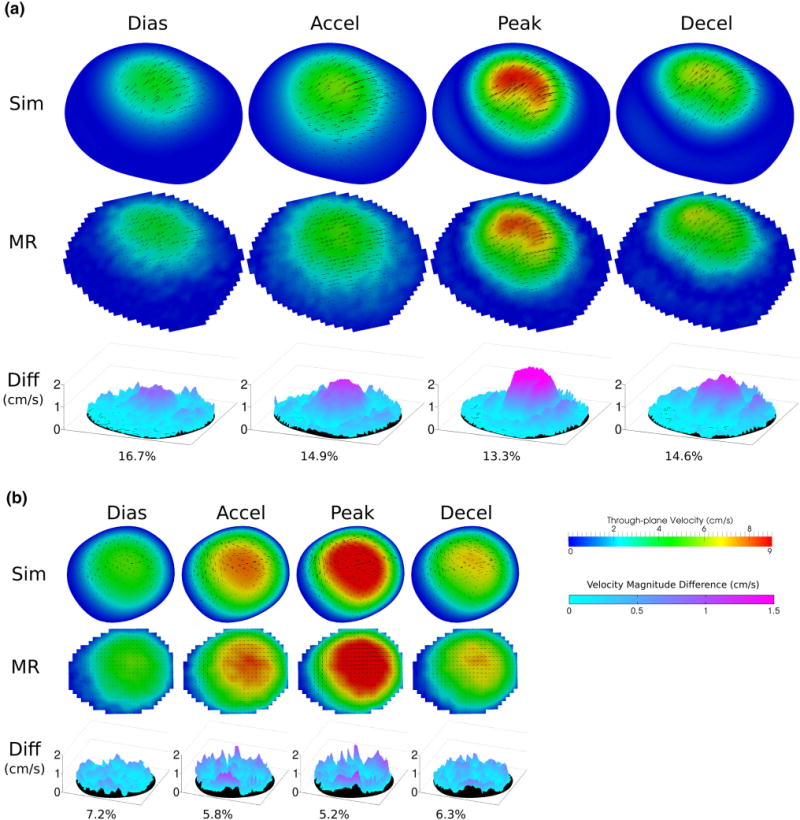
Resting condition flow velocity comparisons: between MR measurements and simulation results at diastole, acceleration, peak, and deceleration time point at slice locations (a) S1 and (b) S2. Color map and arrows correspond to through-plane and in-plane velocities, respectively. Velocity magnitude differences across the slices are shown as 3D surface plots. Percent difference in velocity magnitude averaged across the slice are also shown.
Figure 6 shows the 2D velocity comparisons under exercise flow condition. There is excellent qualitative comparison in both the large and small features in the flow velocity patterns, as well as the velocity magnitudes. For the S1 location, the flow velocity pattern is much more complex than that of the resting condition. Both PCMRI and CFD capture a C-shaped high through-plane velocity region at peak flow, as well as an irregular, non-symmetric medium through-plane velocity region at deceleration, of the same shape, size, and orientation. The difference maps show larger discrepancies in part of the higher velocity regions. For the S2 location, the flow pattern and velocity comparison results are similar to that of the resting condition.
FIGURE 6.
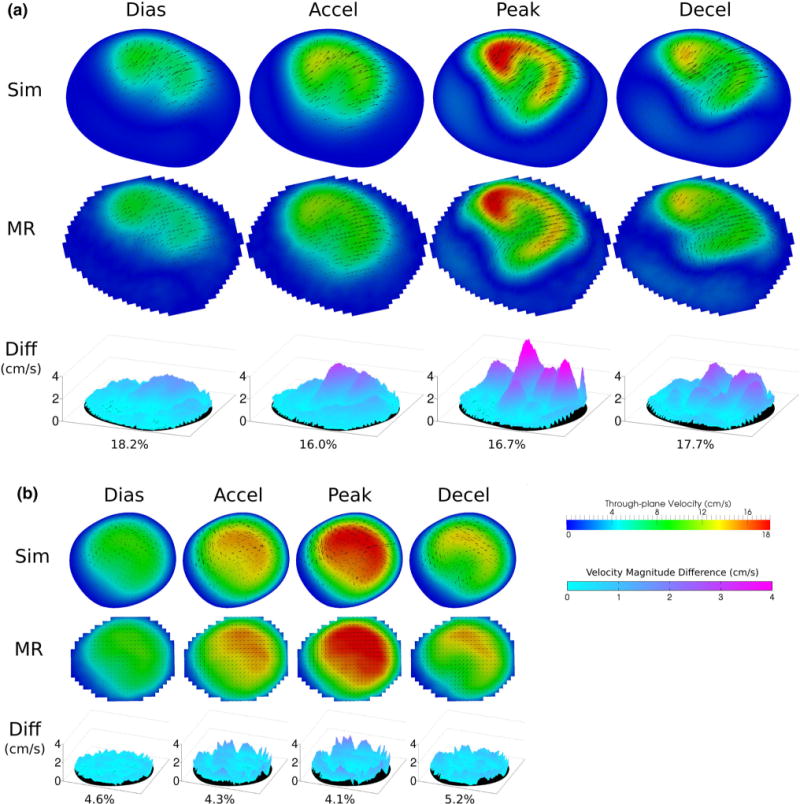
Exercise condition flow velocity comparisons: between MR measurements and simulation results at diastole, acceleration, peak, and deceleration time point at slice locations (a) S1 and (b) S2. Color map and arrows correspond to through-plane and in-plane velocities, respectively. Velocity magnitude differences across the slices are shown as 3D surface plots. Percent difference in velocity magnitude averaged across the slice are also shown.
Figure 7a shows time traces of the velocity difference between MR and CFD averaged across the slice planes. When examined with a reference to the corresponding flow waveform over the cardiac cycle shown at the bottom of the figure, there is an evident positive correlation between velocity difference and flow rate. For each slice location, the velocity difference also increases from resting to exercise, further signifying that higher flow rate results in higher velocity difference between PCMRI and CFD. However, when the velocity difference is examined as a percentage of the velocity, rather than as an absolute difference, the correlation to flow rate vanishes. Figure 7b shows the time tracings of the velocity difference presented as a percentage of the mean velocity across the slice planes. We observe that the percent velocity difference is relatively constant over the cardiac cycle and uncorrelated to the flow waveform. The percent velocity difference at each slice location also does not change between resting and exercise flow conditions, further signifying its independence from flow velocity. This suggests that the agreement between CFD and PCMRI velocities is dependent predominately on the local geometry, and not on flow conditions.
FIGURE 7.
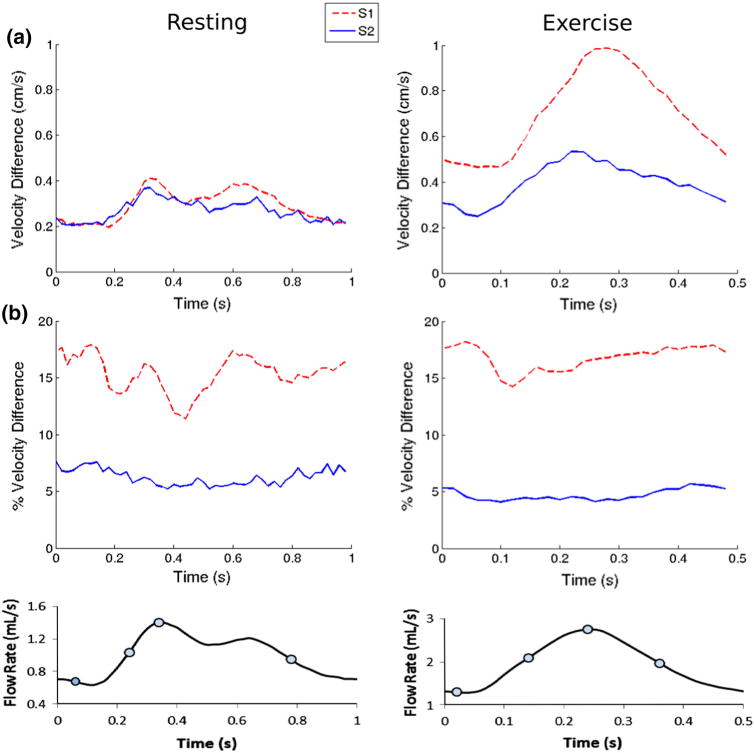
Measured and simulated velocity difference (averaged across the slice planes) vs. time. (a) Absolute velocity difference and (b) percent velocity difference. Only the absolute difference waveforms are correlated with the flow waveforms.
Figure 8 is a quantitative comparison of the PCMRI and CFD velocity profile at different time points over a line on each slice location as depicted in Fig. 2c. Each plot shows the percent difference in the velocities between PCMRI and CFD averaged across the line. There is good agreement between PCMRI and CFD in all features of the velocity profiles including their general shapes, the number and locations of peaks, and their slopes across the spatial dimension. The few visible discrepancies in peak amplitudes in the velocity profile show higher CFD predictions compared to PCMRI measurements. The velocity profiles at the S2 location exhibit simpler shapes as well as better agreements between CFD and PCMRI. There are similar levels of agreement in velocity profile features under resting and exercise flow conditions.
FIGURE 8.
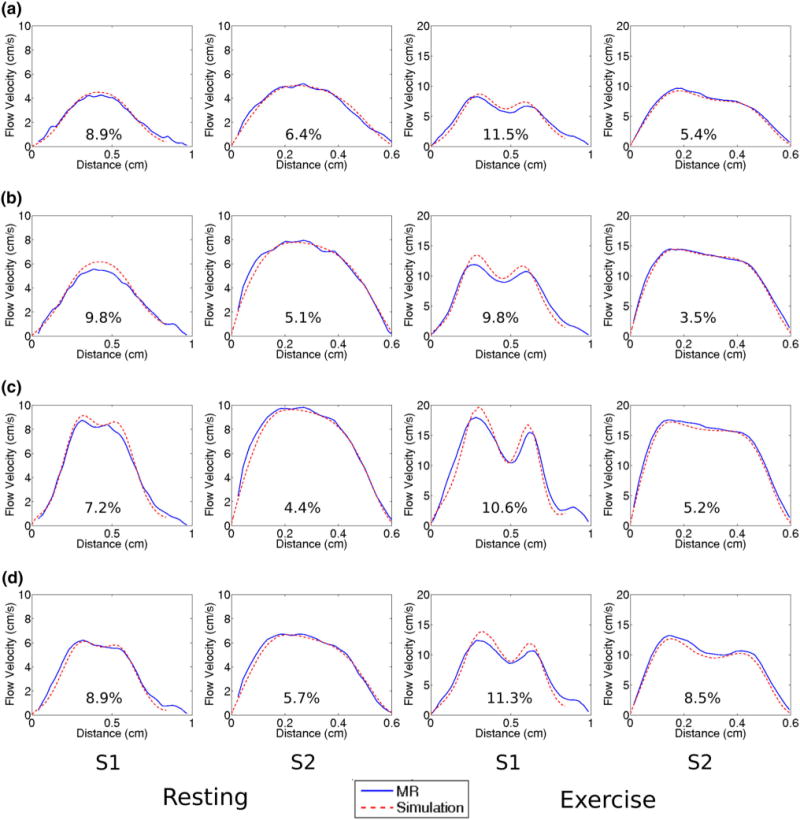
Comparisons of MR and CFD velocity profiles across a line as defined in Fig. 2c at each slice location, at time points (a) diastole, (b) acceleration, (c) peak, and (d) deceleration. Percent difference between MR and CFD averaged across the line are also shown.
Quantitative experimental validation of CFD in previous studies have used 1D comparisons of velocity,2,26 or 2D comparisons of velocity-derived quantities.9 We investigate how the methods of 1D and 2D validation approaches may possibly affect conclusions. Table 1 shows whole-cycle averaged percent differences in velocity when spatially averaged across a line, and when spatially averaged across a whole slice plane. For the S2 location, where velocity patterns are simple and there are consistently high velocities across the plane, the slice and line averages are similar, for both flow conditions. For the S1 location, where complex velocity patterns include distinct regions of high and low velocities, the slice and line averages exhibit greater variations with each other. In all cases, there is little difference between the resting and exercise flow conditions, and the S1 location always returns higher velocity discrepancy than the S2 location.
TABLE 1.
Percent difference in velocity magnitude temporally and spatially averaged over the cardiac cycle, and across a slice or line as depicted in Fig. 2.
| Resting
|
Exercise
|
|||||
|---|---|---|---|---|---|---|
| S1 | S2 | S1 | S2 | |||
| Slice average (%) | 15.37 | 6.24 | 16.77 | 4.71 | ||
| Line average (%) | 9.39 | 5.21 | 10.38 | 5.73 | ||
Comparing the WSS differences between the rigid and deformable simulations, we found a difference of 8.5 and 16.3% (averaged across the cardiac cycle) in the proximal and distal aneurysms, respectively. The deformable simulation on average exhibited lower WSS than the rigid simulation. The finding that the incorporation of vessel deformation affects WSS in the proximal regions more significantly than in the proximal regions is consistent with previous literature.35
DISCUSSION
The velocity patterns in aneurysms caused by KD affect the residence time of red blood cells, the recirculation of chemical and biological factors in the blood, and the vessel WSS, which have all been speculated to be associated with thrombotic risk. Preliminary studies simulating flow conditions in KD have recently shown that these hemodynamic factors may be better predictors of thrombotic risk than aneurysm diameter alone.4,32 However, validation of simulations in realistic coronary aneurysm geometries with physiologic flow conditions has not been previously performed. Validation is key to supporting the continued development of CFD tools in support of KD patient management. While validation must ultimately include comparisons with both in vitro and in vivo flow conditions, this study takes an important first step by quantitatively comparing simulations with in vitro data.
In this study, we performed the first experimental validation of CFD applied to a coronary aneurysm anatomy, using PCMRI and a physical phantom with patient-specific geometry operating in a flow system under realistic resting and exercise conditions. We implemented a novel analysis technique to compute quantitative differences between experimental measurements and simulation results of velocity across 2D slices that have different spatial resolutions. While there is extensive literature on validation of cardiovascular flows, surprisingly few previous validation studies included detailed quantitative comparisons. Hoi et al.9 found an 18% difference between PIV measured and CFD simulated positive circulation (which is a velocity-derived quantity) over 2D analysis planes in a cerebral aneurysm anatomy. In this study, we found a 5–17% difference between PCMRI measured and CFD simulated velocities, using both 1D and 2D quantitative comparisons.
The close agreement between PCMRI measured volumetric flow rates at different slice locations, and the ultrasonic flow probe measured flow rates indicates both the precision and the reliability of the PCMRI measurements in the experiment. A discrepancy of <10% between all of the measurements was both within the specified accuracy of the flow probe, and consistent with previously reported accuracy of PCMRI flow measurement.17,19,22
There was generally excellent qualitative agreement in flow pattern features including large simple shapes and smaller complex details, demonstrating the accuracy of the CFD simulations in capturing the general flow physics. At a given slice location, the absolute difference in velocity between PCMRI and CFD appears proportional to the flow velocity both spatially and temporally. We further report that such a correlation also results in a percent discrepancy that stays constant regardless of flow velocity variations. This suggests that the discrepancies may originate from small qualitative mismatches of flow features (in location and shape) that are consistent throughout different flow conditions. Consistent mismatches of this kind would lead to higher absolute discrepancies at higher overall velocities, but a consistent percent discrepancy regardless of flow velocities. Compared to the S2 location, we indeed observe higher percent discrepancies in the S1 location, which has a larger area and more complex flow patterns, providing more room for flow feature mismatches. The finding that the percent discrepancy is dependent mainly on slice location, but not on flow conditions, is consistent with previous literature reports concluding that the level of agreement between experimentally measured and CFD simulated velocities correlated mainly with the local geometry.17 The presence of complex flow patterns, and comparison discrepancies in the upstream S1 location did not seem to affect the predictability of velocities downstream at the S2 location. This is also consistent with findings in previous literature.17,18
The analysis presented in this study provides insights regarding the approaches of quantitative validation using either 1D or 2D comparisons. The 1D comparison in this study is done over a line that cuts across the highest flow regions in the slices. The fact that the S1 slice contains prominent regions of stagnant flow, and that the percent discrepancies averaged across the slice are consistently higher than those averaged across the line, suggest that the stagnant flow regions contribute to increase the percent discrepancy in the validation comparison. The S2 location on the other hand, contains consistently high velocities across the whole slice, and no significant differences in the percent discrepancy between velocities averaged across the slice or the line, which further supports the same hypothesis. An explanation for this phenomenon may be that, in regions of stagnant flow with velocities close to zero, a very small absolute discrepancy in velocity comparison can result in a very large percent discrepancy, which can then contribute significantly to the average across the slice. When interpreting validation results, it is worthwhile to consider whether the contribution of discrepancies from the stagnant flow regions should be included, depending on the particular goals of the analysis. However, regardless of the 1D or 2D quantitative validation approach, there is consistent conclusion that a location with simpler flow patterns results in better agreement between CFD and experimental data.
For assessing thrombotic risk in KD aneurysms, WSS is a relevant quantity of interest. Since only the velocities near the vessel walls have direct impacts on WSS calculations, velocity errors which occur mainly near the center of the vessel lumen will have minimal impact on WSS calculations. In this study, the larger aneurysm with pronounced re-circulation and complex flow (where thrombosis is more likely to occur) exhibit flow velocities which are low around the vessel wall, and velocity errors which are mainly concentrated near the center of the vessel lumen. This suggests that in the regions of high thrombotic risk, the errors in WSS resulting from velocity errors may be minimized.
There were several potential sources of errors in this study. The physical phantom was constructed based on the computational 3D model that was also directly used in the CFD simulations. Tolerances in the phantom construction could lead to geometrical differences between the physical experiment and CFD simulations, which can then influence results. Although some previous studies have found minimal impact on simulated flow velocities due to slight geometric perturbations,14 others have found larger effects when the geometry contains a stenotic region.33 In regions of stagnant flow, noise in the PCMRI measurement produces non-zero velocities which can contribute to errors in the validation comparison. The PCMRI measurements were acquired over hundreds of cardiac cycles with the assumption of cycle periodicity. Using the ultrasonic flow probe measurements, we confirmed that the pulsatile pump produced highly periodic flow rates. However, there were still small occasional cycle-to-cycle variations in the pulsatile pump output which could affect the PCMRI data integrity. The 1D velocity profile comparisons show that CFD tends to predict higher peaks, suggesting that there may be cycle-to-cycle velocity pattern variations, which over time would damp out the spatial peaks in the PCMRI measurement leading to such differences in the comparisons even if the volumetric flow rate through the phantom is periodic. An ensemble average of the simulation results over a larger number of cycles may provide better comparisons to the PCMRI data, but would require higher computational expense. The PCMRI data have lower spatial resolution compared to that in the CFD results, and the mismatch in spatial resolution can contribute to the 1D and 2D quantitative comparison differences. The PCMRI data were acquired using a 1 mm slice thickness, where the CFD mesh had a 0.3 mm maximum edge size, and the data were projected onto the analysis planes by linear interpolation using the nearest nodes. The spatial averaging of the PCMRI data in the through-plane direction could be a potential contribution to the differences in the validation comparisons. However, it has been previously found that no significant qualitative differences in velocity contours resulted from offsetting a slice plane in the through-plane direction by approximately 1/10 of the slice diameter,17 also that little difference in the validation comparison resulted from spatial averaging CFD simulation data in the through-plane direction to mimic PCMRI data resolution.14 Lastly, we estimate that the precision of the slice location alignment, and the slice and line alignments for the 2D and 1D comparison, between the imaging data and CFD results, was 0.5 and 0.3 mm, respectively.
A special consideration involving 3D computational modeling of the coronaries is the translational and radial movement of the blood vessel walls over the cardiac cycle due to heart contraction. A few prior studies have examined the hemodynamic impacts of coronary vessel wall motion. Zeng et al.35 compared moving-wall simulations of the right coronary artery incorporating both translational and expansional wall motion, against rigid-wall simulations of the same anatomy, and quantified differences in WSS. They found very little impact from wall motion on the bounds of the WSS magnitude and the temporal gradient of the local WSS. They also concluded that the WSS difference between rigid and deformable simulations was negligible in the proximal regions of the CFD domain, and that the more apparent WSS difference in the distal regions required further investigation to determine whether it was an artifact of the branchless geometry used in the simulations. It is likely that the effects on WSS from compliant walls are due to mass conservation and the subsequent flow waveform damping, which has been shown to increase down the length of a deformable vessel.16 Santamarina et al.30 examined the effects of translational movements in idealized coronary vessels, and have also found little hemodynamic impact in the proximal region (within 10 tube diameters) of the vessels from translational movements. In this study, we also found a smaller deformation-induced WSS impact in the proximal region compared to the distal region. These findings suggest that with a combination of careful selection of CFD domain bounds and appropriate proximal boundary conditions, hemodynamics in the coronaries may be reasonably well-captured via rigid-wall simulations. However, different simulation approaches including moving-wall simulations should continue to be investigated in the future to fully capture coronary hemodynamics. In order to adequately prescribe coronary vessel translation and radial expansion, high-resolution time-resolved CT images which are not clinical standard of care are required. Experimental setup of a deformable wall coronary representation would also require construction of precisely-controlled time-varying outflow resistances to mimic the cyclic changing resistances of the coronary vascular bed, and produce the unique out-of-phase pressure and flow waveforms characteristic of the coronary arteries. Due to these significant challenges which we cannot address with our currently available resources, we have focused the present study on CFD simulations with rigid walls. We perform this validation study to provide a quantitative evaluation for current and past simulations which have used rigid walls to model the coronaries.13,29,32
In conclusion, using a well-controlled in vitro experiment, this study has demonstrated that CFD can produce good qualitative and quantitative predictions of velocities in a realistic coronary aneurysm under physiological flow conditions. The results provide an estimate of CFD prediction agreements to experimental data in the relevant anatomies, and insights on factors that may influence the level of agreement between simulation and measurements. This work also contributes a set of in vitro experimental data that can be used by others to compare against CFD simulation results. Furthermore, the findings of this study increase confidence in the use of CFD for investigating hemodynamics in the specialized anatomy of coronary aneurysms caused by KD.
Acknowledgments
The authors would like to thank Robert Bussell for assistance with MR imaging, and the University of Texas at El Paso for the phantom construction. This work was supported by the National Institutes of Health Heart, Lung and Blood Institute (HL102596A), and a Burroughs Wellcome Fund Career Award at the Scientific Interface.
Footnotes
CONFLICT OF INTEREST
Ethan Kung, Andrew M. Kahn, Jane C. Burns, and Alison Marsden declare that they have no conflict of interest.
HUMAN STUDIES/INFORMED CONSENT
All imaging and patient data was collected under a protocol approved by the Institutional Review Board of University of California San Diego.
ANIMAL STUDIES
No animal studies were carried out by the authors for this article.
References
- 1.Acevedo-Bolton G, Jou LD, Dispensa BP, Lawton MT, Higashida RT, Martin AJ, Young WL, Saloner D. Estimating the hemodynamic impact of interventional treatments of aneurysms: numerical simulation with experimental validation: technical case report. Neurosurgery. 2006;59(2):E429–E430. doi: 10.1227/01.NEU.0000223495.39240.9A. author reply E429–E430. [DOI] [PubMed] [Google Scholar]
- 2.Bertolotti C, Deplano V, Fuseri J, Dupouy P. Numerical and experimental models of post-operative realistic flows in stenosed coronary bypasses. J Biomech. 2001;34(8):1049–1064. doi: 10.1016/s0021-9290(01)00027-6. [DOI] [PubMed] [Google Scholar]
- 3.Botnar R, Rappitsch G, Scheidegger MB, Liepsch D, Perktold K, Boesiger P. Hemodynamics in the carotid artery bifurcation: a comparison between numerical simulations and in vitro MRI measurements. J Biomech. 2000;33(2):137–144. doi: 10.1016/s0021-9290(99)00164-5. [DOI] [PubMed] [Google Scholar]
- 4.Esmaily-Moghadam M, Hsia TY, Marsden AL. A non-discrete method for computation of residence time in fluid mechanics simulations. Phys Fluids. 2013;25(11):110802. doi: 10.1063/1.4819142. [DOI] [PMC free article] [PubMed] [Google Scholar]
- 5.Figueroa CA, Vignon-Clementel IE, Jansen KE, Hughes TJR, Taylor CA. A coupled momentum method for modeling blood flow in three-dimensional deformable arteries. Comput Methods Appl Mech Eng. 2006;195(41–43):5685–5706. [Google Scholar]
- 6.Ford MD, Nikolov HN, Milner JS, Lownie SP, Demont EM, Kalata W, Loth F, Holdsworth DW, Steinman DA. PIV-measured versus CFD-predicted flow dynamics in anatomically realistic cerebral aneurysm models. J Biomech Eng. 2008;130(2):021015. doi: 10.1115/1.2900724. [DOI] [PubMed] [Google Scholar]
- 7.Frauenfelder T, Lotfey M, Boehm T, Wildermuth S. Computational fluid dynamics: hemodynamic changes in abdominal aortic aneurysm after stent-graft implantation. Cardiovasc Intervent Radiol. 2006;29(4):613–623. doi: 10.1007/s00270-005-0227-5. [DOI] [PubMed] [Google Scholar]
- 8.Gordon J, Kahn A, Burns J. When children with kawasaki disease grow up myocardial and vascular complications in adulthood. J Am Coll Cardiol. 2009;54(21):1911–1920. doi: 10.1016/j.jacc.2009.04.102. [DOI] [PMC free article] [PubMed] [Google Scholar]
- 9.Hoi Y, Woodward SH, Kim M, Taulbee DB, Meng H. Validation of CFD simulations of cerebral aneurysms with implication of geometric variations. J Biomech Eng. 2006;128(6):844–851. doi: 10.1115/1.2354209. [DOI] [PMC free article] [PubMed] [Google Scholar]
- 10.Holman R, Belay E, Christensen K, Folkema A, Steiner C, Schonberger L. Hospitalizations for Kawasaki syndrome among children in the United States, 1997–2007. Pediatr Infect Dis J. 2010;29(6):483–488. doi: 10.1097/INF.0b013e3181cf8705. [DOI] [PubMed] [Google Scholar]
- 11.Kato H, Sugimura T, Akagi T, Sato N, Hashino K, Maeno Y, Kazue T, Eto G, Yamakawa R. Long-term consequences of Kawasaki disease—a 10- to 21-year follow-up study of 594 patients. Circulation. 1996;94(6):1379–1385. doi: 10.1161/01.cir.94.6.1379. [DOI] [PubMed] [Google Scholar]
- 12.Khunatorn Y, Shandas R, DeGroff C, Mahalingam S. Comparison of in vitro velocity measurements in a scaled total cavopulmonary connection with computational predictions. Ann Biomed Eng. 2003;31(7):810–822. doi: 10.1114/1.1584684. [DOI] [PubMed] [Google Scholar]
- 13.Kim HJ, Vignon-Clementel IE, Coogan JS, Figueroa CA, Jansen KE, Taylor CA. Patient-specific modeling of blood flow and pressure in human coronary arteries. Ann Biomed Eng. 2010;38(10):3195–3209. doi: 10.1007/s10439-010-0083-6. [DOI] [PubMed] [Google Scholar]
- 14.Ku JP, Elkins CJ, Taylor CA. Comparison of CFD and MRI flow and velocities in an in vitro large artery bypass graft model. Ann Biomed Eng. 2005;33(3):257–269. doi: 10.1007/s10439-005-1729-7. [DOI] [PubMed] [Google Scholar]
- 15.Kung E, Baretta A, Baker C, Arbia G, Biglino G, Corsini C, Schievano S, Vignon-Clementel IE, Dubini G, Pennati G. Predictive modeling of the virtual Hemi-Fontan operation for second stage single ventricle palliation: two patient-specific cases. J Biomech. 2012;46(2):423–429. doi: 10.1016/j.jbiomech.2012.10.023. [DOI] [PubMed] [Google Scholar]
- 16.Kung E, Les A, Figueroa CA, Medina F, Arcaute K, Wicker R, McConnell M, Taylor C. In vitro validation of finite element analysis of blood flow in deformable models. Ann Biomed Eng. 2011;39(7):1947–1960. doi: 10.1007/s10439-011-0284-7. [DOI] [PMC free article] [PubMed] [Google Scholar]
- 17.Kung EO, Les AS, Medina F, Wicker RB, McConnell MV, Taylor CA. In vitro validation of finite-element model of AAA hemodynamics incorporating realistic outlet boundary conditions. J Biomech Eng. 2011;133(4):041003. doi: 10.1115/1.4003526. [DOI] [PMC free article] [PubMed] [Google Scholar]
- 18.Les AS, Shadden SC, Figueroa CA, Park JM, Tedesco MM, Herfkens RJ, Dalman RL, Taylor CA. Quantification of hemodynamics in abdominal aortic aneurysms during rest and exercise using magnetic resonance imaging and computational fluid dynamics. Ann Biomed Eng. 2010;38(4):1288–1313. doi: 10.1007/s10439-010-9949-x. [DOI] [PMC free article] [PubMed] [Google Scholar]
- 19.Lotz J, Meier C, Leppert A, Galanski M. Cardiovascular flow measurement with phase-contrast MR imaging: basic facts and implementation. Radiographics. 2002;22(3):651–671. doi: 10.1148/radiographics.22.3.g02ma11651. [DOI] [PubMed] [Google Scholar]
- 20.Lu X, Pandit A, Kassab G. Biaxial incremental homeostatic elastic moduli of coronary artery: two-layer model. Am J Physiol Heart Circ Physiol. 2004;287(4):H1663–H1669. doi: 10.1152/ajpheart.00226.2004. [DOI] [PubMed] [Google Scholar]
- 21.Marshall I, Zhao S, Papathanasopoulou P, Hoskins P, Xu Y. MRI and CFD studies of pulsatile flow in healthy and stenosed carotid bifurcation models. J Biomech. 2004;37(5):679–687. doi: 10.1016/j.jbiomech.2003.09.032. [DOI] [PubMed] [Google Scholar]
- 22.McCauley TR, Pena CS, Holland CK, Price TB, Gore JC. Validation of volume flow measurements with cine phase-contrast MR imaging for peripheral arterial waveforms. J Magn Reson Imaging. 1995;5(6):663–668. doi: 10.1002/jmri.1880050608. [DOI] [PubMed] [Google Scholar]
- 23.Nakamura Y, Yashiro M, Uehara R, Sadakane A, Tsuboi S, Aoyama Y, Kotani K, Tsogzolbaatar EO, Yanagawa H. Epidemiologic features of Kawasaki disease in Japan: results of the 2009–2010 nationwide survey. J Epidemiol. 2012;22(3):216–221. doi: 10.2188/jea.JE20110126. [DOI] [PMC free article] [PubMed] [Google Scholar]
- 24.Newburger J, Takahashi M, Beiser A, Burns J, Bastian J, Chung K, Colan S, Duffy C, Fulton D, Glode M, et al. A single intravenous-infusion of gamma-globulin as compared with 4 infusions in the treatment of acute kawasaki syndrome. N Engl J Med. 1991;324(23):1633–1639. doi: 10.1056/NEJM199106063242305. [DOI] [PubMed] [Google Scholar]
- 25.Newburger JW, Takahashi M, Gerber MA, Gewitz MH, Tani LY, Burns JC, Shulman ST, Bolger AF, Ferrieri P, Baltimore RS, et al. Diagnosis, treatment, and long-term management of Kawasaki disease: a statement for health professionals from the Committee on Rheumatic Fever, Endocarditis, and Kawasaki Disease, Council on Cardiovascular Disease in the Young, American Heart Association. Pediatrics. 2004;114(6):1708–1733. doi: 10.1542/peds.2004-2182. [DOI] [PubMed] [Google Scholar]
- 26.Papathanasopoulou P, Zhao S, Kohler U, Robertson MB, Long Q, Hoskins P, Xu XY, Marshall I. MRI measurement of time-resolved wall shear stress vectors in a carotid bifurcation model, and comparison with CFD predictions. J Magn Reson Imaging. 2003;17(2):153–162. doi: 10.1002/jmri.10243. [DOI] [PubMed] [Google Scholar]
- 27.Pekkan K, de Zelicourt D, Ge L, Sotiropoulos F, Frakes D, Fogel MA, Yoganathan AP. Physics-driven CFD modeling of complex anatomical cardiovascular flows—a TCPC case study. Ann Biomed Eng. 2005;33(3):284–300. doi: 10.1007/s10439-005-1731-0. [DOI] [PubMed] [Google Scholar]
- 28.Ryu K, Healy TM, Ensley AE, Sharma S, Lucas C, Yoganathan AP. Importance of accurate geometry in the study of the total cavopulmonary connection: computational simulations and in vitro experiments. Ann Biomed Eng. 2001;29(10):844–853. doi: 10.1114/1.1408930. [DOI] [PubMed] [Google Scholar]
- 29.Sankaran S, Moghadam M, Kahn A, Tseng E, Guccione J, Marsden A. Patient-specific multiscale modeling of blood flow for coronary artery bypass graft surgery. Ann Biomed Eng. 2012;40(10):2228–2242. doi: 10.1007/s10439-012-0579-3. [DOI] [PMC free article] [PubMed] [Google Scholar]
- 30.Santamarina A, Weydahl E, Siegel J, Moore J. Computational analysis of flow in a curved tube model of the coronary arteries: effects of time-varying curvature. Ann Biomed Eng. 1998;26(6):944–954. doi: 10.1114/1.113. [DOI] [PubMed] [Google Scholar]
- 31.Schmidt J, Delp S, Sherman M, Taylor C, Pande V, Altman R. The Simbios National Center: systems biology in motion. Proc IEEE. 2008;96(8):1266–1280. doi: 10.1109/JPROC.2008.925454. [DOI] [PMC free article] [PubMed] [Google Scholar]
- 32.Sengupta D, Kahn A, Burns J, Sankaran S, Shadden S, Marsden A. Image-based modeling of hemodynamics in coronary artery aneurysms caused by Kawasaki disease. Biomech Model Mechanobiol. 2012;11(6):915–932. doi: 10.1007/s10237-011-0361-8. [DOI] [PMC free article] [PubMed] [Google Scholar]
- 33.Steinman DA, Hoi Y, Fahy P, Morris L, Walsh MT, Aristokleous N, Anayiotos AS, Papaharilaou Y, Arzani A, Shadden SC, et al. Variability of computational fluid dynamics solutions for pressure and flow in a giant aneurysm. The ASME 2012 Summer Bioengineering Conference CFD Challenge. 2013;135(2):021016. doi: 10.1115/1.4023382. [DOI] [PubMed] [Google Scholar]
- 34.Wang C, Pekkan K, de Zelicourt D, Horner M, Parihar A, Kulkarni A, Yoganathan AP. Progress in the CFD modeling of flow instabilities in anatomical total cavopulmonary connections. Ann Biomed Eng. 2007;35(11):1840–1856. doi: 10.1007/s10439-007-9356-0. [DOI] [PubMed] [Google Scholar]
- 35.Zeng D, Boutsianis E, Ammann M, Boomsma K, Wildermuth S, Poulikakos D. A study on the compliance of a right coronary artery and its impact on wall shear stress. J Biomech Eng Trans ASME. 2008;130(4):014014. doi: 10.1115/1.2937744. [DOI] [PubMed] [Google Scholar]
- 36.Zhao SZ, Papathanasopoulou P, Long Q, Marshall I, Xu XY. Comparative study of magnetic resonance imaging and image-based computational fluid dynamics for quantification of pulsatile flow in a carotid bifurcation phantom. Ann Biomed Eng. 2003;31(8):962–971. doi: 10.1114/1.1590664. [DOI] [PubMed] [Google Scholar]


