

Abstract
Autoradiographs are conventionally analyzed by a region-of-interest (ROI) analysis. However, definition of ROIs on an image set is labor intensive, is subject to potential inter-rater bias, and is not well suited for anatomically variable structures that may not consistently correspond to specific ROIs. Most importantly, the ROI method is poorly suited for whole-brain analysis, where one wishes to detect all activations resulting from an experimental paradigm. A system developed for analysis of imaging data in humans, Statistical Parametric Mapping (SPM), avoids some of these limitations but has not previously been adapted as a tool for the analysis of autoradiographs. Here, we describe the application of SPM to an autoradiographic data set mapping cerebral activation in rats during treadmill walking. We studied freely moving, non-tethered rats that received injections of the cerebral blood flow tracer [14C]-iodoantipyrine, while they were performing a treadmill task (n = 7) or during a quiescent control condition (n = 6). Results obtained with SPM were compared to those previously reported using a standard ROI-based method of analysis [J. Cereb. Blood Flow Metab. 23(2003) 925]. The SPM method confirmed most areas detected as significant using the ROI approach. However, in the subcortex, SPM detected additional significant regions that, because of their irregular structures, fell short of statistical significance when analyzed by ROI. The SPM approach offers the ability to perform a semi-automated whole-brain analysis, and coupled with autoradiography, provides an effective means to globally localize functional activity in small animals.
Keywords: Statistical parametric mapping, Autoradiography, Cerebral blood flow, Rats
Introduction
Autoradiography, because it provides high-resolution anatomic and functional images, is a technique ideally suited for experimental paradigms in small animals. Conventionally, autoradiographs are analyzed manually by sampling regions of interest (ROI), the boundaries of which are based on definitions available in anatomic atlases. Such manual techniques are time consuming, as they require manual examination on a slice-by-slice basis of multiple regions for each experimental subject. The subjective nature inherent in defining the ROIs not only introduces a potential inter-rater bias to the image analysis, but also does not effectively detect functional changes in structures that do not anatomically correspond to predefined ROIs. Furthermore, ROI-based analyses are usually hypothesis-driven, and significant effects away from hypothesized ROIs are necessarily missed. While multivariate analysis can be applied to ROI data, a standardized method for evaluating the significance of individual ROI in whole-brain analyses has not been developed.
New image analysis techniques have addressed some of these limitations in exploring volumetric data sets. Autoradiographic sections can be reconstructed in three dimensions, and multiple specimens can be averaged, with group comparisons made using subtraction techniques (Hall et al., 1991; Hibbard et al., 1987; Zhao et al., 1995, 1996). Though these procedures are generally straightforward and circumvent the limitations of sampling predefined neuroanatomical regions, they do not adequately address the multiple comparison issue in simultaneously performing statistical analyses on a whole-brain basis. A better method would allow comprehensive three dimensional (3D) analyses, and accommodate a variety of experimental paradigms that involve multiple conditions and covariates.
Statistical Parametric Mapping (SPM) (Friston et al., 1991, 1994; Poline et al., 1995; Worsley et al., 1992), which was introduced in 1991, (Wellcome Department of Cognitive Neurology, Institute of Neurology, London, UK), is a collection of tools available in the public domain for basic visualization and analysis of neuroimages (http://www.fil.ion.ucl.ac.uk/spm/). It is applied routinely to the statistical analysis of human functional neuroimaging data obtained using positron emission tomography (PET), single-photon emission computed tomography (SPECT), and functional magnetic resonance imaging (fMRI). SPM facilitates a semiautomated, rapid, procedure for creating statistical images and localizing significant changes on a whole-brain basis by applying a general linear model such as ANOVA or ANCOVA to each voxel, and using statistical inference to interpret regionally specific responses based upon experimental factors. Because SPM is a whole-brain analysis, a correction for multiple comparisons is applied using Gaussian random field theory (Worsley et al., 1992). This method provides a means for correcting the P value for a voxel, cluster of voxels, or set of clusters, that takes into account the fact that neighboring voxels are not independent by virtue of anatomical and functional connections and the autocorrelation of the measurement process. This correction is much less conservative than a Bonferroni correction for independent statistical tests, and for an anatomically open hypothesis (i.e., a test of the null hypothesis that there is no effect anywhere in the brain), is therefore much more sensitive. SPM allows efficient exploration of large data sets, while circumventing the limited sampling of an ROI analysis. In addition, SPM contains tools for 3D visualization of images, which can be rotated or resliced in any plane to reveal the rich internal anatomical detail and spatial extent of cerebral activity.
This study assesses the feasibility of adapting the SPM method to an autoradiographic data set mapping cerebral activation during treadmill walking in rats. Results obtained with SPM (Version 2, SPM2) for this data set are compared to those previously reported using a standard ROI-based method of analysis (Holschneider et al., 2003).
Materials and methods
Measurement of changes in the regional cerebral blood flow-related tissue radioactivity
Male Sprague–Dawley rats (Harlan Sprague–Dawley Labs, Indianapolis, IN), weighing 350 – 375 g, were used under a protocol approved by the institutional animal research committee. As previously described (Holschneider et al., 2003), rats were trained over 3 weeks to run on the RotaRod (Columbus Instruments, Columbus, OH), a rotating cylindrical rod. Following the training period, animals underwent surgical implantation of a self-contained, implantable microbolus infusion pump (MIP), which allowed the administration by remote activation of a cerebral blood flow (CBF) radiotracer. Details of the design, surgical implantation, and radiotracer loading of the pump have been previously reported (Holschneider et al., 2002). In brief, the rats were anesthetized with halothane (2.0% induction, 1.3% maintenance). The right superior vena cava was cannulated via the external jugular vein with a 3.5 French silastic catheter. The distal end of the catheter was tunneled to the dorsum of the animal and connected subcutaneously to the MIP. On postoperative day 5, each animal was immobilized for 5 min in a rodent restrainer (Decapi-Cone, Braintree scientific, Braintree, MA). The MIP was loaded through a percutaneous port with [14C]-iodoantipyrine (100 μCi/kg in 300 μl of 0.9% saline, Amersham Biosciences, Piscataway, NJ). Thereafter, the euthanasia solution (1.0 ml of pentobarbital 50 mg/kg, 3 M potassium chloride) was loaded into the pump. After removal from the restraining device, animals were allowed to recover undisturbed for 45 min. Rats were then exposed under standard laboratory fluorescent light conditions, to slow walking on the RotaRod (n = 7) at a speed of 3.1 cm/s. Control animals (n = 6) remained undisturbed in a transport cage with a clear Plexiglas top, while being exposed to the sound of the rotating RotaRod. Triggering of the pump by remote activation occurred after a 2-min exposure to the locomotor or control paradigm, and resulted in release of the radiotracer into the animal’s circulation, followed a few seconds thereafter by the euthanasia agent. Injection of the euthanasia solution resulted within seconds in cardiac arrest, a precipitous fall of arterial blood pressure and termination of brain perfusion (Holschneider et al., 2002). When euthanasia occurs within a brief interval (approximately 10 s) following injection of the radiotracer, there is a strict linear proportionality between cerebral blood flow and tissue radioactivity (Jones et al., 1991; Patlak et al., 1984; Van Uitert and Levy, 1978).
Brains of the animals were rapidly removed, flash frozen in methylbutane at −70°C, and cut in a cryostat at −20°C in 20-μm-thick coronal sections, with an interslice spacing of 300 μm. Sections were heat dried on glass slides and exposed for 2 weeks at room temperature to Kodak Ektascan films in spring-loaded X-ray cassettes along with radioactive [14C] standards (Amersham Biosciences). Autoradiographs were digitized as 8-bit gray-scale images with a ChromaPro 45 IAIS “Dumas” film illumination system and a Phillips charge-coupled device monochrome imaging module coupled to a Flashpoint 128 digitizing board on a Dell Dimensions XPS R400 microcomputer. The 3D reconstruction of the digitized autoradiographs and their statistical analysis are outlined in Fig. 1 and further described below.
Fig. 1.

Flow chart for 3D reconstruction of autoradiographs and statistical parametric mapping analysis.
Slice realignment
SPM analysis requires realignment for each animal of all slices and reconstruction into a 3D volumetric image. For human data obtained with PET or fMRI, the planes are aligned by virtue of the acquisition. In our case, sectioning brains in a cryostat resulted in individual slices that, because they were obtained independently, had lost their correspondence to neighboring slices.
Sixty-three digitized serial coronal sections were selected starting at 4.3 mm anterior to bregma. An intensity-based threshold edge detection tool (Corel Photo-Paint, Version 10.4, Corel Corporation, Dallas, TX) was used to generate a mask of each coronal section. Each section was then cut out and centered onto a white background, and stored as a two-dimensional array of pixels (each 72 × 72 μm2). Adjacent sections were aligned using TurboReg, http://bigwww.epfl.ch/thevenaz/turboreg/) an automated pixel-based registration algorithm (Thevenaz et al., 1998). Using this algorithm each section was sequentially registered to the previous section and then used as a reference for the subsequent section to be aligned. TurboReg utilizes the intensity of all image pixels, and searches for the transformation that maximizes a measure of intensity-similarity between corresponding pixels. To preserve the shapes of the sections, we chose a non-warping geometric model that included rotations and translations (rigid-body transformation), and used nearest-neighbor interpolation. To constitute a 3D image, the aligned sections were imported as an image stack using ImageJ (NIH, Bethesda, MD—http://rsb.info.nih.gov/ij/) and saved in Analyze format (Mayo Clinic, Rochester, USA—http://www.mayo.edu/bir/). A header file was also created that contained the appropriate voxel dimensions, 72 × 72 × 300 μm3. The image gray scale was inverted to conform to conventions of human functional-imaging data.
Creation of the rat brain template
A requirement for whole-brain analysis is that the images of different brains must be spatially normalized into a standard space, which we defined by creating a template of the rat brain. We first chose a particular brain with a high degree of symmetry, alignment, and freedom from artifacts. Using the SPM software, this reference brain was smoothed with a Gaussian kernel of full width at half maximum (FWHM) equal to three times its voxel dimensions, so that artifacts from slice misalignment or any outstanding features of the brain would not bias the normalization. Next, each of the rat brains was spatially normalized to the smoothed reference brain. Spatial normalization, consisted of applying a 12-parameter affine transformation, followed by a non-linear spatial normalization using the low-frequency basis functions of the three-dimensional discrete cosine transform (7 × 7 × 8 in each direction for 1176 parameters), plus a linear intensity transformation (4 parameters) (Ashburner and Friston, 1999). This process was implemented in SPM, where the intensities from the original images were mapped into normalized images. In the warping procedure for creating the normalized images, the following SPM options were used: medium (membrane energy of the deformation field) regularization to moderately penalize large deformations, 16 iterations, and tri-linear interpolation. The images of the reference brain and 12 remaining normalized brains (all unsmoothed) were averaged to create a mean image. This image was smoothed with a Gaussian kernel (FWHM = 3 times the voxel dimensions) to create the rat brain template.
Statistical design and analysis in SPM
Before the statistical analysis, each of the original 3D reconstructed brains was spatially normalized to the rat brain template. Thus, our data were spatially normalized to create an average template (as described above), and then each brain was re-normalized to this average template. The normalized rat brains were individually smoothed with a Gaussian kernel (FWHM = 3 times the voxel dimensions). The reasons for smoothing were (1) to reduce the impact of misregistration of the data into the space of the template, (2) to allow for anatomical variability among the rat brains, (3) to satisfy the assumption of Gaussian random field theory that the data were a reasonable lattice representation of a smooth Gaussian field, and (4) to improve the signal to noise ratio. These criteria required that smoothness be substantially greater than voxel size. The matched filter theorem states that the optimal choice of smoothing kernel should match the signal to be detected (Rosenfeld and Kak, 1982). Thus, we optimized for scales of about 216 × 216 × 900 μm3, which was compatible with our estimate of misregistration error and anatomic variability.
To ensure that only voxels mapping cerebral tissue were included in the analysis, voxels for each brain failing to reach a specified threshold were masked out to eliminate the background and ventricular spaces. We set the default threshold as 80% of the mean voxel value inside the brain. In addition, global differences in the absolute amount of radiotracer delivered to the brain were adjusted by the SPM software in each animal by scaling the voxel intensities so that the mean intensity for each brain is the same (proportional scaling).
Using SPM, we implemented a Student’s t test (unpaired) at each voxel, testing the null hypothesis that there was no effect of group, that is, motor-induced cerebral-activation was tested by comparing the treadmill group with the quiescent group. Maps of positive and negative t were separately analyzed. A significant innovation of SPM is the application of the theory of continuous Gaussian fields to identify significant voxels and clusters of voxels in these statistical maps of voxel t values (Friston et al., 1991, 1994; Poline et al., 1995; Worsley et al., 1992). Since neighboring voxels are strongly correlated, the method first evaluates the autocorrelation of the field (Friston et al., 1991) to determine the effective size and number of independent resolution elements (resels). In our data, SPM determined resel dimensions of 9.9 × 9.9 × 4.2 voxels or 0.71 × 0.71 × 1.21 mm3 for a total of 1890.8 resels in the rat brain. We chose to set a significance threshold P < 0.01 (uncorrected for multiple comparisons) for individual voxels within clusters of contiguous voxels, and a minimum cluster size of 100 contiguous voxels (extent threshold). We then evaluated the corrected significance of individual voxels, clusters of contiguous voxels exceeding the threshold, and number of clusters detected in the entire SPM.
Significance established with the SPM analysis was compared to that obtained with a region-of-interest (ROI) analysis based on the Z-scores of tissue radioactivities within the ROIs. In this ROI analysis no correction for multiple comparisons was made ( P < 0.05). Methods and results of the ROI analysis have been previously reported (Holschneider et al., 2003).
Results
The slice realignment process is illustrated in Fig. 2. Fidelity of the alignment and 3D reconstruction process was assessed by visual inspection of internal structures viewed in different orthogonal sections, as well as by visual inspection of the smoothness of the cortex, after rendering the surface using a tool in the SPM software. In addition, the accuracy of the spatial normalization was confirmed by loading multiple normalized rat brains into SPM and visually inspecting the correspondence of various structures across the subjects.
Fig. 2.

Transverse slices before (Panel A) and after (Panel B) slice realignment. Depicted also are surface renderings of 3D reconstructed rat brains before (Panel C) and after (Panel D) slice realignment.
The significant positive and negative cerebral activations of rats running on a treadmill compared to controls are displayed in several ways. First, they are shown as a color-coded statistical t map superimposed on the brain coronal slices (Fig. 3). Second, they are shown as a 3D volume-rendered image of the statistical t map (Fig. 4). Finally, Table 1 lists regions that showed significant group differences with both SPM and the ROI-based analysis.
Fig. 3.

Changes in functional brain activity in rats in response to treadmill walking. Numbers below the slices indicate their position relative to bregma in millimeters according to a standard rat brain atlas (Paxinos and Watson, 1998). Depicted are coronal slices (anterior–posterior coordinates), a sagittal slice (+2.4 mm lateral to bregma) and a transverse brain slice (−4.4 mm dorsoventral to bregma). Colored overlays show statistically significant positive (red) and negative (blue) differences of ambulatory animals (n = 7) compared to controls (n = 6). Significance is shown with a t statistic color scale, which corresponds to the level of the significance at the voxel level.
Fig. 4.
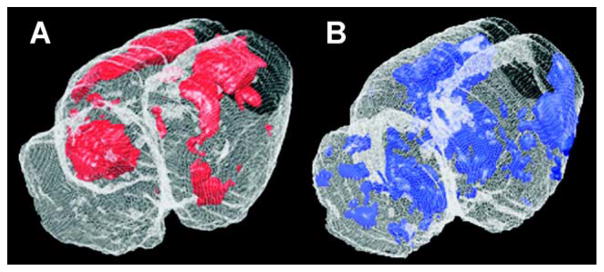
Volume rendering of statistically significant positive (Panel A) and negative (Panel B) differences between rats during treadmill walking (n = 7) and controls (n = 6). Significant voxels are shown using a single color for all voxels P < 0.01. These are overlaid onto a brain from a representative animal for anatomical reference. The graphical display was produced using Spamalize, a public domain software package (T. Oakes, http://tezpur.keck.waisman.wisc.edu/~oakes/spam/spam_frames.htm).
Table 1.
Regions of statistically significant differences of functional brain activation in the cortex, subcortex and cerebellum between rats during treadmill walking (n = 7) and controls (n = 6)
| Locomotor vs. control | Sig. SPM | Sig. ROI | Region |
|---|---|---|---|
| Cortex | |||
| ↑ | Y | Y | Cingulate cortex (Cg1) |
| ↑ | Y | Y | Motor cortex, primary, posterior (M1) |
| ↑ | N | Y | Motor cortex, secondary, posterior (M2) |
| ↑ | Y | Y | Parietal association cortex (PtA) |
| ↑ | Y | Y | Prelimbic/Infralimbic cortex (PrL/IL) |
| ↑ | Y* | Y | Retrosplenial cortex, posterior (RSA) |
| ↑ | Y | Y | Somatosensory cortex, primary: forelimb, hindlimb, trunk (S1FL, S1HL, S1TR) |
| ↑ | Y | Y | Visual cortex, secondary and primary (V2≫V1) |
| ↓ | Y | Y | Insular cortex (I) |
| ↓ | Y | Y | Orbital cortex, lateral (LO) |
| ↓ | Y | Y | Somatosensory cortex, primary: jaw, lip, oral, barrel field (S1J, S1BF) |
| ↓ | Y | Y | Somatosensory cortex, secondary (S2) |
| Subcortex | |||
| ↑ | Y | Y | Hippocampus, posterior, ventral portion (CA1) |
| ↑ | Y | Y | Periaqueductal gray (PAG) |
| ↑ | Y | Y | Striatum, dorsolateral (CPu) |
| ↑ | Y | Y | Subiculum (S) |
| ↓ | Y | N | Amygdala, basolateral (BL) |
| ↓ | Y | N | Geniculate, dorsolateral (DLG) |
| ↓ | Y | N | Globus pallidus, lateral (LGP) |
| ↓ | Y | N | Hypothalamus, ventromedial (VMH) |
| ↓ | Y* | Y | Inferior colliculus (ECIC, BIC) |
| ↓ | Y | N | Lateral lemniscus (ll) |
| ↓ | Y* | Y | Medial geniculate (MG) |
| ↓ | Y* | Y | Superior colliculus (SC) |
| ↓ | Y | Y | Thalamus (ventrolateral, VL) |
| ↓ | Y | N | Thalamus (central, medial, CM) |
| ↓ | Y | Y | V nucleus, Spinal V nucleus (Mo5, Pr5, Sp5) |
| Cerebellum | |||
| ↑ | N | Y | Copula of the Pyramis (Cop) |
| ↑ | Y | Y | Lobules 1 and 2 (medial) |
| ↑ | Y | Y | Lobule 3 (medial) |
| ↑ | Y | Y | Lobule 4 (medial) |
| ↑ | Y | Y | Lobule 5 (medial) |
| ↑ | Y | Y | Lobule 6 (medial) |
| ↑ | Y | Y | Lobule 8 (medial) |
| ↑ | Y | Y | Lobule 9 (medial) |
| ↑ | N | Y | Paramedian Lobule (PML) |
Regions listed are those independently detected as being significant at the P < 0.05 level by both the SPM and ROI methods of analysis. The leftmost column indicates whether such differences represent increases (i.e., locomotor minus control >0) or decreases (i.e., locomotor minus control <0). The second column from the left indicates if the indicated region was significant (Yes/No) at the cluster level (* indicates that significance was lost after correction for multiple comparisons). The third column from the left indicates whether the indicated region was significant (Yes/No) using the ROI method. Abbreviations are those from the Paxinos and Watson rat atlas (Paxinos and Watson, 1998).
SPM detected several additional regions of significance that had not been selected for study in our original ROI analysis (Holschneider et al., 2003), but were confirmed as significant on a repeat ROI analysis. These included increases in CBF-related tissue radioactivity in response to treadmill walking in the cingulate and prelimbic cortex, the periaqueductal gray region, the subiculum, as well as the ventral, posterior portion of the hippocampus (CA1).
SPM also detected several regions of significance in which ROI analysis failed to detect a significant difference at the P < 0.05 level. Animals walking on the treadmill compared to controls showed decreases in CBF-related tissue radioactivity in the basolateral amygdala, the lateral globus pallidus, the ventromedial hypothalamus, the lateral lemniscus and dorsolateral geniculate, as well as the central and medial thalamic nuclei.
Regions that were significant with the ROI method but not with the SPM analysis were increases in CBF-related tissue radioactivity seen in response to treadmill walking in secondary motor cortex, the copula pyramis and paramedian lobule. Both methods detected significant decreases in the external cortex of the inferior colliculus at the site adjacent to the brachium.
Discussion
Significant regional brain activations were detected using SPM and included most regions detected using an ROI analysis (Holschneider et al., 2003). Activations occurred in motor circuits (primary motor cortex, dorsolateral striatum, ventrolateral thalamus, midline cerebellum), primary somatosensory circuits (forelimb, hindlimb, and trunk cortex), as well as visual circuits (visual cortex, superior colliculus). This is consistent with the complex nature of this locomotor task, which involves integration of neural circuits subserving motor, sensory, and visual functions.
SPM detected several significant differences in cortical areas (cingulate, prelimbic) and subcortical areas (periaqueductal gray, subiculum, ventral portion of CA1) that, though not selected as regions in our original ROI analysis, were subsequently confirmed with the ROI method as being significant. The significant increases in CBF-related tissue radioactivity of locomotor versus control animals, in cingulate/prelimbic cortex as well as the hippocampus, suggests a role for emotional input, as well as memory recall during the learned treadmill task. Our original ROI analysis (Holschneider et al., 2003) did not report significance in the CA1 region because, at that time, placement of the ROI had been in an anterior, dorsal subregion of the CA1, when, in fact, significant differences were rather to be found in the posterior, ventral subregion of CA1. This latter finding underscores an advantage SPM has over the ROI method in the analysis of neuroimaging data. The ability to apply SPM to an anatomically open hypothesis (i.e., a null hypothesis that there is no effect anywhere in the brain) allows the detection of functional brain activations that would be difficult to predict a priori, and hence may be missed with the ROI approach.
In the subcortex, SPM detected several regions of activation that were not found on the ROI analysis. These included the amygdala, globus pallidus, lateral lemniscus, dorsolateral geniculate, and central thalamic nucleus. In all these regions, the direction of change of the motor versus control comparison in the ROI analysis was the same as in the SPM analysis, but the ROI analysis failed to reach the P < 0.05 criterion. It is well known that the size and shape of regions chosen for an ROI analysis and the number of planes of data on which they are placed may introduce a subjective error. On one hand, if regional brain activations lie partially outside the defined ROI, a failure to detect significant activation may result. On the other hand, if regions of brain activation are substantially smaller than the defined ROI, significant activation may be missed when active signal is averaged with the surrounding background within the ROI. For brain structures that display a non-topographic, mosaic organization of their afferent and efferent projections, defining appropriate ROIs may be particularly difficult. Because significance in SPM was established at the voxel level, rather than with a user-defined ROI, it allowed improved detection of activations within the above-mentioned regions, many of which showed irregular, “patchy” clusters of significant voxels.
The SPM analysis did not substantiate the significant increase in CBF-related tissue radioactivity in secondary motor cortex (M2) and cerebellar lobule 7 reported in our original ROI analysis in the treadmill group compared to controls (Holschneider et al., 2003). Both M2 and lobule 7 are narrow strips of cerebral tissue that lie adjacent to the two most robust increases in CBF-related tissue radioactivity seen in response to the locomotor challenge, namely primary motor cortex (M1) and cerebellar lobules (3–6, 8, and 9), respectively. In fact, these increases could be easily identified by visual inspection of the autoradiographs. In our original analysis, placement of the ROIs for M2 and lobule 7 may have overlapped partially with the borders of these regions of high activity. Reanalysis, with smaller ROIs placed more conservatively, substantiated the lack of significant group differences suggested by the SPM analysis.
Using whole-brain analysis methods comes with some limitations. The large number of comparisons made using voxel-based methods may potentially lead to spurious results. Thus, questionable results should be interpreted in the context of neuroanatomical knowledge or confirmed through a subsequent ROI analysis using an additional data set. The need for slice realignment—an issue inherent to autoradiography—poses a unique challenge in adapting SPM to autoradiographic data sets. Unlike most human imaging data, each slice represents a single cut frozen section acquired individually, and so its alignment with respect to adjacent slices is lost. Each brain must therefore be reconstructed into a 3D volume before being read and analyzed in SPM. This can pose a problem if autoradiographic sections demonstrate substantial artifacts related to removal, freezing, and slicing of the brain (Stumpf and Solomon, 1995).
Freezing artifact may on occasion result in a distortion of the alignment between the brain and the cerebellum, with both subtle rotational, as well as angular displacements off of the axial line. Such displacements typically results in cerebellar slices being cut at a slightly different angle than the preceding brain. This can result in difficulties in warping the animal’s 3D reconstructed brain completely into a template, which may not show evidence of this freezing artifact. In addition, any anatomic variability in the brain’s morphology between animals may make the process of complete alignment between an individual brain and the template, incomplete for isolated regions. Misalignment resulting from one or both of the above processes would be most likely apparent in the initial and final slices of a brain. Such misalignment results in a reduction of statistical power to detect a significant difference for cerebral structures contained within this initial or final slice. In our study, two areas where significance may have been missed by the SPM analysis were the copula pyramis and paramedian lobule, both in the posterior aspects of the sampled cerebellum. The ROI analysis, however, in which brain slices were not subjected to warping, and in which ROIs could be precisely placed for each animal by the user, were not subject to this error.
Several registration methods and algorithms have been developed, which differ mainly in the image features used to establish a measure of similarity between corresponding slices and the extent of required user-interaction. Registration methods for autoradiographs have used, for example, artificial landmarks (Goldszal et al., 1995), external section contour (Cohen et al., 1998), principle axes transformation (Hess et al., 1998; Hibbard et al., 1987), consistent matrix transformation (Andreasen et al., 1992; Hess et al., 1998), or multi-modal warping based on mutual information metric as a mapping cost function (Kim et al., 1997). We chose a non-warping geometric model restricted to rigid-body transformations that operated on an automated intensity-based registration algorithm (Thevenaz et al., 1998). Since each slice in this method is realigned sequentially to its neighbor, errors can potentially propagate throughout the realignment procedure. A more comprehensive fully automated registration algorithm that takes into account the similarity between slices and its neighborhood in the 3D volume, such that no direction is privileged, may improve future alignment (Nikou et al., 2003).
Using the SPM software requires that each user customizes default settings of the program to meet the requirements of the experimental data set. For example, the bounding box, which is used to specify the boundaries relative to the origin of the image to be normalized, must be adjusted to match the dimension of the source image. In addition, the user may have to determine the appropriate significance threshold (for single voxels) and minimum number of contiguous voxels that reach the significance threshold to be defined as a cluster (extent threshold) to efficiently assess and visualize changes in brain activity. Typically what is seen is that neighboring regions that are anatomically contiguous fuse to form single large clusters. We found that increasing the height threshold can segregate most super-clusters, but at the same time be too conservative for other clusters that were of relatively low significance. Conversely, setting the height threshold too low may result in spurious clusters, which may appear (often as thin lines) at the border zones between brain and its cerebroventricular spaces, or else at discrete grey matter/white matter junctions (e.g., external capsule, corpus callosum). We also performed analyses with different voxel sizes (72 × 72 × 300 μm3, 144 × 144 × 300 μm3, and isotropic 144 × 144 × 144 μm3) and smoothing extents (isotropic and anisotropic Gaussian kernel widths) and found no major differences in the location of detected clusters and their spatial extents (data not shown). The observed cluster size may well depend on the intrinsic resolution of the data and the inter-gap slicing distance. Thus, interpretation of clusters should be based on neuroanatomic correlation, as adjacent regions may fuse into a single cluster.
Finally, it must be noted that additional measures may contribute to the confidence of effects detected in a data set. Such effects may be the presence of left–right symmetry for paradigms that are intrinsically symmetrical (e.g., quadrupedal locomotion in a rat) and the correspondence of clusters within the boundaries of known anatomical structures. These cannot be easily quantified but increase the confidence of clusters found significant by the SPM algorithm.
In addressing an anatomically open hypothesis, whole-brain methods may be most appropriate. However, if one wishes to test an anatomically closed hypothesis, the most direct way is to use an ROI analysis. In the SPM software, one can define a mask (volume of interest) so that only a particular volume of the brain is analyzed for significant regions. This, therefore, increases power by making an adjustment (small volume correction) to the correction for multiple comparisons based on the volume of interest. Also, whole-brain methods use image smoothing by convolving the data with a Gaussian kernel to increase the signal to noise ratio and satisfy the assumptions of Gaussian random field theory. According to the matched filter theorem (Haykin, 1988), an ideal smoothing kernel is one that best matches the shape of the activation one is looking for. This, however, may be difficult to predict. ROI-based methods rely on sampling the mean value of all voxels within the region, which is similar to using a smoothing kernel, and perhaps the more sensitive approach in detecting the signal, if the region is accurately defined.
In conclusion, we have shown that it is feasible to apply SPM, a whole-brain method for image manipulation and statistical analysis, to an autoradiographic data set for mapping regional cerebral activation in rats. We have obtained results that appear to be meaningful and compatible, but more comprehensive than those obtained with ROI-based methods. The ability to rapidly and semi-automatically analyze images in more detail than the ROI method, without an a priori hypothesis of cerebral activity, gives the SPM approach a distinct advantage. Furthermore, the SPM software implements a variety of statistical designs and provides 3D visualization tools for exploration or display of the images. In our study, the excellent agreement between the SPM and ROI methods may have been aided by the robust nature of the functional activation elicited by the locomotor paradigm, some of which (e.g., motor cortex, midline cerebellum) were clearly detectable by the naked eye on the autoradiographs. Future work will need to evaluate agreement between these methods in more subtle paradigms of behavioral activation.
Acknowledgments
The authors would like to thank Dr. Tugan Muftuler, Dr. Lydia Su, Dr. George Chiou, Long Vu, and Yong Chu at the Brain Imaging Group at UCI, as well as Dr. Oscar U. Scremin at the VA Greater Los Angeles Healthcare System for their helpful comments and suggestions. Supported by grants from the NIBIB (RO1 EB-00300-03), The Whitaker Foundation (RG-99-0331), NSF REU grant 9988066, and the Veterans Administration.
References
- Andreasen A, Drewes AM, Assentoft JE, Larsen NE. Computer-assisted alignment of standard serial sections without use of artificial landmarks. A practical approach to the utilization of incomplete information in 3-D reconstruction of the hippocampal region. J Neurosci Methods. 1992;45:199–207. doi: 10.1016/0165-0270(92)90077-q. [DOI] [PubMed] [Google Scholar]
- Ashburner J, Friston KJ. Nonlinear spatial normalization using basis functions. Hum Brain Mapp. 1999;7:254–266. doi: 10.1002/(SICI)1097-0193(1999)7:4<254::AID-HBM4>3.0.CO;2-G. [DOI] [PMC free article] [PubMed] [Google Scholar]
- Cohen FS, Yang Z, Huang Z, Nissanov J. Automatic matching of homologous histological sections. IEEE Trans Biomed Eng. 1998;45:642–649. doi: 10.1109/10.668755. [DOI] [PubMed] [Google Scholar]
- Friston KJ, Frith CD, Liddle PF, Frackowiak RS. Comparing functional (PET) images: the assessment of significant change. J Cereb Blood Flow Metab. 1991;11:690–699. doi: 10.1038/jcbfm.1991.122. [DOI] [PubMed] [Google Scholar]
- Friston KJ, Worsley KJ, Frackowiak RS, Mazziotta JC, Evans AC. Assessing the significance of focal activations using their spatial extent. Hum Brain Mapp. 1994;1:214–220. doi: 10.1002/hbm.460010306. [DOI] [PubMed] [Google Scholar]
- Goldszal AF, Tretiak OJ, Hand PJ, Bhasin S, McEachron DL. Three-dimensional reconstruction of activated columns from 2-[14C]deoxy-D-glucose data. NeuroImage. 1995;2:9–20. doi: 10.1006/nimg.1995.1004. [DOI] [PubMed] [Google Scholar]
- Hall WG, Swithers-Mulvey SE, Agrawal CM, Burka NR, Horner J, Menacherry S. Analysis of 2-DG autoradiograms using image-averaging and image-differencing procedures for systems-level description of neurobehavioral function. Physiol Behav. 1991;50:109–119. doi: 10.1016/0031-9384(91)90506-j. [DOI] [PubMed] [Google Scholar]
- Haykin S. Digital Communications. Wiley Inc; New York, NY: 1988. [Google Scholar]
- Hess A, Lohmann K, Gundelfinger ED, Scheich H. A new method for reliable and efficient reconstruction of 3-dimensional images from autoradiographs of brain sections. J Neurosci Methods. 1998;84:77–86. doi: 10.1016/s0165-0270(98)00102-2. [DOI] [PubMed] [Google Scholar]
- Hibbard LS, McGlone JS, Davis DW, Hawkins RA. Three-dimensional representation and analysis of brain energy metabolism. Science. 1987;236:1641–1646. doi: 10.1126/science.3603004. [DOI] [PubMed] [Google Scholar]
- Holschneider DP, Maarek JM, Harimoto J, Yang J, Scremin OU. An Implantable Bolus Infusion Pump For Use In Freely Moving, Nontethered Rats. Am J Physiol Heart Circ Physiol. 2002;283:H1713–H1719. doi: 10.1152/ajpheart.00362.2002. [DOI] [PMC free article] [PubMed] [Google Scholar]
- Holschneider DP, Maarek JM, Yang J, Harimoto J, Scremin OU. Functional brain mapping in freely moving rats during treadmill walking. J Cereb Blood Flow Metab. 2003;23:925–932. doi: 10.1097/01.WCB.0000072797.66873.6A. [DOI] [PMC free article] [PubMed] [Google Scholar]
- Jones SC, Korfali E, Marshall SA. Cerebral blood flow with the indicator fractionation of [14C]iodoantipyrine: effect of PaCO2 on cerebral venous appearance time. J Cereb Blood Flow Metab. 1991;11:236–241. doi: 10.1038/jcbfm.1991.55. [DOI] [PubMed] [Google Scholar]
- Kim B, Boes JL, Frey KA, Meyer CR. Mutual information for automated unwarping of rat brain autoradiographs. NeuroImage. 1997;5:31–40. doi: 10.1006/nimg.1996.0251. [DOI] [PubMed] [Google Scholar]
- Nikou C, Heitz F, Nehlig A, Namer IJ, Armspach JP. A robust statistics-based global energy function for the alignment of serially acquired autoradiographic sections. J Neurosci Methods. 2003;124:93–102. doi: 10.1016/s0165-0270(02)00369-2. [DOI] [PubMed] [Google Scholar]
- Patlak CS, Blasberg RG, Fenstermacher JD. An evaluation of errors in the determination of blood flow by the indicator fractionation and tissue equilibration (Kety) methods. J Cereb Blood Flow Metab. 1984;4:47–60. doi: 10.1038/jcbfm.1984.7. [DOI] [PubMed] [Google Scholar]
- Paxinos G, Watson C. The Rat Brain in Stereotactic Coordinates. 4. Academic Press; New York, NY: 1998. [Google Scholar]
- Poline JB, Worsley KJ, Holmes AP, Frackowiak RS, Friston KJ. Estimating smoothness in statistical parametric maps: variability of p values. J Comput Assist Tomogr. 1995;19:788–796. doi: 10.1097/00004728-199509000-00017. [DOI] [PubMed] [Google Scholar]
- Rosenfeld A, Kak AC. Digital Picture Processing. Academic Press Inc; Orlando, FL: 1982. [Google Scholar]
- Stumpf WE, Solomon HF. Autoradiography and Correlative Imaging. Academic Press; New York: 1995. [Google Scholar]
- Thevenaz P, Ruttimann UE, Unser M. A pyramid approach to subpixel registration based on intensity. IEEE Trans Image Process. 1998;7:27–41. doi: 10.1109/83.650848. [DOI] [PubMed] [Google Scholar]
- Van Uitert RL, Levy DE. Regional brain blood flow in the conscious gerbil. Stroke. 1978;9:67–72. doi: 10.1161/01.str.9.1.67. [DOI] [PubMed] [Google Scholar]
- Worsley KJ, Evans AC, Marrett S, Neelin P. A three-dimensional statistical analysis for CBF activation studies in human brain. J Cereb Blood Flow Metab. 1992;12:900–918. doi: 10.1038/jcbfm.1992.127. [DOI] [PubMed] [Google Scholar]
- Zhao W, Ginsberg MD, Smith DW. Three-dimensional quantitative autoradiography by disparity analysis: theory and application to image averaging of local cerebral glucose utilization. J Cereb Blood Flow Metab. 1995;15:552–565. doi: 10.1038/jcbfm.1995.69. [DOI] [PubMed] [Google Scholar]
- Zhao W, Ginsberg MD, Prado R, Belayev L. Depiction of infarct frequency distribution by computer-assisted image mapping in rat brains with middle cerebral artery occlusion. Comparison of photo-thrombotic and intraluminal suture models. Stroke. 1996;27:1112–1117. doi: 10.1161/01.str.27.6.1112. [DOI] [PubMed] [Google Scholar]