

Abstract
MicroRNAs (miRNAs) are non-coding gene products that regulate gene expression through specific binding to target mRNAs. Cell-specific patterns of miRNAs are associated with the acquisition and maintenance of a given phenotype, such as endocrine pancreas (islets). We hypothesized that a subset of miRNAs could be differentially expressed in the islets. Using miRNA microarray technology and quantitative RT-PCR we identified a subset of miRNAs that are the most differentially expressed islet miRNAs (ratio islet/acinar >150-fold), mir-7 being the most abundant. A similarly high ratio for mir-7 was observed in human islets. The ratio islet/acinar for mir-375, a previously described islet miRNA, was <10, and is 2.5X more abundant in the islets than mir-7. Therefore, we conclude that mir-7 is the most abundant endocrine miRNA in islets while mir-375 is the most abundant intra-islet miRNA. Our results may offer new insights into regulatory pathways of islet gene expression.
Keywords: Pancreatic islets, MicroRNAs, microRNA microarrays, q-RT-PCR
Introduction
MicroRNAs (miRNAs) are non-coding small RNAs (~19–22 nt) that regulate gene expression by post-transcriptional interference with specific messenger RNAs (mRNA) [1]. The discovery of miRNAs as modifiers of gene expression is one of the milestones in the field of gene expression regulation. The current knowledge of miRNA biology is mostly derived from pioneering studies performed in the nematode C. elegans, showing a temporal-specific expression of the lin-4 miRNA [2]. As each miRNA can have multiple target messenger RNAs individually or jointly with other miRNAs, they are able to control highly complex regulatory networks of gene expression [3]. The current number of human miRNA genes listed in the Sanger database is 533 [4]. It was suggested that this number will increase up to 1,000, which would amount to almost 3% of the protein-coding genes [1]. However, a new mammalian miRNA atlas describes 300,000 sequences from 256 small RNA libraries and presents evidence for expression of approximately 400 miRNA genes in each genome [5].
The biological function of most miRNAs remains currently unknown, but some of their messenger RNA targets have been experimentally confirmed. To this group belongs mir-375, which negatively controls insulin secretion in β-cells by targeting myotrophin (Mtpn) [6], a gene originally described in neuron vesicle transport. Another miRNA with reported biological function in insulin producing cells is mir-9. This miRNA, predominantly expressed in brain, negatively controls insulin secretion in insulinoma cells [7].
Several studies have shown that miRNAs regulate embryonic development and have tissue/cell specific patterns [8–11]. miRNAs are necessary for islet cell genesis in the mouse [12]. It has been reported that inhibition of mir-375 has a profound deleterious effect on pancreatic development, particularly on endocrine cells [13]. Thus, expression of a specific subset of miRNAs could have a crucial effect on the acquisition and maintenance of a given phenotype, such as that of pancreatic islets. For this reason, we investigated the expression profile of miRNAs differentially expressed in the endocrine pancreas (islets).
Materials and Methods
Tissue procurement
Rat islets and acinar tissue were isolated at the Preclinical Cell Processing and Translational Models Core of the Diabetes Research Institute from the pancreas of donor Lewis rats (Charles River Labs) by digestion of the pancreatic tissue with purified enzyme blend Liberase RI® (Roche Molecular Biochemical, Indianapolis, IN) at a concentration of 0.16mg/mL, following a procedure described earlier [14]. Human pancreatic islets and acinar tissue were obtained from the Human Islet Cell Processing Facility at the Diabetes Research Institute. All animal studies were performed under protocols approved by the University of Miami Animal Care and Use Committee.
MicroRNA microarray studies
Total RNA was isolated by a method that preserves RNA molecules <200 bp, using mirVana miRNA Isolation kit (Ambion, Foster City, CA). In order to achieve comparative results for all the samples, special caution was taken to prevent degradation of miRNAs and their cDNAs in RNA preparations [15]. Samples were processed for miRNA profiling by LC Sciences (Houston, TX). Two to five µg total RNA samples were size fractionated using YM-100 Microcon centrifugal filter (Millipore, Billerica, MA) to enrich the miRNA fraction. RNA was 3′ extended with poly(A) tail. An oligonucleotide tag was then ligated to the poly(A) tail for subsequent fluorescent dye staining. Two different tags were used for the two RNA samples, islets and acinar tissue, on each dual-sample chip. Hybridization was performed overnight on a µParaFlo™ microfluidic chip using a micro-circulation pump. The Array contained probes for 312 mature microRNAs (Sanger v. 8.1) plus multiple controls including housekeeping small RNA genes and the oligonucleotide microRNA probes with single mutations (mismatch probe negative controls). Hybridization was carried out with 100 µL 6xSSPE buffer (0.90 M NaCl, 60 mM Na2HPO4, 6 mM EDTA, pH 6.8) containing 25% formamide at 34 °C. After hybridization, fluorescence labeling with tag-specific Cy3 and Cy5 dyes provided detection. For each pair of islets and acinar samples, two chips were analyzed: in one chip, islets were labeled with Cy5 and acinar with Cy3 and in the other one the dyes were reversed. Hybridization images were collected with GenePix 4000B laser scanner (Molecular Devices, Sunnyvale, CA) and digitized by Array-Pro image analysis software (Media Cybernetics, Silver Spring, MD). Data was analyzed by first subtracting the background and then normalizing the signals using a LOWESS filter (Locally-weighted Regression) [16]. A total of 3 experiments were performed. Replicate hybridizations of the same islet and acinar samples were performed utilizing the two-color (Cy3/Cy5) “dye flip reversal method” (a total of 6 hybridizations). For two-color experiments, the ratio of the two sets of detected signals (log2 transformed, balanced) and p-values of the t-test were calculated; differentially detected signals were those with less than 0.01 p-values.
Statistical Analysis
The averages of both hybridizations (Cy5/C3 and C3/Cy5) for the 3 samples were analyzed by Significant Analysis of Microarray SAM (False Discovery Rate [FDR] <1%) [17]. The analysis only included those miRNAs detected in at least 2 averages arrays.
miRNA quantification: Quantitative Real Time PCR (qRT-PCR)
RNA was isolated using mirVana miRNA Isolation kit (Ambion-Applied Biosystems, Foster City, CA). Purity and concentration of the samples were assessed with a NanoDrop ND-1000 Spectrophotometer. The quantification of miRNA was performed with a method termed looped-primer RT-PCR [18], following the Applied Biosystems protocol for TaqMan MicroRNA Assays with 7500 Fast Real-Time PCR system, utilizing TaqMan Universal reagents and miRNA assays (Applied Biosystems). RQ determines the change in transcript expression in islet versus acinar tissue. RT and PCR reactions were done in triplicates using looped-primers and primers specific for each miRNA (Applied Biosystems). RQ was calculated via Applied Biosystems SDS software based on the equation RQ= 2−ΔΔCt, where Ct is the number of cycles at which amplification reaches a threshold, determined by the software, within the exponential amplification phase. Ct data was normalized to endogenous control mir-16.
Results and discussion
MicroRNA microarray studies
To test the hypothesis that acinar and islet cells might express a different subset of miRNAs, we studied the differential expression of miRNAs in these cells by microarray technology and qRT-PCR. Advances in microarray technology made possible the use of chip arrays to study the expression of miRNAs in various cells and tissues [3]. Using miRNA microarray microfluidic technology, we compared miRNA expression profile in rat endocrine (islets) versus exocrine (acinar) pancreas (Table 1, Fig. 1). Statistical analysis of microarrays (SAM) reveals 17 miRNAs that are preferentially expressed in islets and 28 miRNAs that are preferentially expressed in acinar tissue (Table 1). Five miRNAs from the group of miRNAs differentially expressed in islets (mir-7, mir-183, mir-382, mir-127 and mir-29c) were identified with 0 probability of being a false positive (q=0). Mir-7 displays the highest rank, indicating the largest difference of expression between the two groups, islets and acinar tissue (Table 1). Mir-9 could not be detected. Mir-375, was not integrated in the Sanger mirBase release 8.1.
Table 1.
miRNAs selected by significant analysis of microarrays (SAM) from rat islets versus rat acinar miRNA arrays.
| A | B | ||||
|---|---|---|---|---|---|
| Gene ID | Score(d) | q-value(%) | Gene ID | Score(d) | q-value(%) |
| rno-miR-7 | 21.85186934 | 0 | rno-miR-25 | −3.804360969 | 0.669997729 |
| rno-miR-183 | 11.19053836 | 0 | rno-let-7c | −3.815447467 | 0.669997729 |
| rno-miR-382 | 6.865388356 | 0 | rno-miR-222 | −4.121389981 | 0.669997729 |
| rno-miR-127 | 6.502270927 | 0 | rno-miR-365 | −4.164014962 | 0.669997729 |
| rno-miR-29c | 5.785380065 | 0 | rno-miR-320 | −4.176820756 | 0.669997729 |
| rno-miR-99b | 5.247589635 | 0.604632097 | rno-miR-34a | −4.88621479 | 0 |
| rno-miR-29b | 5.242054216 | 0.604632097 | rno-miR-20a | −4.9876824 | 0 |
| rno-miR-335 | 5.126914677 | 0.604632097 | rno-miR-497 | −5.063393797 | 0 |
| rno-miR-132 | 5.040701163 | 0.604632097 | rno-miR-199a | −5.244896186 | 0 |
| rno-miR-148b | 4.969027834 | 0.604632097 | rno-miR-327 | −5.402334731 | 0 |
| rno-miR-107 | 4.689482155 | 0.604632097 | rno-miR-345 | −5.63857305 | 0 |
| rno-miR-30c | 4.523719063 | 0.604632097 | rno-miR-203 | −5.89915699 | 0 |
| rno-miR-30b | 4.114960417 | 0.953458306 | rno-miR-19b | −5.975438034 | 0 |
| rno-miR-98 | 3.880077695 | 0.953458306 | rno-miR-181a | −6.498564619 | 0 |
| rno-miR-103 | 3.666801583 | 0.953458306 | rno-miR-221 | −6.511775959 | 0 |
| rno-miR-125a | 3.601285236 | 0.953458306 | rno-miR-92 | −6.615840829 | 0 |
| rno-miR-96 | 3.572033167 | 0.953458306 | rno-miR-216 | −6.633610661 | 0 |
| rno-miR-223 | −6.82954414 | 0 | |||
| rno-miR-152 | −7.314267564 | 0 | |||
| rno-miR-181c | −7.351031858 | 0 | |||
| rno-miR-489 | −7.533937702 | 0 | |||
| rno-miR-187 | −8.393161889 | 0 | |||
| rno-miR-341 | −8.440403162 | 0 | |||
| rno-miR-292-5p | −8.703401641 | 0 | |||
| rno-miR-181b | −9.381454291 | 0 | |||
| rno-miR-296 | −10.74678853 | 0 | |||
| rno-miR-422b | −17.99621725 | 0 | |||
| rno-miR-217 | −20.6481374 | 0 |
The expression of miRNAs was examined by microarrays containing the rat Sanger mirBase released 8.1 list. N=3 independent experiments. The score (d) represents the value of the T-statistic. A higher score means a greater difference between the two groups. Positive (d) values represent miRNAs differentially expressed in islets (A). Negative (d) values represent miRNAs differentially expressed in acinar tissue (B). q-values represent the p-values adapted to the analysis of large number of genes. It is an evaluation of the chance that a given miRNA be a false positive.
Figure 1.

Differential expression of pancreatic miRNAs. The hot map figure was obtained by Treeview [21] using the data presented from Table 1. Red represents differentially expressed islet miRNAs. Green represents differentially expressed acinar miRNAs. Colorgram depicts expression from high (bright red or green) to low (black) and no expression (gray).
Quantitative analysis of miRNA expression
To confirm the microarray results, selected miRNAs differentially expressed in islets were analyzed by qRT-PCR utilizing the looped-primer method, which is particularly suited for the accurate and sensitive detection of miRNAs as well as other non-coding RNAs (ncRNAs). Mir-375 was included in qRT-PCR analysis. We found that mir-7, mir-127 and mir-382 were the most differentially expressed miRNAs (152-fold, 108-fold and 153-fold, respectively) in rat islets, followed by mir-183 and mir-99b (12.9 and 7.1 fold, respectively) (Fig. 2). The ratio islet/acinar for mir-375 was 6.2±0.3, significantly lower than mir-7. The differences in expression in islet versus acinar obtained by qRT-PCR were, in general, larger than the microarray hybridization values (Table 2).
Figure 2.
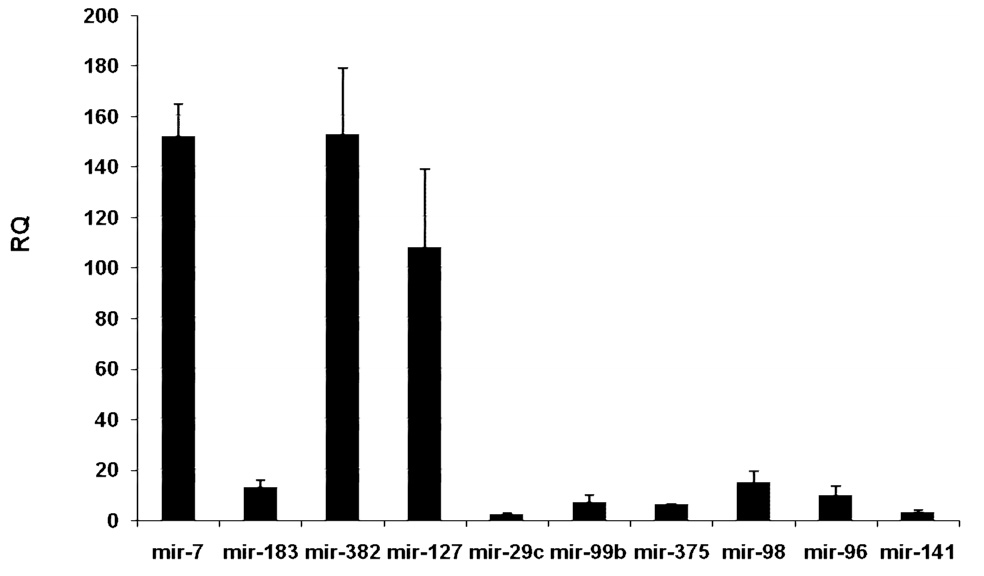
Pancreatic miRNAs differentially expressed in islets. Quantitative RT-PCR analysis. Values are presented as Relative Quantification (RQ) of rat miRNA transcripts in islets relative to acinar tissue or relative to mir-7 for intraislet comparison (B). Data represents mean ± SD (n=3). We selected 10 miRNAs to validate the microarray analysis. Mir-7, mir-127 and mir-382 constitute a subset of endocrine islet miRNAs that are the most differentially expressed (>100 fold).
Table 2.
Comparison between the microarray hybridization values and qRT-PCR
| miRNA | Normalized array value | Average RQ values |
|---|---|---|
| mir-7 | 55 | 152 |
| mir-183 | 6.9 | 13 |
| mir-382 | 8.6 | 153.3 |
| mir-127 | 26.3 | 108.6 |
| mir-29c | 13.7 | 2.3 |
| mir-99b | 3.9 | 7.2 |
| mir-375 | NA | 6.2 |
| mir-98 | 4.7 | 15 |
| mir-96 | 4.8 | 10.3 |
| mir-141 | 3 | 3 |
The analysis of the intra-islet miRNA expression shows that mir-7 is 2.5X less abundant than mir-375, but >10-fold and 6-fold higher than mir-382 and mir-127 respectively (Fig.3). This is in agreement with the reported cloning frequency of mir-375 and mir-7, representing 8 and 4.3%, respectively, of the total number of clones obtained from pancreatic islets (14). Therefore, mir-375 is the most abundant intra-islet miRNA, while mir-7 is the most abundant endocrine islet miRNA.
Figure 3.
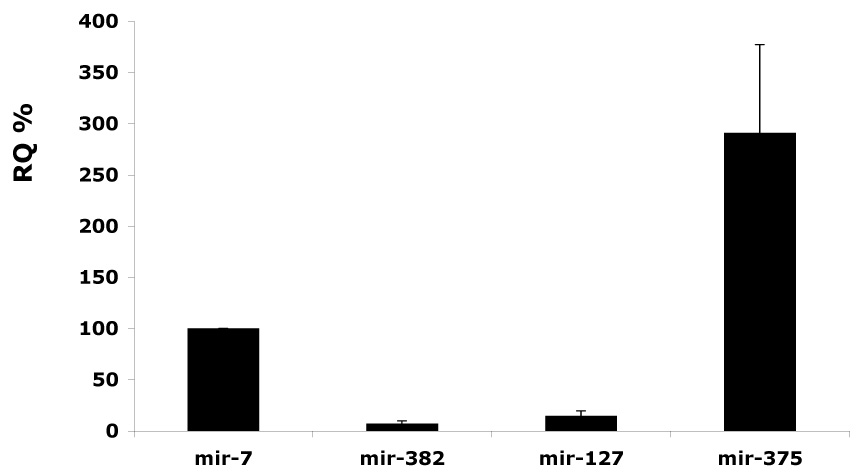
Intra-islet expression of miRNAs. Quantitative RT-PCR analysis. Values are presented as Relative Quantification (RQ) of rat miRNA transcripts in islets. RQs for mir-7 are taken as 100%. Data represents mean ± SD (n=3). Mir-7 is >10-fold and 6-fold higher than mir-382 and mir-127 respectively. Mir-375 is the most abundantly expressed miRNA in islets.
Expression of mir-7 in human islet cells
Subsequently, we compared the expression of the subset of mir-7, mir-127, mir-382, mir-183, mir-99b and mir-375 in human islets and acinar tissue. We found an even higher differential expression for mir-7 in human than in rat in three independent islet preparations (Table 3).
Table 3.
qRT-PCR analysis of the differential expression of miRNAs in human islets versus acinar tissue.
| miRNA | Rat | Human 1 | Human 2 | Human 3 |
|---|---|---|---|---|
| mir-7 | 152±13.8 | 223.96 | 239.57 | 204.88 |
| mir-375 | 6.2±0.4 | 7.324 | 5.847 | 3.82 |
| mir-183 | 13±3.7 | 17.517 | 13.117 | 10.007 |
| mir-382 | 153.3±26.1 | 25.411 | 12.7 | 4.931 |
| mir-141 | 3±1 | 0.918 | 0.449 | 0.184 |
| mir-127 | 108.6±31 | 78.303 | 23.265 | 11.374 |
| mir-99b | 7.2±3.1 | 17.773 | 7.006 | 5.697 |
There is an inherent high variability in the quality and viability of human islet preparations. This is due to the noxious effects in the harvested pancreas caused by donor brain death and cold ischemia time. Therefore, the results of the three independent experiments are presented separately.
To our knowledge this is the first study to report a differential expression analysis of pancreatic miRNAs. We identified a subset of endocrine miRNAs, which are highly differentially expressed in islets, mir-7 being the most abundant. Mir-7 is conserved across all vertebrates [12]. It has been previously identified in zebrafish islets [8], and was reported to promote photoreceptor development in Drosophila [19]. Mir-7 expression was also found in the annelid Platynereis dumerilii and in zebrafish in neurons that are components of neurosecretory brain centers, such as the ones expressing the prohormone vasotocin (vasopressin/oxytocin)-neurophysin [20]. A high frequency cloning of mir-7 in the endocrine pituitary gland was also reported. Indeed, the expression of mir-7 in islets and pituitary gland represents more than 50% of the mir-7 clones obtained from the screening of more than 26 organ systems [5]. Collectively, the above reports and our results indicate that mir-7 is an endocrine miRNA highly expressed in the pancreatic islets. These findings open new avenues of research aimed at exploring its potential role in the development and maintenance of islet cell phenotype.
Acknowledgments
This work was supported by National Institutes of Health-NCRR-Islet Cell Resources (U42 RR016603) grant, the Diabetes Research Institute Foundation the Peacock Foundation and the Foundation for Diabetes Research. We thank Dr. Dagmar Klein for critical reading of the manuscript; and Judith Molina, Elsie Zahr and Sergio San Jose for technical assistance.
Footnotes
Publisher's Disclaimer: This is a PDF file of an unedited manuscript that has been accepted for publication. As a service to our customers we are providing this early version of the manuscript. The manuscript will undergo copyediting, typesetting, and review of the resulting proof before it is published in its final citable form. Please note that during the production process errors may be discovered which could affect the content, and all legal disclaimers that apply to the journal pertain.
References
- 1.Bartel DP. MicroRNAs: genomics, biogenesis, mechanism, and function. Cell. 2004;116:281–297. doi: 10.1016/s0092-8674(04)00045-5. [DOI] [PubMed] [Google Scholar]
- 2.Lee RC, Feinbaum RL, Ambros V. The C. elegans heterochronic gene lin-4 encodes small RNAs with antisense complementarity to lin-14. Cell. 1993;75:843–854. doi: 10.1016/0092-8674(93)90529-y. [DOI] [PubMed] [Google Scholar]
- 3.Kim VN, Nam JW. Genomics of microRNA. Trends Genet. 2006;22:165–173. doi: 10.1016/j.tig.2006.01.003. [DOI] [PubMed] [Google Scholar]
- 4.Griffiths-Jones S. The microRNA Registry. Nucleic Acids Res. 2004;32:D109–D111. doi: 10.1093/nar/gkh023. [DOI] [PMC free article] [PubMed] [Google Scholar]
- 5.Landgraf P, Rusu M, Sheridan R, Sewer A, Iovino N, Aravin A, Pfeffer S, Rice A, Kamphorst AO, Landthaler M, Lin C, Socci ND, Hermida L, Fulci V, Chiaretti S, Foa R, Schliwka J, Fuchs U, Novosel A, Muller RU, Schermer B, Bissels U, Inman J, Phan Q, Chien M, Weir DB, Choksi R, De Vita G, Frezzetti D, Trompeter HI, Hornung V, Teng G, Hartmann G, Palkovits M, Di Lauro R, Wernet P, Macino G, Rogler CE, Nagle JW, Ju J, Papavasiliou FN, Benzing T, Lichter P, Tam W, Brownstein MJ, Bosio A, Borkhardt A, Russo JJ, Sander C, Zavolan M, Tuschl T. A mammalian microRNA expression atlas based on small RNA library sequencing. Cell. 2007;129:1401–1414. doi: 10.1016/j.cell.2007.04.040. [DOI] [PMC free article] [PubMed] [Google Scholar]
- 6.Poy MN, Eliasson L, Krutzfeldt J, Kuwajima S, Ma X, Macdonald PE, Pfeffer S, Tuschl T, Rajewsky N, Rorsman P, Stoffel M. A pancreatic islet-specific microRNA regulates insulin secretion. Nature. 2004;432:226–230. doi: 10.1038/nature03076. [DOI] [PubMed] [Google Scholar]
- 7.Plaisance V, Abderrahmani A, Perret-Menoud V, Jacquemin P, Lemaigre F, Regazzi R. MicroRNA-9 controls the expression of Granuphilin/Slp4 and the secretory response of insulin-producing cells. J Biol Chem. 2006;281:26932–26942. doi: 10.1074/jbc.M601225200. [DOI] [PubMed] [Google Scholar]
- 8.Wienholds E, Kloosterman WP, Miska E, Alvarez-Saavedra E, Berezikov E, de Bruijn E, Horvitz HR, Kauppinen S, Plasterk RH. MicroRNA expression in zebrafish embryonic development. Science. 2005;309:310–311. doi: 10.1126/science.1114519. [DOI] [PubMed] [Google Scholar]
- 9.Lagos-Quintana M, Rauhut R, Yalcin A, Meyer J, Lendeckel W, Tuschl T. Identification of tissue-specific microRNAs from mouse. Curr Biol. 2002;12:735–739. doi: 10.1016/s0960-9822(02)00809-6. [DOI] [PubMed] [Google Scholar]
- 10.Baskerville S, Bartel DP. Microarray profiling of microRNAs reveals frequent coexpression with neighboring miRNAs and host genes. Rna. 2005;11:241–247. doi: 10.1261/rna.7240905. [DOI] [PMC free article] [PubMed] [Google Scholar]
- 11.Suh MR, Lee Y, Kim JY, Kim SK, Moon SH, Lee JY, Cha KY, Chung HM, Yoon HS, Moon SY, Kim VN, Kim KS. Human embryonic stem cells express a unique set of microRNAs. Dev Biol. 2004;270:488–498. doi: 10.1016/j.ydbio.2004.02.019. [DOI] [PubMed] [Google Scholar]
- 12.Lynn FC, Skewes-Cox P, Kosaka Y, McManus MT, Harfe BD, German MS. MicroRNA Expression is Required for Pancreatic Islet Cell Genesis in the Mouse. Diabetes. 2007 doi: 10.2337/db07-0175. [DOI] [PubMed] [Google Scholar]
- 13.Kloosterman WP, Lagendijk AK, Ketting RF, Moulton JD, Plasterk RH. Targeted inhibition of miRNA maturation with morpholinos reveals a role for miR-375 in pancreatic islet development. PLoS Biol. 2007;5:e203. doi: 10.1371/journal.pbio.0050203. [DOI] [PMC free article] [PubMed] [Google Scholar]
- 14.Pileggi A, Molano RD, Ricordi C, Zahr E, Collins J, Valdes R, Inverardi L. Reversal of diabetes by pancreatic islet transplantation into a subcutaneous, neovascularized device. Transplantation. 2006;81:1318–1324. doi: 10.1097/01.tp.0000203858.41105.88. [DOI] [PubMed] [Google Scholar]
- 15.Bravo V, Rosero S, Ricordi C, Pastori RL. Instability of miRNA and cDNAs derivatives in RNA preparations. Biochem Biophys Res Commun. 2007;353:1052–1055. doi: 10.1016/j.bbrc.2006.12.135. [DOI] [PubMed] [Google Scholar]
- 16.Bolstad BM, Irizarry RA, Astrand M, Speed TP. A comparison of normalization methods for high density oligonucleotide array data based on variance and bias. Bioinformatics. 2003;19:185–193. doi: 10.1093/bioinformatics/19.2.185. [DOI] [PubMed] [Google Scholar]
- 17.Tusher VG, Tibshirani R, Chu G. Significance analysis of microarrays applied to the ionizing radiation response. Proc Natl Acad Sci U S A. 2001;98:5116–5121. doi: 10.1073/pnas.091062498. [DOI] [PMC free article] [PubMed] [Google Scholar]
- 18.Chen C, Ridzon DA, Broomer AJ, Zhou Z, Lee DH, Nguyen JT, Barbisin M, Xu NL, Mahuvakar VR, Andersen MR, Lao KQ, Livak KJ, Guegler KJ. Real-time quantification of microRNAs by stem-loop RT-PCR. Nucleic Acids Res. 2005;33:e179. doi: 10.1093/nar/gni178. [DOI] [PMC free article] [PubMed] [Google Scholar]
- 19.Li X, Carthew RW. A microRNA mediates EGF receptor signaling and promotes photoreceptor differentiation in the Drosophila eye. Cell. 2005;123:1267–1277. doi: 10.1016/j.cell.2005.10.040. [DOI] [PubMed] [Google Scholar]
- 20.Tessmar-Raible K, Raible F, Christodoulou F, Guy K, Rembold M, Hausen H, Arendt D. Conserved sensory-neurosecretory cell types in annelid and fish forebrain: insights into hypothalamus evolution. Cell. 2007;129:1389–1400. doi: 10.1016/j.cell.2007.04.041. [DOI] [PubMed] [Google Scholar]
- 21.Eisen MB, Spellman PT, Brown PO, Botstein D. Cluster analysis and display of genome-wide expression patterns. Proc Natl Acad Sci U S A. 1998;95:14863–14868. doi: 10.1073/pnas.95.25.14863. [DOI] [PMC free article] [PubMed] [Google Scholar]