

Abstract
Phenotypic plasticity, the production of alternative phenotypes (or morphs) from the same genotype due to environmental factors, results in some genes being expressed in a morph-biased manner. Theoretically, these morph-biased genes experience relaxed selection, the consequence of which is the buildup of slightly deleterious mutations at these genes. Over time, this is expected to result in increased protein divergence at these genes between species and a signature of relaxed purifying selection within species. Here we test these theoretical expectations using morph-biased genes in the pea aphid, a species that produces multiple morphs via polyphenism. We find that morph-biased genes exhibit faster rates of evolution (in terms of dN/dS) relative to unbiased genes and that divergence generally increases with increasing morph bias. Further, genes with expression biased toward rarer morphs (sexual females and males) show faster rates of evolution than genes expressed in the more common morph (asexual females), demonstrating that the amount of time a gene spends being expressed in a morph is associated with its rate of evolution. And finally, we show that genes expressed in the rarer morphs experience decreased purifying selection relative to unbiased genes, suggesting that it is a relaxation of purifying selection that contributes to their faster rates of evolution. Our results provide an important empirical look at the impact of phenotypic plasticity on gene evolution.
Keywords: relaxed purifying selection, phenotypic plasticity, gene expression, polyphenism, aphid, morph bias
Introduction
The production of alternative phenotypes by the same genotype in response to environmental stimuli, or polyphenism, is prevalent in the animal kingdom (West-Eberhard 2003). Well-known polyphenisms include caste polyphenisms of social insects (Wilson 1971), the omnivorous and carnivorous morphs of spadefoot toads (Pfennig 1992), and horn dimorphic dung beetles (Hunt and Simmons 1997; Moczek and Emlen 1999). Alternative phenotypes are usually composed of a suite of traits, with natural selection acting to match individual character variation to appropriate environments (e.g., Kingsolver 1995). As such, polyphenism allows a single genotype to maximize fitness via multiple phenotypes when the environments that it experiences are heterogeneous in time or space (Scheiner 1993).
Gene expression profiling has definitively shown that alternative gene expression profiles underlie alternative phenotypes, indicating that different subsets of a genome’s gene content contribute to each phenotype (e.g., Brisson et al. 2007; Grozinger et al. 2007; Smith et al. 2008; Snell-Rood et al. 2011; Pointer et al. 2013). Because of this, a particular gene may or may not be expressed in all morphs produced by a single genotype. Genes are considered morph-specific if they are only expressed in one morph, they are considered morph-biased if they have higher expression in one morph relative to another, or they are considered unbiased if they are expressed at comparable levels in all morphs. The morph bias or morph specificity of gene expression in alternative phenotypes of polyphenism is considered a necessary condition for the evolution of plasticity; by expressing genes in only one morph, that gene can be fine-tuned by natural selection to optimize function of that morph independent of other morphs (West-Eberhard 1989; Nijhout 2003).
Morph specificity can impact the rate of evolution of morph-biased genes. A handful of studies have shown that the amino acid sequences of morph-biased genes evolve at a faster pace than unbiased genes (Brisson and Nuzhdin 2008; Hunt et al. 2010, 2011; Snell-Rood et al. 2011; Leichty et al. 2012). These faster rates of evolution are consistent with two, nonmutually exclusive hypotheses. The first hypothesis states that morph-biased gene expression causes faster gene evolution due to relaxed purifying selection. If gene products experience the effects of selection in only a subset of the population, they have relaxed selective constraint compared with genes expressed in multiple morphs. In these morph-specific genes, relaxed selection results in the buildup of slightly deleterious mutations and increases polymorphism within populations (Kawecki 1994; Kawecki et al. 1997; Barker et al. 2005; Van Dyken and Wade 2010). In the long-term, increased levels of genetic variation could act as a reservoir for future adaptation if rare environments become more common (Van Dyken and Wade 2010). Similarly, morph-biased genes could be viewed in the context of pleiotropy, with these biased genes exhibiting less pleiotropy precisely because they are expressed highly in only one morph. Less pleiotropy results in accelerated evolution, as has previously been demonstrated with sex-specific and tissue-specific gene expression (Duret and Mouchiroud 2000; Ellegren and Parsch 2007).
An alternative hypothesis for the pattern of faster rate of evolution of morph-biased genes is that rapidly evolving genes may be more likely to be recruited into morph-biased or morph-specific roles. Rapidly evolving genes tend to display low levels of pleiotropy and high levels of dispensability (Hirsh and Fraser 2001), and therefore could be recruited from old to new roles without negatively affecting organismal fitness. Consistent with this latter hypothesis, two studies have found that morph-biased genes identified in phenotypically plastic species are also fast evolving in nonplastic relatives (Hunt et al. 2011; Leichty et al. 2012). These two hypotheses, however, are not mutually exclusive; fast-evolving genes may be preferentially co-opted into morph expression, but they are still expected to experience relaxed purifying selection due to their less frequent expression once co-opted.
We examined the rate of molecular evolution of morph-biased genes in pea aphids (Acyrthosiphon pisum). Aphids have long been models for studying the causes and consequences of phenotypic plasticity (Lees 1966; Blackman 1974; Dixon 1997). Pea aphids, like most aphids, have a complex life cycle that alternates between asexual and sexual forms of reproduction depending on the season (reviewed in Moran 1992). During the spring and summer months, pea aphids reproduce parthenogenetically, producing genetically identical daughters for as many as 10–20 successive generations. These asexual females can be winged or wingless depending on environmental conditions (Sutherland 1969; Blackman 1987; Hales et al. 2002). A single generation of sexual morphs (sexual females and males) is born from parthenogenetic females in the fall and is induced by a combination of cold temperatures and short photoperiods (MacKay 1989; Via 1992). Males, which are XO and thus have a single X chromosome, are produced genetically by the random loss of one X (Orlando 1974; Blackman 1987; Wilson et al. 1997). No recombination occurs in this process, so the X chromosomes of a male and his mother are identical. The presence of the winged or wingless morph in males is due to a single locus on the X chromosome (Caillaud et al. 2002).
This complex life cycle results in a variety of adult aphid morphs, including asexual and sexual as well as winged and wingless phenotypes. Asexual females dominate the life cycle in terms of the total number of aphids and number of generations, whereas sexual females and males are far less prevalent because they are present for only a short period of time in the fall. Both winged and wingless morphs can be found in most populations for asexual females and males in the United States, whereas population have been found to differ by host plant for the prevalence of male winged versus wingless morphs in Europe (Frantz et al. 2010).
We previously showed that a small set of male-biased genes identified via microarray analysis evolve faster in pea aphids due to a relaxation of purifying selection (Brisson and Nuzhdin 2008). Here, we significantly extend this analysis. We used RNA-Seq to identify morph-biased genes in cDNA derived from adult, whole bodies of winged asexual females, wingless asexual females, sexual females, winged males, and wingless males to identify the gene expression basis of morph differences. Winged asexual females, wingless asexual females, and sexual females are genetically identical, whereas males are identical to the females except they only have one of her X chromosomes. We used these data to identify morph-biased and morph-specific genes. We sampled all five morphs from three different aphid genotypes, allowing us to identify gene expression differences that are truly biased toward particular morphs rather than specific to a particular morph within a particular genotype. Our goal was to investigate patterns of intraspecific polymorphism and interspecific divergence in morph-biased genes relative to unbiased genes. Our results provide significant information regarding how phenotypic plasticity impacts the evolution of morph-biased genes.
Results
Gene Expression Profiles of Different Pea Aphid Morphs
We found that the five pea aphid morphs are differentiated at the gene expression level. We performed a principle component analysis (PCA) on the total expressed genes. Figure 1A shows how the five morphs are distributed with respect to the two major PCA axes of variation generated from 20,657 genes. PC1, which accounts for 33% of the variance in the transcriptional data, primarily separates sexual females, asexual females, and males. PC2, which accounts for 23% of the variance, further separates the asexual females into winged and wingless. Hierarchical clustering of the gene expression profiles of each morph demonstrates that the largest divide is between females and males (fig. 1B). Females and males are not genetically identical; they differ from each other in that males have only one copy of the female’s X chromosome (females are XX and males XO). In contrast, sexual and asexual females have no genetic differences despite their unique gene expression patterns. These females are phenotypically differentiated at the whole-body level most noticeably in their ovaries. Asexual females contain developing embryos in their ovaries, whereas sexual females contain developing eggs. Many of the gene expression differences observed between them may arise from these ovarian differences.
Fig. 1.

Differences in gene expression values among the five pea aphid morphs. (A) The first two PCA axes, which account for 33% and 23% of the total variance in gene expression, differentiate most of the morphs. Ellipses indicate the 95% standard deviation confidence limit. (B) Hierarchical clustering of the normalized gene expression values for each morph. The biological replicates (three distinct genotypes) were averaged and data were log +1 transformed prior to clustering. The pvclust package in R was used for clustering via the function hclust and for assessing uncertainty in the hierarchical cluster analysis using default parameter values. P values on nodes (in %) were generated via multiscale bootstrap resampling using 1,000 replicates. (C) Pearson correlation coefficients for each pairwise comparison on log +1 transformed data. WLAF, wingless asexual female; WAF, winged asexual female; SF, sexual female; WLM, wingless male; WM, winged male.
We identified a large number of morph-biased genes: 3,374 sexual female-biased, 1,856 asexual female-biased, and 4,938 male-biased genes, using the criteria of an false discovery rate (FDR)-corrected P < 0.05 for differential expression as determined in DESeq2 and greater than 2-fold higher expression relative to the other morphs (see supplementary table S1, Supplementary Material online, for a list of all morph-biased genes; winged and wingless morphs were not used separately for this analysis). Sexual female-biased genes were significantly enriched (Fisher’s exact test, FDR-corrected P < 0.05) for gene ontology (GO) terms related to the cell cycle, chromatin organization, and gene expression. Asexual female-biased genes were primarily enriched for terms related to development and cellular differentiation, likely reflecting the presence of developing embryos in their ovaries. Male-biased genes were more varied in their identity, with only a handful of GO terms related to ion channel, hormone, and hydrolase activity being significant. GO terms can be found in supplementary table S2, Supplementary Material online.
Morph-Biased and Morph-Specific Gene Evolution
To determine the impact of morph-biased gene expression on rates of gene evolution, we first identified putative orthologs of pea aphid genes in the cotton aphid (Aphis gossypii) using expressed sequence tag (EST) data from that species. We then examined the relationship between morph bias and the rate of nucleotide substitution. It is well known that a number of factors can influence the rate of change in genes, such as presence on the sex chromosomes, overall expression level, and gene length. Thus to control for these other factors, we used a linear model to look at the effects of morph specificity (see Materials and Methods for how this measure was calculated), chromosome (X vs. autosome as determined in Bickel et al. 2013), normalized expression level, and coding sequence (CDS) length on log transformed dN/dS values. This model used information from all genes for which we had dN/dS data (n = 5,844; supplementary table S3, Supplementary Material online).
We found that morph specificity does indeed have a highly significant effect on dN/dS (table 1). This confirmed our expectations that higher morph specificity would correspond to faster rates of evolution between species. CDS length was also highly significant, but negatively correlated such that shorter coding regions were associated with higher dN/dS. This relationship was not due to short genes causing spurious alignments with putative orthologs, inflating dN/dS; we noted that alignments of <300 bp actually exhibited a positive relationship between gene length and dN/dS (n = 319, Spearman R = 0.19, P = 0.001). Thus, globally, it appears as though short genes evolve faster, with the exception of very short genes. This global relationship is the opposite of the one observed in Drosophila, where longer proteins were observed to evolve more rapidly (Lemos et al. 2005). Asexual and sexual female expression levels also significantly negatively impacted dN/dS, indicating that weakly expressed genes evolve faster than genes with higher transcript levels as observed in other species (Duret and Mouchiroud 2000; Pal et al. 2001; Rocha and Danchin 2004). Overall, morph specificity, CDS length, and expression levels all significantly affected the rate of gene evolution.
Table 1.
Results from a Linear Model Examining the Effect of the below Factors on Log-Transformed dN/dS.
| Estimate | Standard Error | t Value | P Value | |
|---|---|---|---|---|
| (Intercept) | −2.94 | 0.053 | −55.29 | <2 × 10⁻¹⁶*** |
| Sexual female Exp. | −1.02 × 10−05 | 2.52 × 10−06 | −4.06 | 4.9 × 10−05*** |
| Male Exp. | 1.68 × 10−06 | 7.94 × 10−07 | 2.12 | 0.034* |
| Asexual female Exp. | −7.88 × 10−06 | 1.32 × 10−06 | −5.96 | 2.73 × 10−09*** |
| Morph specificity | 0.475 | 0.076 | 6.23 | 4.90 × 10⁻¹⁰*** |
| Chromosome | −0.015 | 0.065 | −0.23 | 0.820 |
| CDS length | −4.16 × 10−05 | 7.52 × 10−06 | −5.53 | 3.37 × 10−08*** |
***P < 0.001, *P < 0.05.
Morph specificity also positively impacted dN values and dS values (supplementary table S4, Supplementary Material online). Typically, synonymous sites are thought of as neutrally evolving and thus dS should be the same for all gene classes. But, we do observe a difference in dS values across gene categories. We postulate that this may be due to differences in selection on codon usage. We find that the effective number of codons, a commonly used measure of codon bias representing how more codons are used in less constrained genes, is significantly positively associated with morph specificity (Spearman correlation = 0.035, P = 0.007). This indicates that more morph-biased genes may exhibit less selection for codon usage at synonymous sites, as was first shown in Drosophila melanogaster male-biased genes (Hambuch and Parsch 2005).
We also considered the effect of increasing morph bias on rates of evolution compared with unbiased genes. We defined unbiased genes as those having expression values that were not significantly different among morphs (using the DESeq2 package with an FDR-adjusted P > 0.05) or had a fold change of <2 for each morph relative to all other morphs. For morph-biased genes, we divided them into three levels of bias: 2–5×, 5–10×, and >10×-fold change relative to other morphs, and examined their divergence via dN/dS. This analysis resulted in three main outcomes. First, we hypothesized that all three classes of morph-biased genes would exhibit faster rates of evolution than unbiased genes, given that unbiased genes are expressed equally in all morphs and thus always expressed in the population. Consistent with this expectation, we observed that morph-biased genes do evolve faster than unbiased genes, although for asexual females this is only true in highly morph-biased genes (5× and greater, fig. 2A). Second, we expected and found that increasing levels of bias result in increasing rates of evolution (fig. 2A). And finally, we hypothesized that sexual female- and male-biased genes would evolve faster than asexual female-biased genes. We anticipated this because sexual females and males are the least common morph and are only present in pea aphid populations for a few weeks in the fall (one generation). In contrast, the asexual females are present for 10–20 generations in the summer. We therefore expected that sexual female- and male-biased genes would have elevated nonsynonymous substitutions relative to asexual female-biased genes because of a relaxation of purifying selection. Our results indicate that sexual female- and male-biased genes do generally evolve faster than asexual female-biased genes. This is true for the 2–5× biased gene categories as well as the highly (>10×) morph-biased genes (Mann–Whitney U tests: Males vs. asexual females P = 3.4 × 10⁻¹³ for 2–5×, P = 0.029 for >10×; sexual females vs. asexual females P = 5.3 × 10⁻⁸ for 2–5×, P = 0.024 for >10×). Similar plots for dN and dS can be found in supplementary fig. S1, Supplementary Material online.
Fig. 2.

Measures of divergence and selection for unbiased (UB), asexual female (AF), sexual female (SF), and male (M) biased genes. Panel (A) shows mean dN/dS values and panel (B) shows mean Tajima’s D values. Samples sizes are indicated within each bar. Error bars show standard error. Fold change categories are indicated by 2×, 5×, or 10× (see text for details on how these were defined). Significance of a Kruskal–Wallis test within morphs is shown as asterisks above or below the bars and significance of a Mann–Whitney test comparing each bar to the unbiased gene set is indicated by asterisks within the bar. ***P < 0.001, **P < 0.01, *P < 0.05, NS (not significant) P > 0.05.
We further identified genes that are biased to the winged and wingless morphs produced within asexual females and males. We hypothesized that winged or wingless-biased genes within a morph would experience less purifying selection than genes expressed regardless of the wing phenotype, and thus these biased genes would have elevated levels of nonsynonymous nucleotide substitutions. We identified genes as winged or wingless male-biased in a similar manner as the previous groups: They were differentially expressed (FDR-corrected P < 0.05) across the normalized expression values of all five morphs, they had >2×-fold change relative to all other morphs, and they were a subset of the male-biased genes. Winged and wingless asexual female-biased genes were identified in the same manner. We found 69 winged asexual female-biased, 838 wingless asexual female-biased, 326 winged male-biased, and 1,149 wingless male-biased genes (supplementary table S5, Supplementary Material online). Very few of these genes had orthologs in A. gossypii, and thus examination of dN/dS values involved small samples sizes (fig. 3A). Further, analysis of dN/dS values for these genes did not yield the anticipated result: Neither winged nor wingless asexual female-biased genes exhibited evidence of evolving faster than asexual female-biased genes. The same pattern was seen in males. Because sample sizes were low in this analysis, we also pursued a second approach to evaluating the rate of evolution of increasingly morph-biased genes. For male- or female-biased genes, we calculated their winged or wingless specificity on a scale of 0–1 (see Materials and Methods for the calculations). We used a linear model to examine the influence of wing-morph specificity on the rate of evolution. Our results suggest that the rate of evolution does not increase with higher morph specificity for either males (n = 476, P = 0.34) or asexual females (n = 602, P = 0.89). Future analyses that examine this increasing morph specificity will have to await greater dN/dS sample sizes brought about by whole genome sequencing of other aphid species.
Fig. 3.
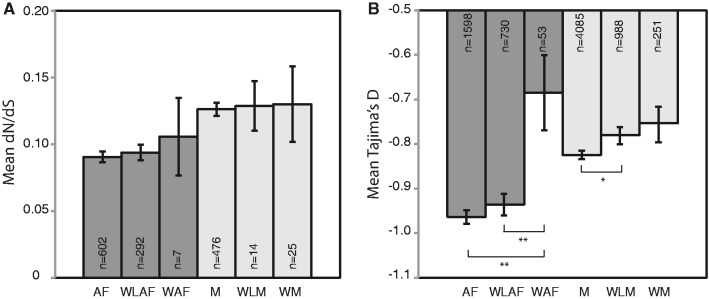
Measures of divergence and selection for winged and wingless-biased genes. Panel (A) shows mean dN/dS values and panel (B) shows mean Tajima’s D values. Samples sizes are indicated within each bar. Error bars show standard error. Significance of a Mann–Whitney test comparing each winged (W) or wingless (WL) bar to the asexual female (AF) or male (M) gene set is indicated by asterisks below the bar. ***P < 0.001, **P < 0.01, *P < 0.05, NS (not significant) P > 0.05.
Finally, we identified morph-specific genes (in contrast to morph-biased genes) as genes that were expressed exclusively in one morph. We suspected that these genes would exhibit especially high rates of evolution. We identified 543 morph-specific genes. Male-specific genes dominated this list, with 504 male-specific, 15 asexual female-specific, and 11 sexual female-specific. It was impossible to test whether these morph-specific genes are evolving particularly fast given that we only obtained four A. gossypii orthologs for them. When we further divided these morph-specific genes into winged and wingless, this resulted in a paucity of genes, with only 70 wingless male-specific genes, 1 winged male-specific genes, 1 winged asexual female-specific gene, and 0 wingless asexual female-specific genes.
Intraspecific Variation in Morph-Biased Genes
We used Tajima’s D values (Tajima 1989) to assess whether the different classes of morph-biased genes were experiencing different selection intensities. Note that the Tajima’s D values for pea aphid coding regions as previously calculated (Bickel et al. 2013) are skewed negative. This is likely due to a demographic factor of these sampled lines: They were collected in North America where pea aphids are introduced (e.g., Thomas 1878) and have experienced range expansion. This rapid expansion can cause negative Tajima’s D values even in presumably neutrally evolving regions, such as synonymous sites. Further negative skew likely resulted from sequencing errors (Achaz 2008) given that these values were calculated from low coverage genome sequencing (Bickel et al. 2013). (Note that using Tajima’s D values in our study was preferable to using McDonald–Kreitman tests [McDonald and Kreitman 1991] due to the limited number of A. gossypii orthologs available.) Thus, comparisons of Tajima’s D values between groups of genes is more relevant here than the absolute value of Tajima’s D.
If morph-biased genes evolve under relaxed purifying selection, they should exhibit higher values of Tajima’s D relative to unbiased genes. We observed this expected result with sexual female- and male-biased genes (fig. 2B). We therefore conclude that relaxed selection underlies the higher rates of evolution seen at sexual female- and male-biased genes. We did not observe this expected result with asexual female-biased genes. Asexual female-biased genes at 2× and 5× levels of bias had Tajima’s D values significantly lower than unbiased genes (fig. 2B). This result suggests that the higher rates of evolution seen in asexual female-biased genes may be due to adaptive evolution. Interestingly, winged asexual female-biased genes exhibited higher Tajima’s D values (fig. 3B) than genes that were asexual female-biased. This observation supports the idea that at least some asexual female morph-biased genes experience less purifying selection.
Chromosomal Location of Biased Genes
We found that male-biased genes are more likely to be found on the X chromosome. Of the 4,254 male-biased genes, 539 are on the X chromosome (gene location determined in Bickel et al. 2013). This observed 12.7% is a significant enrichment of male-biased genes on the X chromosome compared with 9.4% of all genes (Fisher’s exact text, P = 8.7 × 10⁻¹⁰) detected in our study. Female-biased genes are not significantly over or underrepresented on the X chromosome (asexual female-biased = 9.5% and sexual female-biased = 8.6%).
Discussion
The existence of phenotypic plasticity results in some genes exhibiting morph-biased or morph-specific expression, which in turn can theoretically affect their rate of evolution (Van Dyken and Wade 2010). Pea aphids produce different morphs that are present in the population for different lengths of time. Here, we have used these different morphs as a natural system for examining how morph-biased gene expression affects gene evolution.
Rare Pea Aphid Morphs Evolve Quickly and Experience Relaxed Purifying Selection
Several lines of evidence presented here suggest that genes that only have a role in less common morphs will diverge in sequence faster than genes that are expressed ubiquitously. Here, we have used biased gene expression as a proxy for function within a morph. Although the exact relationship between morph bias and morph fitness is not well-understood, Drosophila genes with highly sex-biased expression (>4-fold differential expression) have the most demonstrable effects on sex-specific fitness (Connallon and Clark 2011). Thus, we assume that some morph-biased genes with high levels of differential expression may be functionally important for that morph.
First, our results show that rates of evolution, as measured by dN/dS, are generally elevated in morph-biased genes relative to unbiased genes, which are expressed in all morphs at all times and therefore spend the most time being expressed. This pattern of higher rates of evolution of morph-biased genes was particularly noticeable when differential expression rose to 5-fold or higher. Therefore, these highly morph-biased genes may be functionally relevant for the morphs yet simultaneously be rapidly evolving in a potentially nonadaptive manner. Second, sexual female- and male-biased genes evolve faster than asexual female-biased genes for highly morph-biased genes (>10×). Sexual females and males are of special interest in this study because they are far less common in the pea aphid life cycle. These two morphs are produced for a single sexual generation in the fall; in contrast, asexual females are present throughout the spring and summer months. Because of their rarity, we expected sexual female- and male-biased genes to experience relaxed selection and, consequently, exhibit higher rates of evolution. And third, increasing morph bias, regardless of the morph (asexual female, sexual female, or males), results in higher rates of evolution. This is likely due to the fact that increasing morph bias means that other morphs exhibit less expression of this gene.
We further showed that relaxed purifying selection was the driver of these increased rates of evolution in sexual female- and male-biased genes. When a gene is expressed at high levels in only one morph, it experiences purifying selection, the most common mode of selection, in only that morph. A morph-biased gene is therefore less often under selection than an unbiased gene, making the impact of drift larger at that gene. The increased importance of drift in the drift/selection balance of biased genes likely leads to an increase in the number of slightly deleterious mutations at these genes (Van Dyken and Wade 2010). We expected and observed this pattern to be strongest in sexual female- and male-biased genes given their low occurrence and thus smaller relative impact of purifying selection. We also expected this pattern to be much weaker in asexual females because their numbers dominate the life cycle, although asexual female-biased genes would still be exposed to selection less than unbiased genes. Interestingly, we observed lower values of Tajima’s D for asexual female-biased genes compared with unbiased genes despite the higher divergence of these same genes between species. This pattern indicates that adaptive evolution may be acting on these genes. In the future, it would be intriguing to investigate whether morph-biased genes retain their morph-biased status across species, given the strong relative effect of genetic drift on some of these genes. We expect that asexual female-biased genes remain relatively constant across species, whereas sexual female- and male-biased genes exhibit more turnover.
The presence of winged and wingless morphs allowed us to examine even less common morphs. We did not observe significantly higher rates of divergence between species for winged or wingless-biased genes of asexual females and males relative to genes that are not biased to either wing morph although sample sizes were too low to convincingly test this. We did, however, observe significantly higher Tajima’s D values within pea aphids for winged asexual female-biased and wingless male-biased genes, indicating that less purifying selection may be currently acting on these genes in pea aphid populations.
Another way of considering morph-biased genes is by recognizing different sexes as different morphs although most species harbor genetic differences between sexes. Sex-biased genes, especially male-biased genes but also sometimes sexual female-biased genes, are known to evolve more quickly than unbiased genes (Swanson and Vacquier 2002; Ellegren and Parsch 2007; Parsch and Ellegren 2013). In many cases, this has been attributable to positive selection and thus adaptive evolution of genes coding for proteins expressed specifically in reproductive tissues (e.g., Aguade 1998; Swanson et al. 2001; Swanson and Vacquier 2002; Swanson et al. 2004; Zhang et al. 2004; Proschel et al. 2006). Alternatively, the faster rates of evolution of genes expressed in reproductive tissues could be due to relaxed selective constraint, given that these genes are often limited in expression breadth and thus exhibit low levels of pleiotropy (Meisel 2011).
Reproductive tissue-specific expression could contribute to the molecular evolution of morph-biased gene evolution in pea aphids. Our pea aphid samples, which were whole bodies, contained both reproductive and nonreproductive tissues. We observed a pattern of relaxed selection driving faster rates of evolution in sexual female and male pea aphids. This could be due to the majority of the sexual-female and male-biased genes experiencing relaxed purifying selection, whereas simultaneously a subset of the genes encoding key reproductive proteins could be evolving quickly due to positive selection. In other words, our results do not preclude adaptive evolution occurring at sex-biased genes. Further, the lower levels of pleiotropy exhibited by largely reproductive tissue-limited expression could be significantly contributing to our observed patterns of relaxed selective constraint. Even more generally, any kind of tissue-specific expression would result in lower pleiotropy and thus result in relaxation of purifying selection. To investigate these issues, in the future it will be critical to perform expression profiling of specific tissues, such as gonads, separately.
Sex-biased genes are often nonrandomly distributed among autosomes and sex chromosomes (Parisi et al. 2003; Ranz et al. 2003; Ellegren and Parsch 2007). A previous study in the pea aphid found that male-biased genes are found on the X chromosome at levels higher than chance (Jaquiery et al. 2013). Here, we also observed a masculinization of the X chromosome. Our results extend the validity of these previous results, as our data set included three different aphid genotypes and therefore increased the likelihood of identifying truly morph-biased (and not just biased in one genotype), whereas the previous study only considered replicates of a single genotype. Unlike the previous study (Jaquiery et al. 2013), we did not observe a significant enrichment of asexual female-biased genes on autosomes, nor a significantly higher rate of evolution for X-linked genes. This is potentially explained by the different methods of assigning genes to the X versus autosomes used by the two studies.
A Scarcity of Morph-Specific Genes in the Pea Aphid
One of the novel aspects of this study compared with analysis of morph-biased genes in other systems (Hunt et al. 2010, 2011; Snell-Rood et al. 2011; Leichty et al. 2012) is that we used RNA-Seq data to assay gene expression levels rather than microarray data. Low expression cannot be distinguished from a lack of expression with microarrays; RNA-Seq is more accurate at assaying expression levels of lowly expressed and unexpressed genes (Marioni et al. 2008; Wilhelm et al. 2008; Fu et al. 2009). This highly sensitive approach, combined with high sequence coverage (an average of 52.5 million mapped reads per sample), allowed us to identify genes that were putatively not expressed.
When we considered gene expression across all five pea aphid morphs, we found very few genes that were expressed in only a single morph. We conclude that truly morph-specific genes are uncommon. There are many other developmental stages (e.g., eggs, nymphs, older adults) and even other morphs (e.g., fundatrices, sexuparae) that could be examined in this species. If these were added to the data set, it is likely that the list of morph-specific genes would shorten. This is an important conclusion because models that address how relaxed selection affects gene evolution are often built upon the assumption of morph-specific genes (Van Dyken and Wade 2010) even though conditional-specific gene expression is common (reviewed in Snell-Rood et al. 2010). Our data suggest that future theory efforts should focus more on the effect of morph-biased, rather than morph-specific, expression.
However, it may also be true that some genes with low expression are functionally not important. Their low expression may just be a consequence of leaky transcription that results in no protein product or a protein product at levels too low to contribute to cellular processes. In other words, some of the morph-biased genes that we have identified may functionally be morph-specific. In this case, a much larger number of genes may fit the mentioned models based on morph specificity. At this time, it is impossible to determine which morph-biased genes may be in this category.
Conclusion
Phenotypic plasticity is ubiquitous, yet we are only beginning to understand the impact of plasticity on molecular evolution. Our results join a growing body of work in showing that morph-biased genes evolve more quickly than ubiquitously expressed genes, and that these faster rates of evolution are due primarily to relaxed purifying selection. We extend previous analyses by showing that the rarer the morph, the more quickly genes biased to these rarer morphs evolve. Our results thus support the hypothesis that relaxed purifying selection leads to faster rates of gene evolution. Unresolved by our approach, however, is the nonmutually exclusive hypothesis of alternative morphs co-opting rapidly evolving genes. Addressing this hypothesis will have to await the availability of an appropriate aphid outgroup to test whether rapid evolution predated morph bias.
Materials and Methods
Insect Rearing and Sample Collection
We reared three pea aphid clonal lines, F1, BK11 and Ithaca18, in small cages using Vicia faba L. as a host plant at 18 °C on a 16:8 (L:D) cycle. BK11 and Ithaca18 were collected in Massachusetts and New York, respectively. The F1 line resulted from a cross between two New York lines (Braendle et al. 2005).
We reared asexual female aphids at low density (less than six individuals per cage) to produce wingless asexual females. To produce winged asexual females, we crowded 12 asexual adult females by placing them in a small Petri plate for 24 h (crowding induces the production of winged offspring; Sutherland 1969). We then transferred females to caged plants and reared their offspring to maturity. We collected winged and wingless asexual adult females on the second day after their adult molt. All individuals (including the ones described below) were collected between noon and 2 PM to control for circadian changes in gene expression.
We transferred adult asexual female aphids to an incubator that mimics fall photoperiod (L:D cycle = 13:11) with a colder temperature (15 °C) to induce sexual morph production. After 5–6 weeks the aphids began producing sexual morphs. We collected third and fourth instar nymphs and placed them on a caged V. faba plant. We observed them every day until they molted into adulthood. We transferred the newly molted adult morphs individually on a new, caged plant and collected 2-day-old adults. Sexual females were difficult to identify as early adults. We therefore sometimes waited for four more days to collect them to make sure that they were not asexual females.
We collected whole bodies of 30 adult aphids of each of the five morphs and three clones (total of 15 samples) by flash freezing them in liquid nitrogen. Samples were stored at −80 °C. We used three different clones as biological replicates for downstream analyses rather than three replicates of the same clone in order to identify genes that were systematically expressed in a particular morph, not just a particular morph of a particular clone.
RNA Extraction and Sequencing
Total RNA was extracted using a phenol/chloroform extraction. RNA was quantified by Qubit and the quality was checked by Bioanalyzer (Agilent). RNA sequencing libraries were constructed per manufacturer instructions with sample-specific tags (Illumina) and sequenced on an Illumina HiSeq 2000 sequence analyzer at the University of Nebraska Medical Center using 50 or 100 base single end sequencing. Two samples were pooled per lane for a total of 7.5 lanes of sequencing. RNA-Seq samples have been deposited to NCBI’s GEO archive under accession number GSE56830.
RNA-Seq Data Mapping and Analysis
We mapped sequencing reads to the 36,961 gene predictions of v2.1 annotation of the pea aphid genome (available at aphidbase.com) using the Arraystar Software (DNAStar Inc.). Reads were aligned to the reference transcriptome if 97% of the bases matched within each read. Reads aligning to more than one transcript equally were excluded. The numbers of mapped reads per library ranged from 32 to 78 million (average is 52.5 million). Genes with a total raw read count of <100 for all 15 libraries were filtered out to produce a final set of 20,657 genes.
The DESeq2 R package (Anders and Huber 2010) was used to normalize the libraries and to identify the significantly differentially expressed genes among the three types of morphs (asexual females, sexual females, and males). For each of the 20,657 genes, two generalized linear models (GLMs) were compared using likelihood ratio tests implemented in DESeq2, one with morph type as a factor (this factor having three levels: Male, sexual female, and asexual female), and one without it. A clone effect (with three levels, corresponding to the three clonal lines) and wing phenotype effect (with two levels, winged or wingless) were also included in both models to control for the structure of the data. If the inclusion of the morph type as a factor significantly improved the model fit for a particular gene (P < 0.05 after correcting for multiple testing using the Benjamini–Hochberg method), it was concluded that the expression of that gene significantly differs between the three morphs. All analyses were performed using R (v. 2.15.0; R Development Core Team 2012).
Identification of Morph-Biased, Unbiased Genes, and Morph-Specific Genes
Morph-biased genes were identified as having an adjusted P < 0.05 for morph effect in the GLMs implemented in DESeq2 and 2-fold higher expression in one morph relative to the other morphs. The unbiased gene set consisted of genes with adjusted P > 0.05 from the differential gene expression analysis of three-morphs (DESeq2) or fold change less than two relative to other morphs. To look at increasing levels of morph bias, we used a conservative measure of bias that defined the bias by the lowest fold change of the focal morph relative to each of the two other morphs as in Jaquiery et al. (2013). We used categories of 2–5×, 5–10×, and >10×. For example, a gene that was expressed 3× higher in asexual females than males and 10× higher in asexual females than sexual females would be placed in the 2–5× category because the lowest fold change of the two (3× and 10×) was 3×.
Morph specificity was measured for each gene as  (Yanai et al. 2005), where xi stands for the average normalized expression level of the focal gene in morph i (i = asexual female, sexual female, or male). This results in a specificity term that ranges from 0 to 1, with 1 being the most specific.
We identified genes biased toward winged and wingless morphs that were a subset of male- and asexual female-biased genes to examine the effect of increased morph bias on dN/dS. To do this, we first used additional GLMs in DESeq2 to identify genes significantly differentially expressed among the five pea aphid morphs. We compared the model in which we included a morph effect (this factor having here five levels: Winged male, wingless male, sexual female, winged asexual female, and wingless asexual female) and a clone effect. The effect of morph on a particular gene was considered as significant if the full model (including morph effect) was significantly better than the model without this factor based on likelihood ratio tests (after adjusting for multiple testing, Benjamini–Hochberg method). Morph-biased genes were defined as having P < 0.05 and a 2×-fold change greater in the focal morph relative to all four other morphs. From this data set, we then selected winged and wingless asexual female-biased genes that were a subset of asexual female-biased genes and winged and wingless male-biased genes that were a subset of male-biased genes to examine the effect of increased morph bias on dN/dS. Wing specificity was calculated using the above equation, with i = winged or wingless morph, independently calculating this value for males and asexual females.
We defined morph-specific genes as those having average read counts <4 for all morphs but one, with the remaining morph having an average read count >52. A read count of <4 for our data corresponds to a −4 log2RPKM given our average of 52.5 million mapped reads per sample, and a read count >52 corresponds to a positive log2RPKM. Expression levels below −4 log2RPKM are likely to be nonfunctional transcripts (Hebenstreit et al. 2011) and thus we consider these genes as not expressed.
Reconstruction of Protein Coding Genes from EST Sequences
Expressed sequence tags from A. gossypii were analyzed through BlastX (Altschul et al. 1990) against Uniprot (cut-off e value of 10e−10) as described in Ollivier et al. (2010). This information helped to identify potential homology and was used in the CDS detection process. We then ran FrameD with the frameshift detection and correction option (Schiex et al. 2003) to predict CDSs from unique transcripts. We retained only CDSs of at least 150 bp.
Identification of A. gossypii Orthologs and Calculation of Divergence Values
The reciprocal best hits (RBH) method was used to identify putative orthologs between A. pisum and A. gossypii (Hirsh and Fraser 2001; Jordan et al. 2002) as described in Ollivier et al. (2010). For all RBH pairs, translated sequences were aligned using T-coffee (Notredame et al. 2000), with nucleotide sequences being aligned using the protein alignment as a guide. Alignments were trimmed using Gblocks (Castresana 2000) to retain only the parts that aligned well. The following options were used: “codons” (trimming only entire codons), −b3 = 6 (maximum number of contiguous nonconserved positions), and −b4 = 9 (minimum length of a block). The minimum alignment length after trimming was 60 bp. We then estimated maximum-likelihood pairwise synonymous (dS) and nonsynonymous (dN) evolutionary rates, using a codon-based model (Codeml from PAML; Yang 1997). PAML was parameterized for pairwise rates estimations (runmode = −2) and nucleotide frequencies at the three codon positions were used as free parameters (CodonFreq = 3).
Population Genetic Statistics
As previously described (Bickel et al. 2013), we calculated Tajima’s D (Tajima 1989) to identify genes not evolving neutrally. As detailed in Bickel et al. (2013), this statistics was calculated from low coverage genome resequencing of 21 pea aphid genotypes.
Synonymous Codon Usage Analysis
We estimated codon usage bias using the effective number of codons (Wright 1990) using the CodonW program (http://bioweb.pasteur.fr/seqanal/interfaces/codonw.html, last accessed May 6, 2014). This measure is lower for genes with stronger synonymous codon usage bias.
Supplementary Material
Supplementary tables S1–S6 and figure S1 are available at Molecular Biology and Evolution online (http://www.mbe.oxfordjournals.org/).
Acknowledgments
Statistical help was provided by Travis Hinkelman and Drew Tyre. The authors thank two reviewers for thoughtful comments that improved this manuscript. This work was supported by startup funds from the School of Biological Sciences at the University of Nebraska-Lincoln and by award R00ES017367 from the National Institute of Environmental Health Sciences to J.A.B. INRA SPE supported a 2-month stay in INRA Rennes for J.A.B. J.J. acknowledges support by Agence Nationale de la Recherché, grant ANR-11-BSV7-005-01.
References
- Achaz G. Testing for neutrality in samples with sequencing errors. Genetics. 2008;179:1409–1424. doi: 10.1534/genetics.107.082198. [DOI] [PMC free article] [PubMed] [Google Scholar]
- Aguade M. Different forces drive the evolution of the Acp26Aa and Acp26Ab accessory gland genes in the Drosophila melanogaster species complex. Genetics. 1998;150:1079–1089. doi: 10.1093/genetics/150.3.1079. [DOI] [PMC free article] [PubMed] [Google Scholar]
- Altschul SF, Gish W, Miller W, Myers W, Lipman DJ. Basic local alignment search tool. J Mol Evol. 1990;215:403–410. doi: 10.1016/S0022-2836(05)80360-2. [DOI] [PubMed] [Google Scholar]
- Anders S, Huber W. Differential expression analysis for sequence count data. Genome Biol. 2010;11:R106. doi: 10.1186/gb-2010-11-10-r106. [DOI] [PMC free article] [PubMed] [Google Scholar]
- Barker MS, Demuth JP, Wade MJ. Maternal expression relaxes constraint on innovation of the anterior determinant, bicoid. PLoS Genet. 2005;1:e57. doi: 10.1371/journal.pgen.0010057. [DOI] [PMC free article] [PubMed] [Google Scholar]
- Bickel RD, Dunham JP, Brisson JA. Widespread selection across coding and noncoding DNA in the pea aphid genome. G3. 2013;3:993–1001. doi: 10.1534/g3.113.005793. [DOI] [PMC free article] [PubMed] [Google Scholar]
- Blackman RL. Aphids. London: Ginn and Company Ltd; 1974. [Google Scholar]
- Blackman RL. Reproduction, cytogenetics and development. In: Minks AK, Harrewijn P, editors. Aphids: their biology, natural enemies & control. Vol. 2A. Amsterdam: Elsevier; 1987. pp. 163–195. [Google Scholar]
- Braendle C, Caillaud MC, Stern DL. Genetic mapping of aphicarus—a sex-linked locus controlling a wing polymorphism in the pea aphid (Acyrthosiphon pisum) Heredity. 2005;94:435–442. doi: 10.1038/sj.hdy.6800633. [DOI] [PubMed] [Google Scholar]
- Brisson JA, Davis GK, Stern DL. Common genome-wide transcription patterns underlying the wing polyphenism and polymorphism in the pea aphid (Acyrthosiphon pisum) Evol Dev. 2007;9:338–346. doi: 10.1111/j.1525-142X.2007.00170.x. [DOI] [PubMed] [Google Scholar]
- Brisson JA, Nuzhdin SV. Rarity of males in pea aphids results in mutational decay. Science. 2008;319:58. doi: 10.1126/science.1147919. [DOI] [PubMed] [Google Scholar]
- Caillaud MC, Boutin M, Braendle C, Simon J-C. A sex-linked locus controls wing polymorphism in males of the pea aphid, Acyrthosiphon pisum (Harris) Heredity. 2002;89:346–352. doi: 10.1038/sj.hdy.6800146. [DOI] [PubMed] [Google Scholar]
- Castresana J. Selection of conserved blocks from multiple alignments for their use in phylogenetic analysis. Mol Biol Evol. 2000;17:540–552. doi: 10.1093/oxfordjournals.molbev.a026334. [DOI] [PubMed] [Google Scholar]
- Connallon T, Clark AG. Associations between sex-biased gene expression and mutations with sex-specific phenotypic consequences in Drosophila. Genome Biol Evol. 2011;3:151–155. doi: 10.1093/gbe/evr004. [DOI] [PMC free article] [PubMed] [Google Scholar]
- Dixon AFG. Aphid ecology: an optimization approach. 2nd ed. London: Chapman & Hall; 1997. [Google Scholar]
- Duret L, Mouchiroud D. Determinants of substitution rates in mammalian genes: expression pattern affects selection intensity but not mutation rate. Mol Biol Evol. 2000;17:68–74. doi: 10.1093/oxfordjournals.molbev.a026239. [DOI] [PubMed] [Google Scholar]
- Ellegren H, Parsch J. The evolution of sex-biased genes and sex-biased gene expression. Nat Rev Genet. 2007;8:689–698. doi: 10.1038/nrg2167. [DOI] [PubMed] [Google Scholar]
- Frantz A, Plantegenest M, Simon J-C. Host races of the pea aphid Acyrthosiphon pisum differ in male wing phenotypes. Bull Entomol Res. 2010;100:59–66. doi: 10.1017/S0007485309006750. [DOI] [PubMed] [Google Scholar]
- Fu X, Fu N, Guo SW, Yan Z, Xu Y, Hu H, Menzel C, Chen W, Li Y, Zeng R, et al. Estimating accuracy of RNA-Seq and microarrays with proteomics. BMC Genomics. 2009;10:161. doi: 10.1186/1471-2164-10-161. [DOI] [PMC free article] [PubMed] [Google Scholar]
- Grozinger CM, Fan Y, Hoover SER, Winston ML. Genome-wide analysis reveals differences in brain gene expression patterns associated with caste and reproductive status in honey bees (Apis mellifera) Mol Ecol. 2007;16:4837–4848. doi: 10.1111/j.1365-294X.2007.03545.x. [DOI] [PubMed] [Google Scholar]
- Hales DF, Wilson ACC, Sloane MA, Simon J-C, Legallic J-F, Sunnucks P. Lack of detectable genetic recombination on the X chromosome during the parthenogenetic production of female and male aphids. Genet Res (Camb). 2002;79:203–209. doi: 10.1017/s0016672302005657. [DOI] [PubMed] [Google Scholar]
- Hambuch TM, Parsch J. Patterns of synonymous codon usage in Drosophila melanogaster genes with sex-biased expression. Genetics. 2005;2005:1691–1700. doi: 10.1534/genetics.104.038109. [DOI] [PMC free article] [PubMed] [Google Scholar]
- Hebenstreit D, Fang M, Gu M, Charoensawan V, van Oudenaarden A, Teichmann SA. RNA sequencing reveals two major classes of gene expression levels in metazoan cells. Mol Syst Biol. 2011;7:497. doi: 10.1038/msb.2011.28. [DOI] [PMC free article] [PubMed] [Google Scholar]
- Hirsh AE, Fraser HB. Protein dispensability and rate of evolution. Nature. 2001;411:1046–1049. doi: 10.1038/35082561. [DOI] [PubMed] [Google Scholar]
- Hunt BG, Ometto L, Wurm Y, Shoemaker D, Yi SV, Keller L, Goodisman MAD. Relaxed selection is a precursor to the evolution of phenotypic plasticity. Proc Natl Acad Sci U S A. 2011;108:15936–15941. doi: 10.1073/pnas.1104825108. [DOI] [PMC free article] [PubMed] [Google Scholar]
- Hunt BG, Wyder S, Elango N, Werren JH, Zdobnov EM, Yi SV, Goodisman MAD. Sociality is linked to rates of protein evolution in a highly social insect. Mol Biol Evol. 2010;27:497–500. doi: 10.1093/molbev/msp225. [DOI] [PubMed] [Google Scholar]
- Hunt J, Simmons LW. Patterns of fluctuating asymmetry in beetle horns: an experimental examination of the honest signalling hypothesis. Behav Ecol Sociogiol. 1997;41:109–114. [Google Scholar]
- Jaquiery J, Rispe C, Roze D, Legeai F, Le Trionnaire G, Stoeckel S, Mieuzet L, Da Silva C, Poulain J, Prunier-Leterme N, et al. Masculinization of the X chromosome in the pea aphid. PLoS Genet. 2013;9:e1003690. doi: 10.1371/journal.pgen.1003690. [DOI] [PMC free article] [PubMed] [Google Scholar]
- Jordan IK, Rogozin IB, Wolf YI, Koonin EV. Essential genes are more evolutionarily conserved than are nonessential genes in bacteria. Genome Res. 2002;12:962–968. doi: 10.1101/gr.87702. [DOI] [PMC free article] [PubMed] [Google Scholar]
- Kawecki TJ. Accumulation of deleterious mutations and the evolutionary cost of being a generalist. Am Nat. 1994;144:833–838. [Google Scholar]
- Kawecki TJ, Barton NH, Fry JD. Mutational collapse of fitness in marginal habitats and the evolution of ecological specialisation. J Evol Biol. 1997;10:407–429. [Google Scholar]
- Kingsolver JG. Viability selection on seasonally polyphenic traits: wing melanin pattern in Western White Butterflies. Evolution. 1995;49:932–941. doi: 10.1111/j.1558-5646.1995.tb02328.x. [DOI] [PubMed] [Google Scholar]
- Lees AD. The control of polymorphism in aphids. Adv Insect Physiol. 1966;3:207–277. [Google Scholar]
- Leichty AR, Pfennig DW, Jones CD, Pfennig KS. Relaxed genetic constraint is ancestral to the evolution of phenotypic plasticity. Integr Comp Biol. 2012;52:16–30. doi: 10.1093/icb/ics049. [DOI] [PMC free article] [PubMed] [Google Scholar]
- Lemos B, Bettencourt BR, Meiklejohn CD, Hartl DL. Evolution of proteins and gene expression levels are coupled in Drosophila and are independently associated with mRNA abundance, protein length, and number of protein-protein interactions. Mol Biol Evol. 2005;22:1345–1354. doi: 10.1093/molbev/msi122. [DOI] [PubMed] [Google Scholar]
- MacKay PA. Clonal variation in sexual morph production in Acyrthosiphon pisum (Homoptera: Aphididae) Environ Entomol. 1989;18:558–562. [Google Scholar]
- Marioni JC, Mason CE, Mane SM, Stephens M, Gilad Y. RNA-seq: an assessment of technical reproducibility and comparison with gene expression arrays. Genome Res. 2008;18:1509–1517. doi: 10.1101/gr.079558.108. [DOI] [PMC free article] [PubMed] [Google Scholar]
- McDonald JH, Kreitman M. Adaptive protein evolution at the Adh locus in Drosophila. Nature. 1991;351:652–654. doi: 10.1038/351652a0. [DOI] [PubMed] [Google Scholar]
- Meisel RP. Towards a more nuances understanding of the relationship between sex-biased gene expression and rates of protein-coding sequence evolution. Mol Biol Evol. 2011;28:1893–1900. doi: 10.1093/molbev/msr010. [DOI] [PMC free article] [PubMed] [Google Scholar]
- Moczek AP, Emlen DJ. Proximate determination of male horn dimorphism in the beetle Onthophagus taurus (Coleoptera: Scarabaeidae) J Evol Biol. 1999;12:27–37. [Google Scholar]
- Moran NA. The evolution of aphid life cycles. Annu Rev Entemol. 1992;37:321–348. [Google Scholar]
- Nijhout HF. Development and evolution of adaptive polyphenisms. Evol Dev. 2003;5:9–18. doi: 10.1046/j.1525-142x.2003.03003.x. [DOI] [PubMed] [Google Scholar]
- Notredame C, Higgins DG, Heringa J. T-Coffee: a novel method for fast and accurate multiple sequence alignment. J Mol Biol. 2000;302:205–217. doi: 10.1006/jmbi.2000.4042. [DOI] [PubMed] [Google Scholar]
- Ollivier M, Legeai F, Rispe C. Comparative analysis of the Acyrthosiphon pisum genome and expressed sequence tag-based gene sets from other aphid species. Insect Mol Biol. 2010;19:33–45. doi: 10.1111/j.1365-2583.2009.00976.x. [DOI] [PubMed] [Google Scholar]
- Orlando E. Sex determination in Megoura viciae Buckton (Homoptera, Aphididae) Monitore Zool Ital (NS). 1974;8:61–70. [Google Scholar]
- Pal C, Papp B, Hurst LD. Highly expressed genes in yeast evolve slowly. Genetics. 2001;158:927–931. doi: 10.1093/genetics/158.2.927. [DOI] [PMC free article] [PubMed] [Google Scholar]
- Parisi M, Nuttal R, Naiman D, Bouffard GG, Malley J, Andrews J, Eastman S, Oliver B. Paucity of genes on the Drosophila X chromosome showing male-biased expression. Science. 2003;299:697–700. doi: 10.1126/science.1079190. [DOI] [PMC free article] [PubMed] [Google Scholar]
- Parsch J, Ellegren H. The evolutionary causes and consequences of sex-biased gene expression. Nat Rev Genet. 2013;14:83–87. doi: 10.1038/nrg3376. [DOI] [PubMed] [Google Scholar]
- Pfennig DW. Polyphenism in spadefoot toad tadpoles as a locally-adjusted evolutionarily stable strategy. Evolution. 1992;46:1408–1420. doi: 10.1111/j.1558-5646.1992.tb01133.x. [DOI] [PubMed] [Google Scholar]
- Pointer MA, Harrison PW, Wright AE, Mank JE. Masculinization of gene expression is associated with exaggeration of male sexual dimorphism. PLoS Genet. 2013;9:e1003697. doi: 10.1371/journal.pgen.1003697. [DOI] [PMC free article] [PubMed] [Google Scholar]
- Proschel M, Zhang Z, Parsch J. Widespread adaptive evolution of Drosophila genes with sex-biased expression. Genetics. 2006;174:893–900. doi: 10.1534/genetics.106.058008. [DOI] [PMC free article] [PubMed] [Google Scholar]
- R Development Core Team. R: a language and environment for statistical computing. Vienna (Austria): R Foundation for Statistical Computing; 2012. [Google Scholar]
- Ranz JM, Castillo-Davis CD, Meiklejohn CM, Hartl DL. Sex-dependent gene expression and evolution of the Drosophila transcriptome. Science. 2003;300:1742–1745. doi: 10.1126/science.1085881. [DOI] [PubMed] [Google Scholar]
- Rocha EPC, Danchin A. An analysis of determinants of amino acids substitution rates in bacterial proteins. Mol Biol Evol. 2004;21:108–116. doi: 10.1093/molbev/msh004. [DOI] [PubMed] [Google Scholar]
- Scheiner SM. Genetics and evolution of phenotypic plasticity. Annu Rev Ecol Syst. 1993;24:35–68. [Google Scholar]
- Schiex T, Gouzy J, Moisan A, De Oliveira Y. FrameD: a flexible program for quality check and gene prediction in prokaryotic genomes and noisy matured eukaryotic sequences. Nucl Acids Res. 2003;31:3738–3741. doi: 10.1093/nar/gkg610. [DOI] [PMC free article] [PubMed] [Google Scholar]
- Smith CR, Toth AL, Suarez AV, Robinson GE. Genetic and genomic analyses of the division of labour in insect societies. Nat Rev Genet. 2008;9:735–748. doi: 10.1038/nrg2429. [DOI] [PubMed] [Google Scholar]
- Snell-Rood EC, Cash A, Han MV, Kijimoto T, Andrews J, Moczek AP. Developmental decoupling of alternative phenotypes: insights from the transcriptomes of horn-polyphenic beetles. Evolution. 2011;65:231–245. doi: 10.1111/j.1558-5646.2010.01106.x. [DOI] [PMC free article] [PubMed] [Google Scholar]
- Snell-Rood EC, Van Dyken JD, Cruickshank T, Wade MJ, Moczek AP. Toward a population genetic framework of developmental evolution: the costs, limits, and consequences of phenotypic plasticity. Bioessays. 2010;32:71–81. doi: 10.1002/bies.200900132. [DOI] [PMC free article] [PubMed] [Google Scholar]
- Sutherland ORW. The role of crowding in the production of winged forms by two strains of the pea aphid, Acyrthosiphon pisum. J Insect Physiol. 1969;15:1385–1410. [Google Scholar]
- Swanson WJ, Clark AG, Waldrip-Dail HM, Wolfner MF, Aquadro CF. Evolutionary EST analysis identifies rapidly evolving male reproductive proteins in Drosophila. Proc Natl Acad Sci U S A. 2001;98:7375–7379. doi: 10.1073/pnas.131568198. [DOI] [PMC free article] [PubMed] [Google Scholar]
- Swanson WJ, Vacquier VD. The rapid evolution of reproductive proteins. Nat Rev Genet. 2002;3:137–144. doi: 10.1038/nrg733. [DOI] [PubMed] [Google Scholar]
- Swanson WJ, Wong A, Wolfner MF, Aquadro CF. Evolutionary expressed sequence tag analysis of Drosophila female reproductive tracts identifies genes subjected to positive selection. Genetics. 2004;168:1457–1465. doi: 10.1534/genetics.104.030478. [DOI] [PMC free article] [PubMed] [Google Scholar]
- Tajima F. Statistical method for testing the neutral mutation hypothesis by DNA polymorphism. Genetics. 1989;123:585–595. doi: 10.1093/genetics/123.3.585. [DOI] [PMC free article] [PubMed] [Google Scholar]
- Thomas C. A list of the species of the tribe Aphidini, family Aphidae, found in the United States, which have heretofore been named, with descriptions of some new species. Bull Ill State Lab Nat Hist. 1878;1:3–16. [Google Scholar]
- Van Dyken JD, Wade MJ. The genetic signature of conditional expression. Genetics. 2010;184:557–570. doi: 10.1534/genetics.109.110163. [DOI] [PMC free article] [PubMed] [Google Scholar]
- Via S. Inducing the sexual forms and hatching the eggs of pea aphids. Entomol Exp Appl. 1992;65:119–127. [Google Scholar]
- West-Eberhard MJ. Phenotypic plasticity and the origins of diversity. Annu Rev Ecol Syst. 1989;20:249–278. [Google Scholar]
- West-Eberhard MJ. Developmental plasticity and evolution. New York: Oxford University Press; 2003. [Google Scholar]
- Wilhelm BT, Marguerat S, Watt S, Schubert F, Wood V, Goodhead I, Penkett CJ, Rogers J, Bahler J. Dynamic repertoire of a eukaryotic transcriptome surveyed at single-nucleotide resolution. Nature. 2008;453:1239–1243. doi: 10.1038/nature07002. [DOI] [PubMed] [Google Scholar]
- Wilson ACC, Sunnucks P, Hales DF. Random loss of X chromosome at male determination in an aphid, Sitobion near fragariae, detected using an X-linked polymorphic microsatellite marker. Genet Res. 1997;69:233–236. [Google Scholar]
- Wilson EO. The insect societies. Cambridge (MA): Harvard University Press; 1971. [Google Scholar]
- Wright F. The ‘effective number of codons’ used in a gene. Gene. 1990;87:23–29. doi: 10.1016/0378-1119(90)90491-9. [DOI] [PubMed] [Google Scholar]
- Yanai I, Benjamin H, Shmoish M, Chalifa-Caspi V, Shklar M, Ophir R, Bar-Even A, Horn-Saban S, Safran M, Domany E, et al. Genome-wide midrange transcription profiles reveal expression level relationships in human tissue specification. Bioinformatics. 2005;21:650–659. doi: 10.1093/bioinformatics/bti042. [DOI] [PubMed] [Google Scholar]
- Yang ZH. PAML: a program package for phylogenetic analysis by maximum likelihood. Comput Appl Biosci. 1997;13:555–556. doi: 10.1093/bioinformatics/13.5.555. [DOI] [PubMed] [Google Scholar]
- Zhang Z, Hambuch RM, Parsch J. Molecular evolution of sex-biased genes in Drosophila. Mol Biol Evol. 2004;21:2130–2139. doi: 10.1093/molbev/msh223. [DOI] [PubMed] [Google Scholar]
Associated Data
This section collects any data citations, data availability statements, or supplementary materials included in this article.