

Abstract
Resveratrol, a modulator of several signaling proteins, can exert off-target effects involving PPAR transcription factor. However, evidence for the direct interaction between this polyphenol and PPARs is lacking. Here, we addressed the hypothesis that resveratrol and its metabolites control aspects of PPAR transcriptional activity through direct interaction with PPARs. Bioaffinity chromatographic studies with the immobilized ligand-binding domains (LBDs) of PPARγ and PPARα and isothermal titration calorimetry (ITC) allowed the determination of the binding affinities of resveratrol, resveratrol 3-O-glucuronide, resveratrol 4-O-glucuronide and resveratrol 3-O-sulfate to both PPAR-LBDs. Interaction of resveratrol, resveratrol 3-O-glucuronide and resveratrol 4-O-glucuronide with PPARγ-LBD occurred with binding affinities of 1.4, 1.1 and 0.8 μM, respectively, while only resveratrol bound to the PPARα-LBD with a binding affinity of 2.7 μM. Subsequently, X-ray crystallographic studies were carried out to characterize resveratrol binding to the PPARγ-LBD at the molecular level. The electron density map from the crystal structure of the complex between PPARγ-LBD and resveratrol revealed the presence of one molecule of resveratrol bound into the LBD of PPARγ, with the ligand occupying a position close to that of other know PPARγ ligands. Transactivation assays were also performed in HepG2 cells and the results showed that resveratrol was not a PPAR agonist but, instead was able to displace rosiglitazone from PPARγ and Wy-14,643 from PPARα with IC50 values of 27.4 ± 1.8 μM and 31.7 ± 2.5 μM, respectively. We propose that resveratrol acts as a PPAR antagonist through its direct interaction with PPARγ and PPARα.
Keywords: resveratrol, PPARs, biochromatography, Isothermal Titration Calorimetry, X-ray crystallography, transactivation assay
INTRODUCTION
Peroxisome proliferator-activated receptors (PPARs) are members of the nuclear receptor family of ligand-dependent transcription factors.[1] PPARs form heterodimers with the 9-cis retinoic acid receptor (RXR) and susbequently to an interaction with a ligand bind to specific peroxisome proliferator responsive elements (PPREs) in the promoter regions of specific target genes. Three isoforms of PPAR have been identified: PPARγ, PPARδ and PPARα, of which PPARγ is the most extensively studied subtype.[2] PPARα agonists, which include fibrates, normalize dyslipidaemia while PPARγ agonists (e.g., thiazolidinediones) improve insulin resistance and diabetes control. PPARα and PPARγ have been implicated in the increase of insulin sensitivity through the control of lipid and glucose metabolism as well as in conferring anti-inflammatory protection in liver, adipose and vascular tissues.[3,4] PPARγ is adipogenic,[5] and ligand-mediated activation of PPARγ exhibits anti-tumorigenic effects in many types of cancer.[6,7]
Resveratrol (3,5,4′-trihydroxystilbene) is found in the skin and seeds of grapes and is the active component of red wine that has led to the ‘French Paradox’.[8] It is a known activator of the NAD+-dependent deacetylase SIRT1 and for this reason has been the subject of intense studies for its potential role in diabetes and aging.[9] While there is no consensus on the mechanism by which resveratrol modulates SIRT1 activity, resveratrol treatment results in an 8-fold increase in SIRT1 deacetylation.[9,10] This dietary polyphenol inhibits platelet aggregation,[11] promotes vasodilation,[12,13] and exerts anti-inflammatory activity.[14] Resveratrol also inhibits differentiation of 3T3-L1 adipocytes by the activation of the AMP kinase/SIRT1 axis,[15] and offers potential cancer chemopreventive effects.[16] However, recent data have revealed that resveratrol may affect PPAR activity and modulate many biological actions of PPAR agonists. [17,18] The inhibitory effect of resveratrol on adipogenesis[19] is believed to occur through downregulation of PPARγ mRNA expression in human visceral adipocytes.[20] Moreover, the SIRT1-dependent repression of visceral white adipocyte genes involves deacetylation of PPARγ.[21] Whether resveratrol and/or its metabolites can interact directly with PPAR proteins to influence their function remains unclear.
Calleri and collaborators have recently described and validated novel biochromatographic systems where the PPARγ and PPARα ligand-binding domains (LBD) were immobilized onto the surface of an open tubular (OT) silica capillary stationary phase.[22,23] These PPAR columns were used for the affinity evaluation of a series of structurally related analogs, which include ureidofibrate-like derivatives. The authors have demonstrated that the immobilized LBDs maintain their binding capacity and could be used to determine the binding affinity constants of the compounds under study.[21,22] Here, we used frontal affinity chromatography and isothermal titration calorimetry to measure potential binding affinities of resveratrol and its metabolites to PPARα and PPARγ LBDs. Moreover, X-ray crystallography has been used to characterize at the molecular level the binding of resveratrol to PPARγ-LBD. Transactivation assays also illustrated that resveratrol acts on both PPARγ and PPARα with antagonistic activity.
RESULTS AND DISCUSSION
The determination of binding affinities using frontal affinity chromatographic techniques has been well established.[24] In this technique, increasing concentrations of a competitive agent in the presence of constant concentration of a marker ligand are added to the mobile phase and the effect on the breakthrough volumes of the marker ligand is measured. Decreasing breakthrough time of the marker ligand with increasing concentrations of competing agent suggests direct competition between them. The relationship between displacer concentration [D] and retention volume of the marker ligand can be used to determine the dissociation constant of the displacer ligand (see Equation 1 in the experimental section).
PPARα and PPARγ LBDs, whose immobilization on open tubular capillaries was previously reported, were found to interact with selected ligands with appropriate binding affinity constants.[22,23]
In order to determine whether resveratrol and its metabolites bind to the LBD of PPARγ or PPARα, frontal displacement chromatographic studies were carried out using resveratrol, GW1929 or R-1 compounds as marker ligands on the PPARγ-OT and PPARα–OT columns, and the binding affinities obtained are summarized in Table 1A and 1B, respectively. GW1929 is a high-affinity full agonist of PPARγ with a Kd of ~40 nM,[25] while R-1 compound is a full agonist that binds both PPARα and PPARγ with approximately the same affinity (Kd values of 270 nM).[22,26]
Table 1A.
Binding affinity of Resveratrol, Resveratrol-3-O-glucuronide, Resveratrol-4-O-glucuronide and Resveratrol-3-O-sulfate was determined by frontal displacement affinity chromatography using the PPARγ-OT column. The markers used were Resveratrol, GW1929 and R-1.
| Compound | PPARγ-OT Ki (μM) Resveratrol |
PPARγ-OT Ki (μM) GW1929 |
PPARγ–OT Ki (μM) R-1 |
|---|---|---|---|
| Resveratrol | 1.37 ± 0.57 | 1.80 ± 0.43 | No displacement |
| Resveratrol-3-O-glucuronide | 1.07 ± 0.22 | 16.6 ± 5.81 | No displacement |
| Resveratrol-4-O-glucuronide | 0.77 ± 0.23 | 1.75 ± 0.71 | No displacement |
| Resveratrol-3-O-sulfate | No displacement | 3.80 ± 1.29 | No displacement |
Table 1B.
Binding affinity of Resveratrol, Resveratrol-3-O-glucuronide, Resveratrol-4-O-glucuronide and Resveratrol-3-O-sulfate was determined by frontal displacement affinity chromatography using the PPARα-OT column. The markers used were Resveratrol and R-1.
| Compound | PPARα-OT Ki (μM) Resveratrol |
PPARα–OT Ki (μM) R-1 |
|---|---|---|
| Resveratrol | 2.69 ± 0.18 | No displacement |
| Resveratrol-3-O-glucuronide | No displacement | No displacement |
| Resveratrol-4-O-glucuronide | No displacement | No displacement |
| Resveratrol-3-O-sulfate | No displacement | No displacement |
As shown in Table 1A, resveratrol and resveratrol 4-O-glucuronide had similar binding affinities towards PPARγ when resveratrol was used as marker with Ki values of 1.37 ± 0.57 μM and 0.77 ± 0.23 μM, respectively. Similarly, when GW1929 was used as marker ligand the Ki values were 1.80 ± 0.43 μM and 1.75 ± 0.71 μM for resveratrol and resveratrol 4-O-glucuronide, respectively. These results indicate that resveratrol and the 4-O-glucuronide bind in a similar way and that the binding site of resveratrol overlaps with GW1929.
A significant decrease in the affinity of resveratrol 3-O-glucuronide to PPARγ-LBD was observed when GW1929 was used as a marker ligand (16.60 ± 5.81 μM). However, the Ki value for resveratrol 3-O-glucuronide was 1.07 ± 0.22 μM when resveratrol was selected as marker ligand. In contrast, resveratrol 3-O-sulfate (concentrations up to 10 μM) did not displace resveratrol while displacing GW1929 with a Ki of approximately 4 μM, indicating that the sulfated analog does not compete with resveratrol for binding. The fact that the 3-O-glucuronide derivative can displace resveratrol, while the 3-O sulfate analog cannot, suggests that loss of H-bond donors or the introduction of a readily ionizable group could result in the binding of resveratrol 3-O sulfate to a different pocket than resveratrol.
We then investigated the ability of resveratrol and its metabolites to dose-dependently displace compound R-1 on the PPARα-OT and PPARγ-OT columns. Neither resveratrol nor resveratrol metabolites (concentrations up to 10 μM) were able to displace compound R-1, suggesting a lack of overlap between the binding sites for compound R-1 and resveratrol on the PPARγ- and PPARα-LBD. This is exemplified by the frontal displacement profiles of compound R-1 by resveratrol and its metabolites (10 μM) on the PPARγ-OT (Figure 1).
Figure 1.
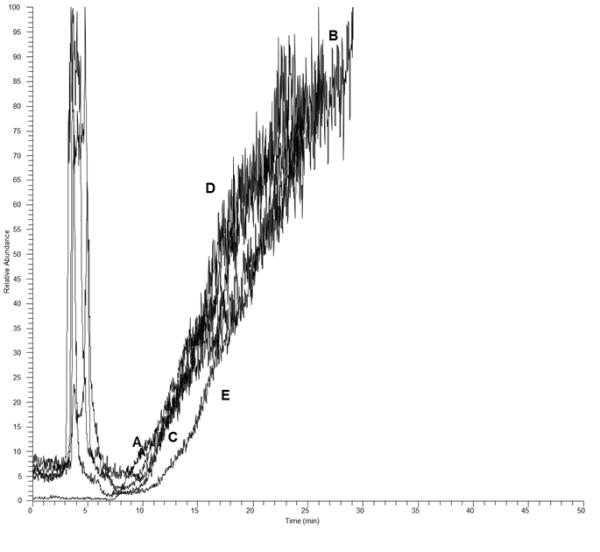
Frontal chromatographic study of the displacement of 100 nM R-1(A) by10 μM resveratrol (B), resveratrol 3-O-Sulfate (C), resveratrol 3- O -glucronide (D) and resveratrol 4- O -glucoronide on the PPARγ-OT column.
As shown in Table 1B, only resveratrol shows affinity for PPARα with a binding affinity constant of 2.69 ± 0.18 μM, which was calculated using a non-linear regression model. These results indicate that the metabolites do not bind PPARα at the same site as resveratrol.
In addition to carrying out frontal displacement chromatographic studies, isothermal calorimetric (ITC) techniques were also used to confirm the interaction of resveratrol with PPARγ. ITC is one of the most powerful methods for characterizing protein-ligand interactions, which are detected directly from the intrinsic heat (binding enthalpy) change of the reaction. The association constants (Ka) of the binding of resveratrol to PPARγ and the thermodynamic parameters, including ΔG, ΔH, ΔS and n, were determined from the thermograms (Figure 2). The results indicated that resveratrol bound to the PPARγ-LBD with an affinity constant similar to that obtained by frontal affinity chromatography (1.09 ± 0.08 μM vs 1.37 ± 0.57μM, respectively) (Table 1 and Table 2).
Figure 2.
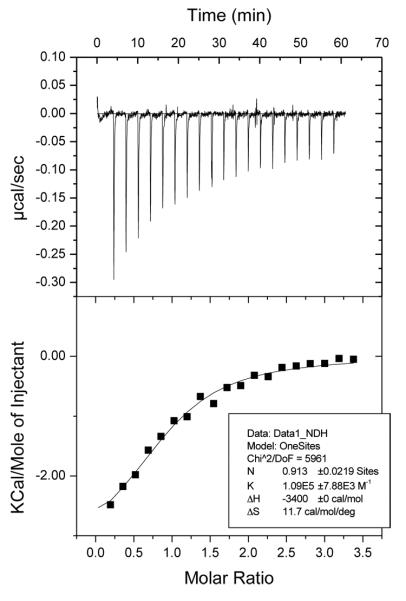
Titration of PPARγ (50 μM) with resveratrol (500 μM). The upper panels show the raw data, the lower panels show the corresponding binding isotherm fitted according to the “one binding site” model. The thermodynamic parameters (Kd, ΔH and ΔS) are indicated in the boxes.
Table 2.
Thermodynamic parameters of the formation of the complex PPARγ-LBD/resveratrol determined by isothermal titration calorimetry assay.
n = molar binding ratio of the ligand-protein interaction (observed stoichiometry).
this value was kept fixed during the fitting by Origin.
To gain more insight into the interaction of PPARγ with resveratrol, X-ray studies were performed. The crystal structure of the complex between PPARγ-LBD and resveratrol was solved (PDB code: 4JAZ) at 2.85 Å of resolution. The electron density map (Figure S1 of Supporting Information) clearly reveals the presence of one molecule of resveratrol bound into the LBD of PPARγ. The ligand occupies a region close to the β-sheet in a position close to that of other known PPARγ partial agonists[27-29], in which a strong H-bond was formed between the S342 NH and one of resveratrol’s OH groups (Figure 3a). The side-chain of R288 was displaced by the ligand from its usual position and, consequently, the side-chain of E291 was also forced to assume a new orientation. Van der Waals interactions were present between resveratrol and the side-chains of F264, H266, and R288 and electrostatic forces between the charged side-chains of R288 and R280, and the negative dipoles of the ligand OH groups. Unlike other known partial agonists of PPARγ, the terminal end of resveratrol occupied a small pocket close to the entrance of the LBD, to form an H-bond with the side-chain of R280. This new pattern of receptor-ligand recognition could be exploited for ligand design. Recently, the crystal structure of PPARγ complexed with amorfrutin 1, a ligand structurally related to resveratrol, has been published.[30] The superposition of the two crystal structures illustrates that both ligands occupied the same position and formed similar interactions with the PPARγ–LBD (Figure 3b).
Figure 3.

A) H-bond network of resveratrol in the PPARγ-LBD.
B). Superposition of the complexes of PPARγ with resveratrol (yellow) and amorfrutin 1 (white). For sake of clarity the cartoon of PPARγ-LBD complexed with resveratrol is shown (green).
C). Superposition of the complexes of PPARγ with resveratrol (yellow) and farglitazar (purple).
D). Superposition of the complexes of PPARγ with resveratrol (yellow) and compound R-1 (pink).
The crystal structure of the PPARγ-LBD complexed with resveratrol was further examined in order to explain the results obtained using frontal displacement chromatography. The superposition of the PPARγ–LBD with resveratrol and farglitazar, a high-affinity PPARγ ligand that is structurally very similar to GW1929,[31] showed that the latter compound partially occupies the same region as resveratrol, which could explain the displacement of GW1929 by resveratrol (Figure 3c). In contrast, compound R-1, a full PPARγ agonist,[32] occupied a different position within the PPARγ-LBD when compared to resveratrol (Figure 3d). The superposition of the two molecules demonstrated that while the fused ring moiety of compound R-1 was very close to the terminal part of resveratrol, they did not occupy the same region. This result supports the notion that resveratrol is unable to displace compound R-1 from the PPARγ-LBD, as evidenced by frontal chromatography.
Previous studies have demonstrated that 10 μM resveratrol activates PPARα and PPARγ in a number of cell-based reporter assays.[18] In order to confirm whether a similar result would be observed with HepG2 cells, resveratrol was first evaluated for its agonistic activity toward the human PPARγ and PPARα subtypes using luciferase-based transactivation assays. HepG2 cells were transiently transfected either with the GAL4-PPARα or GAL4-PPARγ chimeric construct together with the luciferase reporter vector containing the pGal5TkpGL3 construct, and then treated with increasing concentrations of resveratrol. Rosiglitazone and Wy-14,643 were used as positive controls for PPARγ and PPARα transactivation potential, respectively. Of significance, there was no PPAR transactivation observed in response to resveratrol treatment at concentrations up to 100 μM (Figure 4A, B). The agonistic activity of resveratrol was compared with that of its metabolites at two fixed concentrations (10 and 25 μM), and no apparent effect was seen on the transactivation potential of PPARα and PPARγ (Figure S2 of Supporting Information).
Figure 4.


Transactivation assay on PPARα and PPARγ of resveratrol in HepG2 cells.
Fold induction by resveratrol (RV) over vehicle (EtOH 0.1%) on PPARα (panel A) and PPARγ (panel B) as determined by luciferase-based transactivation assays. Reference compounds: Wy-14,643 (10 μM) and rosiglitazone (2 μM).
The lack of PPAR activity from resveratrol was surprising, as Inoue et al. initially reported a PPARα/γ dual agonism of resveratrol, excluding any activity on PPARδ isoform and other nuclear receptors,[18] and subsequently updated their work and reported the panagonism of resveratrol for PPARs.[33] The difference between the previously reported data and our own can be a result of the type of cell line used. Specifically, different cell lines might provide different results depending on the presence of recruitable cofactors (coactivators or corepressors) and/or metabolic processes, such as cellular metabolism of resveratrol during the experiment. In fact, these in vitro assays may not be the most suitablefor studying the effects of resveratrol on PPARs, and may require a more careful investigation in vivo.
Nevertheless, the demonstration of a direct binding of resveratrol to PPAR [results from frontal affinity chromatography, ITC, and X-ray experiments] led us to investigate whether resveratrol exhibited PPAR antagonistic activity. For this purpose, transiently transfected HepG2 cells were co-incubated with or without resveratrol in the presence of either rosiglitazone or Wy-14,643 for 20 hours. Data from the luciferase reporter assay indicated that resveratrol was able to displace rosiglitazone from PPARγ and Wy-14,643 from PPARα with IC50 values of 27.4 ± 1.8 μM and 31.7 ± 2.5 μM, respectively (Figure 5). Taken together, these results demonstrate that resveratrol acts on both PPARγ and PPARα as an antagonist.
Figure 5.


Inhibition of agonist-induced transactivation of PPARα and PPARγ by resveratrol in HepG2 cells.
Transiently transfected HepG2 cells were incubated with increasing concentrations of resveratrol (1-100 μM) in the presence of either 10 μM Wy-14,643 (panel A) or 2 μM rosiglitazone (panel B). Twenty hours later, luciferase reporter activity was measured in cell lysates. Data represent mean ± SEM from two independent experiments, each performed in triplicate wells.
A comparison of the structure of resveratrol with those of the ligands used as positive controls in the cell-based reporter assays was also carried out (Figure S3). Rosiglitazone is a PPARγ full agonist whose crystal structure in the complex with PPARγ LBD showed a standard agonist position with a direct interaction with the helix 12 through a H-bond with Y473.[34] Moreover, the X-ray crystal structure of PPARα/Wy-14,643 complex showed one molecule of the ligand directly interacting with H12, similar to rosiglitazone and many other PPAR full agonists, and, more interestingly, a second molecule, which interacted with a secondary site between H2’ and H3, called Ω-loop. It seems that the occupation of this second site could better activate PPARα by stabilizing H12 in the active conformation without any direct contact with the helix, but only through interactions connecting the Ω-loop, H3 and the loop11/12, which precedes H12. Interestingly, the superposition of PPARγ/resveratrol and PPARα/Wy-14,643 crystal structures (Figure S3) showed that one aromatic ring of resveratrol occupied almost the same position as an aromatic ring of W-y-14,643.
CONCLUSIONS
Evidence that resveratrol interacts directly with PPARs is lacking and very little effort has been placed on determining whether resveratrol metabolites contribute to the biological activities of resveratrol. In the study herein, results from chromatographic and ITC experiments have indicated that resveratrol and its metabolites bind directly with PPARγ, and that only resveratrol interacts with PPARα. In addition, we report the X-ray crystal structure of the PPARγ-LBD complexed with resveratrol, solved at 2.5 Å resolution. The binding mode of resveratrol reveals a new pattern of receptor-ligand recognition and suggests a novel basis for ligand design. The fact that resveratrol binds to PPARγ and conveys antagonistic activity on both PPARγ and PPARα, highlights the need for better understanding the role of cellular metabolism in resveratrol signaling.
EXPERIMENTAL SECTION
Chemicals
The reagents for target immobilization on silica capillaries, including NaOH (Carlo Erba Reagenti, Rodano, Milan, Italy), 3-aminopropyltriethoxysilane, glutaraldheyde, KH2PO4, NaBH3CN, monoethanolamine, CH3OH, DMSO, and CH3COONH4 were purchased from Sigma-Aldrich Chemicals, Co. (St. Louis, MO, USA). GW1929 (N-(2-benzoylphenyl)-O-[2-(methyl-2-pyridinylamino)ethyl]-L-tyrosine hydrate) was from Sigma-Aldrich and high quality water was obtained using a Milli-Q water purification system (Millipore Corporation, Bedford, MA, USA). The open tubular silica capillaries (100μm I.D. × 0.375mm × 40cm) were from Thermo Fisher Scientific (San Jose, CA, USA). Compound R-1, 2-(4-{2-[1,3-benzoxazol-2-yl(heptyl)amino]ethyl}phenoxy)-2-methyl-butanoic acid, used for displacement chromatography is a ureidofibrate-like derivative that was prepared as previously described.[26] Reference compounds (Wy-14,643 and rosiglitazone) used for the transactivation assay were purchased from Sigma-Aldrich (Milan, Italy). Resveratrol, resveratrol-3′-O-D-glucuronide, resveratrol-3-O-sulfate were purchased from Cayman Chemical (Ann Arbor, MI, USA). Resveratrol-4-O-D-glucuronide was provided by SPI-Bio Bertin Pharma (Montigny le Bretonneux, France). Minimum essential medium (MEM) and other cell culture reagents were purchased from Sigma-Aldrich (Milan, Italy).
Immobilization of the PPAR LBDs on open tubular capillary columns
The human PPARγ and PPARα LBDs were expressed as N-terminal His-tagged proteins using a pET28 vector and purified onto a Ni2+-nitriloacetic acid column (GE Healthcare, Milan, Italy).[31] LBDs were immobilized using open tubular silica capillaries (100μm I.D. × 0.375 mm × 40 cm) following previously reported procedures.[22,23] Briefly, after activation of the capillary with 2 mL of 0.5 N NaOH solution flushed at 100 mL.min−1, 1 mL of a solution of 3-aminopropyltriethoxysilane (10% v/v in water) was run through the column and incubated at 95°C for 30 min. This step was repeated twice and the capillary stored overnight at room temperature. A gluteraldehyde solution (1% v/v in water) was pumped through the capillary at 50 μL.min−1 followed by the infusion of the PPAR-LBD solution (0.5 mg.mL−1, 1 mL) at 50 μL.min−1. After a washing step, the residual reactive sites on the column were blocked by pumping a 5 mg.mL−1 solution of NaBH3CN in phosphate buffer supplemented with 0.1 M monoethanolamine for 1 h at 5 μL.min−1. The amount of immobilized LBD proteins was measured from the PPAR solutions collected before and after the immobilization step using a Lambda 25 spectrophotometer (Perkin Elmer, Waltham, MA, USA). The percentage of LBD covalently attached was approximately 86% and 50% for PPARγ and PPARα, respectively.
Frontal displacement chromatographic studies
PPARγ Frontal analysis was carried out on a chromatographic system composed of a syringe pump delivering the mobile phase (90% ammonium acetate 10 mM, pH 7.4, 10% MeOH) through the capillary at a flow rate of 2.5 μL.min−1, with post column mixing with methanol pumped at 5 μL.min−1 with an HPLC pump (Surveyor, Thermo Finnigan, San Jose, CA, USA). Detection of the ligands was made by either a Linear Trap Quadrupole (LTQ) mass spectrometer with electro-spray ionization (ESI) as ion source (Thermo Finnigan) for GW-1929 and R-1 as marker ligands or a Series 1100 Liquid Chromatography/Mass Selective Detector (Agilent Technologies, Palo Alto, CA, USA) equipped with a vacuum de-gasser (G 1322 A), a binary pump (1312 A), an autosampler (G1313 A) with a 20 μL injection loop, a mass selective detector (G1946 B) supplied with atmospheric pressure ionization electrospray and an on-line nitrogen generation system (Whatman, Haverhill, MA, USA) for resveratrol. The former system was controlled by Xcalibur software 1.4 (Thermo Finnigan). The conditions of the instrument were held constant: source voltage 5.0 kV, sheath gas flow 2.0 (arbitrary units), auxiliary gas flow 16.0 (arbitrary units), capillary voltage 14.95 V, capillary temperature 250°C and tube lens voltage 90 V. For the latter system the capillary voltage was set at 3200 V, the nebulizer pressure at 60 psi, and the drying gas flow at 11 L.min−1; a temperature of 350°C was used. The ion transitions monitored were: for R-1 m/z 453.6 →353.2 (CID 23.0) and for GW1929, m/z 496.4→ 346.3, 271.2, 450.3 (CID 25) and m/z = 227 [MW- H]− ion for resveratrol..
For frontal displacement studies using GW1929 (0.2 μM) as marker ligand, solutions of resveratrol (1, 5, 10, 100μM), resveratrol 3-O-glucuronide (1, 5, 10, 100μM), resveratrol-4-O-glucuronide (1, 5, 10, 100 μM), and resveratrol 3-O-sulfate (1, 5 and 10 μM) were prepared in ammonium acetate [10 mM, pH 7.4] and delivered at a flow rate of 0.05 mL.min−1 at room temperature. For displacement studies using R-1 (0.1 μM) as marker ligand, solutions of resveratrol (1, 5, 10, μM), resveratrol 3-O-glucuronide (1, 5, 10, μM), resveratrol-4-O-glucuronide (1, 5, 10, μM), and resveratrol 3-O-sulfate (1, 5 and 10 μM) were prepared in the mobile phase. For displacement studies using resveratrol (0.5 μM) as the marker ligand, solutions of resveratrol (0.5, 1, 2.5, 5, 10, 20 μM), resveratrol 3-O-glucuronide (0.5, 2.5, 5, 10 μM), resveratrol-4-O-glucuronide (0.5, 1.0, 1.5, 5, 10 μM), and resveratrol 3-O-sulfate (0.5, 1.0, 10 μM) were prepared.
PPARα
Two experimental approaches were used for frontal displacement analysis of PPARα. In the first series of experiments, 100 nM R-1 was used as the marker ligand and various concentrations of resveratrol and its metabolites were used as displacers. In the second series of experiments, resveratrol was the marker ligand and the displacers were resveratrol (1, 2, 5 and 10 μM) as well as resveratrol 3-O-glucuronide, resveratrol-4-O-glucuronide and resveratrol 3-O-sulfate at 10 μM.
Data analysis
The dissociation constants, Kd, for the displacer ligands were determined using a previously reported approach.[35] The experimental paradigm is based upon the effect of escalating doses of a competitive binding ligand on the retention volume. For example, the Kd for the displacer ligands (D) as well as the number of active binding sites of the immobilized PPAR, Bmax, can be calculated using equation (1):
| (1) |
where: V is the retention volume of ligand, Vmin is the retention volume of ligand when the specific interaction is completely suppressed and P = Bmax (Ki/KdM), where KdM is the Kd of the marker ligand. However, when displacer and marker are the same compound then P = Bmax. The dissociation constant (Ki) for D is obtained from the plot of [D] (V-Vmin) versus [D]. The data were analysed by nonlinear regression with a one-site binding (hyperbola) equation using Prism 4 software (GraphPad Software Inc., San Diego, CA, USA) running on a personal computer.
Isothermal titration calorimetry
Isothermal titration calorimetry (ITC) experiments were performed at 25°C using a MicroCal ITC200 microcalorimeter (MicroCal, Inc., Northampton, MA, USA). PPARγ and PPARα LBDs were extensively dialyzed against HEPES 20 mM, pH 8.0, TCEP (Tris(2-carboxyethyl)phosphine hydrochloride; Sigma-Aldrich) 1 mM, with Amicon Ultra filters, and the final exchange buffer was used to dilute the resveratrol stock solution (50 mM in DMSO). DMSO was added to the protein solution at the same percentage of the ligand solution (1%). The protein solution (50 μM) was placed in the sample cell, and ligand solution (500 μM) was loaded into the syringe injector. The titrations involved 19 injections of 2 μL at 180 s intervals. The syringe stirring speed was set at 1000 rpm. A reference titration of ligand into buffer was used to correct for heats of dilution. Thermodynamic data was processed with Origin 7.0 software (MicroCal). The values of ΔH were measured for both titrations, and fitting the isotherms with one-site binding model yielded the values of the association constant (Ka). The stoichiometric value n, which indicates the ligand/protein ratio of the binding, was also measured.
Crystallization studies with PPARγ-LBD
Recombinant PPARγ-LBD protein was expressed and purified as previously described.[22,23] Crystals of apo-PPARγ were obtained by vapor diffusion at 18°C using a sitting drop made by mixing 2 μL of protein solution (10 mg·mL−1, in 20 mM Tris and 1 mM TCEP, pH 8.0) with 2 μL of reservoir solution (0.8 M sodium citrate and 0.15 M Tris, pH 8.0). The crystals were soaked for 3 days in storage solution (1.2 M sodium citrate and 0.15 M Tris, pH 8.0) containing the ligand (0.25 mM). The storage solution with glycerol 20% (v/v) was used as cryoprotectant. Crystals of the complex PPARγ/resveratrol belong to the C2 space group with cell parameters shown in Table S1 of the Supporting Information.
Structure determination
X-ray data were collected at 100 K under a nitrogen stream using synchrotron radiation (beamline XRD1 at Elettra, Trieste, Italy). The diffracted intensities were processed using the programs iMOSFLM and QuickScale.[36] Structure solution was performed with AMoRe,[37] using the coordinates of PPARγ1-LBD complexed with an agonist (PDB code 3B3K) as a starting model.[27] The coordinates were then refined with CNS.[38] All data between 10-2.85 Å were included. The statistics of crystallographic data and refinement are summarized in Table 1 of the Supporting Information. The coordinates of PPARγ-LBD complexed with resveratrol have been deposited in the Brookhaven Protein Data Bank (PDB) with the code 4JAZ.
Biological methods
Plasmids
The expression vectors expressing the chimeric receptor containing the yeast Gal4-DNA binding domain fused to the human PPARα- or PPARγ-LBD and the reporter plasmid for these Gal4 chimeric receptors (pGal5TKpGL3) containing five repeats of the Gal4 response elements upstream of a minimal thymidine kinase promoter that is adjacent to the luciferase gene were described previously.[39]
Cell culture, plasmid transfections and luciferase-based transactivation assays
Human hepatocellular carcinoma cell line HepG2 (Interlab Cell Line Collection, Genoa, Italy) was cultured in Minimum Essential Medium (MEM) containing 10% heat-inactivated fetal bovine serum, 100 U•mL−1 of penicillin G, and 100 μg•mL−1 of streptomycin sulfate at 37°C in a humidified atmosphere of 5% CO2. For transactivation assays, 105 cells per well were seeded in a 24-well plate and transfections were performed after 24 h with CAPHOS, a calcium phosphate method, according to the manufacturer’s guidelines (Sigma-Aldrich, Milan, Italy). Cells were transfected with expression plasmids encoding the fusion protein Gal4–PPARα-LBD or Gal4–PPARγ-LBD, pGal5TKpGL3, and pCMVβgal to normalize the transfection efficacy. Four hours after transfection, cells were treated for 20 hours with increasing concentration of resveratrol or EtOH 0.1% in triplicate. The transfected cells were also incubated with Wy-14,643 (10 μM) and rosiglitazone (2 μM), which were used as reference compounds for PPARα and PPARγ, respectively. Luciferase activity in cell extracts was then determined by a luminometer (VICTOR3 V Multilabel Plate Reader, PerkinElmer, Monza, Italy) and normalized for β-galactosidase activity. Fold induction activity was calculated and plotted using GraphPad Prism5 software. All transfection experiments were repeated at least twice with similar results.
In a second series of experiments, the ability of resveratrol at inhibiting the transactivation potential of PPARα and PPARγ was determined. Four hours after transfection with the expression plasmids indicated above, cells were treated with either Wy-14,643 (10 μM) or rosiglitazone (2μM) in the presence of increasing concentrations of resveratrol or 0.1% EtOH (as vehicle control) in triplicate. Twenty hours later, the cells were lysed and the relative luciferase activity was determined. The half maximal inhibitory concentration (IC50) of resveratrol was calculated by fitting the activity data with the sigmoidal fitting function of GraphPad Prism5.
Supplementary Material
Acknowledgements
This research was supported in part by the Intramural Research Program of the NIH, National Institute on Aging (RM) and the financial support of the Ministero dell’Istruzione, dell’Università e della Ricerca (PRIN 2009K7R7NA) (FL) and by the grant from Ministero dell’Università e della Ricerca Scientifica (grant no. 2009Z8YTYC) (EC).
Footnotes
There are no financial conflicts.
References
- 1.Torra IP, Chinetti G, Duval C, Fruchart JC, Staels B. Curr. Opin. Lipidol. 2001;12:245–254. doi: 10.1097/00041433-200106000-00002. [DOI] [PubMed] [Google Scholar]
- 2.Rosen ED, Spiegelman BM. J.Biol.Chem. 2001;276:37731–37734. doi: 10.1074/jbc.R100034200. [DOI] [PubMed] [Google Scholar]
- 3.Gervois P, Fruchart JC, Staels B. Int. J. Clin. Pract. Suppl. 2004;143:22–29. doi: 10.1111/j.1368-504x.2004.00376.x. [DOI] [PubMed] [Google Scholar]
- 4.Evans JL, Lin JJ, Goldfine ID. Curr. Diabetes Rev. 2005;1:299–307. doi: 10.2174/157339905774574365. [DOI] [PubMed] [Google Scholar]
- 5.Tontonoz P, Hu E, Spiegelman BM. Cell. 1994;79:1147–1156. doi: 10.1016/0092-8674(94)90006-x. [DOI] [PubMed] [Google Scholar]
- 6.Roman J. J. Investig. Med. 2008;56:528–533. doi: 10.2310/JIM.0b013e3181659932. [DOI] [PubMed] [Google Scholar]
- 7.Mansure JJ, Nassim R, Kassouf W. Cancer Biol. Ther. 2009;8:6–15. doi: 10.4161/cbt.8.7.7853. [DOI] [PubMed] [Google Scholar]
- 8.Kimura Y, Okuda H, Arichi S. Biochim. Biophys. Acta. 1985;834:275–278. [PubMed] [Google Scholar]
- 9.Sonnett TE, Levien TL, Gates BJ, Robinson JD, Campbell RK. Ann. Pharmacother. 2010;44:701–711. doi: 10.1345/aph.1M640. [DOI] [PubMed] [Google Scholar]
- 10.Pacholec M, Bleasdale JE, Chrunyk B, Cunningham D, Flynn D, Garofalo RS, Griffith D, Griffor M, Loulakis P, Pabst B, Qiu X, Stockman B, Thanabal V, Varghese A, Ward J, Withka J, Ahn K. J. Biol. Chem. 2010;285:8340–51. doi: 10.1074/jbc.M109.088682. [DOI] [PMC free article] [PubMed] [Google Scholar]
- 11.Wang Z, Huang Y, Zou J, Cao K, Xu Y, Wu JM. Int. J. Mol. Med. 2002;9:77–79. [PubMed] [Google Scholar]
- 12.Naderali EK, Doyle PJ, Williams G. Clin. Sci. 2000;98:537–543. [PubMed] [Google Scholar]
- 13.Naderali EK, Smith SL, Doyle PJ, Williams G. Clin. Sci. 2001;100:55–60. [PubMed] [Google Scholar]
- 14.Labinskyy N, Csiszar A, Veress G, Stef G, Pacher P, Oroszi G, Wu J, Ungvari Z. Curr. Med. Chem. 2006;13:989–996. doi: 10.2174/092986706776360987. [DOI] [PMC free article] [PubMed] [Google Scholar]
- 15.Chen S, Li Z, Li W, Shan Z, Zhu W. Can. J. Physiol. Pharmacol. 2011;89:793–799. doi: 10.1139/y11-077. [DOI] [PubMed] [Google Scholar]
- 16.Aluyen JK, Ton QN, Tran T, Yang AE, Gottlieb HB, Bellanger RA. J. Diet. Suppl. 2012;9:45–56. doi: 10.3109/19390211.2011.650842. [DOI] [PubMed] [Google Scholar]
- 17.Goya K, Sumitani S, Xu X, Kitamura T, Yamamoto H, Kurebayashi S, Saito H, Kouhara H, Kasayama S, Kawase I. Arterioscler. Thromb. Vasc. Biol. 2004;24:658–663. doi: 10.1161/01.ATV.0000118682.58708.78. [DOI] [PubMed] [Google Scholar]
- 18.Inoue H, Jiang X-F, Katayama T, Osada S, Umesono K, Namura S. Neurosci. Lett. 2003;353:203–206. doi: 10.1016/j.neulet.2003.09.001. [DOI] [PubMed] [Google Scholar]
- 19.Bäckesjö CM, Li Y, Lindgren U, Haldosén LA. J. Bone Miner. Res. 2006;21:993–1002. doi: 10.1359/jbmr.060415. [DOI] [PubMed] [Google Scholar]
- 20.Costa CS, Rohden F, Hammes TO, Margis R, Bortolotto JW, Padoin AV, Mottin CC, Guaragna RM. Obes. Surg. 2011;21:356–361. doi: 10.1007/s11695-010-0251-7. [DOI] [PubMed] [Google Scholar]
- 21.Qiang L, Wang L, Kon N, Zhao W, Lee S, Zhang Y, Rosenbaum M, Zhao Y, Gu W, Farmer SR, Accili D. Cell. 2012;150:620–632. doi: 10.1016/j.cell.2012.06.027. [DOI] [PMC free article] [PubMed] [Google Scholar]
- 22.Temporini C, Pochetti G, Fracchiolla G, Piemontese L, Montanari R, Moaddel R, Laghezza A, Altieri F, Cervoni L, Ubiali D, Prada E, Loiodice F, Massolini G, Calleri E. J. Chromatogr. A. 2013;1284:36–43. doi: 10.1016/j.chroma.2013.01.077. [DOI] [PMC free article] [PubMed] [Google Scholar]
- 23.Calleri E, Fracchiolla G, Montanari R, Pochetti G, Lavecchia A, Loiodice F, Laghezza A, Piemontese L, Massolini G, Temporini C. J. Chromatogr. A. 2012;1232:84–92. doi: 10.1016/j.chroma.2011.10.037. [DOI] [PubMed] [Google Scholar]
- 24.Moaddel R, Wainer IW. Nat. Protocol. 2009;4:197–205. doi: 10.1038/nprot.2008.225. [DOI] [PMC free article] [PubMed] [Google Scholar]
- 25.Henke BR, Blanchard SG, Brackeen MF, Brown KK, Cobb JE, Collins JL, Harrington W. Wallace, Jr., Hashim MA, Hull-Ryde EA, Kaldor I, Kliewer SA, Lake DH, Leesnitzer LM, Lehmann JM, Lenhard JM, Orband-Miller LA, Miller JF, Mook RA, Jr., Noble SA, Oliver W, Jr., Parks DJ, Plunket KD, Szewczyk JR, Willson TM. J. Med. Chem. 1998;41:5020–5036. doi: 10.1021/jm9804127. [DOI] [PubMed] [Google Scholar]
- 26.Porcelli L, Gilardi F, Laghezza A, Piemontese L, Mitro N, Azzariti A, Altieri F, Cervoni L, Fracchiolla G, Giudici M, Guerrini U, Lavecchia A, Montanari R, Di Giovanni C, Paradiso A, Pochetti G, Simone GM, Tortorella P, Crestani M, Loiodice F. J. Med. Chem. 2012;55:37–54. doi: 10.1021/jm201306q. [DOI] [PubMed] [Google Scholar]
- 27.Montanari R, Saccoccia F, Scotti E, Crestani M, Godio C, Gilardi F, Loiodice F, Fracchiolla G, Laghezza A, Tortorella P, Lavecchia A, Novellino E, Mazza F, Aschi M, Pochetti G. J. Med. Chem. 2008;51:7768–7776. doi: 10.1021/jm800733h. [DOI] [PubMed] [Google Scholar]
- 28.Laghezza A, Pochetti G, Lavecchia A, Fracchiolla G, Faliti S, Piemontese L, Di Giovanni C, Iacobazzi V, Infantino V, Montanari R, Capelli D, Tortorella P, Loiodice F. J. Med. Chem. 2013;56:60–72. doi: 10.1021/jm301018z. [DOI] [PubMed] [Google Scholar]
- 29.Bruning JB, Chalmers LJ, Prasad S, Busby SA, Kamenecka TM, He Y, Nettles KW, Griffin PR. J. Med. Chem. 2007;15:1258–1271. doi: 10.1016/j.str.2007.07.014. [DOI] [PubMed] [Google Scholar]
- 30.De Groot JC, Buessow K. Proc. Natl. Acad. Sci. U.S.A. 2012;109:7257–7262. doi: 10.1073/pnas.1116971109. [DOI] [PMC free article] [PubMed] [Google Scholar]
- 31.Gampe RT, Jr., Montana VG, Lambert MH, Miller AB, Bledsoe RK, Milburn MV, Kliewer SA, Willson TM, Xu HE. Mol. Cell. 2000;5:545–555. doi: 10.1016/s1097-2765(00)80448-7. [DOI] [PubMed] [Google Scholar]
- 32.Pochetti G, Godio C, Mitro N, Caruso D, Galmozzi A, Scurati S, Loiodice F, Fracchiolla G, Tortorella P, Laghezza A, Lavecchia A, Novellino E, Mazza F, Crestani M. J. Biol. Chem. 2007;282:17314–17324. doi: 10.1074/jbc.M702316200. [DOI] [PubMed] [Google Scholar]
- 33.Tsukamoto T, Nakata R, Tamura E, Kosuge Y, Kariya A, Katsukawa M, Mishima S, Ito T, Iinuma M, Akao Y, Nozawa Y, Arai Y, Namura S. I. Inoue, Nutr. Metab. 2010;7:46. doi: 10.1186/1743-7075-7-46. [DOI] [PMC free article] [PubMed] [Google Scholar]
- 34.Bernardes A, Souza PCT, Muniz JRC, Ricci CG, Ayers SD, Parekh NM, Godoy AS:, Trivella DBB, Reinach P, Webb P, Skaf MF, Polikarpov I. J. Mol. Biol. 2013;425:2878–2893. doi: 10.1016/j.jmb.2013.05.010. [DOI] [PubMed] [Google Scholar]
- 35.Kimura T, Perry J, Anzai N, Pritchard JB, Moaddel R. J. Chrom. B. 2007;589(2):267–271. doi: 10.1016/j.jchromb.2007.09.039. [DOI] [PMC free article] [PubMed] [Google Scholar]
- 36.Leslie AGW, Powell HR. Evolving Methods for Macromolecular Crystallography. 2007;245:41–51. [Google Scholar]
- 37.Navaza J. Acta Crystallogr. A. 1994;50:157–163. [Google Scholar]
- 38.Brunger AT, Adams PD, Clore GM, DeLano WL, Gros P, Grosse-Kunstleve RW, Jiang JS, Kuszewski J, Nilges M, Pannu NS, Read RJ, Rice LM, Simonson T, Warren GL. Acta Crystallogr. D. 1998;54:905–921. doi: 10.1107/s0907444998003254. [DOI] [PubMed] [Google Scholar]
- 39.Raspe E, Madsen L, Lefebvre AM, Leitersdorf I, Gelman L, Peinado-Onsurbe J, Dallongeville J, Fruchart J-C, Berge R, Staels B. J. Lipid Res. 1999;40:2099–2110. [PubMed] [Google Scholar]
Associated Data
This section collects any data citations, data availability statements, or supplementary materials included in this article.