

Significance
The human body, including the mouth, is home to a diverse assemblage of microbial organisms. Although high-throughput sequencing of 16S rRNA genes provides enormous amounts of census data, accurate identification of taxa in these large datasets remains problematic because widely used computational approaches do not resolve closely related but distinct organisms. We used a computational approach that relies on information theory to reanalyze the human oral microbiome. This analysis revealed organisms differing by as little as a single rRNA nucleotide, with dramatically different distributions across habitats or individuals. Our information theory-based approach in combination with habitat analysis demonstrates the potential to deconstruct entire microbiomes, detect previously unrecognized diversity, and provide deep insight into microbial communities in health and disease.
Keywords: biogeography, mouth, microbiota
Abstract
The Human Microbiome Project provided a census of bacterial populations in healthy individuals, but an understanding of the biomedical significance of this census has been hindered by limited taxonomic resolution. A high-resolution method termed oligotyping overcomes this limitation by evaluating individual nucleotide positions using Shannon entropy to identify the most information-rich nucleotide positions, which then define oligotypes. We have applied this method to comprehensively analyze the oral microbiome. Using Human Microbiome Project 16S rRNA gene sequence data for the nine sites in the oral cavity, we identified 493 oligotypes from the V1-V3 data and 360 oligotypes from the V3-V5 data. We associated these oligotypes with species-level taxon names by comparison with the Human Oral Microbiome Database. We discovered closely related oligotypes, differing sometimes by as little as a single nucleotide, that showed dramatically different distributions among oral sites and among individuals. We also detected potentially pathogenic taxa in high abundance in individual samples. Numerous oligotypes were preferentially located in plaque, others in keratinized gingiva or buccal mucosa, and some oligotypes were characteristic of habitat groupings such as throat, tonsils, tongue dorsum, hard palate, and saliva. The differing habitat distributions of closely related oligotypes suggest a level of ecological and functional biodiversity not previously recognized. We conclude that the Shannon entropy approach of oligotyping has the capacity to analyze entire microbiomes, discriminate between closely related but distinct taxa and, in combination with habitat analysis, provide deep insight into the microbial communities in health and disease.
The goal of human microbiome research is to understand the microbial communities that inhabit us—what microbes are present, how they function and interact with one another and with their host, and how they change over time and in response to perturbations, environmental influences, and disease states. A key step in achieving this understanding is to determine what microbes are present at a level of taxonomic resolution appropriate to the biology.
Advances in DNA sequencing technology have revolutionized our capacity to understand the composition of complex microbial communities through phylogenetically informative 16S rRNA genes. However, achieving a baseline census at high taxonomic resolution remains problematic; it requires enough sequencing depth to detect sparse as well as abundant taxa, and sensitive computational approaches to distinguish closely related organisms. As the sequencing datasets have grown larger, the computational challenges in analyzing these datasets have grown as well.
The human oral microbiome is not only a significant microbial community in itself, but because of its relatively circumscribed nature and the research efforts already invested in it, it provides an excellent test bed for whole-microbiome analyses. A highly curated Human Oral Microbiome Database (HOMD) (www.homd.org) has been established (1) containing 688 oral species/phylotypes based on full-length 16S rRNA gene sequences, with more than 440 (∼65%) of these taxa successfully brought into culture and with fully sequenced genomes available for 347 of them. Thus, important tools exist that, together with whole-microbiome analysis, could enable in-depth functional understanding of the oral community.
Large-scale application of rRNA gene sequencing to the analysis of the human oral microbiota began with Aas et al. (2), who sampled nine oral sites in five healthy individuals to assess differences among individuals as well as among oral sites, whereas Bik et al. (3) assessed the level of interindividual variation with deeper sequencing of a pooled sample from each of 10 individuals. The use of Sanger sequencing in these studies allowed species-level taxon assignment but limited the depth of sequencing and thus limited our understanding of the degree to which taxa occurred consistently across individuals. High-throughput sequencing methods allow a more complete assessment of bacterial richness, and the first studies applying next-generation sequencing methods to samples from the human mouth (4–6) indicated the complexity of the oral microbiome. However, their taxonomic resolution was limited by the use of de novo clustering, in which sequences that were more than 97% identical were grouped into operational taxonomic units (OTUs) as proxies for phylotypes.
The Human Microbiome Project (HMP; http://commonfund.nih.gov/hmp/index.aspx) increased the breadth of available data dramatically by generating millions of sequences for samples from more than 200 healthy individuals, sequencing nine sites in the mouth and pharynx [subgingival plaque (SUBP), supragingival plaque (SUPP), buccal mucosa (BM), keratinized gingiva (KG), tongue dorsum (TD), hard palate (HP), saliva (SV), palatine tonsils (PT), and throat (TH)], as well as four skin sites, three vaginal sites, the anterior nares, and stool (7). Results from these data have been published in several articles (7–9), including an in-depth description of the oral sites by Segata et al. (10). Although Segata et al. were able to identify similarities and differences among oral sites and provide genus-level characterization of oral microbial communities, a fuller understanding of the biology of the oral microbiota was hindered by their limited taxonomic resolution. The HMP adopted the Ribosomal Database Project (RDP) classifier (11), which does not classify below the genus level even when the underlying sequence information can differentiate species. Thus, both the genus-level taxonomy used by HMP and the OTU clustering used in other studies lumped together members of the oral microbiome that showed small differences in their rRNA genes.
However, small differences in the sequence of rRNA can be markers for substantial genomic and ecological variation between microbes (12, 13). Among oral microbes, for example, Streptococcus pneumoniae and Streptococcus mitis have more than 99% similarity in their 16S rRNA gene sequences but substantial differences in their gene complement, leading to distinct phenotypic and ecological characteristics (14, 15). For the human mouth, being a comparatively well-studied habitat, we know of many such examples of species that differ from one another by less than 3% in rRNA sequence and for which clustering at a 97% identity level is clearly unsatisfactory because it would group such species into the same OTU. Some authors have used more stringent thresholds; Dewhirst et al. (1), for example, used a 1.5% distance criterion to define Human Oral Taxon boundaries when named strains are absent. Clustering to any percentage, however, is an arbitrary process. In principle, a single nucleotide change over the ∼1,500 bases in the 16S rRNA gene, corresponding to a 0.07% difference, could be a tag for a unique genomic, taxonomic, and functional entity.
An alternative approach is oligotyping (16). Oligotyping facilitates the identification of biologically relevant groups by using Shannon entropy (17), and is thus conceptually different from widely used methods that rely on pairwise sequence similarity. Shannon entropy, a measure of information content, identifies the nucleotide sites that show high variation. Oligotyping makes use of the fact that phylogenetically important differences occur at specific positions in the gene, causing high variation at these positions, whereas many sequencing errors are, to a first approximation, randomly distributed along the sequence (18, 19). Concatenation of only the high-information nucleotide positions defines oligotypes, which are then used to partition sequencing data into high-resolution groups while discarding the redundant information and noise. In this way, oligotyping allows the identification of taxa that differ by as little as a single nucleotide in the sequenced region.
Here we report the application of oligotyping to the 16S rRNA gene sequence data generated by the HMP for the oral microbiome. To connect individual oligotypes to the vast reservoir of biological information on microbes inhabiting the human mouth, we used the HOMD to relate oligotypes to named species, as well as to taxa that have not yet been named but are identified by Human Oral Taxon (HOT) numbers in HOMD. We analyzed the distribution of each oligotype across the sampled oral sites and among individual volunteers, and we characterized the diversity of the normal human oral microbiome within each site. By discriminating highly similar sequences we detected different microbial communities among oral sites, and site-specialists at the subspecies level, which were previously undetectable by standard approaches for classification and clustering. Finally, we used the distribution of oligotypes among individuals and across oral sites to begin to test hypotheses about the relationships among taxa and strains in the human oral microbiome.
Results
Oligotyping Analysis of HMP Data.
The HMP dataset comprises millions of reads over two regions (V1-V3 and V3-V5) of the 16S rRNA gene. Although reads from these regions are fairly short (∼250 nucleotides after our trimming steps), oligotyping analysis extracts information that allows taxonomic resolution beyond what previously has been reported. We analyzed HMP data from subjects sampled at all nine oral sites as defined in the Introduction: SUBP, SUPP, KG, BM, TD, HP, SV, PT, and TH, plus stool. From the V1-V3 region there were 77 subjects with data for all nine oral sites, and a total of 3,684,682 reads that passed both sequencing and oligotyping quality control (Materials and Methods). From the V3-V5 region there were 148 subjects with data for all nine oral sites, and a total of 6,339,052 reads that passed quality control. Within these data we detected 493 oral oligotypes in V1-V3 and 360 oral oligotypes in V3-V5 (Datasets S1 and S2). In our analyses, oligotypes were defined by as few as three nucleotide positions (for Epsilonproteobacteria, the least species-rich group we oligotyped) and as many as 28 (for Firmicutes and Bacteroidetes). Sequences belonging to an oligotype are identical at the canonical nucleotide positions but may differ at other sites owing to several factors, including noise arising from sequencing errors and polymorphisms that were too rare to be distinguishable from noise. We will hereafter use the term “oligotype” as shorthand for “the representative sequence,” which is operationally defined as the most abundant unique sequence belonging to an oligotype.
We compared individual oligotypes with reference sequences in HOMD to associate oligotypes to named species, as well as to taxa that have not yet been named but are identified by HOT numbers in HOMD. In many cases the association was straightforward, because there was a one-to-one correspondence between the oligotype and a single species in HOMD to which the oligotype was at least 98.5% identical over its entire length. This one-to-one mapping was the case for 83 oligotypes in the V1-V3 data and 86 in the V3-V5 data (Dataset S3); the majority of these (53 in V1-V3 and 69 in V3-V5) were 100% identical matches. In other cases the mapping of oligotypes onto taxonomy was more complex. Some groups of two or more named species in HOMD are identical over the ∼250-nucleotide regions covered in our dataset; these species were, naturally, indistinguishable by any method using these data, and an oligotype matched to such a set of sequences was assigned multiple species names, e.g., Streptococcus salivarius/vestibularis. A single oligotype matched multiple identical HOMD taxa in 7 cases in the V1-V3 data encompassing 18 species in HOMD and 28 cases in the V3-V5 data encompassing 80 species in HOMD (Dataset S3).
Because of the fine discriminatory power of oligotyping, many species in HOMD were detected as multiple oligotypes. Ninety-five HOMD species each mapped onto multiple oligotypes in the V1-V3 data for a total of 259 oligotypes, as did 63 HOMD species for a total of 172 oligotypes in the V3-V5 data. Additionally, 14 groups of 2–7 species whose HOMD sequences are identical in the V1-V3 region mapped onto multiple oligotypes; these 14 groups together encompassed 47 species-level HOMD taxa and 84 oligotypes. For the V3-V5 region, 16 groups encompassing 59 HOMD species mapped onto multiple oligotypes for a total of 48 oligotypes. The remaining oligotypes (60 in V1-V3 and 26 in V3-V5) had less than 98.5% similarity to any taxon in HOMD (Dataset S3).
The associations of oligotypes with taxa in HOMD were made using the representative sequence of the oligotype. Therefore, it was important to evaluate the extent to which the “representative sequence” was truly representative. To assess this question, we individually BLAST-searched each of the 5,584,105 reads represented by the 360 oral oligotypes in the V3-V5 dataset against HOMD. Of all these reads, 99.84% had the same annotation when BLAST searched individually as did the representative sequence of their oligotype. This result indicates that the sequences contained within each oligotype were homogeneous in the sense that essentially all of them had the same closest match in HOMD. We conclude that the representative sequence is indeed a good proxy for the sequences contained within an oligotype.
In summary, although analysis of short regions inevitably results in some ambiguities, the salient result is that oligotyping was able to identify hundreds of oral phylotypes, many at the species level or finer resolution and many which would have been indistinguishable by standard methods such as canonical de novo OTU clustering. The next question regards the significance of the oligotypes. To what extent are they markers for important functional differences or to what extent do they represent sequence variants of little functional significance? A key approach to answering this question is to determine whether the oligotypes show preferences for different oral habitats that would suggest differences in ecological adaptation and hence function.
Oligotype Distribution Among Oral Sites.
Many oligotypes showed striking differences in abundance from site to site within the mouth, resulting in a distinctive community composition at different oral sites. The overall degree of similarity among samples from different sites is captured in multidimensional scaling (MDS) plots for the V1-V3 and V3-V5 data (Fig. 1) (Fig. S1 shows a heat map representation). Plaque was strongly differentiated from all other sites. Most distinctive from plaque and each other, and therefore farthest apart on the plot, were KG and TD, so that plaque, KG, and TD occupy the vertices of a triangle. Among the remaining sites, BM is close to KG, whereas PT and TH overlap broadly with one another and with HP, TD, and SV.
Fig. 1.
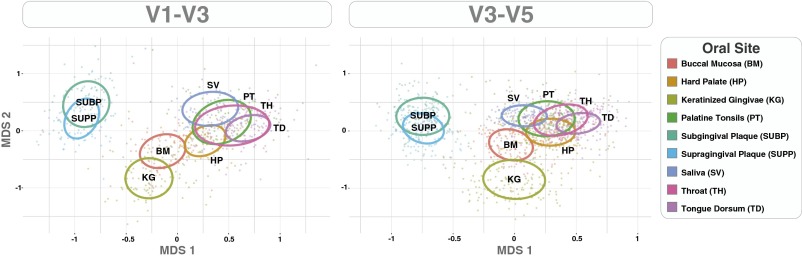
MDS plots showing the distribution of oral samples based on oligotype relative abundance in each sample. Each dot represents an oral sample colored by sampling site. The centroid of each ellipse represents the group mean, and the shape is defined by the covariance within each group (Materials and Methods).
The patterns in the MDS plots can be observed directly in the oligotype abundance data. Approximately one-third of oligotypes were detected almost exclusively in plaque, whereas 5% were detected almost exclusively in KG. We implemented a method that uses the t statistic to calculate the site preference of each oligotype across the oral sites (Materials and Methods). By this metric, 147 oligotypes of V1-V3 were significantly more abundant in SUBP, SUPP, or both at P < 0.01, and together made up more than two-thirds of plaque reads but only 11% or fewer reads at each of the other oral sites (Dataset S4). Similarly, in V3-V5 140 oligotypes were significantly more abundant in SUBP, SUPP, or both and represented more than 60% of plaque reads and 10% or fewer at each of the other oral sites. Twenty V1-V3 oligotypes were significantly more abundant in KG, accounting for 19% of the overall KG data, 3% of BM, and 2% or less at each of the other oral sites. There were 22 oligotypes from V3-V5 significantly more abundant in KG and accounting for 31% of the overall KG data, 7% of BM, and 3% or less at each of the other oral sites. In addition to these KG-specific oligotypes, a small number of very abundant oligotypes with strongly differential distributions contributed to the distinctiveness of KG from plaque and TD. For example, a single V1-V3 oligotype, identical to Streptococcus mitis, contributed 33–46% of the data from KG, BM, and HP but was significantly less abundant at other sites (Dataset S4). This one oligotype therefore was responsible for a significant fraction of the overall similarity of KG, BM, and HP seen in Fig. 1.
Because of the similarity of the microbial communities in TD, HP, SV, PT, and TH, a smaller number of oligotypes showed a preference for any one of these sites individually. However, numerous oligotypes were preferentially located in the five sites considered as a group. Specifically, 34 oligotypes of V1-V3 and 31 oligotypes of V3-V5 preferred this set of habitats (Dataset S4). Taking the V1-V3 and V3-V5 data together, we conclude that most oligotypes in the oral microbiome show a preference for a site or a group of sites, and that these differences in oligotype distribution result in substantially different communities at the different oral sites.
Habitat Analysis of Nearly Identical Oligotypes.
Most oligotypes demonstrate preferential distribution among oral sites, but do closely related oligotypes show similar preferences or do they show differences in distribution suggestive of underlying functional differences? Both situations occur and are exemplified in the genus Neisseria (Fig. 2). In V3-V5 there were five abundant oligotypes of Neisseria (Fig. 2A). Four of the five were detected abundantly in plaque, and one of these, Neisseria flavescens/subflava, made up nearly 100% of the Neisseria found in TD. Intriguingly, the fifth oligotype, N. flavescens/subflava_99.2%, made up the majority of Neisseria detected in KG but was rare at all other sampling locations. This oligotype differed by only two nucleotides from the primary oligotype of N. flavescens/subflava, corresponding to 99.2% similarity as shown in the heat map (Fig. 2A), but the marked difference in distribution of the two oligotypes suggests different functional roles caused by genomic differences for which the small difference in 16S rRNA gene sequence acts as a marker. In contrast, Neisseria pharyngis had a distribution very similar to that of Neisseria sicca/mucosa/flava, except being in lower abundance across all of the sites. The similarity of habitat distribution is consistent with, but does not prove, their functional equivalence.
Fig. 2.

Abundant oligotypes of the genus Neisseria. Colored bars (Left) show the relative abundance of Neisseria oligotypes averaged across all individuals at each body site in V3-V5 (A) and V1-V3 (B). Heat map representation (Right) shows the percent nucleotide identity between each pair of oligotypes. For simplicity, only oligotypes with at least 0.5% mean abundance in at least one oral site are shown. The species names shown for oligotypes are the names of the identical sequence(s) in HOMD, or, for oligotypes not identical to any HOMD sequence, the names of the closest match sequence(s) followed by the percent identity to that match.
Analysis of the V1-V3 Neisseria data (Fig. 2B) confirmed the major results from the V3-V5 data. The two datasets were broadly in agreement, showing similar taxa in similar relative abundance. Both datasets showed a plaque-specific oligotype identified as Neisseria elongata, as well as an oligotype identified with N. sicca/mucosa/flava that was abundant in plaque, with lesser amounts in KG, BM, SV, and HP. Both datasets showed an oligotype that was specific to KG and that made up the majority of Neisseria found in KG. The V1-V3 dataset, like the V3-V5 dataset, showed N. flavescens making up nearly half of the Neisseria found in BM and most or all of SV, HP, PT, TH, and TD.
However, the two hypervariable regions, being different windows into the 16S rRNA gene sequence, differed in their taxonomic resolution, which sometimes led to apparent discordances in taxonomic identification. For example, the two regions displayed different degrees of resolution of the same taxon, N. flavescens. The V1-V3 region distinguished three oligotypes of N. flavescens, all at least 98.8% identical to one another as shown in the heat map (Fig. 2B), whereas in the V3-V5 region a single oligotype corresponded to the group N. flavescens/subflava. Both the V1-V3 data and the V3-V5 data clearly showed a single Neisseria oligotype specific to KG, but this oligotype was identified in the V3-V5 data as 99.2% identical to N. flavescens/subflava and in the V1-V3 data was identical to Neisseria polysaccharea/meningitidis. Given the close similarity of the taxa, the short read data do not allow assignment of the KG-specific oligotype to any one of these taxa, but it can be assigned with confidence to the N. flavescens/polysaccharea/meningitidis grouping.
Closely related oligotypes with sharply differing distributions are not unique to Neisseria but are found in other oral genera as well (Fig. 3). In two genera, Fusobacterium and Campylobacter, a species abundant in the HP-SV-PT-TH-TD cluster of habitats was also represented by one or more oligotypes that were nearly exclusive to KG (Fusobacterium periodonticum and Campylobacter concisus, respectively). In the genus Porphyromonas, a taxon (HOT 279) that was abundant throughout the mouth was also represented by three distinctive oligotypes found primarily in KG and with lesser abundance in BM. In the fourth example, the Veillonella genus, two oligotypes that differed by only a single nucleotide showed distinctive distributions, with one predominating in plaque and the other abundant in the HP-SV-PT-TH-TD cluster; both were identical to Veillonella parvula and Veillonella dispar, but the identity was to different reference strains of these species in HOMD. Additional major oral genera such as Actinomyces, Gemella, Granulicatella, Haemophilus, Leptotrichia, Rothia, Selenomonas, and Streptococcus contained oligotypes distinctive for two or all three oral habitat groupings (plaque, KG-BM, and HP-SV-PT-TH-TD) (Dataset S1). The results of our habitat analysis point to widespread functional diversity within the oral microbiota that is not well captured by genus- or even species-level assignments but is revealed by the higher phylogenetic resolution of oligotyping.
Fig. 3.

Abundant oligotypes of four oral genera showing habitat differentiation. Colored bars (Left) show the relative abundance of oligotypes of four oral genera in the V1-V3 data, averaged across individuals and shown for each sampling site. For simplicity, only oligotypes with a mean abundance of at least 0.5% (Fusobacterium, Veillonella), 0.2% (Porphyromonas), or 0.1% (Campylobacter) in at least one oral site are shown. Species names shown for oligotypes are the names of the identical sequence(s) in HOMD, or, for oligotypes not identical to any HOMD sequence, the names of the closest match sequence(s) followed by the percent identity to that match. Unnamed taxa with only a HOT designation are listed only when no named taxon is an exact or closest match; the HOT number is shown in parentheses. Heat maps (Right) show the percent nucleotide identity between each pair of oligotypes within a genus. Some oligotypes share the same name, followed by v1 or v2, because of the presence in HOMD of more than one reference sequence for these species.
Oligotype Analysis by Individual.
In the same way that differences in distribution across oral sites can provide information on the biology underlying an oligotype, differences in relative abundance of an oligotype across individuals provide information about the significance of closely related oligotypes. For instance, the two abundant N. flavescens V1-V3 oligotypes (N. flavescens_99.6% and N. flavescens in Fig. 2B, shown in orange and bright green) differ by only a single nucleotide and have very similar distributions across the oral sites, averaged across individuals. Three hypotheses consistent with this information are (i) that the oligotypes represent two copies of the rRNA gene present in the same cell; (ii) that they represent two distinct microbial lineages that are present in similar relative abundances in each individual because they engage in a close mutualistic relationship with one another; or (iii) that they represent distinct lineages that can exist independently of each other and are subject to competition, selection, and stochastic variation. Hypotheses i and ii predict that the two oligotypes would be present in every individual in the same proportion, whereas hypothesis iii predicts that individuals would contain the oligotypes in differing proportions.
Evaluation of V1-V3 oligotypes in samples from each subject separately (Fig. 4) allowed us to discriminate among these hypotheses. For example, in the majority of subjects, the Neisseria population in TD was overwhelmingly dominated by a single oligotype that made up 90% of the Neisseria population found in the sample, but which oligotype was dominant varied from individual to individual, whereas it was generally consistent across the oral sites within an individual. Clearly the averages across subjects at each oral site, although useful as an overview, do not accurately represent the relative proportions of oligotypes in individual samples. The individual-level data clearly rule out the possibility that these closely related oligotypes of N. flavescens are distinct operons in the same cell, or that they represent distinct lineages each of which is part of the N. flavescens population in every individual. Instead, one of these oligotypes, in general, dominates any given TD sample to the near-exclusion of the others, indicating that they represent distinct microbial lineages that can occur in different individuals. The significance of oligotype dominance by individual is a question for further study.
Fig. 4.

Distribution of Neisseria oligotypes in individual samples. Proportions of eight abundant Neisseria oligotypes are shown for all individuals in whom at least one of these oligotypes was detected in the V1-V3 TD sample. Colored bars show the relative proportions of each of the eight oligotypes in an individual. Black bars underneath the colored bars show the total abundance of the eight oligotypes relative to the total sample from that individual at that site (e.g., Neisseria ranged from <1–40% of the TD community in these individuals). All of the samples from a given volunteer are arranged in the same column, so that samples can be compared across sampling sites within an individual. The order of columns is defined by the clustering of TD samples with the Morisita-Horn dissimilarity index.
Other closely related oligotypes, by contrast, do coexist within individuals. Several examples of such coexistence are found in the Streptococcus genus (Fig. 5). Two oligotypes differing by a single nucleotide, identified with Streptococcus mitis/oralis/peroris and Streptococcus infantis, are both present in every subject and in almost every sample from KG, BM, HP, SV, PT, and TH, in different proportions across the sites. Similarly, two oligotypes that differ by two nucleotides (equivalent to 99.2% sequence identity) and are identified as Streptococcus salivarius/vestibularis and Streptococcus parasanguinis/cristatus/australis/sinensis are both present in every TD sample and in most samples from HP, SV, PT, and TH, again in varying proportions across the sites. We conclude that these Streptococcus taxa, although closely related, are not functionally redundant, a conclusion consistent with their recognition as separate described species.
Fig. 5.
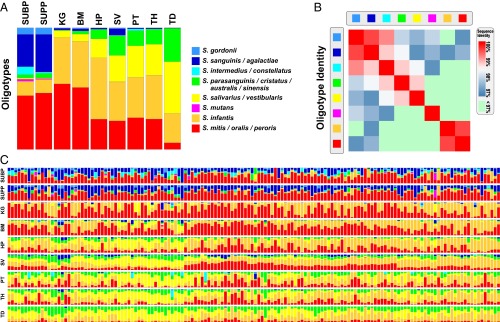
Distribution of Streptococcus oligotypes in individual samples. (A) Relative abundance of eight Streptococcus oligotypes in V3-V5 at each sampling site, averaged across all volunteers. For simplicity, only oligotypes that exactly matched an HOMD Streptococcus reference sequence and had at least 0.2% mean abundance in at least one oral site are shown. Species names shown for oligotypes are the names of the identical named sequence(s) in HOMD; some of these oligotypes are also identical to additional unnamed taxa with only a HOT designation (listed in Dataset S2). (B) Heat map representation showing the percent nucleotide identity between each pair of oligotypes. (C) Volunteers each represented as a column showing the relative contribution of each oligotype to the Streptococcus community at each of the 9 oral sites in each volunteer. The order of columns is defined by the clustering of SV samples with the Morisita-Horn dissimilarity index.
Inspection of individual-level oligotype data for all nine oral sites revealed a spatial pattern within the oral cavity. We illustrate this phenomenon with the abundant genera Neisseria (Fig. 4) and Streptococcus (Fig. 5C), but a similar pattern held for all genera analyzed. Although individuals differed in the relative abundance of specific oligotypes at different sites, there was a clear tendency for correlation of the oligotype composition between sites within an individual. The two plaque sites, SUBP and SUPP, resembled one another within an individual subject; likewise the group HP, SV, PT, TH, and TD resembled each other. The Streptococcus sampled from KG and BM were similar, whereas the Neisseria in BM resembled those in the HP, SV, PT, TH, and TD group. This correlation across sites within an individual mouth suggests that factors tending to homogenize the microbial communities in similar habitats within a mouth, such as dispersal or host-specific selective regimes such as salivary composition, diet, or immune system characteristics, can be stronger than local effects that might cause these communities to differ, such as colonization priority effects and competition for space.
Subgingival Plaque Oligotypes Are Also Found in Tonsils.
The majority of the microbial community of PT is shared with HP, SV, TH, and TD (Fig. 1 and ref. 10), but we noticed a tendency for oligotypes characteristic of SUBP to be detected in relatively high abundance in PT as well. To test the significance of this observation we analyzed plaque-associated oligotypes in V3-V5 with a strong SUBP preference judged by at least a threefold greater mean abundance in SUBP than in SUPP. The 44 oligotypes that satisfied these criteria matched a number of known or suspected periodontal pathogens, each of which is anaerobic, including Filifactor alocis, Eubacterium brachy, Prevotella oris, Porphyromonas endodontalis, Porphyromonas gingivalis, and Tannerella forsythia (Dataset S5). For comparison we assessed the 37 oligotypes that were preferentially detected in SUPP (Dataset S5); this list matched taxa such as Corynebacterium matruchotii, Streptococcus sanguinis/agalactiae, and Haemophilus parainfluenzae, all of which are either aerobes or facultative anaerobes. The oligotypes that preferred SUBP made up a significantly higher fraction of the PT community relative to their SUBP abundance than did the SUPP-preferring oligotypes relative to their SUPP abundance (Fig. 6). Thus, it seems that the oligotypes that preferentially inhabit SUBP also show a preferential localization and relatively high abundance in the tonsils, to a far greater extent than do taxa that prefer SUPP. This suggests that the tonsils provide a habitat for anaerobes in the oral microbiota.
Fig. 6.

Correlation of oligotype abundance in SUBP and PT. (Left) Correlation between the mean relative abundance in SUBP and in PT for oligotypes detected preferentially in SUBP [44 oligotypes that are plaque-associated (P < 0.01) and threefold more abundant in SUBP than in SUPP]; (Right) correlation between the mean relative abundance in SUPP and PT for oligotypes detected preferentially in SUPP [37 oligotypes that are plaque-associated (P < 0.01) and 1.5-fold more abundant in SUPP than in SUBP]. Linear regression shows a significant correlation between the mean relative abundance in SUBP of SUBP-preferred oligotypes and their mean relative abundance in PT (P < 0.0001), which suggests a strong co-occurrence pattern between the two sites. The mean relative abundances in SUPP and PT for SUPP-preferred oligotypes were less strongly correlated. The SUBP oligotypes correspond to primarily anaerobic and potentially pathogenic taxa. SUBP and SUPP-preferred oligotypes are listed in Dataset S5.
The Core Oral Microbiome.
The core oral microbiome is generally defined as the set of microbes that are detectable in all or most individuals sampled (5, 9). By this measure, we detected a substantial core microbiome with oligotyping: 57 oligotypes of V1-V3 were detected in at least 95% of subjects and collectively made up 60% of the V1-V3 sequence data, and 58 oligotypes of V3-V5 were detected in at least 95% of subjects and collectively made up 73% of the V3-V5 sequence data (Datasets S1 and S2). That more than half of the data consisted of oligotypes detected in at least 95% of subjects confirms earlier evidence (5, 9) that a substantial portion of the oral microbiome is broadly shared across individuals.
The differing levels of resolution of oligotypes in V3-V5 and V1-V3, however, illustrate the difficulties in defining the core microbiome. The V3-V5 oligotype matching Neisseria flavescens/subflava (Fig. 2A), for example, was detected in 98% of individuals (Dataset S2) and thus could be considered “core” at a threshold of 95%. In V1-V3, however, this taxon is decomposed into three oligotypes matching N. flavescens (Fig. 2B), which were detected in 87%, 86%, and 19% of individuals (Dataset S1). Thus, the greater resolution of V1-V3 for this taxon eliminates it from the core microbiome in V1-V3 at a 95% threshold. However, such a definition is not particularly satisfying because it depends strongly on the depth of sequencing, which determines the fraction of individuals in which a taxon is detectable, as well as depending on the phylogenetic resolution with which “taxon” is defined.
Distribution of Pathogens.
Unlike the genus-level taxonomy provided by the HMP (7, 10), our analysis allowed the identification in the HMP dataset of oligotypes exactly matching the 16S rRNA gene sequences of pathogens and potential pathogens. The presence of pathogens is of interest because the samples came from healthy sites in healthy volunteers screened using stringent criteria for oral health (20). Notably, oligotypes identical to several potential pathogens were detected in high abundance in a small number of samples. In the V3-V5 data, for example, the oligotype matching Moraxella catarrhalis dominated two throat samples with 43% and 63% of the sample, and the oligotype identical to Haemophilus aegyptius constituted 35% of one throat sample. The oligotype matching Porphyromonas gingivalis was detected in 11% of individuals, with a maximum abundance of 10.5% in one SUBP sample. The 26 Treponema oligotypes collectively reached a maximum abundance of 38% in one SUBP sample and made up at least 10% of the sample from SUBP in 11% of volunteers. The oligotype matching Streptococcus mutans reached 0.5% abundance in samples from 10% of individuals and constituted 10–12% of the plaque of one subject. Details of all these distributions can be found in Dataset S2. These results resolve potential pathogens from nonpathogens that were previously lumped together and they provide a baseline estimate for the carriage rate and abundance of potential pathogens in clinically healthy individuals.
Oral Oligotypes Are Distinct from Stool Oligotypes.
Previous analyses of HMP data have noted the presence of genera such as Prevotella and Bacteroides that were abundant in oral sites as well as stool, raising the question of whether there are bacterial taxa that are common to both the mouth and the gut (e.g., ref. 10). To address this question we included stool as well as oral samples collected from the same individuals in the dataset subjected to oligotyping. We found that stool and oral oligotypes separated cleanly; oral oligotypes were found in only trace amounts in stool and stool oligotypes only in trace amounts in the mouth (generally <0.01% overall; Datasets S1 and S2). Only one oligotype, matching the species Dialister invisus, was found in roughly equal proportions in both SUBP and stool samples; the occasional oral samples in which stool oligotypes were detected at >1% are consistent with cross-contamination of samples from the same subject (Dataset S6). These results indicate that the oral and stool environments are home to separate microbial taxa, despite the apparent commonalities at the genus level.
Discussion
The Oligotyping Approach.
Oligotyping is a supervised computational approach that partitions sequence data based on nucleotides at positions of high variation identified by Shannon entropy. The Shannon entropy metric may be considered the information theory counterpart of the coefficient of variation which has been used as an indicator of variation in gene expression studies. Oligotyping detects distinct sequence types independently from taxonomy and without clustering based on pairwise sequence similarity. The independence from taxonomy preserves the ability to detect taxa that were previously unknown, whereas the absence of clustering based on pairwise similarity allows the discrimination of very closely related sequences that may differ from each other by less than 1% over the sequenced region. User-curation steps in the oligotyping pipeline (16) mitigate pitfalls that might arise from random and nonrandom sequencing errors.
Oligotyping was originally proposed as a method for analyzing closely related organisms (16), and it has previously been used to discriminate organisms from single genus- or family-level groupings (21–23) or clustered into one or a few 3% OTUs (24). This study breaks new ground by applying oligotyping to the analysis of an entire microbiome. We chose the phylum level as a starting point, oligotyping each phylum separately. In the case of the large and diverse phylum Proteobacteria, we chose to oligotype each of its classes separately. Oligotyping each phylum individually reduced the complexity of the supervision process, and the high-level starting point allowed us to encompass nearly all sequences as well as to avoid ambiguities resulting from conflicting or inconsistent taxonomy at lower levels of classification such as genus or even family. All together, our oligotyping accounted for more than 99% of the sequencing data generated from the nine sampled oral sites of healthy individuals by the HMP.
To our knowledge, this is the first study that has explained the diversity of almost an entire microbiome through analysis of a high-throughput sequencing dataset only with oligotypes. This expansion opens up the prospect of routine and widespread application of oligotyping to increase the precision and biological relevance of the analysis of large tag-sequencing datasets. Clustering sequences into OTUs based on arbitrary similarity thresholds is widely recognized as an unsatisfactory method, adopted out of necessity with large datasets but generating heterogeneous OTUs of limited biological relevance. Oligotyping, by contrast, creates homogeneous groupings in which the “representative sequence” is truly representative and maximizes the meaningful information that can be recovered from the data.
Making Use of the Information Content of Short Reads.
Short sequences of the 16S rRNA gene, a few hundred nucleotides in length, are often regarded as lacking in taxonomic resolution. However, as we demonstrate here, short reads are fully capable of differentiating taxa as long as the taxa of interest are not identical in the sequenced region. Limitations arise from commonly used analysis methods, such as the RDP classifier, which reports an identification to the genus level even when more specific information is available, and pairwise alignment, which is unable to distinguish phylogenetically important variation from noise. Others have also noted that species-level information is present and have devised specific ways to exploit it (25–27). In contrast, oligotyping is designed to be a generally applicable method that can recover the full information available in sequences of any length. Although oligotyping does not require preexisting reference sequences to differentiate highly similar taxa, it is nevertheless useful to associate individual oligotypes with the vast reservoir of information available for many microbes. Thus, after oligotyping is complete, oligotypes may be associated with taxonomic names by using tools such as BLAST that rely on pairwise sequence similarity for classification. Such postoligotyping classification proved useful in our analysis of the oral microbiome.
High Resolution in Taxonomy, Across Habitats, and Among Individuals.
Many microbial taxa that are of broad interest to oral microbiologists are poorly resolved in the HMP tag sequencing data using standard methods but were clearly differentiated using oligotyping, and their abundance data are now available to the community for further analysis. For example the entirely distinct distributions of Streptococcus gordonii and Streptococcus salivarius/vestibularis are now visible (Fig. 5) and available for analysis (Datasets S1 and S2). The V1-V3 data, although sampled from fewer subjects, frequently have higher resolution than V3-V5, differentiating, for example, Streptococcus sanguinis, Streptococcus intermedius, Streptococcus parasanguinis I, and Streptococcus parasanguinis II each as a separate oligotype (Dataset S1).
Among less-studied taxa, the oligotyping results alert us to the presence of correlations between a tag-sequence variant and a distinctive distribution that is suggestive of significant genomic and functional divergence. The abundant and as-yet-unnamed taxon Porphyromonas sp. HOT 279, for example, is composed of a cluster of closely related sequences, many of which are broadly distributed among oral sites, but some of which show a strong habitat preference for KG (Fig. 3). Targeted cultivation and genomic sequencing of organisms representing each of these types will likely lead to a deeper understanding of the biology both of these organisms and of the host-associated microhabitats in which they reside. Likewise, targeted cultivation and genomic sequencing of the organisms represented by distinct N. flavescens oligotypes (Fig. 4) would provide insights into the population dynamics that influence which of these apparently competing strains establishes itself in a given host.
In summary, the resolution of the HMP dataset across habitats provides a foundation for interpreting the significance of subtle nucleotide variants. Instead of merely recognizing the existence of sequence variation within a taxon, it is possible to associate a particular sequence variant with a differential localization and thus with a likely difference in the underlying biology of the strain carrying the sequence variant. Similarly, the sampling by HMP of a large group of subjects allowed us to identify whether particular oligotypes frequently co-occur in individuals or are generally mutually exclusive. This information serves as a basis to generate hypotheses about the functional significance and the mechanisms behind these different distributions, and can guide future, hypothesis-driven studies. For example, does the mutual exclusiveness pattern of closely related oligotypes arise from founder effects, priority effects, or competitive exclusion among functionally indistinguishable lineages, or does it arise from environmental factors such as host characteristics or phage predation?
Coevolution in the Oral Microbiota.
Oligotypes characteristic of the three major oral habitat groupings are not randomly distributed with respect to taxonomy. Instead, most major oral genera have oligotypes specialized for at least two of the three major habitats: plaque, KG-BM, and the HP-SV-PT-TH-TD grouping. Often these oligotypes are very similar, within 98.5% sequence identity, rendering the overall pattern undetectable unless a high-resolution method is used. The exceptions, genera represented primarily in one habitat, are mostly specialized to plaque, such as Corynebacterium and Treponema (10), as well as a few specialized to SV. Genera represented in all three habitat groups include those containing obligate anaerobes such as Fusobacterium and Veillonella, which suggests that anaerobic microhabitats occur in regions such as TD and KG as well as in SUBP and PT. This pattern of subgenus adaptation present in many genera suggests a coadaptation of the oral microbial community and its coevolutionary expansion into distinct oral habitats. The microbiota themselves constitute a major feature of the environment for other microbes, and thus adaptation to the environment likely includes coadaptation to other members of the microbiome.
Subgingival Plaque Anaerobes Abundant in PT.
Certain oligotypes, generally matching anaerobic taxa, were found in much larger abundance in SUBP relative to SUPP and were also detected in abundance in PT. Our results suggest that the tonsils present a habitat that specifically selects for the growth of periodontal anaerobes outside of the periodontal pocket. This conclusion is consistent with culture-based studies that have shown that anaerobes can be recovered from surface swabs of the tonsils (e.g., ref. 28). It is also consistent with a recent study of the tonsillar crypts using pyrosequencing, which detected a broad range of microbes and suggested that the tonsillar crypts represent a habitat more hospitable to the periodontal microbiota than mucosal surfaces (27). Taken together, the evidence of plaque anaerobes in tonsils in the healthy subject population suggests that such colonization of the tonsils is not inherently pathological but instead represents a physiological mechanism for encouraging contact of potentially pathogenic microbes with lymphoid tissue.
Limitations on Sensitivity and Detection Rate.
The ability to differentiate a rare phylotype from noise depends on the number of reads per sample, i.e., the depth of sequencing. Most of the samples in the V1-V3 dataset were represented by 2,500–9,000 reads (10th to 90th percentile), with a median of 5,400 reads, and in the V3-V5 dataset by 1,800–7,100 reads (10th to 90th percentile), with a median of 3,500 reads. Using this sampling depth, most oligotypes had a membership of 630–10,400 reads in V1-V3 (10th to 90th percentile) and 750–25,600 reads in V3-V5 (10th to 90th percentile). The minimum membership in an oligotype was set by the “minimum substantive abundance” criterion used for oligotyping each phylum, and was 500 for most phyla and 50 for those containing fewer than 100,000 reads overall (Spirochaetes and the class Epsilonproteobacteria). Legitimate sequence variants that were rare as a proportion of the overall community, and were therefore represented in the data by fewer than the cutoff number of counts, were discarded as indistinguishable from the noise arising from sequencing errors. Deeper sequencing would allow for greater discriminatory power and the detection of more oligotypes.
The measured prevalence of rare taxa also depends strongly on the sequencing effort. We analyzed 770 samples for V1-V3 and 1,475 samples for V3-V5. An oligotype in the 10th percentile of the abundance spectrum was therefore represented by less than one read per sample on average. Even more abundant oligotypes will sometimes be represented by single reads: the oligotype matching S. mutans, for example, had a membership of 2,671 reads in V3-V5 (the 52nd percentile) and was represented by only a single read, across all of the oral sites, in one-fourth of the 75 subjects in whom this oligotype was detected. Clearly, at this level of sequencing effort, stochastic factors can play a large role in determining the measured prevalence of oral taxa, particularly when oral sites are considered individually.
Oral Microbiome Communities.
The high taxonomic resolution made possible by oligotyping, combined with the breadth of the HMP dataset, allows a detailed characterization of the oral microbiome communities at the nine sampled oral sites. Our results show that most oligotypes are specialized for one or a group of habitat sites. Plaque is the most distinctive site, having greater biodiversity and a larger number of distinctive oligotypes than any other site in the oral microbiome. The two plaque sites, SUBP and SUPP, resemble each other within individuals as well as overall. Factors differentiating the subgingival from the supragingival environment, such as the bathing of the plaque biofilm in SV vs. crevicular fluid (29), seem to be relatively insignificant for the majority of plaque oligotypes, which are common to both SUPP and SUBP. The availability of oxygen also differentiates the subgingival and supragingival environments, resulting in a markedly greater relative abundance of oligotypes representing strict anaerobes in subgingival compared with SUPP.
KG is not as distinctive as plaque but is nonetheless differentiated by the presence of specific oligotypes, some of which are shared in lower abundance with BM. Why the KG should host so many distinctive taxa, to the exclusion of other keratinized surfaces such as hard palate, is an interesting subject for future investigation. Several oligotypes did preferentially inhabit the HP-KG-BM grouping, and some of them, including the S. mitis/oralis/infantis cluster, make up a large fraction of the total dataset. Outside of the Streptococcus genus, samples from KG and BM are generally intermediate in composition between plaque and the HP-SV-PT-TH-TD grouping.
Samples from HP, SV, PT, TH, and TD generally resemble each other, within individuals as well as overall. For many taxa, TD is at the extreme end of a gradient of taxon abundance from TD through HP, BM, and KG. Saliva resembled a combination of TD, BM, and plaque, with its greater similarity to TD consistent with earlier studies (30) and likely driven by the high surface area and high microbial load of TD resulting in a large biomass of TD microbiota shed into SV. The presence of several abundant and prevalent oligotypes specific to SV suggests the existence within the oral cavity of additional microenvironments, for example the anterior vestibule or the floor of the mouth, that were not directly sampled by the Human Microbiome Project and which may contribute distinctive oligotypes to the salivary microbiota.
Cutting across established habitat groupings is the oligotype matching Dialister invisus, which is the only oligotype found in approximately equal abundance in both oral (SUBP) and stool samples. Other Firmicutes and Bacteroidetes oligotypes, abundant in the gut, appear at >1% in occasional samples from mouth, but primarily in samples that bear a strong resemblance to the stool sample from the same individual, suggesting likely contamination of the oral sample after collection. Strongly contaminated samples were eliminated from analysis by HMP quality controls that flagged samples in which <60% of the sequences were from the correct environment (HMP data analysis procedures available at http://hmpdacc.org/doc/QiimeCommunityProfiling.pdf); however, the levels of potential contamination we see here are lower (<40%) and would have survived this cutoff. A small number of oral samples contain abundant stool-associated oligotypes whose presence cannot be readily explained by cross-contamination (Dataset S6). Aside from such exceptions, gut oligotypes were found in only trace levels in oral samples and vice versa, suggesting that dispersal between these environments occurs, but that most taxa are well-adapted in one environment or the other, but not both.
In summary, our results have demonstrated that the Shannon entropy approach of oligotyping has the capacity to provide a high-resolution view of entire microbiomes. Applying oligotyping to the oral microbiome has made possible a more nuanced characterization of the microbial communities inhabiting each oral site than can be obtained with genus- or even species-level analysis. It has demonstrated that many genera and even some species-level taxa contain previously undetected site-specialists. It has revealed predominance of certain oligotypes within individuals, and correlations between sites within individual mouths, that would not have been seen at the genus level. It has revealed the distribution in healthy individuals of potentially pathogenic taxa. In general, it has enabled a better understanding of the distribution of precisely defined taxa within the mouth, and demonstrated a level of ecological and functional biodiversity not previously recognized. The ability to extract maximum information from sequencing data opens up new possibilities for the analysis of the dynamics of the human oral microbiome. We anticipate that the oligotyping approach will be equally useful when applied to other microbiomes and that it will enable similar insights into a variety of microbial communities.
Materials and Methods
Preparing the Sequencing Data.
We analyzed 16S rRNA gene sequences obtained by 454 pyrosequencing through the National Institutes of Health’s HMP (7), in which 242 adults, 18–40 y old, were sampled at 15 body sites (18 for female participants). Aagaard et al. (20) describe methods for subject screening and recruitment, demographic and clinical data for participants, and sampling methods. The 16S rRNA gene tags were amplified from samples using primers targeting two hypervariable regions, V1-V3 and V3-V5. We used the sequencing data generated from the 16S rRNA gene amplicons and analyzed both regions separately. Details of the initial quality filtering, quality trimming, and chimera removal of the tag sequences we used in this study are described by The HMP Consortium (7). Briefly, during the quality-filtering step, the HMP Consortium removed sequencing reads that contained one or more ambiguous base calls, as well as the ones with homopolymer regions of 8 or more bases. Reads were then trimmed from where the average Q-score dropped below 35 within a 50-bp-long window moved along each read. Quality-trimmed reads that were shorter than 200 bases were also removed from the analysis (7). From all 242 subjects who participated in the study with at least one sample, we used only the subjects from whom samples were available for all nine oral sites. The number of individuals satisfying this criterion was 148 for the V3-V5 and 77 for the V1-V3 datasets. The total number of samples we analyzed was 1,475 for V3-V5 because five subjects lacked stool samples, and 770 for the V1-V3 (all subjects had stool samples). Volunteer ID numbers and number of reads retained per volunteer are reported in Datasets S1 and S2.
From 7,415,906 high-quality V3-V5 reads obtained from 148 individuals, we used only the ones that were classified within the most abundant 6 phyla (which represented 99.75% of all reads): Actinobacteria, Bacteroidetes, Firmicutes, Fusobacteria, Proteobacteria, and Spirochaetes. For Proteobacteria, because of its size and complexity, we oligotyped the classes Betaproteobacteria, Gammaproteobacteria, and Epsilonproteobacteria separately. Alphaproteobacteria and Deltaproteobacteria constituted less than 0.05% of the reads overall and were not oligotyped. The relative abundance of reads classified within phylum TM7 was low in the V3-V5 dataset (an average of 0.03%); however, this phylum was much more abundant in the V1-V3 dataset (an average of 2.3%). Hence, in addition to the six phyla we used for the V3-V5 dataset, we also included the phylum TM7 for analysis of the V1-V3 dataset. The number of high-quality reads for the V1-V3 dataset classified within the seven selected phyla was 4,483,032 and represented 99.39% of all reads for 77 subjects.
The trimming step of the original quality filtering (7) resulted in reads with different ending positions. We retrimmed the data so that the reads within each phylum have the same starting and ending positions, using an approach designed to maximize the length of the trimmed reads by eliminating shorter reads but never eliminating more than 10% of the reads from any phylum (Python script “o-smart-trim” is available in the oligotyping pipeline). This criterion led to trimming of the data to ∼245 bases for the V1-V3, and ∼235 bases for the V3-V5 datasets. Datasets S1 and S2 report the average read lengths for each phylum before and after the quality trimming. The trimmed V1-V3 data contained the V3 hypervariable region but was trimmed just before the V2, whereas the trimmed V3-V5 data contained the V5 hypervariable region but was trimmed just before the V4. Thus, despite the labels “V1-V3” and “V3-V5,” only a single hypervariable region (V3 or V5) was in fact present in each dataset after trimming. Finally, we aligned reads in each phylum individually using PyNAST (31), a template-based aligner, against Greengenes alignment templates (32) (October 6, 2010 release) before oligotyping analysis.
Oligotyping Analysis.
We used the pipeline version 0.96 (available from http://oligotyping.org) for oligotyping (16). After the initial calculation of Shannon entropy using the analyze-entropy script in the oligotyping pipeline, we ran oligotyping for each phylum (or Proteobacterial class) separately and supervised the process until each oligotype had converged, that is, until the remaining entropy was attributable to noise and/or the inclusion of additional nucleotide positions in the oligotype would not increase the degree to which the added oligotypes were differentially abundant in different samples (16), in this case different oral sites. To minimize the impact of sequencing errors on oligotyping results, we used a minimum substantive abundance criterion (M), which requires the most abundant unique sequence in an oligotype to be more abundant than the user-defined value of M. We set M to 500 for all phyla and Proteobacterial classes except for Epsilonproteobacteria and Spirochaetes, the groups with the smallest number of reads, for which M was set to 50. M values averaged 0.15% of the total number of reads in all phyla analyzed in both datasets and never exceeded 0.5% for any individual phylum. Oligotypes not meeting the minimum substantive abundance criterion were discarded as noise, although these might have included valid but rare oligotypes for which we have insufficient data for proper analysis. This noise filtering removed 9.3% of reads from the V1-V3 dataset and 3.8% of reads from the V3-V5 dataset. High-information positions resulting from systematic errors such as those introduced at homopolymer regions by 454 sequencing (18, 19, 33) are also detected during the oligotyping process and can be selectively disregarded through the user-curation steps of oligotyping. Because we ensured the convergence criterion to be met only for oral sites, oligotypes composed of reads found mostly in stool samples may contain unexplained diversity of very closely related organisms; hence, the diversity of stool samples may have been underestimated in our final results.
Upon completion of individual oligotyping analyses for each phylum, we concatenated the resulting observation matrices to generate a single observation matrix for the V1-V3 dataset (Dataset S1) and another for the V3-V5 dataset (Dataset S2). These observation matrices report counts (i.e., number of reads assigned to each oligotype in each sample). We then converted counts to percent abundances within each sample and used these normalized relative abundances for all further analyses. To assign taxonomy for each oligotype, we searched representative sequences of our oligotypes against the HOMD (16S rRNA RefSeq Version 12.0 obtained from www.homd.org on January 16, 2013), using blastn (34) version 2.2.26+, the National Center for Biotechnology Information’s open-source tool. We performed the BLAST search with default parameters, except ‘-perc_identity 90’ (to have any hit with more than 90% sequence identity reported), and ‘-outfmt '6 qseqid sseqid pident length mismatch gapopen qstart qend sstart send evalue bitscore qlen slen’ (to have the query alignment length included in the resulting hits table). For each oligotype, the oligotyping pipeline chooses the most abundant unique read as the representative sequence to be used for downstream analyses. We report the distribution patterns among oral sites, representative sequences, and HOMD hits for each oligotype in Datasets S1 and S2 for V1-V3 and V3-V5, respectively.
Calculation of Site Preferences.
We developed an ad-hoc classification algorithm using Student t test to associate each oligotype with one or more sampling sites where that oligotype is most differentially abundant. Our algorithm first creates a list of all possible binary mappings of ten sampling sites (BM, HP, KG, PT, stool, SUBP, SUPP, SV, TD, and TH) to generate all two-group combinations of sampling sites. For example, the first map in the list ({1, 0, 0, 0, 0, 0, 0, 0, 0, 0}) would identify BM in group 1 and the rest of the sampling sites in group 2. The second map in the list ({1, 1, 0, 0, 0, 0, 0, 0, 0, 0}) would identify BM and HP in group 1, and so on. The total number of binary combinations of 10 sampling sites is 1,024; however, this number includes two maps to be discarded where only one group has all of the sites and the other group is empty (the case of {1, 1, 1, 1, 1, 1, 1, 1, 1, 1} and {0, 0, 0, 0, 0, 0, 0, 0, 0, 0}). Each of the remaining 1,022 maps would also have a symmetrical counterpart that can be discarded, because both would result in identical groupings of sites (i.e., {1, 1, 0, 0, 0, 0, 0, 0, 0, 0} and {0, 0, 1, 1, 1, 1, 1, 1, 1, 1}). Hence, our algorithm investigates the distribution of an oligotype in 10 sampling sites using 511 maps. For instance, for the map {1, 1, 0, 0, 0, 0, 0, 0, 0, 0}, the algorithm places relative abundances of the oligotype observed in sites BM and HP from all individuals in group 1, and relative abundance values from the remaining sites in group 2. Then it tests whether the central tendencies of group 1 and group 2 differ significantly using Student t test. The map that yields the largest absolute t statistic is used to associate the oligotype with sampling site(s) listed in group 1 (if t is positive) or in group 2 (if t is negative). Datasets S1 and S2 report the oligotype–site associations for each oligotype along with the recovered statistic and significance values. The purpose of our approach is similar to the purpose of LEfSe, which is a biomarker discovery package that can associate taxa with environments based on differential abundance profiles (35). However, in our algorithm an oligotype can be associated with multiple sampling sites, which is a critical requirement of our study given the nature of the dataset. Datasets S1 and S2 also report results of LEfSe analysis performed with default parameters for each oligotype for comparison. The address https://github.com/meren/hmp-oral-microbiota provides access to the source code of our algorithm implemented in R.
Statistical Analyses and Visualization.
For clustering and MDS analyses we used the R functions hclust in the stats package of R (36) and metaMDS in the vegan package (37) with the Morisita-Horn dissimilarity index. The centroid and the shape of dispersion ellipses in Fig. 1 are defined by the group mean and within-group covariance. We calculated covariance for each group using the cov.wt function in the stats package in R and called veganCovEllipse in the vegan package to generate shapes to be overlaid on the MDS plot. For all visualizations we used the ggplot2 package (38) in R. All figures were finalized for publication using Inkscape, an open-source vector graphics editor (available from http://inkscape.org).
Supplementary Material
Acknowledgments
We thank David Mark Welch, Floyd Dewhirst, and Zoe Cardon and the Micro-Eco Group at the Marine Biological Laboratory for helpful discussions. A.M.E. was supported by a G. Unger Vetlesen Foundation grant to the Marine Biological Laboratory; G.G.B. and J.L.M.W. were supported by National Institutes of Health (NIH) National Institute of Dental and Craniofacial Research Grant DE022586 (to G.G.B.); and S.M.H. was supported by NIH Human Microbiome Project Demonstration Project Award DK083993 to Vincent B. Young (University of Michigan).
Footnotes
The authors declare no conflict of interest.
This article contains supporting information online at www.pnas.org/lookup/suppl/doi:10.1073/pnas.1409644111/-/DCSupplemental.
References
- 1.Dewhirst FE, et al. The human oral microbiome. J Bacteriol. 2010;192(19):5002–5017. doi: 10.1128/JB.00542-10. [DOI] [PMC free article] [PubMed] [Google Scholar]
- 2.Aas JA, Paster BJ, Stokes LN, Olsen I, Dewhirst FE. Defining the normal bacterial flora of the oral cavity. Journal of Clinical Microbiology. 2005;43(11):5721–5732. doi: 10.1128/JCM.43.11.5721-5732.2005. [DOI] [PMC free article] [PubMed] [Google Scholar]
- 3.Bik EM, et al. Bacterial diversity in the oral cavity of 10 healthy individuals. ISME J. 2010;4(8):962–974. doi: 10.1038/ismej.2010.30. [DOI] [PMC free article] [PubMed] [Google Scholar]
- 4.Keijser BJF, et al. Pyrosequencing analysis of the oral microflora of healthy adults. J Dent Res. 2008;87(11):1016–1020. doi: 10.1177/154405910808701104. [DOI] [PubMed] [Google Scholar]
- 5.Zaura E, Keijser BJF, Huse SM, Crielaard W. Defining the healthy “core microbiome” of oral microbial communities. BMC Microbiol. 2009;9:259. doi: 10.1186/1471-2180-9-259. [DOI] [PMC free article] [PubMed] [Google Scholar]
- 6.Lazarevic V, et al. Metagenomic study of the oral microbiota by Illumina high-throughput sequencing. J Microbiol Methods. 2009;79(3):266–271. doi: 10.1016/j.mimet.2009.09.012. [DOI] [PMC free article] [PubMed] [Google Scholar]
- 7.Human Microbiome Project Consortium A framework for human microbiome research. Nature. 2012;486(7402):215–221. doi: 10.1038/nature11209. [DOI] [PMC free article] [PubMed] [Google Scholar]
- 8.Human Microbiome Project Consortium Structure, function and diversity of the healthy human microbiome. Nature. 2012;486(7402):207–214. doi: 10.1038/nature11234. [DOI] [PMC free article] [PubMed] [Google Scholar]
- 9.Huse SM, Ye Y, Zhou Y, Fodor AA. A core human microbiome as viewed through 16S rRNA sequence clusters. PLoS ONE. 2012;7(6):e34242. doi: 10.1371/journal.pone.0034242. [DOI] [PMC free article] [PubMed] [Google Scholar]
- 10.Segata N, et al. Composition of the adult digestive tract bacterial microbiome based on seven mouth surfaces, tonsils, throat and stool samples. Genome Biol. 2012;13(6):R42. doi: 10.1186/gb-2012-13-6-r42. [DOI] [PMC free article] [PubMed] [Google Scholar]
- 11.Wang Q, Garrity GM, Tiedje JM, Cole JR. Naive Bayesian classifier for rapid assignment of rRNA sequences into the new bacterial taxonomy. Appl Environ Microbiol. 2007;73(16):5261–5267. doi: 10.1128/AEM.00062-07. [DOI] [PMC free article] [PubMed] [Google Scholar]
- 12.Ward DM, Ferris MJ, Nold SC, Bateson MM. A natural view of microbial biodiversity within hot spring cyanobacterial mat communities. Microbiol Mol Biol Rev. 1998;62(4):1353–1370. doi: 10.1128/mmbr.62.4.1353-1370.1998. [DOI] [PMC free article] [PubMed] [Google Scholar]
- 13.Thompson JR, et al. Genotypic diversity within a natural coastal bacterioplankton population. Science. 2005;307(5713):1311–1313. doi: 10.1126/science.1106028. [DOI] [PubMed] [Google Scholar]
- 14.Kawamura Y, Hou XG, Sultana F, Miura H, Ezaki T. Determination of 16S rRNA sequences of Streptococcus mitis and Streptococcus gordonii and phylogenetic relationships among members of the genus Streptococcus. Int J Syst Bacteriol. 1995;45(2):406–408. doi: 10.1099/00207713-45-2-406. [DOI] [PubMed] [Google Scholar]
- 15.Denapaite D, et al. The genome of Streptococcus mitis B6—what is a commensal? PLoS ONE. 2010;5(2):e9426. doi: 10.1371/journal.pone.0009426. [DOI] [PMC free article] [PubMed] [Google Scholar]
- 16.Eren AM, et al. Oligotyping: Differentiating between closely related microbial taxa using 16S rRNA gene data. Methods Ecol Evol. 2013;4(12):1111–1119. doi: 10.1111/2041-210X.12114. [DOI] [PMC free article] [PubMed] [Google Scholar]
- 17.Shannon CE. A mathematical theory of communication. Bell System Technical Journal. 1948 27:379–423, 623–656. [Google Scholar]
- 18.Huse SM, Huber JA, Morrison HG, Sogin ML, Mark Welch DB. Accuracy and quality of massively parallel DNA pyrosequencing. Genome Biol. 2007;8(7):R143. doi: 10.1186/gb-2007-8-7-r143. [DOI] [PMC free article] [PubMed] [Google Scholar]
- 19.Shao W, et al. Analysis of 454 sequencing error rate, error sources, and artifact recombination for detection of low-frequency drug resistance mutations in HIV-1 DNA. Retrovirology. 2013;10:18. doi: 10.1186/1742-4690-10-18. [DOI] [PMC free article] [PubMed] [Google Scholar]
- 20.Aagaard K, et al. The Human Microbiome Project strategy for comprehensive sampling of the human microbiome and why it matters. FASEB J. 2013;27(3):1012–1022. doi: 10.1096/fj.12-220806. [DOI] [PMC free article] [PubMed] [Google Scholar]
- 21.Eren AM, et al. Exploring the diversity of Gardnerella vaginalis in the genitourinary tract microbiota of monogamous couples through subtle nucleotide variation. PLoS ONE. 2011;6(10):e26732. doi: 10.1371/journal.pone.0026732. [DOI] [PMC free article] [PubMed] [Google Scholar]
- 22.McLellan SL, et al. Sewage reflects the distribution of human faecal Lachnospiraceae. Environ Microbiol. 2013;15(8):2213–2227. doi: 10.1111/1462-2920.12092. [DOI] [PMC free article] [PubMed] [Google Scholar]
- 23.Reveillaud J, et al. Host-specificity among abundant and rare taxa in the sponge microbiome. ISME J. 2014;8(6):1198–1209. doi: 10.1038/ismej.2013.227. [DOI] [PMC free article] [PubMed] [Google Scholar]
- 24.Maignien L, DeForce EA, Chafee ME, Eren AM, Simmons SL. Ecological succession and stochastic variation in the assembly of Arabidopsis thaliana phyllosphere communities. MBio. 2014;5(1):e00682–13. doi: 10.1128/mBio.00682-13. [DOI] [PMC free article] [PubMed] [Google Scholar]
- 25.Conlan S, Kong HH, Segre JA. Species-level analysis of DNA sequence data from the NIH Human Microbiome Project. PLoS ONE. 2012;7(10):e47075. doi: 10.1371/journal.pone.0047075. [DOI] [PMC free article] [PubMed] [Google Scholar]
- 26.Fettweis JM, et al. Vaginal Microbiome Consortium (additional members) Species-level classification of the vaginal microbiome. BMC Genomics. 2012;13(Suppl 8):S17. doi: 10.1186/1471-2164-13-S8-S17. [DOI] [PMC free article] [PubMed] [Google Scholar]
- 27.Jensen A, Fagö-Olsen H, Sørensen CH, Kilian M. Molecular mapping to species level of the tonsillar crypt microbiota associated with health and recurrent tonsillitis. PLoS ONE. 2013;8(2):e56418. doi: 10.1371/journal.pone.0056418. [DOI] [PMC free article] [PubMed] [Google Scholar]
- 28.Reilly S, Timmis P, Beeden AG, Willis AT. Possible role of the anaerobe in tonsillitis. J Clin Pathol. 1981;34(5):542–547. doi: 10.1136/jcp.34.5.542. [DOI] [PMC free article] [PubMed] [Google Scholar]
- 29.Socransky SS, Haffajee AD. Periodontal microbial ecology. Periodontol 2000. 2005;38(1):135–187. doi: 10.1111/j.1600-0757.2005.00107.x. [DOI] [PubMed] [Google Scholar]
- 30.Mager DL, Ximenez-Fyvie LA, Haffajee AD, Socransky SS. Distribution of selected bacterial species on intraoral surfaces. J Clin Periodontol. 2003;30(7):644–654. doi: 10.1034/j.1600-051x.2003.00376.x. [DOI] [PubMed] [Google Scholar]
- 31.Caporaso JG, et al. PyNAST: A flexible tool for aligning sequences to a template alignment. Bioinformatics. 2010;26(2):266–267. doi: 10.1093/bioinformatics/btp636. [DOI] [PMC free article] [PubMed] [Google Scholar]
- 32.McDonald D, et al. An improved Greengenes taxonomy with explicit ranks for ecological and evolutionary analyses of bacteria and archaea. ISME J. 2012;6(3):610–618. doi: 10.1038/ismej.2011.139. [DOI] [PMC free article] [PubMed] [Google Scholar]
- 33.Gilles A, et al. Accuracy and quality assessment of 454 GS-FLX Titanium pyrosequencing. BMC Genomics. 2011;12:245. doi: 10.1186/1471-2164-12-245. [DOI] [PMC free article] [PubMed] [Google Scholar]
- 34.Altschul SF, Gish W, Miller W, Myers EW, Lipman DJ. Basic local alignment search tool. J Mol Biol. 1990;215(3):403–410. doi: 10.1016/S0022-2836(05)80360-2. [DOI] [PubMed] [Google Scholar]
- 35.Segata N, et al. Metagenomic biomarker discovery and explanation. Genome Biol. 2011;12(6):R60. doi: 10.1186/gb-2011-12-6-r60. [DOI] [PMC free article] [PubMed] [Google Scholar]
- 36.The R Core Team . R : A Language and Environment for Statistical Computing. Vienna: Foundation for Statistical Computing; 2013. [Google Scholar]
- 37.Oksanen J, et al. 2013. vegan: Community Ecology Package. R package version 2.0-9. Available at http://CRAN.R-project.org/package=vegan. Accessed May 1, 2014.
- 38.Wickham H. 2009. ggplot2: elegant graphics for data analysis (Springer, New York)
Associated Data
This section collects any data citations, data availability statements, or supplementary materials included in this article.