

Summary
Autism is a behaviorally diagnosed neurodevelopmental disorder with no current biomarkers with high specificity and sensitivity. Gamma-band abnormalities have been reported in many studies of autism spectrum disorders. Gamma-band activity is associated with perceptual and cognitive functions that are compromised in autism. Some gamma-band deficits have also been seen in unaffected first-degree relatives, suggesting heritability of these findings. This review covers the published literature on gamma abnormalities in autism, the proposed mechanisms underlying the deficits, and the potential for translation into new treatments. Although the utility of gamma-band metrics as diagnostic biomarkers is currently limited, such changes in autism are also useful as endophenotypes, for evaluating potential neural mechanisms, and for use as surrogate markers of treatment response to interventions.
Keywords: Phase-locking, oscillations, connectivity, glutamate, GABA, EEG, MEG
Introduction
Autism spectrum disorders, hereafter collectively referred to as autism, are a group of complex neurodevelopmental disorders marked by a triad of impairments in communication, social interaction, and behavioral flexibility. Gamma-band oscillations observed in the EEG and MEG have been of significant interest in recent years in autism. As opposed to other frequency bands seen in the EEG, gamma-band oscillations have a relatively better characterized basis in brain circuitry. Gamma-band dysfunction in autism is therefore seen as a potential non-invasive marker of dysfunction in the underlying circuitry, which heavily implicates GABA and glutamate neurotransmission. Other frequency bands are implicated in autism as well, but are less well studied with respect to their underlying neurobiological mechanisms. For this reason, we focus the current review on the gamma-band specifically in autism. Interested readers are referred to a recent review including other spectral findings in autism [1].
Under current ICD diagnostic criteria [2] the autism spectrum includes three of five pervasive developmental disorders (PDD): autistic disorder, Asperger's disorder, and pervasive developmental disorder not otherwise specified. Until recently, DSM criteria for autism coincided with the ICD, but in 2013 diverged with the release of the DSM-5 [3]. Major changes under DSM-5 include the elimination of the differential diagnostic PDD subtypes within autism spectrum disorder and the blending of the social interaction and communication diagnostic domains so that symptoms must now be present in two rather than three domains. How and if these changes in diagnostic criteria will effect prevalence rates remains to be seen, but under current diagnostic criteria the prevalence of autism in the U.S. is estimated to be 1 in 88 children, or just over 1% [4]. A recent review of epidemiological surveys worldwide resulted in a similar average prevalence of 1 in 160 children, or 0.6% [5]. With a prevalence of approximately 1% worldwide, autism is now one of the most common neurodevelopmental disorders in children. Although it is commonly reported that boys are affected more often than girls at a rate of approximately 4:1 [6,7], the gender disparity is not as wide in samples with more severe cognitive dysfunction and may approach 2:1 [8].
Beginning in the late 1970s, twin studies comparing concordance rates in identical and fraternal twins reported high heritability for the disorder, as high as 90% for autism [9]. The recurrence risk for autism in siblings of affected children ranges is as high as 18% [10-12], relative to approximately 1% in the general population. While autism is clearly a genetically mediated disorder, the underlying etiology of remains largely unknown. In approximately 10-25% of individuals with autism a pathogenic genetic association can be identified [13,14]. In about 5% of these cases, a single-gene cause has been found with the most common cause being a mutation in the FMR1 gene (i.e., fragile × syndrome). The majority of cases, however, remain classified as idiopathic [14].
Because behavioral and genetic heterogeneity are hallmarks autism features, and because definitive behavioral diagnoses cannot be made in infancy, biomarkers of the disorder are highly desirable. Despite the pressing need, there are few, if any, well-established biomarkers in autism at any level of analysis. Biomarkers could potentially help assist diagnosis or even prediction of eventual diagnosis in those at increased risk for the disorder. The promise remains elusive, however. Recently, for example, a proposed set of diagnostic markers at the genetic level [15] failed to replicate in a carefully controlled independent follow-up study [16]. Perhaps the most replicated of the blood-based biomarkers is elevated platelet serotonin [17,18]. Many groups have proposed non-invasive biomarkers in autism, based on such techniques as eye-tracking, EEG, MEG and MRI [19-23]. To date, none of these have demonstrated ability with respect to the diagnosis of autism.
Another potential use of biomarkers in autism is for the disentanglement of the serious heterogeneity problem seen in the spectrum. Biomarkers might be useful for defining important sub-groups along the autism spectrum. In addition, phenotypic hetereogeneity is a serious problem for the identification of new risk genes and molecular pathways involved in autism [24]. Gamma-band dysfunction, which appears to be heritable [21], might provide a non-invasive means to assess such subgroups. Identifying biomarkers such as these that are seen in first-degree relatives, also known as endophenotypes, can increase the power of genetic studies [25]. Persico and Sacco [26] reviewed autism endophenotypes recently, and as they point out, all endophenotypes are also biomarkers, but as not all biomarkers are heritable, not all biomarkers are endophenotypes. One interesting phenomenon that is receiving considerable attention recently in the EEG and MEG literature in autism is gamma-band dysfunction, which has been proposed as both a biomarker and endophenotype. Gamma-band markers were not reviewed by Persico and Sacco [26].
Gamma-band Oscillations in Autism
Gamma-band is normally defined as electric or magnetic activity in the frequency range between 30 to 80 Hz, although there is increasing awareness of a separate high-gamma range (80+ Hz). These high frequencies have generated attention in autism research primarily because there may be a role for them in cognitive phenomena such as perceptual binding [Freeman, 1975 #153;Belmonte, 2004 #154;Uhlhaas, 2006 #155].
Gamma oscillations are studied using varied technologies such as electroencephalography (EEG) and magnetoencephalography (MEG), which measure either the electrical or magnetic fields of the brain, respectively. MEG is more sensitive to superficial cortical sources, and receives relatively less contribution from deeper sources than EEG. MEG is also more sensitive to the orientation of the current source than EEG, preferring cortical sources that are more likely to be sulcal than at the crowns of gyri [27]. MEG analyses are often conducted in source space as opposed to sensor space due to the relative ease of source analysis in MEG, but the two technologies are mostly complementary and phenomena such as gamma-band oscillations are well studied with either technique. As such, we combine EEG and MEG studies within the same review sections. For reader clarity, we identify MEG studies as such in every instance they are discussed in the text below. All other reviewed studies are EEG studies, unless otherwise noted.
Gamma-band is not a unitary construct
Gamma-band oscillations can be sub-divided in several ways (Table 1). Spontaneous gamma is the simplest of these, normally studied in a relatively task-free manner under conditions of eyes-open, eyes-closed, or both. In contrast, the analysis of oscillatory responses associated with task-stimulation produces power spectral changes that can be characterized by their phase consistency to the stimuli during the task. Commonly, gamma-band responses with high phase-consistency between trials are termed evoked, or phase-locked, while those with low inter-trial consistency are termed induced, or non-phase-locked. Evoked responses can be measured by time-domain averaging over trials and then computing the spectrum, while for induced responses the spectra of individual trials must first be computed, and then averaged in the frequency domain (Table 1).
Table 1.
Summary of different types of spectral power.
| Type of spectral power | Phase-locking to stimulus/response | Relationship to PLF+ | Typical Analysis* |
|---|---|---|---|
| Evoked | High | Positively correlated | Average in time domain, then spectral analysis |
| Induced (Total) | Indeterminate | Varies. PLF can allow one to view this measure and decide whether power is evoked or induced | Spectral analysis on individual trials, then average |
| Induced (-Evoked) | Low | Negatively correlated | Take result of Evoked analysis and subtract from Induced, either from average Induced or from individual trials |
| Spontaneous | Indeterminate | Indeterminate | Cut continuous EEG/MEG data into segments, compute spectrum on segments, then average |
Notes
The term phase-locking factor (PLF) is used here for the reasons outlined in Roach and Mathalon {Roach:2008ib}. PLF is also sometimes referred to as inter-trial coherence (ITC) and inter-trial phase-coherence (ITPC).
Analyses are varied and these examples are meant to convey common approaches, not all approaches.
There is interest in this distinction in the field because evoked gamma-band oscillations are often seen at earlier latencies post-stimulus and some researchers consider them to reflect early sensory or attention processes, while induced gamma is often seen at longer latencies and is commonly inferred to be of import to perceptual closure or feature binding [28]. Although these types of gamma may have a greater or lesser association with various sensory and cognitive functions, oscillatory activity cannot be neatly divided into evoked or induced categories. While successive time-domain averages with increasing numbers of trials will tend to favor evoked responses, there will always be a non-phase-locked component. Likewise, phase-locked responses are normally part of induced power by definition. Therefore, phase-locking is best considered to be a continuum between theoretical extremes. Both types of stimulus-related gamma-band perturbations, as well as spontaneous gamma-band fluctuations, have been reported to be anomalous in autism. The degree of phase-locking is also frequently measured and reported separately in autism and Figure 1 illustrates a phase-locking measure for an auditory gamma-band response.
Figure 1.
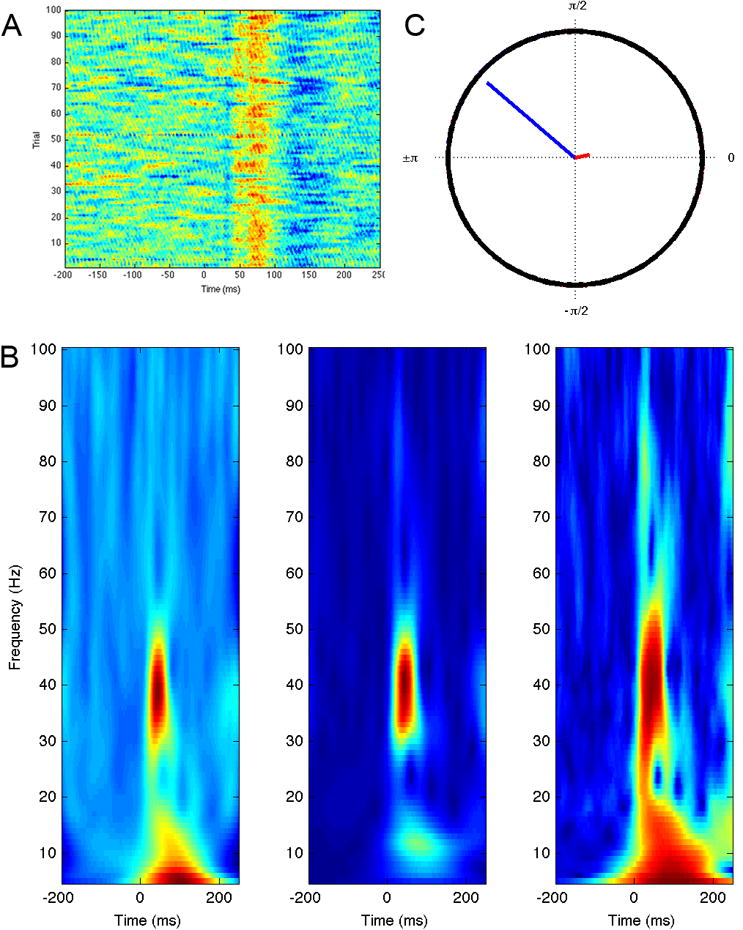
Phase-locking and the transient auditory gamma-band response. A) Single trial amplitude plot of responses to 1000 Hz pure tone stimulus in passive task. Warmer colors indicate positive amplitude and cooler colors indicate negative amplitudes. Note variability of response latency from trial to trial. B) Time frequency spectrograms produced by Morlet wavelet decomposition, from left to right: Induced, or total power, consisting of both phase-locked and non-phase-locked components; Evoked power, from the spectral analysis of the time-domain average; Phase-locking factor (PLF). Note the strong phase-locked response around 40 Hz. C) Mean phase from trials at 45 ms post stimulus at peak of gamma-band response (blue) compared with mean phase from trials at -45 ms post-stimulus period (red). Note that the mean phase of the pre-stimulus region is near zero, while there is a clear non-zero phase for the post-stimulus region. Conceptually, this is what the PLF plots for each time-frequency bin, normalized from 0 (non-phase-locked) to 1 (phase-locked).
Gamma-band activity may also be subdivided into low (30-80 Hz) and high bands (80-150 Hz). Various autism studies have focused on one or the other or both bands with varied definitions of low and high. High gamma power is broadband, associated closely with local field potential synchrony and may reflect the spiking of populations of neurons within the sensitivity range of the sensor [29]. This contrasts with the lower gamma-band range, which exhibits a peak in the spectrum and may be properly considered to be an ongoing rhythmic activity.
Faster rhythmic activity than high-gamma is also observed in the brain, but is generally not termed “gamma-band” even though it may share similarities with those lower frequencies. For example, activity in the range of 140-220 Hz is often referred to as ripples, while even higher frequencies oscillations between 220 and 600 Hz are called fast ripples and are considered pathological [30]. Such activity has not yet been studied in autism, although given the connection between fast ripple activity and epilepsy [31], as well as the increased prevalence of seizures in autism [32], there is ample reason to pursue such studies.
As can be appreciated from Table 1, the terms evoked and induced are not simply descriptions of types of spectral power. They are also analysis methods that can be applied to some extent interchangeably with the power one is interested in assessing. For example, although a researcher might be interested in induced, or non-phase-locked responses only, if the analysis pathway involves computing the spectrum on individual trials, then averaging, the resulting power will consist of both induced and evoked components (i.e., total power). For this reason, some studies also provide an independent metric of phase-locking called the phase-locking factor (PLF) so that responses observed in the spectrogram that also have high PLF can be confidently called evoked and those with low PLF can be termed induced (see Figure 2). Unfortunately, not all studies of induced oscillatory responses to stimuli provide the PLF, which does not allow the reader to be certain of which type of response they are viewing in figures.
Figure 2.
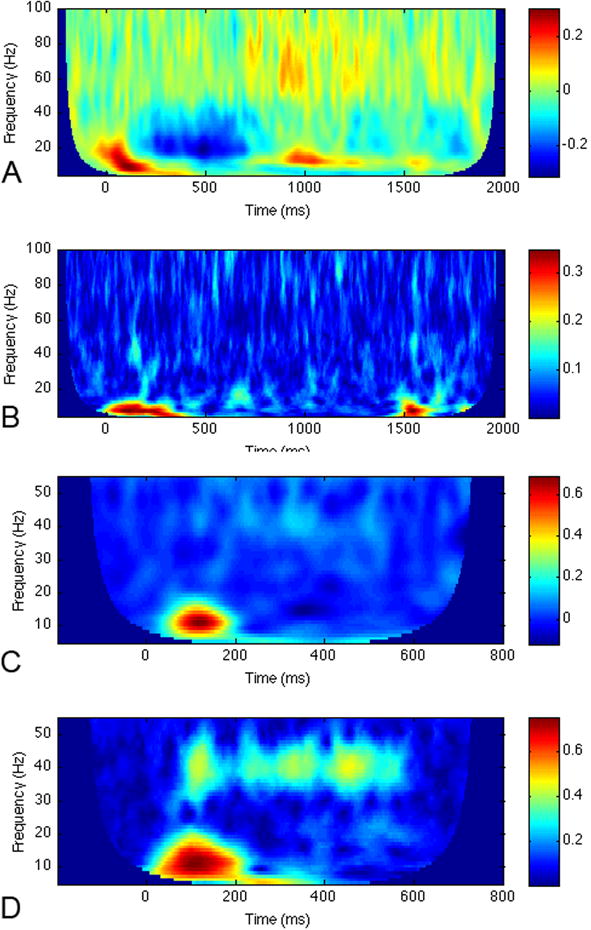
Gamma-band responses to two different types of stimuli. The top two panels are spectrograms from a visual phonological processing task, from a left occipito-temporal channel in an MEG sensor array: A) Induced power and B) PLF. Note the high gamma-band responses beginning approximately 700 ms post stimulus. In the PLF, these are not seen, indicating that the gamma-band power in plot A is primarily non-phase-locked, or induced power. In contrast, there are low frequency components that are highly phase-locked, or evoked. Bottom two panels: C) Induced power of auditory steady-state response to 40 Hz amplitude-modulated stimulus lasting 500 ms, from channel T5 of an EEG dataset. Note the gamma-band response at approximately 40 Hz beginning around 100 ms. D) PLF of response in C. The PLF for this type of gamma is high, in contrast to plot B, indicating that the power of this response is highly phase-locked to the stimulus, or evoked. All time-frequency spectrograms were produced by Morlet wavelet decomposition.
Spontaneous gamma-band studies in autism
Spontaneous gamma activity has been studied less frequently in autism than spontaneous activity in other, lower frequency bands. Orekhova et al. [33] reported higher levels of EEG gamma-band activity, defined as 24-44 Hz in their study. These authors also observed excess gamma in a follow-up study [34], although that sample had high overlap with their 2007 study. In this later study, the authors reported a novel association between higher spontaneous EEG gamma-band activity and reduced P50 suppression in a paired-click paradigm. Both gamma-band activity and P50 suppression are often interpreted as indices of inhibitory neuronal function [35,36] and the authors interpreted the finding in the context of imbalanced excitatory/inhibitory activity in the autism group. For EEG, a similar finding of increased gamma-band power in the range of 25-55 Hz was reported recently [37]. An MEG paper on eyes-closed resting-state activity compared low and high gamma-band activity between 27 children with autism and 23 typically developing controls [38]. This study reported significantly elevated resting low gamma (30-55 Hz), high-gamma (65-90 Hz) and what was termed very fast oscillations (90-120 Hz) in autism. An advantage of the Cornew et al. [38] study was the use of MEG data to perform source space projections to examine regional specificity. Elevations in gamma were observed in anterior temporal, posterior temporal and occipital sites.
A similar number of studies, however, have observed decreases in spontaneous gamma-band power in autism. Sheikhani et al. [39] reported reduced frontal gamma-band power in eyes open, resting EEG from 15 children with Asperger's disorder compared with typically-developing control subjects. Another recent paper from the same EEG group observed lower gamma from temporal and frontal electrodes in 17 children with autism compared with typically developing children [40]. Maxwell et al. [41] observed reduced gamma-band power in the right lateral EEG of 15 boys with autism compared with 18 typically-developing control subjects.
Another study reporting a decrease in resting gamma-band power examined the effect of a behavioral intervention on spectral power [42]. Eyes open resting-state gamma was measured in the EEG of 29 adolescents with autism, 28 adolescents who received a 14-week behavioral intervention, and 30 typically developing adolescents [42]. This study involved a randomized controlled trial of a behavioral intervention addressing friendship development in autism [43]. This study examined spectral power asymmetry before and after intervention in a group of adolescents receiving the treatment and a waitlist group. Prior to the intervention, both groups of adolescents with autism were found to exhibit significantly lower left-dominant asymmetry in the gamma band relative to typically developing adolescents. A similar effect was also observed for pre-intervention symmetry measures in the beta band. Following the intervention, adolescents with autism that participated exhibited significantly increased left-dominant gamma asymmetry whereas the waitlist group did not exhibit this change in asymmetry over time. Furthermore, gamma-band asymmetry was found not to differ between adolescents with autism that participated in the intervention and typically developing adolescents, but the waitlist group still had lower left-dominant symmetry than the typically developing adolescents. This post-treatment effect was found to be specific to the gamma band with no significant post-treatment effects observed in other bands.
As pointed out by Maxwell et al. [41], the varying reported results for spontaneous gamma-band in autism are difficult to reconcile. Factors such as whether the data were acquired eyes closed [38] or open [40,41] may be important to consider, as are differences in technology (MEG vs. EEG) and analysis methods (source space vs. sensor space). Control over the subject's state of arousal and alertness is difficult to achieve in spontaneous EEG or MEG studies, particularly with eyes-closed, and we suggest that future studies evaluate both eyes-closed and eyes-open conditions. Further, in eyes-closed studies, it would be worthwhile to include measures of sleep state, if only to ensure that subjects remained awake during the recordings. Simultaneous MEG and EEG could be obtained to address concerns over the specific modality used to obtain the results.
Gamma-band responses to visual stimuli in autism
Within the visual stimulus domain, gamma oscillatory activity has been suggested to bind the visual features of objects that are encoded and processed in different brain regions together to form a coherent percept [44,45]. Studies of gamma activity in response to perception of illusory objects that require perceptual closure, such as Kanizsa figures and Mooney faces, are therefore of interest in autism given evidence for abnormalities in visual perception [46]. We first consider responses to lower level visual stimuli and then proceed to higher order phenomena involving perceptual closure.
Simple visual stimuli: Gabor patches
Gabor patches are stimuli that are thought to have characteristics that match the receptive field properties of neurons in the primary visual cortex [47], with increases in gamma-band power observed in response to increasing grating size of the Gabor patches in non-human primate research [48]. Two EEG studies have examined induced gamma activity in response to Gabor patches in individuals with autism, one examining gamma in 20 adolescents with autism and 20 typically developing adolescents [49] and another measuring evoked gamma in 12 adults with autism and 12 typically developing adults [50]. Both of these studies required responses from participants and did not observe behavioral response differences between groups. In addition, both studies reported reduced gamma responses in posterior cortical regions in autism in response to increases in the contextual modulation of the stimuli.
Perceptual closure
Grice et al. [51] were the first to examine stimulus related gamma in autism. Using EEG, they examined evoked and induced gamma activity in 8 adults with autism during the perception of Mooney faces, compared with 8 comparison subjects and 8 people with Williams Syndrome (WS), a genetic condition resulting from a partial deletion of chromosome 7. Consistent with findings in typically developing subjects [52], greater induced gamma activity in response to upright relative to inverted faces were observed in comparison subjects, but face orientation did not modulate induced gamma responses in adults with autism or WS. No significant group differences were reported for evoked power. A recent study by Sun et al. [53] also examined gamma activity in response to Mooney faces in 13 adults with autism and 16 typically developing adults using MEG. Adults with autism exhibited diminished phase locking factor (PLF) and induced gamma activity relative to comparison adults. Both of these studies reported diminished induced gamma activity in adults with autism in response to Mooney faces.
Similar to Mooney faces, Kanizsa figures require illusory perceptual closure. Three studies, one of which included a repetitive transcranial magnetic stimulation (rTMS) component, have investigated gamma-band activity during the perception of Kanizsa figures in autism [54-56]. While these three EEG studies utilized Kanizsa figures, the stimuli and tasks differed. Brown et al. [54] utilized stimuli consisting of a rectangle of five circles by five circles with a missing 90° segment in each circle, which created stimuli with the presence or absence of a Kanizsa rectangle within the resulting pattern. Participants in this study, 6 adolescents with autism and 8 adolescents with moderate learning difficulties, were required to press a button when they perceived the Kanizsa rectangle and another button when they did not. Sokhadze et al. [55] utilized a modified oddball task consisting of Kanizsa square targets, Kanizsa triangle non-targets, and non-Kanizsa (both square and triangle) standards. Participants pressed buttons only for target stimuli. The third study, Stroganova et al. [56], 23 children with autism and 23 typically developing children passively viewed Kanizsa squares and non-Kanizsa squares.
Both the Brown et al. [54] and Sokhadze et al. [55] studies reported increased induced gamma activity in adolescents with autism compared with control subjects. In contrast to these two studies, Stroganova et al. [56] reported reductions of gamma activity in response to Kanizsa figures in children with autism. These findings were for evoked rather than induced activity, however. Further, the passive nature of the task may have reduced attention demands on participants. In the auditory domain, evoked gamma is reduced in autism (see below).
Gamma-band responses to auditory stimuli in autism
Auditory stimuli can produce at least two types of gamma frequency responses. The first is an early, obligatory gamma-band response to any sound stimulus peaking 30-100 ms post-stimulus [57]. The second is produced by auditory stimuli that are amplitude-modulated using rates in the range of the gamma-band. These types of stimuli produce an early transient response and a later driving response called the auditory steady-state response (ASSR, see Figure 2). Modulation rates of 40 Hz produce the most robust responses [58]. Both auditory responses are phase-locked (i.e., evoked) in typically developing individuals.
Wilson et al. [59] were first to report changes in gamma-band responses elicited by auditory stimuli in autism. Using MEG, they observed reduced ASSR in 10 children and adolescents with autism compared with 10 control children. This effect was more pronounced in the left hemisphere. Reduced early auditory gamma-band evoked power has also been reported in children and adults with autism [21]. Reduced early gamma-band phase-locking as measured by the PLF has been reported for both children and adults with autism [21,60,61] in MEG studies. Finally, both the early auditory gamma-band response and the ASSR have been reported to be impaired in unaffected first-degree relatives of persons with autism, suggesting that these findings might be useful as endophenotypes [21,62].
An MEG study by Edgar et al. [61] recently reported increased pre-stimulus baseline abnormalities, including increased gamma-band power, in autism that were correlated to post-stimulus changes in averaged evoked magnetic fields. Using pure tone stimuli to examine auditory gamma-band power in 105 children with autism and 36 typically developing controls, they reported that pre-stimulus total power (induced + evoked) was higher in all frequency bands for auditory sources in both the left and the right superior temporal gyrus. Pre-stimulus total power was correlated with the M100 averaged evoked response latency (longer latency associated with higher baseline power). Post-stimulus transient gamma-band power and phase-locking were not reported to be correlated with baseline power, however, even though reduced transient gamma response power and phase-locking were observed in the sample [61]. This is an important issue, because previous reports have not observed higher pre-stimulus power in autism samples using much smaller sample sizes [21,59,62]. Because post-stimulus gamma-band power is most often expressed relative to pre-stimulus levels (e.g., as a ratio or percentage), increased pre-stimulus power in autism could lead to an apparent decrease in baseline normalized post-stimulus power. Given that spontaneous high-frequency activity appears higher in some autism studies, research of stimulus-related changes should report baseline power group comparisons so that clear interpretations can be formed.
Higher-order cognitive studies of gamma-band in autism
Face perception
Recognition of faces is impaired in autism [63]. Three MEG studies have investigated gamma responses in adolescents with autism during tasks requiring participants to view faces [64-66]. Wright et al. [65] and Khan et al. [66] both included a task that involved viewing faces relative to a baseline condition. Wright et al. [65] observed diminished induced gamma responses in 13 adolescents with autism, peaking in the right occipital cortex, relative to 12 typically developing adolescents for emotional face stimuli relative to a fixation point.
Using MEG, Khan et al. [66] included 17 adolescents with autism and 20 typically developing adolescents. In this study, emotional face stimuli were compared to a house stimulus baseline condition rather than a fixation point. Khan et al. [66] investigated coherence between the fusiform gyrus and the rest of the cortex as well as a measure of nesting oscillations between alpha and gamma activity through phase-amplitude coupling (PAC) within the fusiform gyrus. Fusiform activity was estimated using source localization techniques. While these authors observed no group differences in long-range functional connectivity in the gamma range, they did observe diminished PAC between alpha and gamma activity for the emotional face stimuli within the fusiform gyrus in adolescents with autism relative to comparison individuals. Furthermore, statistical classification using both local and long-range connectivity measures identified autism diagnosis with 87% sensitivity, 95% specificity, and 90% accuracy.
Richard et al. [64] also utilized face stimuli to probe MEG gamma responses in 10 adolescents with autism and 8 typically developing adolescents. However, the face stimuli in this study were presented in a gaze-cueing task, in which participants had to respond if the face was looking at a peripheral target. Group differences were measured for eyes-averted faces relative to a direct-gaze face condition. Analyses, which were restricted to evoked gamma over posterior sensors and induced activity over frontal sensors based on a priori hypotheses, demonstrated significantly diminished induced gamma over frontal sensors in adolescents with autism relative to typically developing subjects. Similar to Wright et al. [65], this study observed reduced induced gamma band in autism, although in the former this effect was observed in the occipital cortex rather than the frontal cortices. In addition, this study observed enhanced evoked activity that approached significance, while Wright et al. [65] did not observe significant group differences in evoked activity.
Language studies
Only three studies to date, all using MEG, have investigated gamma band responses to language stimuli in adults with autism. In the first, Braeutigam et al. [67] examined responses to reading meaningful sentences relative to sentences ending with a semantically incongruous word in 11 adults with autism and 11 typically developing adults. While it was reported that adults with autism exhibited a different temporal pattern of evoked responses to congruous sentences, longer lasting evoked responses to incongruous sentences, and longer lasting induced gamma oscillations for both congruous and incongruous sentences, no direct group comparisons were undertaken. This sustained pattern of synchronization was suggested to indicate overly generalized activity that could prevent information processing. However, without direct statistical group comparisons, conclusions regarding atypical gamma activity in autism during visual language processing cannot be made.
Buard et al. [68] recently used MEG to examine gamma-band activity in adults with autism compared with control adults and parents of children with autism during a picture naming task. The autism subjects exhibited diminished evoked gamma activity relative to controls localized to the left inferior frontal gyrus based on MEG source analysis. In contrast, parents of children with autism exhibited higher evoked gamma. In this study, neither the parents nor the autism subjects differed in their performance on a picture-naming task conducted outside the MEG scanner, which may mean that gamma-band oscillations are not necessary for this type of task performance, or that these groups were behaviorally well adjusted for their neurophysiological anomalies. A similar finding of increased gamma-band power in parents of children with autism was found in a third MEG study of word recognition with stimuli presented in the auditory rather than visual modality [69], suggesting a potential compensatory mechanism.
Gamma-band activity in infants at risk for autism
Significant progress has been made towards the recording of quality EEG and MEG data in infants and young children, resulting in new studies of those at increased familial risk for autism. Two studies have been reported on infant siblings of persons with autism that include gamma-band measures. In the first, Elsabbagh et al. [70] measured EEG responses to direct versus averted eye-gaze in 19 infant siblings of older children diagnosed with autism compared with 17 control infants. Direct eye-gaze was reported to produce higher induced gamma-band in the control group than in the high-risk group. No differences were observed for evoked gamma.
A recent longitudinal EEG study of resting spectral power was conducted in infant siblings of individuals with autism [71]. EEG data were acquired at 3-month intervals between 6 and 24 months of age on 65 infants at higher-risk for autism (those with diagnosed older siblings) and compared with data from 57 infants with no family history of autism. The authors observed that gamma power in the low risk sample was initially higher and gradually decreased over the course of the study, but that gamma power in the high-risk group was initially lower and changed little from 6 to 24 months of age. The Tierney et al. [71] gamma-band findings remained significant after excluding 4 individuals meeting diagnostic criteria for autism at the end of the study, suggesting the value of gamma as an endophenotype for autism.
Clinical correlates of gamma-band changes in autism
Correlations between gamma-band metrics and autism symptoms have been reported in some studies. Maxwell et al. [41] reported an inverse correlation between right lateral resting gamma-band power and a measure of social reciprocity, the Social Responsiveness Scale [72]. Another study also observed the inverse relationship between SRS and gamma-band power for stimulus-related changes, in this case both for the transient and steady-state auditory evoked responses [62]. Although Cornew et al. [38] observed positive relationships between anterior temporal and parietal alpha power and the SRS, there was not a significant association between resting gamma-band power and the SRS in their study. In the van Hecke et al. [42] paper reporting positive effects of behavioral treatment on gamma-band power, gamma-band changes were also found to be associated with changes in behavioral measures. Significant correlations were seen between gamma asymmetry values and behavioral measures, such that higher Test of Adolescent Social Skills Knowledge and Quality of Socialization Questionnaire – Revised [43] contact scores were related to more dominant left hemisphere gamma asymmetry. In contrast, lower SRS scores were related to increased left hemisphere asymmetry. Adolescents that exhibited greater relational skills, more social contacts, and fewer autism symptoms following the intervention also were found to exhibit a greater degree of left hemisphere asymmetry in the gamma band.
Aside from gamma-band power, higher order measures such as signal complexity and regional connectivity have shown associations with symptoms in some investigations. For example, Ghanbari et al. [73] reported that a measure of resting gamma-band signal complexity was positively associated with the SRS in MEG sensors over the posterior midline of the head, implying that higher complexity is associated with higher levels of abnormal social behaviors. Complexity is a measure of the richness of the EEG or MEG in terms of the number of patterns or irregularity found within it. Khan et al. [66] reported that alpha- to gamma-band phase amplitude coupling was correlated with the social subscale of the Autism Diagnostic Observation Schedule [74], with reduced coupling associated with more severe ADOS scores. Furthermore, the phase-amplitude coupling, combined with other long-range connectivity metrics, had 87% sensitivity, 95% specificity, and 90% overall diagnostic accuracy.
Associations between language and communication measures and gamma-band measures have also been observed. In typically-developing young children, gamma-band power has shown to be correlated with language skills [75]. Edgar et al. [61] recently observed that early transient MEG gamma band response evoked power in the left hemisphere was correlated with the CELF-4 Core Language Index, while in the right hemisphere, pre-stimulus 30-50 Hz gamma-band total power was inversely correlated with the same measure. In an MEG study examining parents of children with autism, another study observed that post-stimulus gamma-band evoked power from both hemispheres was correlated inversely with the Autism Spectrum Quotient [76] communication subscale [62]. A study of emotion perception in faces also reported that scores on the AQ negatively predicted both induced and evoked MEG gamma activity, although a stronger association was found for induced gamma [65].
Although we are not aware of a compelling reason to predict a relationship between IQ and gamma-band measures, the question of whether IQ is correlated with gamma-band metrics is important because general cognitive ability is often negatively impacted in autism. Further complicating autism studies, IQ is a difficult variable to match between autism and control groups. There do not appear to be strong relationships between gamma-band power and IQ. Several studies have reported non-significant results for correlations between IQ and evoked or induced gamma-band measures [49,59,62,65]. Orekhova et al. [33], however, reported that spontaneous gamma-band activity was correlated with an IQ-derived measure of developmental delay in a resting state EEG study. Although there is not strong evidence for a relationship between gamma-band power and IQ, it should continue to be assessed in research studies as a potential confound. Future studies could also consider adding additional comparison subjects such as an IQ-matched idiopathic developmental disability group.
Putative mechanisms of gamma-band abnormality in autism
The mechanisms of spontaneous gamma-band oscillations in the cortex and hippocampus are reasonably well understood. Pyramidal glutamatergic input to fast-GABAergic interneurons results in recurrent inhibition of pyramidal, in turn synchronizing pyramidal cell output into the gamma-band range [35,77]. Reduced interneuron cell numbers is a common finding in animal models of autism [78]. It is therefore tempting to speculate that GABAergic deficits represent a common molecular pathway impacted across multiple autism etiologies. Indeed, there is also human imaging evidence for reduced GABA concentration in frontal, motor and auditory cortices [22,79,80].
It is unclear why GABA concentration is reduced in autism. Clearly, a reduction in the number of interneurons could explain the finding. Another possibility is that glutamate decarboxylase (GAD), the enzyme that converts glutamate to GABA within interneurons, is dysfunctional. Studies have found reduced GAD expression in various brain regions in post-mortem autism samples [81,82]. Reduced GAD expression also predicts higher glutamate levels, which have also been found in autism both in blood [83,84] and non-invasively in the brain [85-87]. Recent studies have observed that auditory GABA is also reduced in unaffected siblings of individuals with autism, paralleling the auditory gamma-band results, suggesting a possible relationship between the two markers [22]. Although this correlation has not been established yet in an autism sample, in healthy adults there is an association between visual gamma-band activity and the concentration of GABA in the cerebral cortex [88]. Future efforts should measure glutamate and GABA levels in conjunction with gamma-band metrics in autism to explore this relationship.
Implications for Autism Treatment Development
Given the potential relationship between gamma-band and major excitatory/inhibitory neurotransmitters, gamma-band metrics might be useful as surrogate markers in the assessment of interventions. A recent study indicated some potential for metabotropic glutamate receptor antagonists in remediation of gamma-band phase-locking deficits in a pre-clinical mouse model of autism [60]. This suggests that using electrophysiology in clinical trials may be useful in the prediction of response to treatment and possibly also as an outcome measure related to cortical excitability.
Indicative of this potential, two EEG studies have investigated gamma-band measures before and after a human clinical intervention, one behavioral and the other an rTMS intervention [42,55]. Both studies reported reductions in induced gamma-band activity that were more pronounced in the right hemisphere, resulting in “normalization” of gamma activity in participants with autism. The reduction of activation in the right hemisphere may be important because right-hemisphere EEG activity is sometimes associated with negative affective styles or behavioral inhibition, while the left is associated more with positive, or approach behaviors [89]. Although the studies that have described positive and negative affective styles associated with EEG power are largely based on the alpha-band, Van Hecke et al. [42] found the behavioral treatment response was specific for gamma-band frequencies. Both the rTMS and behavioral studies also reported correlations with these reductions that reflected improvements in clinical symptomology. Together, these studies suggest that interventions can impact atypical high-frequency neuronal oscillatory activity, and that such interventions are also associated with clinical improvement. Future studies will be needed to confirm these reports in much larger samples and using tighter sham/placebo controls. To date, no studies of pharmacological interventions have incorporated gamma-band measures.
Summary and Limitations
Despite differences in the specific measures employed (evoked vs. induced, early vs. late) and task, most stimulus-related gamma-band studies in autism have reported reduced gamma compared with controls. In visual studies, the type of stimulus (Face type stimuli vs. illusory non-face stimuli) may be important in determining whether gamma is lower (faces) or higher (non-faces) in autism. In approximately half of resting gamma-band studies, reduced gamma is found in autism, while the remaining studies find increased gamma power in autism. Differences between resting gamma studies might be reconciled by attention to variables such as age, but also by careful attention to the state of alertness under which EEG or MEG data are acquired.
Most, if not all, gamma-band alterations are unlikely to be specific to autism. For example, diminished gamma power is also seen in schizophrenia [90], bipolar disorder [91], and ADHD [92]. Therefore, gamma-band measures most likely will not yield diagnostically relevant biomarkers when used in isolation. This suggests that multivariate analysis involving a panel of biomarkers may provide a more relevant diagnostic biomarker. The greater value for gamma-band findings in autism at present is their utility in revealing potential neurophysiological mechanisms that might be common final pathway for multiple etiologies, and potential for use in designing clinical trials.
Developmental trajectories for gamma-band remain poorly understood and this will be a key for future studies of early risk for autism and in clinical trials utilizing children. Gamma activity of various types has been shown to exhibit age-related maturational change, which further studies will need to investigate [93-97]. No studies have yet examined gamma-band development specifically in subjects with autism, but there is evidence suggestive of differential development in those at higher risk for autism. As discussed in the previous section on infants at risk, Tierney et al. [71] reported that in the high-risk group, resting gamma-band power did not exhibit significant change over the period of 6-24 months, while low-risk infants exhibited significant reductions in gamma-band power. It is expected that such changes over development may be found to account for some of the current variability in findings across studies.
Addressing the heterogeneity of the autism spectrum through the inclusion of more phenotypically homogenous subgroups into investigations may also prove fruitful. For example, almost all studies to date have included only high functioning individuals with autism, so it is unclear whether the observed deficits apply equally well to lower functioning individuals. This is a critical gap in the development of gamma activity as a biomarker in autism.
Future studies of gamma-band and other spectral abnormalities could also benefit from combination with other imaging modalities. Work combining measurements from proton magnetic resonance spectroscopy (1H-MRS), fMRI and MEG have shown that the gamma-band frequency and fMRI BOLD amplitudes are correlated with GABA concentration in the visual cortex [88]. The simultaneous measurement of multiple technologies, including EEG and fMRI, EEG or MEG and near infrared spectroscopy, MEG and EEG, etc. will also be beneficial. Structure and function correlation should also be examined using datasets containing anatomical MRI and EEG or MEG information.
Most stimulus-related EEG and MEG studies of gamma-band in autism have focused on gamma, but future efforts should include examination of other spectral effects as well. In spontaneous EEG and MEG studies, this is already the case, although many electrophysiology studies include lower frequencies but exclude gamma-band. For stimulus related studies, there are frequency coupling effects that are worth examining [66]. It is increasingly evident that spectral bands have important interactions with each other, such as the well-known phase-amplitude coupling between alpha or theta phase and gamma-band power [98]. Further, such coupling is now known to change in child and adolescent development [97].
Finally, there are issues related to methodology for future research to address. Replications involving consistent tasks and analyses will be needed to make more generalizable statements regarding gamma-band activity in autism. In addition, standard terminology regarding gamma-band activity is encouraged. For stimulus-related gamma studies, we encourage the explicit description in the method descriptions of whether averaging is done in the time or frequency domain and whether some attempt to subtract evoked power was performed. An example of a clear description is found in Stroganova et al. [56]. In addition, a measure of inter-trial phase-locking should be provided for readers to make distinctions between phase-locked and non-phase-locked components of the gamma-band response in studies of induced power. It remains unclear whether or the evoked versus induced distinction is important for autism studies, despite the great importance placed on that distinction in the cognitive neuroscience literature. Future studies should also be guided by recent best-practice standards for the acquisition and analysis of EEG and MEG data in autism samples [99].
Future perspectives
Studies of high-frequency oscillations in autism are accelerating at a rapid pace. The assessment gamma-band as a risk biomarker in infancy is an exciting new direction for the field. The outcome of these studies in terms of prediction of outcome should be clear in the next few years. In the next decade, large scale, multi-site clinical trials of behavioral, brain stimulation and pharmaceutical interventions will likely be reported using gamma-band measures as surrogate markers of sensory and cognitive deficits. Finally, the next decade of research should clarify the genetic and molecular underpinnings of gamma-band deficits in autism.
Executive summary
| Executive Summary |
|---|
| Autism is a complex neurodevelopmental disorder |
|
| Gamma-band responses are impaired in autism |
|
| Studies of spontaneous gamma-band activity show inconsistent findings |
|
| Studies of visual stimulus related gamma generally show reduced gamma-band power in autism |
|
| Studies of auditory stimulus related gamma find reduced gamma-band power and/or phaselocking in autism |
|
| Gamma-band measures are correlated with clinical measures of symptom severity in autism |
|
| Gamma-band deficits may be related to changes in amino-acid neurotransmitters in autism |
|
| Conclusions |
|
Acknowledgments
Funds for the preparation of this manuscript were provided by the United States National Institutes of Health grants MH082820, MH015442 and HD041697.
Footnotes
Financial Disclosure: The authors declare that they have no financial conflicts of interest related to this manuscript.
References
- 1.Wang J, Barstein J, Ethridge LE, Mosconi MW, Takarae Y, Sweeney JA. Resting state EEG abnormalities in autism spectrum disorders. J Neurodevelop Disord. 2013;5(1):24. doi: 10.1186/1866-1955-5-24. [DOI] [PMC free article] [PubMed] [Google Scholar]
- 2.World Health Organization. The ICD-10 classification of mental and behavioural disorders: clinical descriptions and diagnostic guidelines. Geneva: World Health Organization; [Google Scholar]
- 3.Association AP. Diagnostic and statistical manual of mental disorders. 5. American Psychiatric Association; Arlington VA: [Google Scholar]
- 4.Centers for Disease Control and Prevention. Prevalence of autism spectrum disorders — Autism and Developmental Disabilities Monitoring Network 14 Sites United States 2008. MMWR. 2012;61(SS03):1–19. [PubMed] [Google Scholar]
- 5.Elsabbagh M, Divan G, Koh YJ, et al. Global prevalence of autism and other pervasive developmental disorders. Autism Res. 2012;5(3):160–179. doi: 10.1002/aur.239. [DOI] [PMC free article] [PubMed] [Google Scholar]
- 6.Fombonne E. Epidemiological surveys of autism and other pervasive developmental disorders: an update. J Autism Dev Disord. 2003;33(4):365–382. doi: 10.1023/a:1025054610557. [DOI] [PubMed] [Google Scholar]
- 7.Whiteley P, Todd L, Carr K, Shattock P. Gender ratios in autism, asperger syndrome, and autism spectrum disorder. Autism Insights. 2010;2:17–24. [Google Scholar]
- 8.Newschaffer CJ, Croen LA, Daniels J, et al. The epidemiology of autism spectrum disorders. Annu Rev Public Health. 2006;28:235–258. doi: 10.1146/annurev.publhealth.28.021406.144007. [DOI] [PubMed] [Google Scholar]
- 9.Bailey A, Le Couteur A, Gottesman I, et al. Autism as a strongly genetic disorder: evidence from a British twin study. Psychol Med. 1995;25(1):63–77. doi: 10.1017/s0033291700028099. [DOI] [PubMed] [Google Scholar]
- 10.Rutter M, Silberg J, O'Connor T, Simonoff E. Genetics and child psychiatry: II Empirical research findings. J Child Psychol Psychiatry. 1999;40(1):19–55. [PubMed] [Google Scholar]
- 11.Constantino JN, Zhang Y, Frazier T, Abbacchi AM, Law P. Sibling recurrence and the genetic epidemiology of autism. Am J Psychiatry. 2010;167(11):1349–1356. doi: 10.1176/appi.ajp.2010.09101470. [DOI] [PMC free article] [PubMed] [Google Scholar]
- 12.Ozonoff S, Young GS, Carter A, et al. Recurrence risk for autism spectrum disorders: a baby siblings research consortium study. Pediatrics. 2011;128:e488–495. doi: 10.1542/peds.2010-2825. [DOI] [PMC free article] [PubMed] [Google Scholar]
- 13.Betancur C. Etiological heterogeneity in autism spectrum disorders: more than 100 genetic and genomic disorders and still counting. Brain Res. 2011;1380:42–77. doi: 10.1016/j.brainres.2010.11.078. [DOI] [PubMed] [Google Scholar]
- 14.Miles JH. Autism spectrum disorders—A genetics review. Genet Med. 2011;13(4):278–294. doi: 10.1097/GIM.0b013e3181ff67ba. [DOI] [PubMed] [Google Scholar]
- 15.Skafidas E, Testa R, Zantomio D, Chana G, Everall IP, Pantelis C. Predicting the diagnosis of autism spectrum disorder using gene pathway analysis. Mol Psychiatry. 2012:1–7. doi: 10.1038/mp.2012.126. [DOI] [PMC free article] [PubMed] [Google Scholar]
- 16.Robinson EB, Howrigan D, Yang J et al. Predicting the diagnosis of autism spectrum disorder using gene pathway analysis. Mol Psychiatry. 2013:1–3. doi: 10.1038/mp.2013.125. [DOI] [PMC free article] [PubMed] [Google Scholar]
- 17.Abramson RK, Wright HH, Carpenter R, et al. Elevated blood serotonin in autistic probands and their first-degree relatives. J Autism Dev Disord. 1989;19(3):397–407. doi: 10.1007/BF02212938. [DOI] [PubMed] [Google Scholar]
- 18.Piven J, Tsai GC, Nehme E, Coyle JT, Chase GA, Folstein SE. Platelet serotonin, a possible marker for familial autism. J Autism Dev Disord. 1991;21(1):51–59. doi: 10.1007/BF02206997. [DOI] [PubMed] [Google Scholar]
- 19.Bosl W, Tierney A, Tager-Flusberg H, Nelson C. EEG complexity as a biomarker for autism spectrum disorder risk. BMC Medicine. 2011;9(1):18. doi: 10.1186/1741-7015-9-18. [DOI] [PMC free article] [PubMed] [Google Scholar]
- 20.Mosconi MW, Kay M, D'Cruz AM, et al. Neurobehavioral abnormalities in first-degree relatives of individuals with autism. Arch Gen Psychiatry. 2010;67(8):830–840. doi: 10.1001/archgenpsychiatry.2010.87. [DOI] [PMC free article] [PubMed] [Google Scholar]
- 21.Rojas D, Maharajh K, Teale P, Rogers S. Reduced neural synchronization of gamma-band MEG oscillations in first-degree relatives of children with autism. BMC Psychiatry. 2008;8(1):66. doi: 10.1186/1471-244X-8-66. [DOI] [PMC free article] [PubMed] [Google Scholar]
- 22.Rojas DC, Singel D, Steinmetz S, Hepburn S, Brown MS. Decreased left perisylvian GABA concentration in children with autism and unaffected siblings. NeuroImage. 2013 doi: 10.1016/j.neuroimage.2013.01.045. [DOI] [PMC free article] [PubMed] [Google Scholar]
- 23.Wolff JJ, Gu H, Gerig G, et al. Differences in white matter fiber tract development present from 6 to 24 months in infants with autism. Am J Psychiatry. 2012;169(6):589–600. doi: 10.1176/appi.ajp.2011.11091447. [DOI] [PMC free article] [PubMed] [Google Scholar]
- 24.Abrahams BS, Geschwind DH. Advances in autism genetics: on the threshold of a new neurobiology. Nat Rev Genet. 2008;9(5):341–355. doi: 10.1038/nrg2346. [DOI] [PMC free article] [PubMed] [Google Scholar]
- 25.Gottesman II, Gould TD. The endophenotype concept in psychiatry: etymology and strategic intentions. American Journal of Psychiatry. 2003;160(4):636–645. doi: 10.1176/appi.ajp.160.4.636. [DOI] [PubMed] [Google Scholar]
- 26.Persico AM, Sacco R. Endophenotypes in Autism Spectrum Disorders. Springer New York; New York, NY: 2014. pp. 77–95. [Google Scholar]
- 27.Hämäläinen M, Hari R, Ilmoniemi RJ, Knuutila J, Lounasmaa OV. Magnetoencephalography—theory, instrumentation, and applications to noninvasive studies of the working human brain. Reviews of modern Physics. 1993;65(2):413. [Google Scholar]
- 28.Tallon-Baudry C, Bertrand O, Delpuech C, Pernier J. Stimulus specificity of phase-locked and non-phase-locked 40 Hz visual responses in human. J Neurosci. 1996;16(13):4240–4249. doi: 10.1523/JNEUROSCI.16-13-04240.1996. [DOI] [PMC free article] [PubMed] [Google Scholar]
- 29.Ray S, Maunsell JHR. Different Origins of Gamma Rhythm and High-Gamma Activity in Macaque Visual Cortex. PLoS Biol. 2011;9(4):e1000610. doi: 10.1371/journal.pbio.1000610. [DOI] [PMC free article] [PubMed] [Google Scholar]
- 30.Buzsáki G, da Silva FL. High frequency oscillations in the intact brain. Prog Neurobiol. 2012:1–9. doi: 10.1016/j.pneurobio.2012.02.004. [DOI] [PMC free article] [PubMed] [Google Scholar]
- 31.Bragin A, Engel J, Wilson CL, Fried I, Mathern GW. Hippocampal and entorhinal cortex high-frequency oscillations (100--500 Hz) in human epileptic brain and in kainic acid--treated rats with chronic seizures. Epilepsia. 1999;40(2):127–137. doi: 10.1111/j.1528-1157.1999.tb02065.x. [DOI] [PubMed] [Google Scholar]
- 32.Tuchman R, Cuccaro M, Alessandri M. Autism and epilepsy: Historical perspective. Brain and Development. 2010;32(9):709–718. doi: 10.1016/j.braindev.2010.04.008. [DOI] [PubMed] [Google Scholar]
- 33.Orekhova EV, Stroganova TA, Nygren G et al. Excess of High Frequency Electroencephalogram Oscillations in Boys with Autism. Biological Psychiatry [Internet] 2007;62(9):1022–1029. doi: 10.1016/j.biopsych.2006.12.029. Available from: http://www.ncbi.nlm.nih.gov/entrez/query.fcgi?cmd=Retrieve&db=PubMed&dopt=Citation&list_uids=17543897. [DOI] [PubMed] [Google Scholar]
- 34.Orekhova EV, Stroganova TA, Prokofyev AO, Nygren G, Gillberg C, Elam M. Sensory gating in young children with autism: relation to age, IQ, and EEG gamma oscillations. Neuroscience Letters. 2008;434(2):218–223. doi: 10.1016/j.neulet.2008.01.066. [DOI] [PubMed] [Google Scholar]
- 35.Bartos M, Vida I, Jonas P. Synaptic mechanisms of synchronized gamma oscillations in inhibitory interneuron networks. Nat Rev Neurosci. 2007;8(1):45–56. doi: 10.1038/nrn2044. [DOI] [PubMed] [Google Scholar]
- 36.Tregellas JR. Neuroimaging Biomarkers for Early Drug Development in Schizophrenia. Biological Psychiatry. 2013 doi: 10.1016/j.biopsych.2013.08.025. [DOI] [PMC free article] [PubMed] [Google Scholar]
- 37.Machado C, Estevez M, Leisman G et al. QEEG Spectral and Coherence Assessment of Autistic Children in Three Different Experimental Conditions. J Autism Dev Disord. 2013 doi: 10.1007/s10803-013-1909-5. [DOI] [PMC free article] [PubMed] [Google Scholar]
- 38.Cornew L, Roberts TPL, Blaskey L, Edgar JC. Resting-State Oscillatory Activity in Autism Spectrum Disorders. J Autism Dev Disord [Internet] 2011;42(9):1884–1894. doi: 10.1007/s10803-011-1431-6. Available from: http://www.springerlink.com/index/10.1007/s10803-011-1431-6. [DOI] [PMC free article] [PubMed] [Google Scholar]
- 39.Sheikhani A, Behnam H, Noroozian M, Mohammadi MR, Mohammadi M. Abnormalities of quantitative electroencephalography in children with Asperger disorder in various conditions. Research in Autism Spectrum Disorders. 2009;3(2):538–546. [Google Scholar]
- 40.Sheikhani A, Behnam H, Mohammadi MR, Noroozian M, Mohammadi M. Detection of abnormalities for diagnosing of children with autism disorders using of quantitative electroencephalography analysis. J Med Syst. 2012;36(2):957–963. doi: 10.1007/s10916-010-9560-6. [DOI] [PubMed] [Google Scholar]
- 41.Maxwell CR, Villalobos ME, Schultz RT, Herpertz-Dahlmann B, Konrad K, Kohls G. Atypical Laterality of Resting Gamma Oscillations in Autism Spectrum Disorders. J Autism Dev Disord. 2013 doi: 10.1007/s10803-013-1842-7. [DOI] [PMC free article] [PubMed] [Google Scholar]
- 42.Van Hecke AV, Stevens S, Carson AM et al. Measuring the Plasticity of Social Approach: A Randomized Controlled Trial of the Effects of the PEERS Intervention on EEG Asymmetry in Adolescents with Autism Spectrum Disorders. J Autism Dev Disord. 2013 doi: 10.1007/s10803-013-1883-y. [DOI] [PubMed] [Google Scholar]
- 43.Laugeson EA, Frankel F, Gantman A, Dillon AR, Mogil C. Evidence-based social skills training for adolescents with autism spectrum disorders: the UCLA PEERS program. J Autism Dev Disord. 2012;42(6):1025–1036. doi: 10.1007/s10803-011-1339-1. [DOI] [PubMed] [Google Scholar]
- 44.Tallon-Baudry C, Bertrand O. Oscillatory gamma activity in humans and its role in object representation. Trends in Cognitive Sciences. 1999;3(4):151–162. doi: 10.1016/s1364-6613(99)01299-1. [DOI] [PubMed] [Google Scholar]
- 45.Singer W. Neuronal synchrony: a versatile code for the definition of relations? Neuron. 1999;24(1):49-65–111-25. doi: 10.1016/s0896-6273(00)80821-1. [DOI] [PubMed] [Google Scholar]
- 46.Kumar SL. Examining the characteristics of visuospatial information processing in individuals with high-functioning autism. Yale J Biol Med. 2013;86(2):147–156. [PMC free article] [PubMed] [Google Scholar]
- 47.Fredericksen RE, Bex PJ, Verstraten FA. How big is a Gabor patch, and why should we care? J Opt Soc Am A Opt Image Sci Vis. 1997;14(1):1–12. doi: 10.1364/josaa.14.000001. [DOI] [PubMed] [Google Scholar]
- 48.Gieselmann MA, Thiele A. Comparison of spatial integration and surround suppression characteristics in spiking activity and the local field potential in macaque V1. Eur J Neurosci. 2008;28(3):447–459. doi: 10.1111/j.1460-9568.2008.06358.x. [DOI] [PubMed] [Google Scholar]
- 49.Milne E, Scope A, Pascalis O, Buckley D, Makeig S. Independent component analysis reveals atypical electroencephalographic activity during visual perception in individuals with autism. Biological Psychiatry. 2009;65(1):22–30. doi: 10.1016/j.biopsych.2008.07.017. [DOI] [PubMed] [Google Scholar]
- 50.Snijders TM, Milivojevic B, Kemner C. Atypical excitation-inhibition balance in autism captured by the gamma response to contextual modulation. NeuroImage: Clinical [Internet] 2013 doi: 10.1016/j.nicl.2013.06.015. Available from: http://www.sciencedirect.com/science/article/pii/S2213158213000831. [DOI] [PMC free article] [PubMed]
- 51.Grice SJ, Spratling MW, Karmiloff-Smith A, et al. Disordered visual processing and oscillatory brain activity in autism and Williams syndrome. NeuroReport. 2001;12(12):2697–2700. doi: 10.1097/00001756-200108280-00021. [DOI] [PubMed] [Google Scholar]
- 52.Rodriguez E, George N, Lachaux JP, Martinerie J, Renault B, Varela FJ. Perception's shadow: long-distance synchronization of human brain activity. Nature. 1999;397(6718):430–433. doi: 10.1038/17120. [DOI] [PubMed] [Google Scholar]
- 53.Sun L, Grutzner C, Bolte S et al. Impaired Gamma-Band Activity during Perceptual Organization in Adults with Autism Spectrum Disorders: Evidence for Dysfunctional Network Activity in Frontal-Posterior Cortices. Journal of Neuroscience [Internet] 2012;32(28):9563–9573. doi: 10.1523/JNEUROSCI.1073-12.2012. Available from: http://www.ncbi.nlm.nih.gov/entrez/query.fcgi?cmd=Retrieve&db=PubMed&dopt=Citation&list_uids=22787042. [DOI] [PMC free article] [PubMed] [Google Scholar]
- 54.Brown C, Gruber T, Boucher J, Rippon G, Brock J. Gamma abnormalities during perception of illusory figures in autism. Cortex. 2005;41(3):364–376. doi: 10.1016/s0010-9452(08)70273-9. [DOI] [PubMed] [Google Scholar]
- 55.Sokhadze EM, El-Baz A, Baruth J, Mathai G, Sears L, Casanova MF. Effects of low frequency repetitive transcranial magnetic stimulation (rTMS) on gamma frequency oscillations and event-related potentials during processing of illusory figures in autism. J Autism Dev Disord. 2008;39(4):619–634. doi: 10.1007/s10803-008-0662-7. [DOI] [PubMed] [Google Scholar]
- 56.Stroganova TA, Orekhova EV, Prokofyev AO, et al. High-frequency oscillatory response to illusory contour in typically developing boys and boys with autism spectrum disorders. Cortex. 2012;48(6):701–717. doi: 10.1016/j.cortex.2011.02.016. [DOI] [PubMed] [Google Scholar]
- 57.Pantev C, Makeig S, Hoke M, Galambos R, Hampson S, Gallen C. Human auditory evoked gamma-band magnetic fields. Proceedings of the National Academy of Sciences. 1991;88(20):8996–9000. doi: 10.1073/pnas.88.20.8996. [DOI] [PMC free article] [PubMed] [Google Scholar]
- 58.Hari R, Hämäläinen M, Joutsiniemi SL. Neuromagnetic steady-state responses to auditory stimuli. J Acoust Soc Am. 1989;86(3):1033–1039. doi: 10.1121/1.398093. [DOI] [PubMed] [Google Scholar]
- 59.Wilson TW, Rojas DC, Reite ML, Teale PD, Rogers SJ. Children and adolescents with autism exhibit reduced MEG steady-state gamma responses. Biological Psychiatry. 2007;62(3):192–197. doi: 10.1016/j.biopsych.2006.07.002. [DOI] [PMC free article] [PubMed] [Google Scholar]
- 60.Gandal MJ, Edgar JC, Ehrlichman RS, Mehta M, Roberts TPL, Siegel SJ. Validating γ oscillations and delayed auditory responses as translational biomarkers of autism. Biological Psychiatry. 2010;68(12):1100–1106. doi: 10.1016/j.biopsych.2010.09.031. [DOI] [PMC free article] [PubMed] [Google Scholar]
- 61.Edgar JC, Khan SY, Blaskey L et al. Neuromagnetic Oscillations Predict Evoked-Response Latency Delays and Core Language Deficits in Autism Spectrum Disorders. J Autism Dev Disord. 2013 doi: 10.1007/s10803-013-1904-x. [DOI] [PMC free article] [PubMed] [Google Scholar]
- 62.Rojas DC, Teale PD, Maharajh K, et al. Transient and steady-state auditory gamma-band responses in first-degree relatives of people with autism spectrum disorder. Mol Autism. 2011;2(1):11. doi: 10.1186/2040-2392-2-11. [DOI] [PMC free article] [PubMed] [Google Scholar]
- 63.Dawson G, Webb SJ, Wijsman E, et al. Neurocognitive and electrophysiological evidence of altered face processing in parents of children with autism: implications for a model of abnormal development of social brain circuitry in autism. Dev Psychopathol. 2005;17(3):679–697. doi: 10.1017/S0954579405050327. [DOI] [PubMed] [Google Scholar]
- 64.Richard AE, Lajiness-O'Neill RR, Bowyer SM. Impaired prefrontal gamma band synchrony in autism spectrum disorders during gaze cueing. NeuroReport. 2013;24(16):894–897. doi: 10.1097/WNR.0000000000000015. [DOI] [PubMed] [Google Scholar]
- 65.Wright B, Alderson-Day B, Prendergast G, et al. Gamma activation in young people with autism spectrum disorders and typically-developing controls when viewing emotions on faces. PLoS ONE. 2012;7(7):e41326. doi: 10.1371/journal.pone.0041326. [DOI] [PMC free article] [PubMed] [Google Scholar]
- 66.Khan S, Gramfort A, Shetty NR, et al. Local and long-range functional connectivity is reduced in concert in autism spectrum disorders. Proc Natl Acad Sci U S A. 2013;110(8):3107–3112. doi: 10.1073/pnas.1214533110. [DOI] [PMC free article] [PubMed] [Google Scholar]
- 67.Braeutigam S, Swithenby SJ, Bailey AJ. Contextual integration the unusual way: a magnetoencephalographic study of responses to semantic violation in individuals with autism spectrum disorders. Eur J Neurosci [Internet] 2008;27(4):1026–1036. doi: 10.1111/j.1460-9568.2008.06064.x. Available from: http://www.ncbi.nlm.nih.gov/entrez/query.fcgi?cmd=Retrieve&db=PubMed&dopt=Citation&list_uids=18333970. [DOI] [PubMed] [Google Scholar]
- 68.Buard I, Rogers SJ, Hepburn S, Kronberg E. Altered oscillation patterns and connectivity during picture naming in autism. Frontiers in Human … [Internet] 2013:1–11. doi: 10.3389/fnhum.2013.00742. Available from: http://www.frontiersin.org/human_neuroscience/10.3389/fnhum.2013.00742/abstract. [DOI] [PMC free article] [PubMed]
- 69.McFadden KL, Hepburn S, Winterrowd E, Schmidt GL, Rojas DC. Abnormalities in gamma-band responses to language stimuli in first-degree relatives of children with autism spectrum disorder: an MEG study. BMC Psychiatry. 2012;12(1):213. doi: 10.1186/1471-244X-12-213. [DOI] [PMC free article] [PubMed] [Google Scholar]
- 70.Elsabbagh M, Volein A, Csibra G, et al. Neural correlates of eye gaze processing in the infant broader autism phenotype. Biological Psychiatry. 2009;65(1):31–38. doi: 10.1016/j.biopsych.2008.09.034. [DOI] [PubMed] [Google Scholar]
- 71.Tierney AL, Gabard-Durnam L, Vogel-Farley V, Tager-Flusberg H, Nelson CA. Developmental Trajectories of Resting EEG Power: An Endophenotype of Autism Spectrum Disorder. PLoS ONE. 2012;7(6):e39127. doi: 10.1371/journal.pone.0039127. [DOI] [PMC free article] [PubMed] [Google Scholar]
- 72.Constantino JN, Davis SA, Todd RD, et al. Validation of a brief quantitative measure of autistic traits: comparison of the social responsiveness scale with the autism diagnostic interview-revised. J Autism Dev Disord. 2003;33(4):427–433. doi: 10.1023/a:1025014929212. [DOI] [PubMed] [Google Scholar]
- 73.Ghanbari Y, Bloy L, Christopher Edgar J, Blaskey L, Verma R, Roberts TPL. Joint Analysis of Band-Specific Functional Connectivity and Signal Complexity in Autism. J Autism Dev Disord. 2013 doi: 10.1007/s10803-013-1915-7. [DOI] [PMC free article] [PubMed] [Google Scholar]
- 74.Lord C, Rutter M, DiLavore PC, Risi S. Autism Diagnostic Observation Schedule-WPS (ADOS-WPS) Western Psychological Services; Los Angeles: [Google Scholar]
- 75.Benasich AA, Gou Z, Choudhury N, Harris KD. Early cognitive and language skills are linked to resting frontal gamma power across the first 3 years. Behav Brain Res. 2008;195(2):215–222. doi: 10.1016/j.bbr.2008.08.049. [DOI] [PMC free article] [PubMed] [Google Scholar]
- 76.Baron-Cohen S, Wheelwright S, Skinner R, Martin J, Clubley E. The autism-spectrum quotient (AQ): Evidence from asperger syndrome/high-functioning autism, malesand females, scientists and mathematicians. J Autism Dev Disord. 2001;31(1):5–17. doi: 10.1023/a:1005653411471. [DOI] [PubMed] [Google Scholar]
- 77.Hájos N, Paulsen O. Network mechanisms of gamma oscillations in the CA3 region of the hippocampus. Neural Netw. 2009;22(8):1113–1119. doi: 10.1016/j.neunet.2009.07.024. [DOI] [PubMed] [Google Scholar]
- 78.Gogolla N, Leblanc JJ, Quast KB, Südhof TC, Fagiolini M, Hensch TK. Common circuit defect of excitatory-inhibitory balance in mouse models of autism. J Neurodevelop Disord. 2009;1(2):172–181. doi: 10.1007/s11689-009-9023-x. [DOI] [PMC free article] [PubMed] [Google Scholar]
- 79.Harada M, Taki MM, Nose A, et al. Non-Invasive Evaluation of the GABAergic/Glutamatergic System in Autistic Patients Observed by MEGA-Editing Proton MR Spectroscopy Using a Clinical 3 Tesla Instrument. J Autism Dev Disord. 2010;41(4):447–454. doi: 10.1007/s10803-010-1065-0. [DOI] [PubMed] [Google Scholar]
- 80.Gaetz W, Bloy L, Wang DJ et al. GABA estimation in the brains of children on the autism spectrum: Measurement precision and regional cortical variation. NeuroImage. 2013 doi: 10.1016/j.neuroimage.2013.05.068. [DOI] [PMC free article] [PubMed] [Google Scholar]
- 81.Fatemi SH, Halt AR, Stary JM, Kanodia R, Schulz SC, Realmuto GR. Glutamic acid decarboxylase 65 and 67 kDa proteins are reduced in autistic parietal and cerebellar cortices. Biological Psychiatry. 2002;52(8):805–810. doi: 10.1016/s0006-3223(02)01430-0. [DOI] [PubMed] [Google Scholar]
- 82.Yip J, Soghomonian JJ, Blatt GJ. Decreased GAD67 mRNA levels in cerebellar Purkinje cells in autism: pathophysiological implications. Acta Neuropathol. 2007;113(5):559–568. doi: 10.1007/s00401-006-0176-3. [DOI] [PubMed] [Google Scholar]
- 83.Shinohe A, Hashimoto K, Nakamura K, et al. Increased serum levels of glutamate in adult patients with autism. Progress in Neuropsychopharmacology & Biological Psychiatry. 2006;30(8):1472–1477. doi: 10.1016/j.pnpbp.2006.06.013. [DOI] [PubMed] [Google Scholar]
- 84.Moreno H, Borjas L, Arrieta A, Saez L. Clinical heterogeneity of the autistic syndrome … [Invest Clin. 1992] -PubMed - NCBI. Investigación …. 1992 [PubMed] [Google Scholar]
- 85.Page LA, Daly E, Schmitz N, et al. In vivo 1H-magnetic resonance spectroscopy study of amygdala-hippocampal and parietal regions in autism. American Journal of Psychiatry. 2006;163(12):2189–2192. doi: 10.1176/appi.ajp.163.12.2189. [DOI] [PubMed] [Google Scholar]
- 86.Joshi G, Biederman J, Wozniak J et al. Magnetic resonance spectroscopy study of the glutamatergic system in adolescent males with high-functioning autistic disorder: a pilot study at 4T. Eur Arch Psychiatry Clin Neurosci. 2012 doi: 10.1007/s00406-012-0369-9. [DOI] [PubMed] [Google Scholar]
- 87.Brown MS, Singel D, Hepburn S, Rojas DC. Increased Glutamate Concentration in the Auditory Cortex of Persons With Autism and First-Degree Relatives: A 1H-MRS Study. Autism Research. 2013;6(1):1–10. doi: 10.1002/aur.1260. [DOI] [PMC free article] [PubMed] [Google Scholar]
- 88.Muthukumaraswamy SD, Edden RAE, Jones DK, Swettenham JB, Singh KD. Resting GABA concentration predicts peak gamma frequency and fMRI amplitude in response to visual stimulation in humans. Proceedings of the National Academy of Sciences. 2009;106(20):8356–8361. doi: 10.1073/pnas.0900728106. [DOI] [PMC free article] [PubMed] [Google Scholar]
- 89.Sutton SK, Davidson RJ. Prefrontal Brain Asymmetry: A Biological Substrate of the Behavioral Approach and Inhibition Systems. Psychological Science. 1997;8(3):204–210. [Google Scholar]
- 90.Uhlhaas PJ. High-frequency oscillations in schizophrenia. Clin EEG Neurosci. 2011;42(2):77–82. doi: 10.1177/155005941104200208. [DOI] [PubMed] [Google Scholar]
- 91.Oda Y, Onitsuka T, Tsuchimoto R, et al. Gamma Band Neural Synchronization Deficits for Auditory Steady State Responses in Bipolar Disorder Patients. PLoS ONE. 2012;7(7):e39955. doi: 10.1371/journal.pone.0039955. [DOI] [PMC free article] [PubMed] [Google Scholar]
- 92.Wilson TW, Wetzel MW, White ML, Knott NL. Gamma-frequency neuronal activity is diminished in adults with attention-deficit/hyperactivity disorder: a pharmaco-MEG study. Journal of Psychopharmacology. 2012;26(6):771–777. doi: 10.1177/0269881111430731. [DOI] [PMC free article] [PubMed] [Google Scholar]
- 93.Yordanova J, Kolev V, Heinrich H, Woerner W, Banaschewski T, Rothenberger A. Developmental event-related gamma oscillations: effects of auditory attention. Eur J Neurosci. 2002;16(11):2214–2224. doi: 10.1046/j.1460-9568.2002.02286.x. [DOI] [PubMed] [Google Scholar]
- 94.Rojas DC, Maharajh K, Teale PD, et al. Development of the 40Hz steady state auditory evoked magnetic field from ages 5 to 52. Clinical Neurophysiology. 2006;117(1):110–117. doi: 10.1016/j.clinph.2005.08.032. [DOI] [PubMed] [Google Scholar]
- 95.Poulsen C, Picton TW, Paus T. Age-Related Changes in Transient and Oscillatory Brain Responses to Auditory Stimulation in Healthy Adults 19-45 Years Old. Cerebral Cortex. 2006;17(6):1454–1467. doi: 10.1093/cercor/bhl056. [DOI] [PubMed] [Google Scholar]
- 96.Werkle-Bergner M, Shing YL, Müller V, Li SC, Lindenberger U. EEG gamma-band synchronization in visual coding from childhood to old age: evidence from evoked power and inter-trial phase locking. Clin Neurophysiol. 2009;120(7):1291–1302. doi: 10.1016/j.clinph.2009.04.012. [DOI] [PubMed] [Google Scholar]
- 97.Cho RY, Walker CP, Polizzotto NR et al. Development of Sensory Gamma Oscillations and Cross-Frequency Coupling from Childhood to Early Adulthood. Cerebral Cortex. 2013 doi: 10.1093/cercor/bht341. [DOI] [PMC free article] [PubMed] [Google Scholar]
- 98.Canolty RT, Edwards E, Dalal SS, et al. High Gamma Power Is Phase-Locked to Theta Oscillations in Human Neocortex. Science. 2006;313(5793):1626–1628. doi: 10.1126/science.1128115. [DOI] [PMC free article] [PubMed] [Google Scholar]
- 99.Webb SJ, Bernier R, Henderson HA et al. Guidelines and Best Practices for Electrophysiological Data Collection, Analysis and Reporting in Autism. J Autism Dev Disord. 2013 doi: 10.1007/s10803-013-1916-6. [DOI] [PMC free article] [PubMed] [Google Scholar]