

Abstract
Ventral pallidal (VP) neurons exhibit rapid phasic firing patterns within seconds of cocaine-reinforced responses. The present investigation examined whether VP neurons exhibited firing rate changes: 1) over minutes during the inter-infusion interval (slow phasic patterns) and/or 2) over the course of the several-hour self-administration session (tonic firing patterns) relative to pre-session firing. Approximately two-thirds (43/54) of VP neurons exhibited slow phasic firing patterns. The most common pattern was a post-infusion decrease in firing followed by a progressive reversal of firing over minutes (51.16%; 22/43). Early reversals were predominantly observed anteriorly while progressive and late reversals were observed more posteriorly. Approximately half (51.85%; 28/54) the neurons exhibited tonic firing patterns consisting of at least a two-fold change in firing. Most cells decreased firing during drug loading, remained low over self-administration maintenance, and reversed following lever removal. Over a whole experiment (tonic) timescale, the majority of neurons exhibited an inverse relationship between calculated drug level and firing rates during loading and post-self-administration behaviors. Fewer neurons exhibited an inverse relationship of calculated drug level and tonic firing rate during self-administration maintenance but, among those that did, nearly all were progressive reversal neurons. The present results show that, similar to its main afferent the nucleus accumbens, VP exhibits both slow phasic and tonic firing patterns during cocaine self-administration. Given that VP neurons are principally GABAergic, the predominant slow phasic decrease and tonic decrease firing patterns within the VP may indicate a disinhibitory influence upon its thalamocortical, mesolimbic, and nigrostriatal targets during cocaine self-administration.
Keywords: striatum, accumbens, striatopallidum, dopamine
Introduction
The mesolimbic system, including the ventral tegmental area (VTA) and nucleus accumbens (NAcc), is essential for reward-seeking behavior. The NAcc integrates dopaminergic projections from the VTA and glutamatergic projections from limbic regions such as the basolateral amygdala (BLA), hippocampus, medial prefrontal cortex (Fuller et al. 1987; Totterdell and Smith, 1989; Brog et al. 1992). The primary target of NAcc neurons is the ventral pallidum (VP) (Heimer and Wilson, 1975; Heimer et al. 1991), which in turn projects to the subthalamic nucleus, dopaminergic mesencephalon, and mediodorsal thalamus (Groenewegen et al. 1993). It is hypothesized that the projection patterns of VP neurons allow the passage of limbic signals projected to NAcc to gain access to regions involved in appetitive behavior (Mogenson et al. 1980). Greater understanding of the neurophysiology of this circuit, especially during cocaine self-administration, might better inform pharmaceutical interventions aimed at perturbing drug-seeking.
Analogous to its main afferent, the VP is necessary for drug-seeking behavior (Hubner and Koob, 1990; Robledo and Koob, 1993; Tang et al. 2005; Rodgers et al. 2008; Torregrossa and Kalivas, 2008; Li et al. 2009; McFarland et al, 2004). Thus it is likely, but unexamined, that similar firing patterns exist in NAcc and VP neurons during cocaine self-administration. We recently demonstrated that VP neurons exhibit rapid phasic changes in firing during the seconds surrounding the cocaine-reinforced lever press (Root et al, 2010), as have been extensively observed in the NAcc (Carelli et al, 1993; Ghitza et al, 2004). A separate firing pattern, the slow phasic firing pattern, occurs over the minutes between self-infusions of cocaine and is exhibited in approximately half of NAcc neurons (Peoples and West, 1996; Peoples et al. 1998; Fabbricatore et al. 2010). Slow phasic changes in firing exhibit reversal patterns that refer to the culmination of a change in firing following the self-infusion, and the ensuing change in the opposite direction of the post-press change itself (reversing the change in firing). One type of reversal pattern, the progressive reversal firing pattern, may be behaviorally relevant given the positive correlation of cocaine self-infusion intervals and the duration of the progressive reversal in NAcc neurons (Peoples and West, 1996). In other words, because animals initiate cocaine self-administration when drug levels negatively cross an internal threshold (Yokel and Pickens, 1974), it has been hypothesized that the progressive reversal pattern may transduce fluctuating cocaine levels into a neural signal that influences goal-directed drug-seeking behavior (Peoples and West, 1996; Root et al. 2011). If so, such firing patterns should be found in the VP, which may then gain access to motoric regions involved in initiating drug-seeking. Therefore, we hypothesized that VP neurons exhibited slow phasic changes in firing.
In addition to slow phasic changes in firing, NAcc neurons can also exhibit a change in firing during the hours of cocaine self-administration compared to the pre- and post-self-administration firing rates, termed tonic firing changes. Given that nearly two-thirds of NAcc neurons exhibit tonic changes in firing rate (Fabbricatore et al. 2009), we also evaluated whether VP neurons exhibit tonic changes in firing.
As a recipient of GABAergic accumbal throughput (Walaas and Fonnum, 1979; Churchill et al. 1990; Zahm et al. 1985), VP may similarly exhibit changes in firing which might be opposite in directionality. That is, given that within the NAcc the majority of tonic patterns are decreases, and the majority of slow phasic changes are post-press decrease + reversal patterns, it is plausible that VP neurons would exhibit predominantly tonic increase and slow phasic increase + reversal firing patterns through disinhibition. On the other hand, within the NAcc projection, colocalized peptides may alter GABA-induced decreases in firing rate (Zahm et al. 1985; Chrobak and Napier, 1993; Napier et al. 1995). Furthermore, the VP integrates accumbal throughput with projections from the BLA (Fuller et al. 1987) and VTA (Klitenick et al. 1992), which may lead to differences in the proportion of increases or decreases in firing and thus depart from explanations involving exclusively disinhibition.
Materials and Methods
Subjects and surgery
Male Long–Evans rats (n=21, 300–350g; Charles River, USA) were anesthetized with sodium pentobarbital (50 mg/kg, i.p.). Prior to surgery, subjects received injections of atropine methyl nitrate (10 mg/kg, i.p.) and penicillin G (75,000 U/0.25 ml, i.m.) to reduce the risk of pulmonary edema and bacterial infection, respectively. Anesthesia was maintained with periodic i.p. injections of ketamine hydrochloride (60 mg/kg, i.p.). Following catheter implantation into the right jugular vein, a 2×8 or 5×3 array of Teflon-coated stainless steel microwires (California Fine Wire, Grover Beach, CA) was implanted into the right VP (2 × 8 array: 0.0-2.8 AP; 1.6-2.2 ML; -7.7 DV; 5 × 3 array: -0.6-0.7 AP; 1.2-2.7 ML; -7.7 DV; Paxinos and Watson, 1997) and secured with dental cement. The diameter of each uninsulated microwire tip was 50 μm. For both arrays, anteroposterior distances between wires were approximately 0.35 mm (wire center to center). Mediolateral distances were 0.50 mm in the 2 × 8 array and 0.30 mm in the 5 × 3 array (wire center to center). An insulated 0.01 inch ground wire, stripped 5 mm from the tip, was implanted 7 mm ventral from skull surface in the left hemisphere. After surgery, rats were individually housed with access to food and water in the cocaine self-administration chambers to recover for at least a week. Protocols were performed in compliance with the Guide for the Care and Use of Laboratory Animals (NIH, Publications 865–23) and were approved by the Institutional Animal Care and Use Committee, Rutgers University.
Cocaine self-administration
Prior to self-administration sessions, a nonretractable glass lever was mounted on a side wall of the chamber. Session onset was signaled by illumination of a stimulus light above the lever. Each lever press was immediately followed by an intravenous infusion of cocaine (0.24 mg/0.2 ml, approximately equivalent to 0.72 mg/kg), a 7.5 sec tone (3.5 kHz, 70 dB) that corresponded with the operation of a syringe pump, and a 40 sec time-out during which the stimulus light was extinguished and lever presses had no programmed consequence. While the schedule of reinforcement used was a 40 second fixed interval, responses during cocaine self-administration are regulated by the intravenous dose (Pickens and Thompson, 1968). The dose used in the current study generates inter-response intervals between 6 and 8 min (Peoples and West, 1996; Peoples et al. 1998; Fabbricatore et al. 2010). Prior to recordings, all self-administration sessions were six hours in duration or 80 infusions were earned, whichever occurred first. Recording session durations consisted of an initial phase thirty minutes in duration in which the lever was not installed. Following the initial phase, the lever was installed with all contingencies identical to training. The self-administration phase typically ended after the fifty-first self-infusion of cocaine, which was between six and ten hours in duration across all rats. Following the self-administration phase, the lever was removed, and recording continued for an additional hour. Rats were never drug primed.
Drug level calculation
Assuming first-order pharmacokinetics, calculated drug levels were determined by the equation:
where
Tn = the time since the previous cocaine infusion (min),
D = infusion dose (mg/kg) when animal self-administered, otherwise equaled zero (did not self-administer)
Bn-1 = cocaine level at time of last infusion (mg/kg)
K = rate constant of 0.028875, reflecting a 0.4 hour brain metabolic half-life of cocaine (Nayak et al. 1976). The calculated drug levels based on the brain half life of cocaine are approximately 7-12 times higher than calculations based on plasma drug levels (Maickel et al. 1969; Yokel & Pickens, 1974; Nayak et al. 1976).
Electrophysiological procedures
Recordings occurred between days 15 and 20 of self-administration training. During this time period, animals quickly load to a relatively stable asymptotic drug level that exhibits little variability during the 6-10 hour recording session. Five microwires were recorded per day over several days. On occasion, the same microwire was recorded on different days. Only one recording session per microwire contributed to the dataset. Neural signals were led through a preamplifier that differentially amplified (10x) the signal on the recording electrode against another microwire that did not exhibit a neural signal. The signal was then band-pass filtered (roll off 1.5 dB/octave below 1 kHz and -6 dB/octave above 11 kHz) and amplified 700X. Using software and hardware from DataWave Technologies (Longmont, CO), electrical signals were sampled (50 kHz sampling frequency per wire) and stored for offline analysis. During each experiment, electrophysiological recordings began 30 minutes before the start of the self-administration session and continued for 1 hour after the session.
Isolation and separation of individual neural waveforms from background noise and waveforms of other neurons recorded from the same microwire were conducted post-hoc using DataWave spike sorting and separation software. First, waveform parameters of neural discharges were sorted, including valley voltage, peak voltage, voltages at 4 user-defined time cursors, spike height, and peak time. A scatter plot of any 2 waveform parameters was displayed in a window, with 4 windows (eight parameters) displayed on one screen simultaneously. Each point on the scatter plot corresponded to one recorded discharge. Each cluster of dots represented similar waveforms, which was separated from other clusters by enclosing it within a “cutting box”. All waveforms of the isolated individual neuron during the entire session (6-10 hours) were then digitally displayed in temporal order to assess the stability of neural waveforms within session. Waveforms whose parameters did not remain stable were discarded. Second, an interspike interval (ISI) histogram was constructed. If discharges occurred within the first 2 msec in the ISI, corresponding to a neuron’s natural refractory period, the recording was not considered that of a single neuron and was discarded. When more than a single cluster of neural waveform data appeared to have been recorded from a given wire, cross-correlation histograms were generated to determine whether the data corresponded to distinct neurons. If discharges occurred within the first 2 msec in the cross-correlation and both data clusters contained 0 discharges within their respective ISI’s, both clusters were considered independent single units. Neurons exhibiting signal-to-noise ratios less than 2:1 were discarded.
Analysis of slow phasic firing patterns
The initial 10 rapidly-spaced “loading” self-infusions were excluded from slow phasic analysis in order to remove pharmacological differences across lever presses. All other reinforced lever presses were analyzed, which averaged 41.27 ± 0.39 reinforced presses per session. Data for slow-phasic changes in firing were determined by constructing rasters and PETHs that displayed neuronal discharges (spikes/sec) within ± 4 min of each lever press (12 sec bin width) (Peoples and West, 1996; Peoples et al. 1998; Fabbricatore et al. 2010). Trials in which the inter-infusion interval was less than four minutes occurred in only 3.03% of all nodes. Offset of the cocaine-reinforced lever press was used as the node around which PETHs were constructed.
Initial categorization of slow phasic firing patterns
Given the numerous types of slow phasic firing patterns in NAcc neurons (Peoples and West, 1996; Peoples et al. 1998; Fabbricatore et al. 2010), it was necessary to determine if any of the VP neurons exhibited similar firing rate changes over the inter-infusion interval that could be reliability clustered together into independent categories. This was achieved by using principal components analysis (PCA), a technique for reducing a set of variables to an underlying set of components that provide a more parsimonious summary of the larger set of variables (Comrey, 1973; Gorsuch, 1983). The logic of the analytical strategy for the initial categorization of VP firing patterns was to use PCA as a “pattern detector” for determining whether there were independent and unique clusters of firing rate patterns ± 4 min around the cocaine-reinforced lever press. This analysis produced a taxonomy of unique and statistically independent categories of firing patterns.
The type of PCA used for this analysis was S Technique PCA (Gorsuch, 1983) because it enabled the creation of categories based on temporal patterns of change for a single variable (firing rate). The standard R Technique PCA compares different variables that were measured at one occasion across different subjects (Comrey, 1973; Tabachnick & Fidell, 1989). In contrast, the S Technique PCA compares different subjects (neurons, in this case) amongst each other that were repeatedly measured across time (time bins) on one variable (firing rate; Gorsuch, 1983). Thus, by finding common patterns of change over time for firing rates across different neurons, the S Technique PCA enabled the creation of a taxonomy (or typology) of different firing patterns over the inter-infusion interval.
A two stage analysis was conducted using PSW 17.0 (SPSS, Chicago, IL). The first stage consisted of an initial varimax rotation PCA on all recorded neurons’ data. Because the goal was to create a simplified orthogonal taxonomy of firing patterns, varimax rotation was used. The Appendix section details the pilot analyses which determined that an orthogonal solution to the PCA was appropriate.
The PCA produced a set of loadings in which only loadings ≥ |0.32| were considered. A loading of |0.32| is a traditional cutoff for PCA, and indicates that 10% of a variable’s variance overlaps with its associated component (Comrey, 1973; Tabachnick & Fidell, 1989). In other words, loadings represent the relationship of each neuron’s overall firing rate profile and a given principal component. All components with eigenvalue > 1 were retained (Gorsuch, 1983; Tabachnick & Fidell, 1989). The eigenvalue of a given component corresponds to the amount of variance accounted for by that component out of the total amount of variance associated with all the variables subjected to the PCA (Gorsuch, 1983; Tabachnick & Fidell, 1989). The retained components were further assessed by visual inspection of the Anderson-Rubin component scores (Gorsuch, 1983) plotted against time and inspection of the scree plot. This was done to determine at which point the ranked components, beginning with the first component, stopped capturing slow phasic firing patterns. Extensive previous research has determined what kinds of slow phasic firing patterns are interpretable (i.e. those that demonstrated reliable firing rate changes over the inter-infusion interval; Peoples and West, 1996; Peoples et al. 1998; Fabbricatore et al. 2010). Once a smaller subset of components was identified, any neurons that did not load on these components with at least a value of |0.32| were removed, creating a reduced dataset. The second stage of the analysis consisted of rerunning the PCA on this reduced dataset and using the criteria described above to determine a final set of components and their associated neurons. The rationale for utilizing the two stage approach is detailed in the Appendix.
A taxonomy of firing rate patterns was created using the results of the final PCA solution in which individual neurons were placed into different groups as defined by their component loading values. For the purpose of defining different categories, negative loadings were considered separately from the positive loadings. A negative loading for a neuron indicated that it had a firing rate profile that was a mirror image of its associated component. Each unique combination of positive and negative loadings that was found across all neurons was used to create categories in the taxonomy of firing patterns. For instance, all the neurons that loaded positively on the first component, and only on the first component, formed one category. On the other hand, for example, a set of neurons that loaded negatively both on the first and second components formed another category. Not all combinations of negative or positive loadings were observed. For instance, while a particular neuron may load with categories negative one and negative two, it is possible that no neurons loaded with negative two alone. All neurons, including those that were removed during the analysis (termed “no change” neurons), were graphed based on their different categorizations.
Characterization of slow phasic post-press change + reversal firing patterns
Previous analyses of NAcc slow phasic firing patterns in this laboratory (Peoples and West, 1996; Peoples et al. 1998; Fabbricatore et al. 2010) have defined two types of post-press changes (increase and decrease), both with three different kinds of reversal patterns (early, progressive, and late). A new slow phasic assessment procedure, which included the PCA based categorization, was developed for the present study. The previous procedure included an inferential statistical procedure, the Wilcoxon test, for each neuron, which we wished to eliminate from any decision process due to concerns about violating the assumption of independence. A software macro was created using SAS (SAS Institute Inc., 2005) in order to implement the new procedure. Utilizing data from each PCA based category, this new procedure determined post-press change (increase, decrease, or no change) and, for those that did exhibit a change, the latency (minutes from the self-infusion) and type of its reversal (early, progressive, late). This procedure yielded reliable assessments of the electrophysiological data consistent with our previous characterizations of such patterns (detailed in the Appendix).
The procedure involved the following steps: First, the slow phasic firing rate data for all individual neurons were transformed to z-scores based on the mean firing rate and its associated standard deviation for each neuron (Appendix Figure 1). The z-score transform allowed for the determination of post-press change direction and reversal type to be completed on the same scale across all neurons, accommodating the variety of firing rates exhibited by different neurons. A single representative spline curve was fitted to all z-score transformed slow-phasic firing rates for all neurons within each PCA category, i.e. a single taxon using SAS PROC LOESS. The smoothing parameter for PROC LOESS was set at 0.2 with all other default settings maintained. The goal was to fit a spline curve that was sensitive to the various fluctuations of the slow-phasic firing rate patterns but resistant to occasionally observed, transient firing rates that clearly were outliers. That is, similar to our previous reports of accumbal slow phasic firing patterns (Peoples and West, 1996; Peoples et al. 1998; Fabbricatore et al. 2010), the goal was to be sensitive to patterns over minutes rather than within a single 12 second bin. Systematic experimentation with several different smoothing constants determined that a constant of 0.2 was optimal for this purpose. The spline curve for each category was the basis for all subsequent calculations in the software algorithm used to determine a given category’s post-press change + reversal type. That is, all neurons within each PCA-determined category were designated as a post-press change (increase, decrease, no change) and reversal (early, progressive, late) according to the results of the subsequent analysis of the category’s spline curve.
The next step was to determine whether the overall firing rate pattern for a given category was an increase, decrease, or no change, using the spline curve of that category where y-axis = z-score and x-axis = time (± 4 min) (see Fig. 1). The min and max values for the slow-phasic firing rates in the 2 minutes before the press (pre-press) and the 2 minutes after the press (post-press) were computed, consistent with prior reports (Peoples and West, 1996; Peoples et al. 1998; Fabbricatore et al. 2010). If the difference between the post-press max and the pre-press min was greater than the difference between the post-press min and the pre-press max, then the post-press max was defined as the category’s “overall max” and the prepress min was defined as the category’s “overall min”. If the difference between the post-press max and the pre-press min was less than the difference between the post-press min and the pre-press max, then the pre-press max was defined as the category’s “overall max” and the post-press min was defined as the category’s “overall min”.
Figure 1.
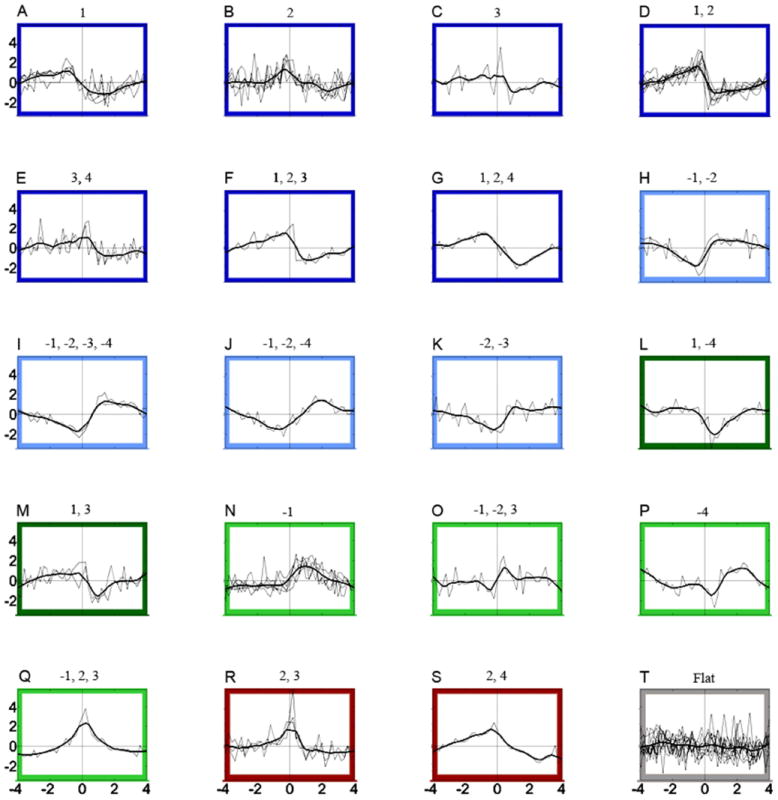
Slow phasic changes in firing. The entire population of recorded neurons is displayed for each PCA based category. Each PCA based category, a value consisting of the positive or negative loadings for a component in which the loading >= |0.32|, is listed above each plot at time zero. Thin black lines are z-score transformed slow phasic firing rate data from each neuron. Thick black lines are spline curves fitted to all z-score transformed slow-phasic firing rates for all individual neurons within each PCA category (number at center above each subplot). Outlining colors indicate post-press change + reversal patterns for each PCA category. Dark colors indicate decreases while light colors indicate increases in firing following the press (post-press change). The most predominant phasic firing pattern, the decrease + progressive reversal, is outlined by dark blue (A-G) while the increase + progressive reversal pattern is outlined in light blue (H-K). Decrease + early reversal neurons are outlined in dark green (L-M) while increase + early reversal neurons are outlined in light green (N-Q). Decrease + late reversal neurons are outlined in dark red (R-S). There were no increase + late reversal neurons. The “no change” category outlined in gray displays all neurons removed from the PCA analyses, whose firing rates were statistically determined to be unaltered over the inter-infusion interval. All x-axes are between -4 and +4 min and all y-axes are between +5 and -3 standardized units.
The overall max and overall min values were then used to determine whether the category exhibited a post-press change or no change. The infusion change was defined as |overall max - overall min|. If the infusion change was ≤ 0.26, neurons within this category were labeled as “no change”. The cutoff of 0.26 was chosen because in a normal distribution, a z-score of 0.26 in either direction from the mean of 0 encompasses 10% of the distribution in one direction, for a total of 20% in both directions from the mean. Any category’s slow phasic firing pattern whose overall minimum and maximum exhibited a difference score between them that would not be expected to occur at least 20% of the time due to random chance was considered to have too little change between the maximum and minimum values to be considered a phasic change pattern. Among neurons for which the infusion change was > 0.26, if the difference between the post-press max and the pre-press max was less than zero, then the firing pattern was categorized as a decrease. If the difference between the post-press max and the pre-press max was greater than zero, then the firing pattern was categorized as an increase.
For phasic increase and decrease categories, a reversal type was determined. Each categorical spline curve was examined for the locations on the spline curve that corresponded to a value of 5% and 95% of the infusion change. To do this, each curve was examined from the time of the overall min (for decrease patterns) or overall max (for increase patterns) to the +4 min time bin, as well as from the -4 min time bin to the time of the overall max (for decrease patterns) or overall min (for increase patterns). A 5% change was termed the reversal onset while a 95% change was termed the reversal completion. If the reversal onset and completion occurred between the overall min (for decrease patterns) or overall max (for increase patterns) to +4 min, the category was judged to be early reversal (ER). If the reversal onset and completion occurred between -4 min and the overall max (for decrease patterns) or overall min (for increase patterns), the category was judged to be late reversal (LR). If the reversal onset occurred between the overall min (for decrease patterns) or overall max (for increase patterns) to +4 min and the reversal completion occurred between -4 min to the overall max (for decrease patterns) or overall min (for increase patterns), the category was judged to be progressive reversal (PR). In other words, if the onset and completion of the reversal occurred on the post-press side, the category was termed ER whereas if the onset and completion of reversal occurred on the pre-press side, the category was termed LR. If the onset of reversal occurred on the post-press side and the completion of reversal occurred on the pre-press side, the category was termed PR. Categorization of reversal type was consistent with our prior reports (Peoples and West, 1996; Peoples et al. 1998; Fabbricatore et al. 2010).
The magnitude of the post-press change was computed by using a standardized change score formula, ‘B/(A+B)’, where ‘B’ equaled the firing rate of each neuron at the time of its PCA category’s overall min (for decrease patterns) or overall max (for increase patterns) and ‘A’ equaled the firing rate of each neuron at the time of its PCA category’s overall min (for increase patterns) or overall max (for decrease patterns). To include “no change” neurons in the analysis, ‘B’ equaled the firing rate of each neuron at the average time of the overall min and max on the pre-press side from all other PCA categories and ‘A’ equaled the firing rate of each neuron at the time of the average overall min and max on the post-press side from all other PCA categories. The ‘B/(A+B)’ scale displays standardized change in firing rate as no change (0.5), decrease (< 0.5), or increase (> 0.5).
Histological procedures
Detailed accounts of the histological procedures used to verify the location of each recorded neuron were described in previous reports (Root et al 2010; Fabbricatore et al. 2009; Ghitza et al. 2003, 2004). Briefly, the locations of all wire tips were marked by anodal current (50 mA, 4 seconds) leaving an iron deposit that was subsequently visualized with a 5% potassium ferrocyanide and 10% HCl solution. The sections (50μm) were counterstained with a 0.2% solution of Neutral Red and coverslipped. If all implanted microwire tracks were identified from their entry into cortex to their tips (blue spots by potassium ferrocyanide staining of iron deposits), microwire tip positions were subsequently histologically localized. If any of the implanted microwires could not be identified, neural data from the animal were discarded. Two investigators blind to the recorded neural data reconstructed all microwire three-dimensional positions (inter-rater reliability: 96.23%) according to the atlas of Paxinos and Watson (1997). Placement reliability was defined as microwires localized 1) onto the identical coronal atlas plate; 2) within 300 μm of placements (hypotenuse of mediolateral and dorsoventral); and 3) inside the VP. As a precaution, data were discarded if they were recorded from any wire tip that appeared to be localized inside VP but was within 150 μm of any VP border.
Neuroanatomical Distribution of Reversal Patterns
Each VP neuron’s location was plotted on a scatterplot in which the x-axis scale was the anteroposterior coordinates and the y-axis scale was the mediolateral coordinates of the histologically verified microwire (i.e., a “dorsal” view), with each neuron color coded depending on its reversal type. The 2005 version of Paxinos and Watson’s atlas was utilized for this purpose due to its increased resolution in the anteroposterior dimension compared to earlier versions. The geometric median centroids for each group were determined using the function “kmeans.m” of Matlab (The Mathworks, Cambridge MA). A MANOVA was conducted using SAS PROC GLM in order to determine if there was a difference in the anteroposterior / mediolateral distribution of the three different types of reversal patterns across the VP. For the MANOVA, the anteroposterior and mediolateral coordinates were the dependent variables and reversal type was the independent variable. Four different post-hoc comparisons were performed. The first three comparisons consisted of testing the difference between all three possible pair-wise combinations of the three reversal types. Given that our previous report detailed differences between the prevalence of early versus a combination of progressive and late reversals within NAcc subregions (Fabbricatore et al. 2010), the fourth post-hoc comparison consisted of testing the difference between the early reversal neurons and a weighted combination of the progressive and late reversal neurons using contrast codes.
Analysis of tonic firing patterns
Tonic changes in firing that occurred over the hours of self-administration were computed relative to the 30 min period prior to the first self-administered infusion of cocaine and relative to the 1 h period following removal of the operandum (0.5 min bin width), consistent with prior reports (Ghitza et al. 2006; Fabbricatore et al. 2009). Self-administration related changes in firing were measured by a ‘B/(A + B)’ ratio where (‘A’) equaled the baseline firing rate, defined as mean firing rate between -20 min and 0 min prior to the first self-administered infusion of cocaine. Baseline firing rate was compared to the mean firing rates during two 20-min periods during the self-administration phase (‘B’): (i) two hours following the first self-administered infusion of cocaine (i.e. after drug loading) and (ii) the final 20 min of drug self-administration prior to lever removal. These two periods were chosen to assure that any within-phase differences in firing were not attributable to differences in drug level (Fabbricatore et al. 2009). Post self-administration related changes in firing were measured by a ‘B/(A + B)’ ratio where (‘A’) equaled the mean firing rates during the two 20-min periods during the self-administration phase just described. (‘B’) equaled the post-drug mean firing rate from the last 20 min of the post-drug phase (40 min following lever removal). These two measures standardize changes in firing rate across all neurons, which exhibit different absolute firing rates, as no change (0.5), decrease (< 0.5), and increase (> 0.5).
To assess a potential relationship between self-administered drug level and tonic firing rates, starting at the first self-infusion of cocaine, each 0.5 min bin of calculated drug level was correlated with each 0.5 min bin of firing rate. Correlations were divided into three phases. The first phase (termed “load”) consisted of the first 10 cocaine self-infusions during which calculated drug levels markedly increased. The second phase (termed “maintenance”) encompassed the period of peak post-load drug levels which was characterized by small fluctuations over the inter-infusion interval. The third phase (termed “post self-administration”) consisted of initial high drug levels after removal of the manipulandum, followed by gradual decline in drug level over the remainder (one hour) of the recording session.
Results
Prior to recordings, animals acquired self-administration behavior and exhibited an increase in response rates as well as drug intake over days of training (for details, see Root et al. 2010). Behavior prior to the start of the self-administration phase was typically characterized by quiescence with occasional grooming. Once the lever was installed and operant behavior commenced, an initial brief period of rapid lever pressing (i.e. load up) was followed for the remainder of the self-administration phase by regularly spaced self-infusions, whose mean intervals across animals ranged between 6.04 and 8.58 min (mean and SEM = 7.29 ± 0.13 min). Between infusions, self-administration behavior was characterized by focused stereotypy, which consisted of nose poking, forelimb treading and repetitive head movement. Lever removal was followed by locomotion about the chamber initially, and then behaviors that were similar to those observed during the pre-drug phase of the experiment as drug levels declined.
Slow phasic firing patterns
Of 21 rats, 224 microwires were implanted in 14 animals targeting the ventrolateral accumbens shell with 2x8 arrays, the results of which have been reported elsewhere (Fabbricatore et al. 2009, 2010). Of these, 42 microwires were localized within the VP and 33 were excluded due to proximity within 150 micrometers of a VP border. The seven remaining rats were implanted with 105 microwires with 3×5 arrays. Of these, 40 microwires were localized to the VP and 32 were excluded due to proximity within 150 micrometers of a VP border. Of the total 82 microwires localized to the VP, 52 exhibited a single-unit and 1 microwire exhibited two single-units. In total, fifty four VP neurons were recorded during the cocaine self-administration experiment.
The pairwise correlation table among all neurons’ slow phasic firing rate data, which formed the basis for the PCA analysis, is shown in Appendix Table 2. In the first stage, 12 components were initially retained based on the criterion of eigenvalue > 1 (Appendix Tables 3 and 4). Out of these 12 components, using both the scree plot and visual inspection of the Anderson-Rubin component scores plotted against time, it was determined that the first 4 components were associated with firing rate patterns that were reliable and interpretable. Nine neurons exhibited loadings less than |0.32| on the first 4 components, and were removed from the dataset. Their removal enabled a second stage, in which the PCA was rerun on the reduced dataset; 8 components were retained based on the criterion of eigenvalue > 1 (Appendix Tables 5 and 6). Out of these 8 components, using both the scree plot and visual inspection of the component scores plotted against time, it was confirmed that the first 4 components were associated with firing rate patterns that were reliable and interpretable. Two neurons exhibited loadings less than |0.32| on the first 4 components and were removed from consideration in the final PCA solution. The results of the final PCA solution (43 neurons) from the second stage were used to create a taxonomy of different firing rate categories.
The overall firing pattern for each PCA category as represented by the spline curve was tested for post-press change (increase, decrease, or no change) + reversal type (early, progressive, or late). In addition, the neurons removed from PCA analysis were grouped together and assessed for post-press change + reversal type. Over the inter-infusion interval, most VP neurons exhibited a post-press change in firing and a subsequent reversal of this change in firing (n = 43, 79.63%, Figure 1). Eleven neurons removed during the two stage PCA analysis were categorized as no change, i.e., firing rates were not modulated over the inter-infusion interval (Figure 1T, “no change” surrounded by gray). The distribution of the different slow phasic categories (post-press increase or decrease patterns; early, progressive, or late reversal patterns) was not homogeneous (Table 1), X2(2) = 11.594, p < 0.01. The most prevalent firing pattern of slow phasic neurons (n = 22, 51.16%) was a post-press decrease + progressive reversal (Table 1 and Figure 1 categories surrounded by dark blue). Figure 1 shows all the VP neurons’ slow phasic firing rate profiles grouped by the taxonomic categories developed by the PCA (number at time zero above each plot) as well post-press directionality and reversal type.
Table 1.
Distribution of post-press change + reversal categories. Slow phasic changes in firing were not distributed homogenously among the various post-press change + reversal categories.
| Post-Press Change Category | Reversal Category | |||
| Early | Progressive | Late | ||
| Decrease | 6.98% (3) | 51.16% (22) | 9.30% (4) | |
| Increase | 18.60% (8) | 13.95% (6) | 0.00% (0) | |
VP neurons exhibited a relatively normal distribution in their magnitude of slow phasic post-press changes in firing (Figure 2A). As can be seen in Figure 1, the reversal onset was typically two min or less following the infusion (n=28, 65.12%), averaging 2.05 ± 0.15 min (Figure 2B). Reversal completion was typically within two minutes prior to the (subsequent) infusion (n=26, 60.47%) (Figure 2C). Each slow phasic reversal category onset and completion was quantified as follows: Early reversals began on average 1.33 + 0.17 min and completed 3.65 + 0.17 min post-press; Progressive reversals began on average 2.01 + 0.11 min and completed -1.09 + 0.17 min; Late reversals began on average -3.75 + 0.25 min and completed -0.25 + 0.05 min.
Figure 2.
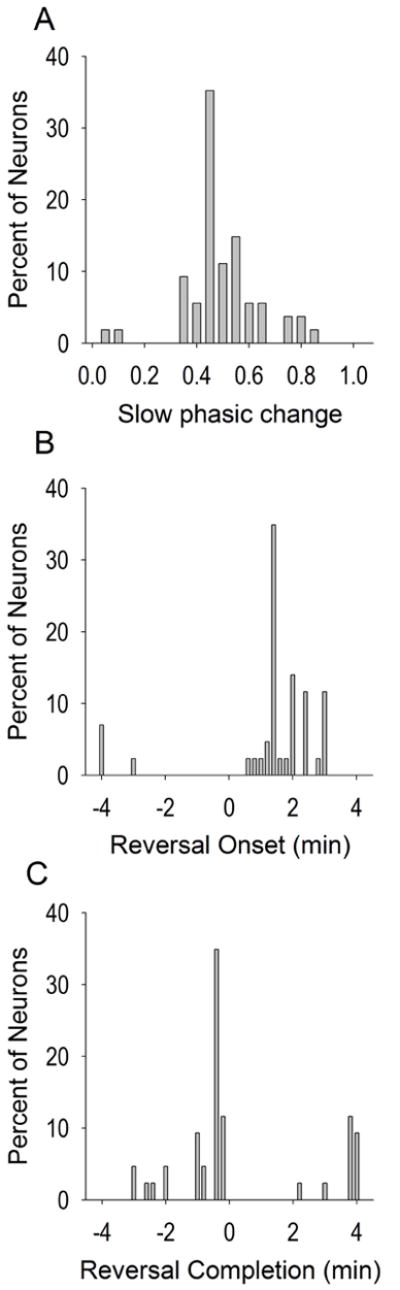
Slow phasic properties. The magnitude and direction of standardized slow phasic changes in firing (A) were fairly normally distributed. Most neurons exhibited reversal onsets (B) within the first two min and completions (C) occurred typically within two minutes prior to the infusion. Reversal onset and completion are expressed as time from the infusion (min). Note that for assessing reversal onset and completion, each spline curve (solid lines of Figure 1, see methods) was examined first from the time of the overall min (for decrease patterns) or overall max (for increase patterns) to the +4 min time bin. If reversal onset or completion was not observed during this epoch, the spline curve was further examined from the -4 min time bin to the time of the overall max (for decrease patterns) or overall min (for increase patterns). Figure 2A includes no change neurons while 2B-2C include only slow phasic neurons.
A single MANOVA was conducted on the sample of n neurons (n = 43) that exhibited reversals to determine whether a given neuron’s slow phasic reversal type was correlated with its anatomical position in the VP. With anteroposterior and mediolateral coordinates as the dependent variables and reversal type as the independent variable, the analysis was statistically significant, Wilks’ Λ = 0.78, F(4, 78) = 2.59, p < 0.05. The planned post-hoc comparisons consisted of all three possible pairwise combinations among the three reversal types and a weighted combination of progressive reversal (PR) and late reversal (LR) compared with early reversal (ER). The difference between ER and PR was not significant, Wilks’ Λ = 0.86, F(2, 39) = 3.11, p > 0.05. The difference between ER and LR was statistically significant, Wilks’ Λ = 0.82, F(2, 39) = 4.45, p < 0.05. The difference between the PR and LR was not statistically significant, Wilks’ Λ = 0.92, F(2, 39) = 1.47, p > 0.05. The difference between ER and a weighted combination of the PR and LR was statistically significant, Wilks’ Λ = 0.79, F(2, 39) = 5.24, p < 0.01. The overall results show that the ER neurons were located more anteriorly in the VP than the PR and LR neurons (Figure 3).
Figure 3.
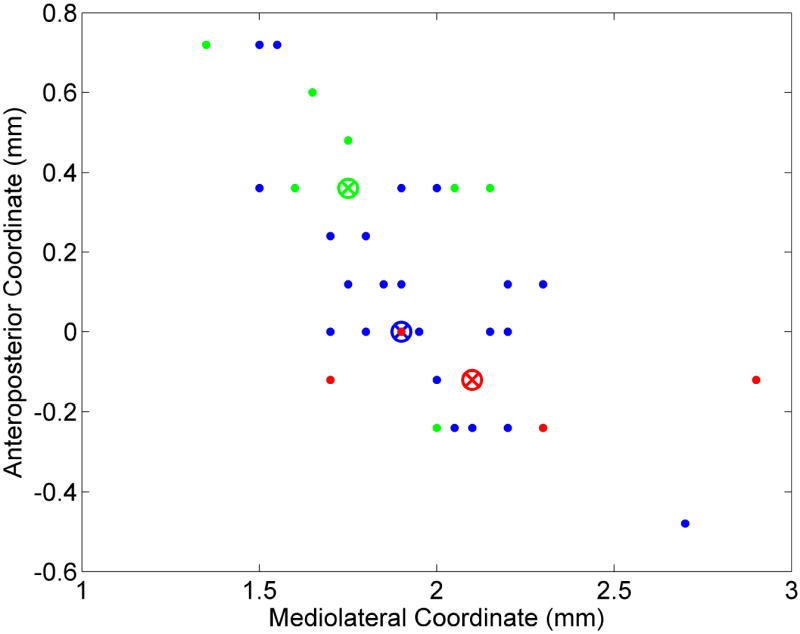
Microwire positions of recorded slow phasic neurons within the right hemisphere VP. X-axis refers to mediolateral position and Y-axis refers to anteroposterior position. Green dots indicate early reversal pattern, blue dots indicate progressive reversal pattern, and red dots indicate late reversal pattern without regard to directionality. Colored circles with X inside indicate k-means centroid of their respective reversal clusters. Each centroid represents the geometric median of the points in that cluster.
Tonic firing patterns
Overall, tonic firing profiles typically consisted of 1) a change in firing during self-administration compared to pre self-administration; and 2) a reversal of this change in firing during post self-administration compared to self-administration. Prior to self-administration behavior, the average VP firing rate was 6.54 ± 2.22 (range: 0.02 - 71.86) impulses/sec (compared to 0.53 ± 0.12 impulses/sec in NAcc neurons, Fabbricatore et al, 2009). VP neurons exhibited both increases and decreases in firing during the hours of cocaine self-administration compared with the pre-drug phase (-20 min to time zero; Figure 4). Approximately half (53.70%) the recorded neurons exhibited at least a two-fold self-administration change in firing which consisted of 33.33% (n=18) decreases and 20.37% (n=11) increases in firing rate (Figure 5A). The prevalence of two-fold increase versus decrease neurons did not differ.
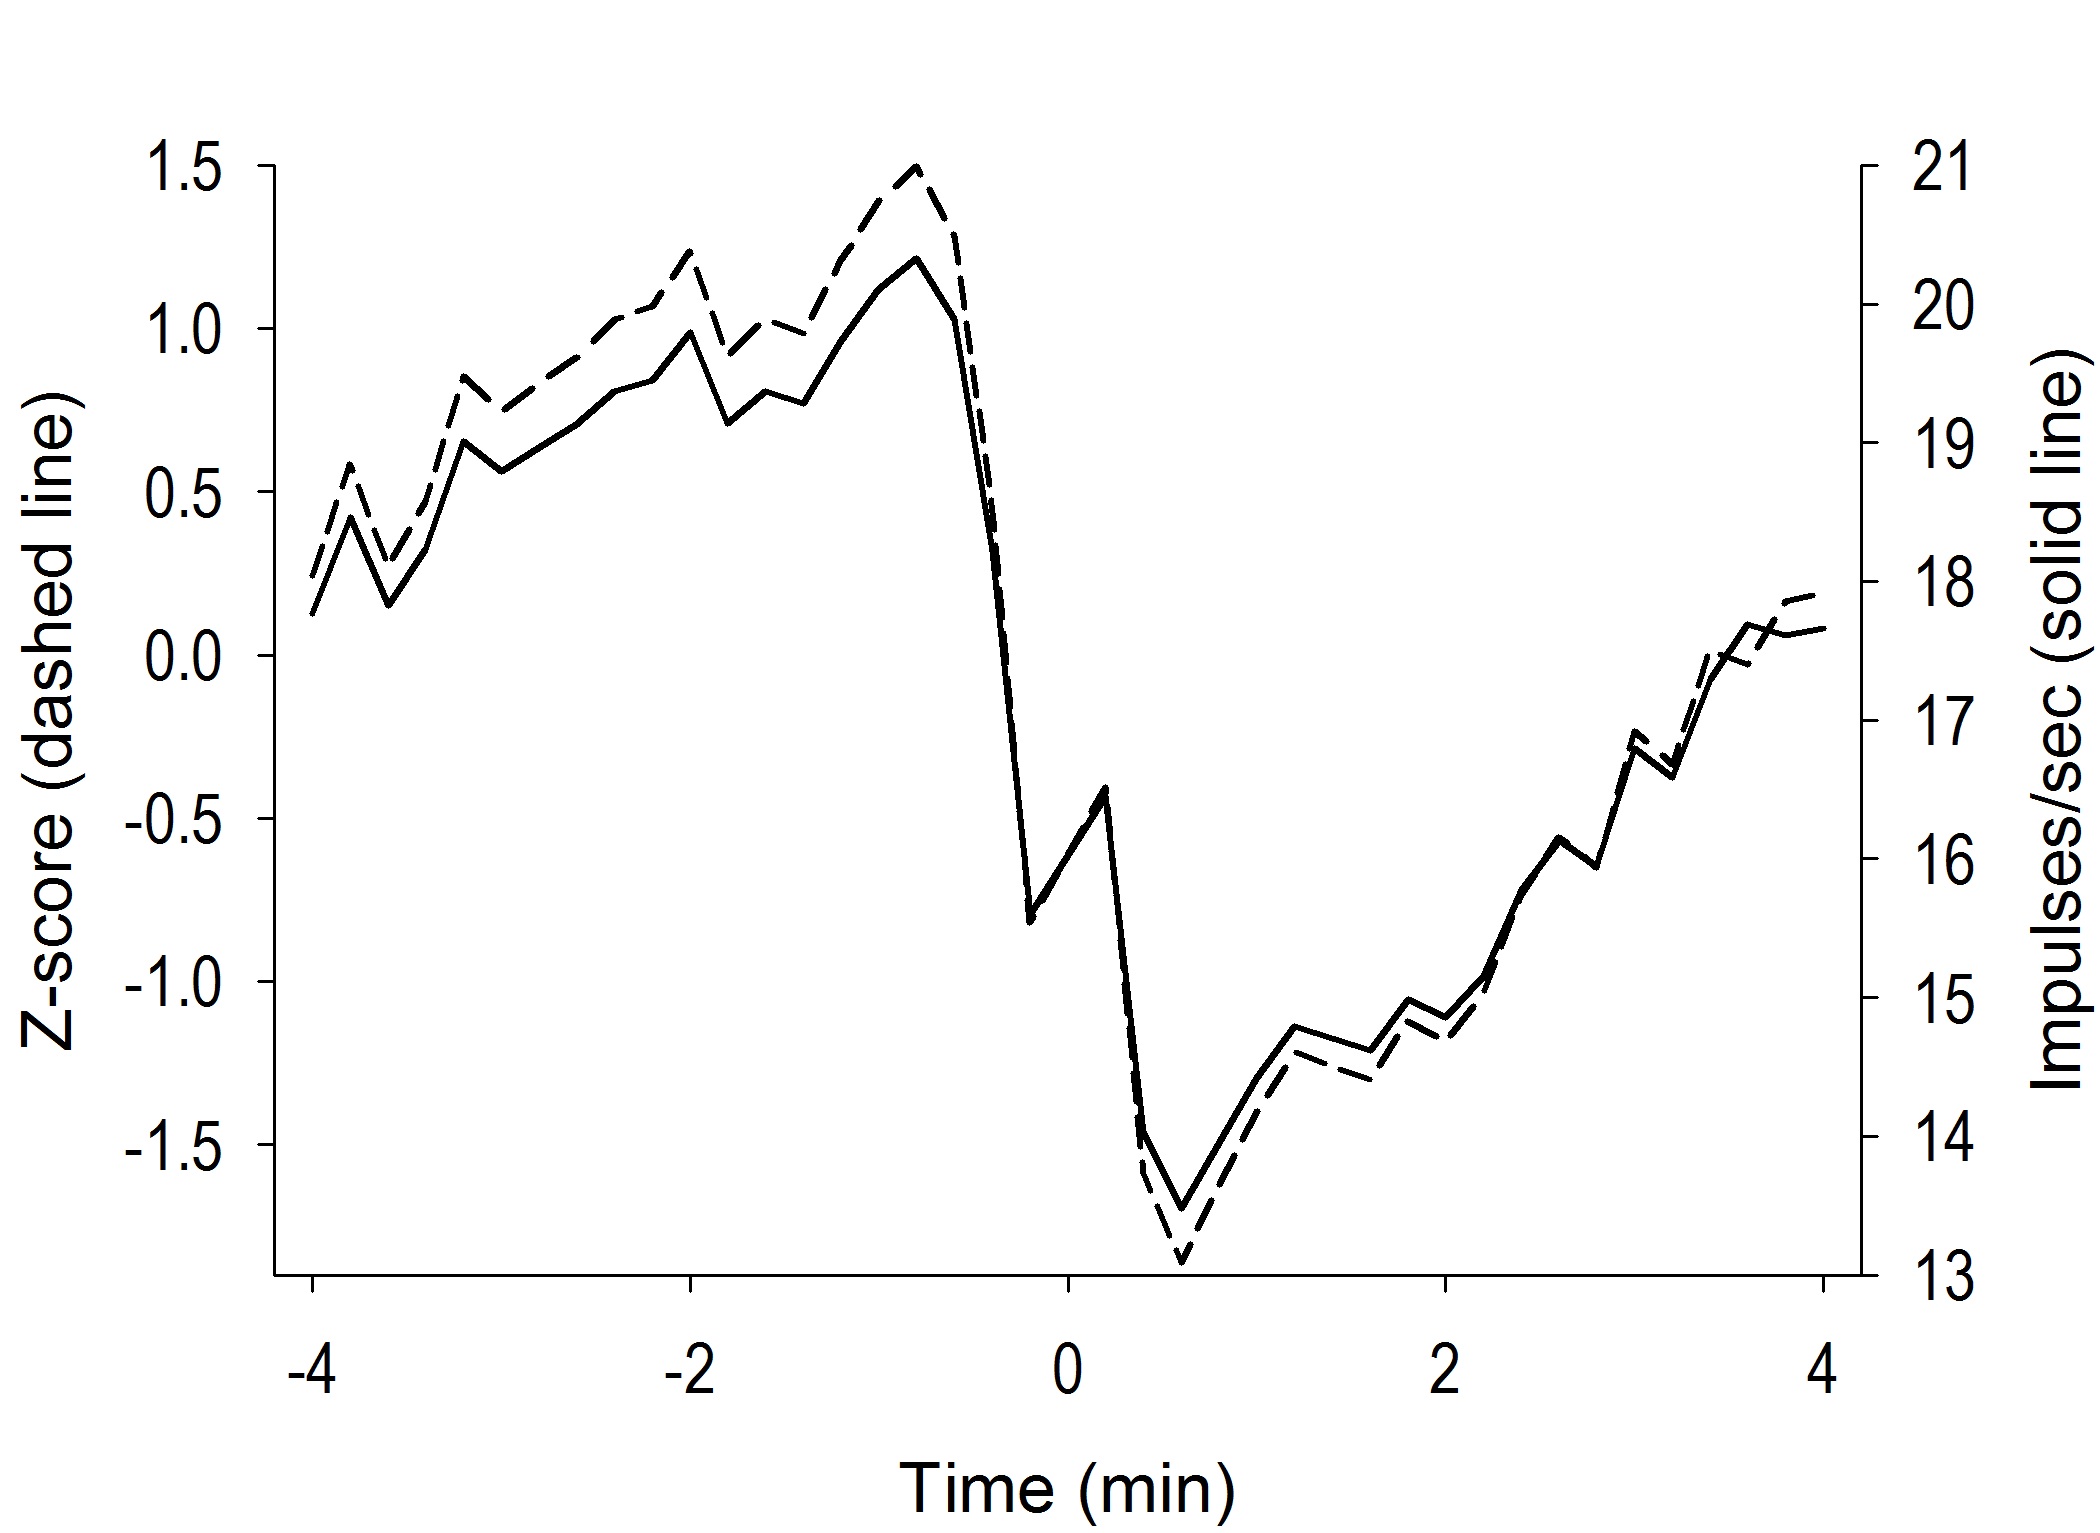
Figure 4.
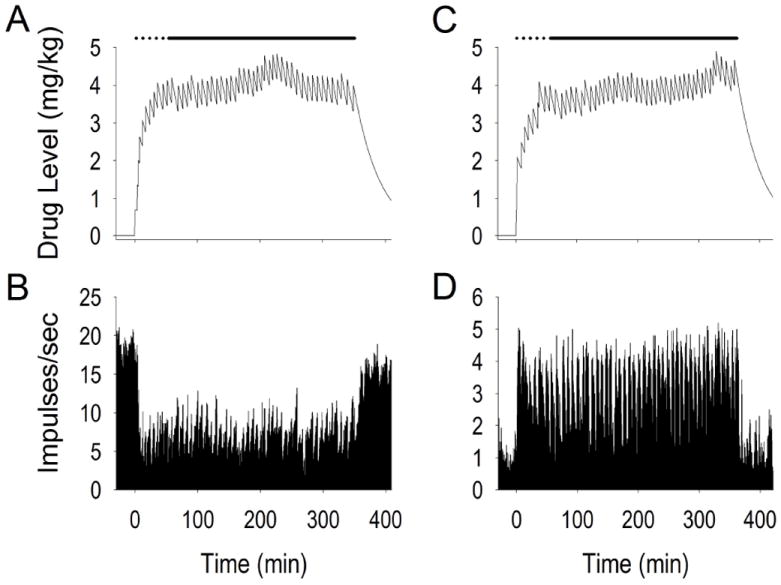
Examples of tonic change neuron firing before, during, and following self-administration. Time prior to time 0 is the half hour prior to self-administration. Time 0 on the x-axes (min) is the time of the first infusion. Panels A and C display calculated drug level while panels B and D display firing rate over the course of the recording session. Time scale labels on panels B and D correspond directly with time course for drug level data shown in panels A and C. Dotted line above each drug accumulation curve is drug “load” period consisting of ten rapid self-infusions. Solid black line above each curve is drug “maintenance” period consisting of evenly spaced inter-infusion intervals which maintain relatively constant drug levels. The end of the solid black line indicates removal of the lever (start of the post self-administration phase) and subsequent decline in drug levels.
Figure 5.
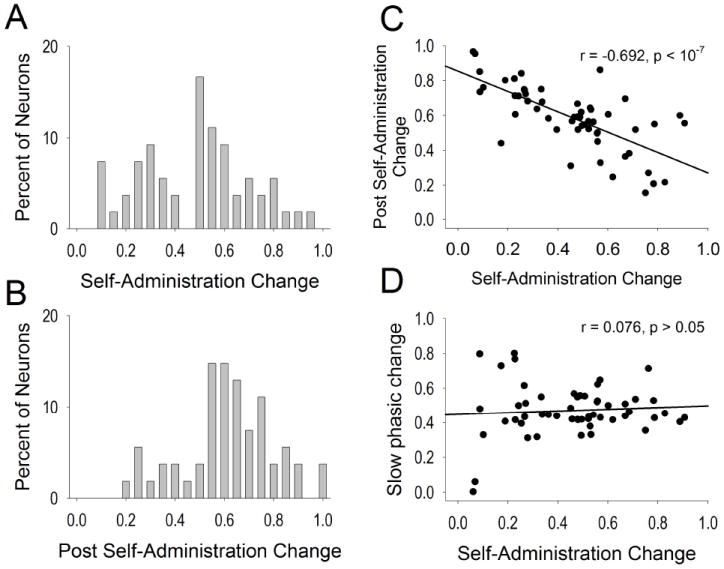
Tonic firing properties. The magnitude and direction of standardized self-administration change in firing (A) was fairly normally distributed and shifted to the right (increase) for the post self-administration change (B). Correlations of self-administration change in firing are plotted against post self-administration change (C) and slow phasic change in firing (D).
Following self-administration, approximately half (48.15%) the neurons exhibited at least a two-fold change in firing compared with firing rates during self-administration. Two-fold or greater change neurons were more likely to exhibit increases in firing (35.19%, n=19) than decreases (12.96%, n=7), X2 = 7.295, p < 0.01 following self-administration, relative to firing during self-administration. The entire distribution of post self-administration changes is displayed in Figure 5B. Among all neurons, the post self-administration change in firing was shifted to the right on the ‘B/(A + B)’ scale (increases in firing rate) compared to the self-administration change in firing, t(53) = -2.58, p < 0.05. A significant inverse relationship was observed between self-administration change and post self-administration change for the entire population of VP neurons, r = -0.692, p < 10-7 (Figure 5C), generally indicating reversals of self-administration changes following self-administration. The self-administration change did not correlate with slow phasic change in firing (r = 0.076, p > 0.05; Figure 5D).
Changes in firing rate over the entire self-administration and post self-administration phases for all recorded neurons are displayed in Figure 6. Due to differences in experimental duration (7-12 hours), bin size is normalized to one percent of the experiment between the first self-administered infusion of cocaine and cessation of recording. Change in firing over the experiment was quantified with a ‘B/(A + B)’ ratio where (‘B’) equaled the firing rate of each percent of the experiment and (‘A’) equaled the pre-drug firing rate (-20 to 0 min prior to the first cocaine infusion). Most neurons exhibited a robust change from pre-drug firing rate once self-administration commenced, which was maintained across the entire self-administration phase. Many neurons exhibited a reversal of firing toward pre-drug rates following lever removal (indicated by black filled circle in the percent bin for each neuron). This led us to analyze whether tonic firing rates correlated with self-administered cocaine levels.
Figure 6.
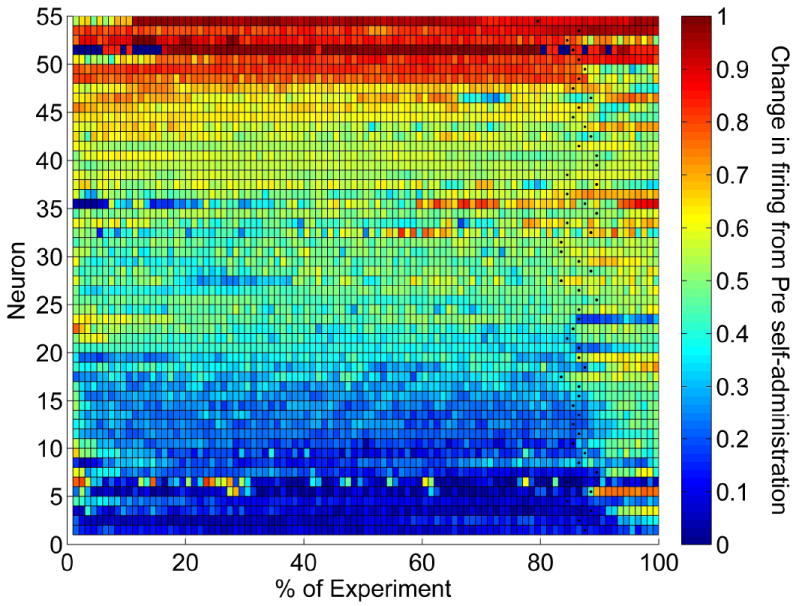
Tonic change in firing of the entire population of recorded VP neurons. Each neuron is displayed as a row along the x-axis (experimental time) with time 0 at the first self-infusion of cocaine. Color refers to change in firing from pre self-administration phase. Due to differences in recording duration (all phases totaling between 7 and 12 hours), each experimental time course was normalized to percentage values with each block representing one percent. Black dots indicate start of the post self-administration phase in which the lever was removed. Color indicates standardized change in firing ‘B/(A+B)’ in which average firing rate in each percent bin equaled ‘B’ and average pre self-administration firing rates (-20 min to 0 min prior to the first self-infusion) equaled ‘A’ (0.5 = no change; values < 0.5 = decrease; values > 0.5 = increase).
As a population, VP neurons typically exhibited negative correlations between drug level and firing rate during loading and post self-administration, and a low prevalence of correlations during maintenance (Figure 7A-C). Given that the range of drug levels during the maintenance phase was significantly smaller than the range during load or post self-administration phases (t(53) > 14.60, p < 10-19), it is plausible that the normal distribution of correlations observed during the maintenance phase is attributable to the restricted drug level range during this phase (mean ± SEM of range of drug levels: load: 3.56 ± 0.07 mg/kg; maintenance: 1.94 ± 0.08 mg/kg; post self-administration: 3.34 ± 0.06 mg/kg). Nevertheless, eight (14.81%) neurons exhibited moderate or high correlations (r ≥ |0.4|) between drug level and firing rate during the maintenance phase. Strikingly, this relationship was nearly exclusive to one phasic category: progressive reversal; all but one neuron (7/8, 87.50%), which exhibited an early reversal, exhibited a progressive reversal slow phasic firing pattern, which was significantly greater than the expected value (Fisher’s exact test = 4.780, df=1, p = 0.05 in a 2 × 2 matrix of Progressive Reversal/NonProgressive Reversal X Correlation/No Correlation).
Figure 7.
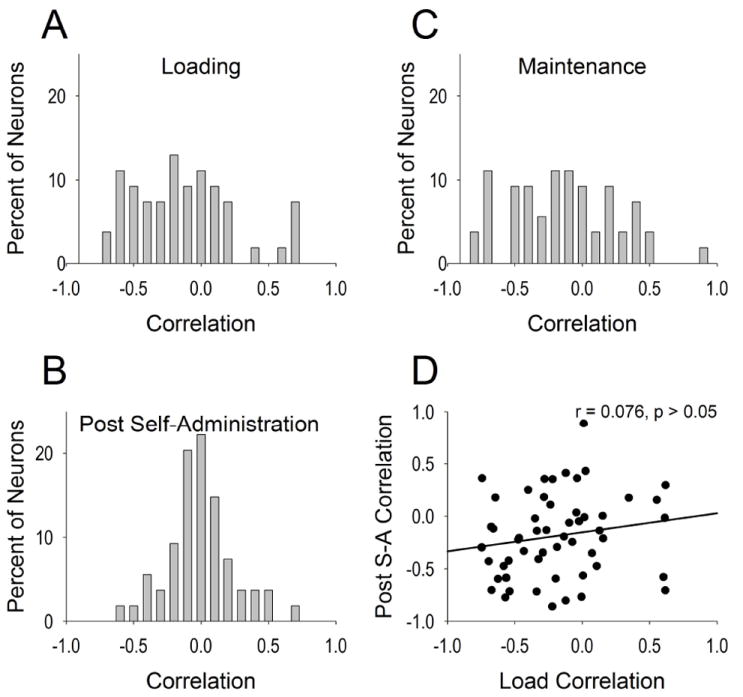
Correlation of firing rate and drug level over tonic timescale. X-axes refer to correlation of drug level and firing rate distributed across percent of neurons within VP (y-axes) for loading phase (A), maintenance phase (B), and post self-administration phase (C). Although similar in distribution, load correlation did not predict post self-administration correlation (D).
At the single neuron level, the correlation of drug level with firing rate during load did not predict the neuron’s correlation of drug level with firing rate during maintenance or post self-administration phases (r = 0.170, p > 0.05; Figure 7D). With respect to the load or post self-administration phases, many (n = 23, 11.11%) neurons that exhibited weak or no correlations (r < |0.4|) during one of these phases exhibited moderate or larger correlations (r ≥ |0.4|) in the other phase. A minority of neurons (n = 2, 3.70%) exhibited moderate or larger correlations (r ≥ |0.4|) during both phases but were opposite in directionality between the load and post-self administration. These differences were not due to distinct drug levels between phases. Although significantly different on average, t(53) = 9.93, p < 10-12, the difference in drug levels between load and post-self-administration phases was not substantive (average mean ± SEM: 2.91 ± 0.08 and 2.35 ± 0.05 mg/kg, respectively; average min ± SEM: 0.67 ± 0.01 and 1.06 ± 0.02 mg/kg, respectively; average max ± SEM: 4.21 ± 0.09 and 4.40 ± 0.09 mg/kg, respectively). Of the neurons that exhibited moderate or larger correlations between drug level and firing rate (r ≥ |0.4|) during the load or post self-administration phases, twenty-two occurred during the load phase (progressive reversals = 10; early reversals = 6, late reversals = 2; non-slow phasic firing pattern = 4) and twenty-one occurred during the post self-administration phase (progressive reversals = 14; early reversals = 1, late reversals = 2; non-slow phasic firing pattern = 4).
Discussion
NAcc neurons provide the primary afferent input to VP neurons (Heimer and Wilson, 1975; Heimer et al. 1991). As such, it was hypothesized that VP neurons would exhibit both slow phasic and tonic firing patterns similar to those within the NAcc (Fabbricatore et al. 2009, 2010). Over the inter-infusion interval, greater than three-quarters (79.63%) of VP neurons exhibited a slow phasic post-press change + reversal firing pattern. The majority of slow phasic changes consisted of a post-press decrease + progressive reversal pattern (51.16%). Other slow phasic firing patterns were observed, such as increase + progressive reversal (13.95%), decrease + early reversal (6.98%), increase + early reversal (18.60%), decrease + late reversal (9.30%), but not increase + late reversal. VP neurons also exhibited tonic changes in firing rate over the hours of self-administering cocaine, which typically consisted of a decrease in firing during self-administration and an increase in firing following lever removal. Approximately half (51.85%) of neurons exhibited tonic firing patterns consisting of a two-fold or greater change in firing.
Immediately upstream from the VP, early reversal patterns are more numerous among neurons recorded in medial NAcc (dorsomedial shell and rostral pole shell), whereas progressive and late reversal patterns are observed more often in lateral NAcc (core and ventrolateral shell) (Fabbricatore et al. 2010). An analysis of the subregional prevalences of tonic and slow phasic patterns was not possible in the current study due to the lack of identification of these subregions in the tissue marked by our recorded microwires. Future investigations employing more refined histological assessments of wires implanted in VP will be necessary in order to determine whether functional compartmentalization observed in the NAcc extends into its respective ventral pallidal subregional targets. Nevertheless, we observed significantly more progressive and late reversal slow phasic firing patterns posteriorly and more early reversal patterns anteriorly in VP. Together with the observation of Smith and Berridge (2005) that the duration of food consumption is increased posteriorly, but not anteriorly in VP following D-Ala2-N-Me-Phe4-Glycol5-enkephalin injection, these data suggest the possibility that VP may heterogeneously influence its targets along its anteroposterior axis (Kalivas et al. 1993; Geisler et al. 2007).
Similar to our prior investigations of NAcc neurons and the results of Nicola and Deadwyler (2000) who also recorded NAcc neurons during cocaine self-administration, VP neuron tonic firing rates were predominantly inversely related to calculated drug levels during distinct phases of self-administration. A subset of VP neurons exhibited moderate or higher correlations (r ≥ |0.4|) of firing rate and drug level during the maintenance phase of self-administration. Of these neurons, nearly all were categorized as the progressive reversal slow phasic firing pattern. Equally impressive was the strength of these correlations despite the narrow range of drug levels during maintenance. In the maintenance phase, behavior is highly regular during stable inter-infusion interval cycles of focused stereotypy, locomotion towards the lever followed by a lever-press/self-infusion, and locomotion away from the lever towards the locus of stereotypy. The slow phasic progressive reversal is correlated with the inter-infusion interval (Peoples and West, 1996), is independent of the locomotor cycle of behavior (Peoples et al, 1998) and has been linked to cycling drug level (Nicola and Deadwyler, 2000). The relationship of firing rates to cocaine level was negatively correlated within the NAcc and shifted to the right (toward higher cocaine levels) by D2 antagonism (Nicola and Deadwyler, 2000), suggesting that the cocaine-correlated fluctuations in firing involved a D2 mechanism. The present results demonstrate a selective, significant prevalence of correlations with drug level on the part of progressive reversal firing patterns, further strengthening their putative pharmacological underpinnings (although internal factors such as anticipation of the next self-infusion or processing of motivational afferent signals cannot be ruled out). Drug level is the prepotent stimulus regulating stable psychostimulant self-administration (Pickens and Thompson, 1968; Norman and Tsibulsky, 2006; Root et al. 2011). Thus, the slow phasic progressive reversal pattern within the NAcc (Peoples and West, 1996) and VP may constitute a mechanism that transduces fluctuating cocaine levels within a narrow range spanning between satiety and sub-satiety (Wise et al, 1995) into neural signals that influence drug seeking.
The present demonstration of similar slow phasic and tonic firing patterns between the NAcc and VP during self-administration is not trivial. The NAcc patterns that have been widely characterized would have questionable behavioral relevance themselves if there were no evidence of similar patterns in their main downstream target, VP. Indeed, similarity of VP firing patterns to those of their accumbal afferents was a prediction of the classic basal ganglia model (Alexander et al. 1986). The extent to which VP firing patterns during behavior reflect inversions of NAcc patterns through GABAergic projections (Walaas and Fonnum, 1979; Churchill et al. 1990; Zahm et al. 1985) remains to be determined. Given that NAcc neurons predominantly show decrease slow phasic and tonic firing patterns (Fabbricatore et al. 2009, 2010), one might have expected VP to exhibit more increase slow phasic and tonic firing patterns than observed here. In lieu of differential histological staining of VP subregions necessary to address this issue, one potential explanation might be that the core, which exhibits significantly more tonic increases in firing rate than the medial shell (Fabbricatore et al. 2009), predominantly influences the firing patterns of both the dorsolateral VP (the predominately core-receiving area) and ventromedial VP (the predominately shell-receiving area). An anatomical experiment suggest this possibility. Tracing single axons from NAcc neurons, Tripathi et al (2010) observed that between one third and nearly one half of core neurons collateralized within the ventromedial VP. Shell axons, in contrast, collateralized within the dorsolateral VP less often (approximately 12%). Within the NAcc core however, tonic increases or decreases in firing occur in nearly equal proportions (9/24 increases and 10/24 decreases; Fabbricatore et al. 2009). Furthermore, Johnson and Napier (1996) observed that microinfusions of procaine into the NAcc did not change the proportion of VP neurons that exhibited either firing rate increases or decreases in response to intravenous cocaine. Taken together, the observed VP firing patterns during cocaine self-administration were likely a result of GABAergic accumbal projections that were modulated either by colocalized peptides within the NAcc projection (discussed in Root et al. 2010) and/or throughput from other VP-projecting regions.
Slow phasic firing patterns of NAcc neurons are disrupted by systemic dopamine (DA) antagonism (Nicola and Deadwyler, 2000). VP is the recipient of dopaminergic projections from the VTA (Klitenick et al. 1992). Given that extracellular DA is elevated in VP by cocaine self-administration (Sizemore et al. 2000; Li et al. 2009), firing patterns may be similarly influenced among dopaminoceptive targets of the VTA. While DA is not the only neurotransmitter projected to VP, given its ability to modulate accumbal, amygdalar, and GABAergic and glutamatergic throughput as well as directly modulate firing of most VP neurons (Napier, 1992; Maslowski-Cobuzzi and Napier, 1994; Johnson and Napier, 1997; Mitrovic and Napier, 2002), dopamine may have been a contributor to VP slow phasic and tonic firing patterns during cocaine self-administration.
Dopamine has profound influence on VP firing rates (for reviews see Napier et al. 1991; Napier 1992, 1993). Furthermore, the dopamine transporter is often localized outside of axon terminals (Mengual and Pickel, 2004), suggesting dopaminergic projections (Klitenick et al. 1992) may affect populations of VP neurons by a volume mode of transmission. Most VP neurons exhibiting a response to VTA or SNc stimulation at monosynaptic latency (< 10 ms) do so in the form of decreases in firing; they also decrease firing rates following iontophoretic application of dopamine, and exhibit attenuated VTA- or SNc-stimulation-induced decreases in firing following iontophoretic application of dopaminergic antagonists (Maslowski-Cobuzzi and Napier, 1994; Mitrovic and Napier, 2002). This contrasts with the minority of neurons that increase firing rates in response to VTA/SNc stimulation. The latter neurons typically exhibit longer latencies (> 10 ms; Maslowski-Cobuzzi and Napier, 1994; Mitrovic and Napier, 2002) to increase firing, suggesting mesencephalic stimulation may postsynaptically disinhibit VP firing by suppressing NAcc activity. Furthermore, those VP neurons exhibiting a putative monosynaptic increase in firing following VTA/SNc stimulation are less likely to exhibit responses augmented by iontophoretically applied dopamine antagonists (Maslowski-Cobuzzi and Napier, 1994). Thus, it is plausible that the predominant slow phasic decrease + reversal and tonic decrease firing patterns observed during cocaine self-administration were affected at least in part by dopamine. While dopamine depletion abolishes VP responsiveness to VTA/SNc stimulation in general (Mitrovic and Napier, 2002), whether increasing slow phasic and tonic patterns are due to VTA-NAcc-VP disinhibition, VTA-VP excitation, disinhibition from local VP neurons exhibiting decreased firing rates, or other mechanisms is not understood. One potential mechanism may involve serotonin because extracellular serotonin concentrations in VP are increased comparably to dopamine during cocaine self-administration (Sizemore et al. 2000). Given that iontophoretic application of serotonergic agonists typically produces increases in VP firing (Heidenreich and Napier, 2000; Bengston et al. 2004), serotonin could be involved in the slow phasic increase + reversal and tonic increase firing patterns observed during cocaine self-administration.
Interestingly, despite similar ranges of drug levels, we found that the correlation of drug level and VP firing rate was not predictable between load and post self-administration periods. This result suggests that the observed correlation during loading is not purely pharmacologic but likely involves active self-administration behavior. This finding extends the observation that VP dopamine and glutamate turnover rates are altered following cocaine self-administration but not after yoked cocaine exposure (Smith et al. 2003). In other words, active self-administration behavior may play a role in the chemical and firing rate changes observed during self-administration. However, many behavioral differences between load and post self-administration phases may account for differences in drug level and firing rate correlations.
The lack of correlation between the directions of tonic and slow phasic changes may also reflect differential pharmacologic and behavioral influences. For example, if the sole influence on firing rate were strictly pharmacological, then tonic increase neurons would be expected to exhibit only post-press increase slow phasic patterns, consistent with the directionality of tonic firing rate change during the self-administration phase of the experiment. However, of the fourteen slow phasic post-press increase neurons, four (28.57%) exhibited at least a two-fold tonic decrease in firing suggesting that some other factor, perhaps mediated by afferent signaling, is effecting this opposite firing rate directionality. Evidence of dual pharmacological and behavioral influences on neural firing patterns is consistent with what we have previously observed in NAcc neurons (Fabbricatore et al., 2010) and may be a phenomenon common in ventral striatopallidal circuitry.
In conclusion, the VP exhibited both slow phasic and tonic firing patterns during cocaine self-administration. The majority of tonic firing patterns consisted of a decrease in firing and in the case of slow phasic firing patterns, neurons typically exhibited a decrease + progressive reversal over the inter-infusion interval. By virtue of its predominantly GABAergic projections to the mediodorsal thalamus (Zahm et al. 1996; Groenewegen et al. 1993; O’Donnell et al. 1997; Churchill et al. 1996) and mesencephalon (Kalivas et al. 1993; Groenewegen et al. 1993; Bell et al. 1995; Churchill et al. 1996; Bevan et al. 1996, 1997; see also Geisler et al. 2007), VP is positioned to modulate several systems that are critical for cocaine self-administration (Roberts and Koob, 1982; Roberts et al., 1977, 1980; Belin and Everitt, 2008; Goeders and Smith, 1983; McGregor et al. 1996). Thus, the predominant slow phasic decrease + reversal and tonic decrease firing patterns imply a disinhibitory influence of VP outputs upon its thalamocortical, mesocortical, and nigrostriatal targets. That is, once drug-seeking, the fluctuations in firing rates of NAcc and VP neurons as a function of changing drug levels may be one mechanism by which ongoing self-administration behavior is maintained.
Supplementary Material
Table 2.
Correlation matrix of all possible pairwise combinations of slow phasic firing rate patterns in VP neurons. This correlation matrix was used by the S Technique PCA to extract components that formed the basis of the taxonomy of the slow phasic firing rate profiles of individual neurons.
| Neuron | 01 | 02 | 03 | 04 | 05 | 06 | 07 | 08 | 09 | 10 | 11 | 12 | 13 | 14 | 15 |
|---|---|---|---|---|---|---|---|---|---|---|---|---|---|---|---|
| 01 | 1.00 | .90 | -.88 | .65 | .79 | .81 | .67 | .84 | -.73 | -.82 | .71 | -.60 | .51 | .63 | -.51 |
| 02 | 1.00 | -.77 | .69 | .78 | .84 | .72 | .82 | -.67 | -.80 | .71 | -.65 | .61 | .63 | -.49 | |
| 03 | 1.00 | -.73 | -.68 | -.76 | -.68 | -.70 | .62 | .73 | -.72 | .51 | -.46 | -.59 | .65 | ||
| 04 | 1.00 | .49 | .56 | .70 | .44 | -.56 | -.47 | .58 | -.44 | .53 | .40 | -.62 | |||
| 05 | 1.00 | .85 | .77 | .79 | -.55 | -.63 | .73 | -.67 | .51 | .60 | -.48 | ||||
| 06 | 1.00 | .84 | .85 | -.53 | -.77 | .92 | -.78 | .56 | .69 | -.44 | |||||
| 07 | 1.00 | .64 | -.45 | -.59 | .86 | -.69 | .56 | .55 | -.54 | ||||||
| 08 | 1.00 | -.53 | -.86 | .77 | -.70 | .59 | .63 | -.39 | |||||||
| 09 | 1.00 | .54 | -.42 | .46 | -.35 | -.48 | .22 | ||||||||
| 10 | 1.00 | -.72 | .57 | -.51 | -.67 | .38 | |||||||||
| 11 | 1.00 | -.72 | .60 | .62 | -.45 | ||||||||||
| 12 | 1.00 | -.50 | -.60 | .29 | |||||||||||
| 13 | 1.00 | .30 | -.25 | ||||||||||||
| 14 | 1.00 | -.36 | |||||||||||||
| 15 | 1.00 |
| Neuron | 16 | 17 | 18 | 19 | 20 | 21 | 22 | 23 | 24 | 25 | 26 | 27 | 28 | 29 | 30 |
|---|---|---|---|---|---|---|---|---|---|---|---|---|---|---|---|
| 01 | .63 | -.42 | -.45 | -.40 | .50 | .53 | .34 | -.50 | .13 | -.24 | -.11 | -.45 | -.63 | .43 | .56 |
| 02 | .61 | -.32 | -.51 | -.43 | .51 | .52 | .44 | -.52 | .20 | -.27 | -.07 | -.35 | -.64 | .46 | .66 |
| 03 | -.64 | .41 | .29 | .38 | -.49 | -.48 | -.15 | .27 | -.03 | .11 | .06 | .50 | .49 | -.31 | -.55 |
| 04 | .55 | -.39 | -.05 | -.22 | .25 | .25 | -.05 | -.05 | -.15 | -.05 | -.13 | -.53 | -.17 | .23 | .39 |
| 05 | .50 | -.45 | -.54 | -.59 | .67 | .73 | .54 | -.64 | .16 | -.22 | .02 | -.29 | -.56 | .48 | .53 |
| 06 | .73 | -.44 | -.76 | -.76 | .85 | .86 | .69 | -.68 | .41 | -.49 | .21 | -.05 | -.73 | .67 | .78 |
| 07 | .71 | -.47 | -.52 | -.68 | .69 | .72 | .42 | -.49 | .11 | -.37 | .19 | -.15 | -.52 | .54 | .66 |
| 08 | .61 | -.28 | -.75 | -.64 | .67 | .72 | .62 | -.75 | .38 | -.46 | .10 | -.07 | -.83 | .59 | .66 |
| 09 | -.35 | .33 | .18 | .08 | -.22 | -.20 | -.12 | .28 | .04 | -.01 | .15 | .47 | .35 | -.31 | -.35 |
| 10 | -.71 | .32 | .66 | .51 | -.60 | -.59 | -.51 | .61 | -.43 | .41 | -.11 | .09 | .85 | -.56 | -.71 |
| 11 | .80 | -.43 | -.73 | -.84 | .84 | .82 | .59 | -.65 | .40 | -.53 | .32 | .08 | -.74 | .67 | .81 |
| 12 | -.44 | .38 | .66 | .63 | -.65 | -.71 | -.57 | .61 | -.26 | .48 | -.23 | -.01 | .55 | -.61 | -.55 |
| 13 | .39 | -.34 | -.39 | -.51 | .40 | .42 | .28 | -.44 | .11 | -.24 | .21 | -.06 | -.50 | .47 | .47 |
| 14 | .47 | -.41 | -.52 | -.40 | .59 | .57 | .45 | -.50 | .43 | -.18 | .29 | -.09 | -.53 | .59 | .59 |
| 15 | -.35 | .33 | .03 | .21 | -.21 | -.29 | .08 | .08 | .27 | -.07 | .13 | .44 | .16 | -.07 | -.26 |
| 16 | 1.00 | -.20 | -.60 | -.65 | .65 | .59 | .42 | -.45 | .37 | -.50 | .19 | .11 | -.67 | .49 | .76 |
| 17 | 1.00 | .17 | .23 | -.35 | -.45 | -.14 | .17 | -.10 | -.05 | -.12 | .26 | .17 | -.40 | -.24 | |
| 18 | 1.00 | .84 | -.84 | -.83 | -.92 | .85 | -.73 | .71 | -.44 | -.52 | .88 | -.75 | -.77 | ||
| 19 | 1.00 | -.87 | -.87 | -.72 | .76 | -.50 | .61 | -.54 | -.45 | .72 | -.63 | -.74 | |||
| 20 | 1.00 | .91 | .80 | -.73 | .59 | -.64 | .48 | .30 | -.73 | .70 | .78 | ||||
| 21 | 1.00 | .77 | -.75 | .52 | -.57 | .40 | .25 | -.71 | .69 | .67 | |||||
| 22 | 1.00 | -.80 | .73 | -.62 | .38 | .46 | -.73 | .67 | .63 | ||||||
| 23 | 1.00 | -.51 | .60 | -.45 | -.35 | .81 | -.61 | -.63 | |||||||
| 24 | 1.00 | -.50 | .49 | .56 | -.62 | .63 | .57 | ||||||||
| 25 | 1.00 | -.39 | -.46 | .63 | -.51 | -.55 | |||||||||
| 26 | 1.00 | .60 | -.32 | .48 | .45 | ||||||||||
| 27 | 1.00 | -.29 | .32 | .27 | |||||||||||
| 28 | 1.00 | -.67 | -.79 | ||||||||||||
| 29 | 1.00 | .71 | |||||||||||||
| 30 | 1.00 |
| Neuron | 31 | 32 | 33 | 34 | 35 | 36 | 37 | 38 | 39 | 40 | 41 | 42 | 43 | 44 | 45 |
|---|---|---|---|---|---|---|---|---|---|---|---|---|---|---|---|
| 01 | .15 | .36 | .10 | .01 | .19 | -.19 | .28 | .19 | .25 | .48 | -.11 | .34 | .04 | -.04 | .22 |
| 02 | .17 | .37 | .17 | .03 | .36 | .01 | .46 | .22 | .27 | .55 | -.14 | .32 | -.09 | .06 | .31 |
| 03 | -.13 | -.26 | .01 | -.04 | -.06 | .18 | -.22 | -.04 | -.12 | -.28 | -.08 | -.20 | .17 | .10 | -.09 |
| 04 | -.01 | .07 | -.02 | -.20 | .17 | -.11 | .34 | -.12 | -.05 | .16 | .30 | .04 | -.29 | .12 | .05 |
| 05 | .32 | .42 | .11 | .13 | .22 | -.27 | .05 | .07 | .28 | .55 | -.21 | .13 | -.15 | -.05 | .14 |
| 06 | .44 | .53 | .30 | .26 | .29 | .10 | .35 | .27 | .26 | .52 | -.15 | .19 | -.11 | .00 | .31 |
| 07 | .41 | .32 | .13 | .09 | .22 | .02 | .27 | .14 | .15 | .40 | -.09 | .17 | -.19 | -.05 | .11 |
| 08 | .30 | .52 | .34 | .16 | .33 | .07 | .38 | .43 | .34 | .54 | -.40 | .25 | .02 | -.11 | .22 |
| 09 | .05 | -.12 | .07 | .06 | -.13 | .20 | -.11 | .05 | -.13 | -.27 | -.01 | -.32 | .02 | -.01 | -.26 |
| 10 | -.32 | -.46 | -.32 | -.11 | -.40 | -.24 | -.40 | -.40 | -.33 | -.42 | .31 | -.36 | -.04 | .10 | -.39 |
| 11 | .45 | .49 | .42 | .25 | .26 | .24 | .35 | .29 | .17 | .45 | -.18 | .13 | -.13 | -.05 | .23 |
| 12 | -.32 | -.39 | -.20 | -.08 | -.12 | -.09 | -.33 | -.11 | -.18 | -.47 | .13 | -.02 | .08 | .01 | -.46 |
| 13 | .27 | .43 | .18 | .02 | .29 | .12 | .42 | .27 | -.02 | .36 | -.14 | .16 | .00 | -.23 | .06 |
| 14 | .38 | .55 | .14 | .21 | .14 | .08 | .14 | .14 | -.01 | .36 | -.17 | .24 | .10 | -.01 | .39 |
| 15 | -.09 | -.09 | .02 | -.01 | .04 | .25 | -.13 | .22 | -.08 | -.33 | -.15 | -.02 | .22 | .05 | .14 |
| 16 | .32 | .39 | .46 | .03 | .44 | .39 | .49 | .45 | .14 | .28 | -.14 | .23 | -.04 | -.02 | .11 |
| 17 | -.25 | -.21 | .12 | -.27 | .04 | .25 | .20 | .13 | -.05 | -.07 | -.11 | -.12 | -.09 | .18 | -.20 |
| 18 | -.52 | -.62 | -.63 | -.38 | -.43 | -.52 | -.41 | -.60 | -.37 | -.53 | .51 | -.18 | -.12 | -.02 | -.43 |
| 19 | -.52 | -.57 | -.58 | -.37 | -.29 | -.38 | -.34 | -.44 | -.12 | -.44 | .33 | .03 | .00 | .07 | -.20 |
| 20 | .52 | .55 | .43 | .39 | .26 | .28 | .20 | .37 | .26 | .43 | -.19 | .09 | .01 | .03 | .36 |
| 21 | .58 | .58 | .43 | .42 | .26 | .16 | .16 | .31 | .25 | .47 | -.22 | .02 | -.03 | -.03 | .33 |
| 22 | .50 | .59 | .53 | .41 | .48 | .40 | .28 | .49 | .44 | .54 | -.48 | .12 | .04 | .16 | .43 |
| 23 | -.35 | -.61 | -.48 | -.38 | -.32 | -.27 | -.26 | -.50 | -.30 | -.63 | .54 | -.18 | -.13 | -.01 | -.38 |
| 24 | .34 | .53 | .63 | .39 | .41 | .58 | .28 | .55 | .23 | .18 | -.35 | .12 | .18 | .16 | .46 |
| 25 | -.34 | -.28 | -.52 | -.22 | -.28 | -.50 | -.49 | -.59 | -.27 | -.35 | .19 | -.07 | -.03 | -.11 | -.42 |
| 26 | .42 | .50 | .37 | .43 | .07 | .52 | .27 | .34 | -.13 | .10 | -.20 | .11 | .26 | -.08 | .28 |
| 27 | .31 | .29 | .60 | .33 | .21 | .77 | .24 | .50 | .02 | .03 | -.37 | -.03 | .23 | -.05 | .13 |
| 28 | -.42 | -.57 | -.55 | -.28 | -.46 | -.43 | -.41 | -.60 | -.39 | -.56 | .53 | -.32 | -.17 | .05 | -.42 |
| 29 | .55 | .56 | .48 | .37 | .28 | .38 | .30 | .33 | .25 | .39 | -.27 | .46 | .19 | -.10 | .38 |
| 30 | .37 | .51 | .53 | .37 | .45 | .51 | .53 | .48 | .25 | .50 | -.25 | .31 | .04 | .00 | .37 |
| 31 | 1.00 | .41 | .26 | .33 | .16 | .32 | .14 | .22 | -.05 | .27 | -.26 | .21 | .07 | -.17 | .16 |
| 32 | 1.00 | .44 | .37 | .33 | .29 | .27 | .25 | .18 | .31 | -.31 | .20 | .22 | -.13 | .35 | |
| 33 | 1.00 | .37 | .52 | .64 | .47 | .54 | .22 | .36 | -.37 | .09 | .17 | .08 | .25 | ||
| 34 | 1.00 | .10 | .19 | -.04 | .15 | .13 | .20 | -.11 | .05 | -.05 | -.11 | .26 | |||
| 35 | 1.00 | .44 | .45 | .51 | .25 | .37 | -.36 | .16 | -.05 | .02 | .13 | ||||
| 36 | 1.00 | .61 | .56 | .02 | .03 | -.26 | .15 | .12 | .03 | .31 | |||||
| 37 | 1.00 | .51 | -.01 | .33 | -.12 | .22 | .06 | .05 | .16 | ||||||
| 38 | 1.00 | .13 | .20 | -.52 | .30 | .37 | -.07 | .02 | |||||||
| 39 | 1.00 | .31 | -.33 | .29 | .06 | .20 | .27 | ||||||||
| 40 | 1.00 | -.44 | .19 | .00 | .18 | .23 | |||||||||
| 41 | 1.00 | -.21 | -.24 | .05 | .02 | ||||||||||
| 42 | 1.00 | .46 | -.33 | .05 | |||||||||||
| 43 | 1.00 | -.05 | .11 | ||||||||||||
| 44 | 1.00 | .29 | |||||||||||||
| 45 | 1.00 |
| Neuron | 46 | 47 | 48 | 49 | 50 | 51 | 52 | 53 | 54 |
|---|---|---|---|---|---|---|---|---|---|
| 01 | .46 | .14 | .42 | -.53 | -.32 | -.06 | .34 | -.04 | .02 |
| 02 | .57 | .24 | .46 | -.35 | -.19 | -.16 | .25 | -.10 | .08 |
| 03 | -.30 | .02 | -.38 | .51 | .35 | .08 | -.35 | -.08 | -.09 |
| 04 | .22 | .08 | .45 | -.44 | -.31 | -.19 | .17 | .00 | .02 |
| 05 | .36 | -.02 | .19 | -.24 | -.12 | -.29 | .45 | -.10 | .09 |
| 06 | .39 | .11 | .37 | -.32 | -.07 | -.27 | .40 | -.15 | .04 |
| 07 | .11 | .13 | .42 | -.23 | -.04 | -.33 | .43 | -.11 | .06 |
| 08 | .38 | .19 | .33 | -.36 | -.16 | -.09 | .26 | -.18 | .13 |
| 09 | -.47 | -.09 | -.18 | .33 | .09 | .06 | -.25 | .01 | .17 |
| 10 | -.47 | -.14 | -.31 | .48 | .22 | .02 | -.38 | .20 | -.14 |
| 11 | .18 | .13 | .47 | -.37 | -.09 | -.35 | .41 | -.16 | .17 |
| 12 | -.26 | -.26 | -.24 | .05 | -.10 | .23 | -.42 | .05 | -.03 |
| 13 | .10 | .18 | .41 | -.26 | .07 | -.14 | .16 | -.08 | .12 |
| 14 | .45 | -.03 | .26 | -.32 | .03 | -.22 | .18 | -.25 | .14 |
| 15 | -.16 | -.09 | -.15 | .35 | .21 | .35 | -.09 | -.02 | -.24 |
| 16 | .14 | .18 | .46 | -.50 | -.10 | -.19 | .39 | -.28 | .06 |
| 17 | -.13 | .14 | -.11 | .16 | .12 | .15 | -.18 | .17 | -.19 |
| 18 | -.29 | -.21 | -.25 | .09 | -.16 | .18 | -.27 | .32 | -.06 |
| 19 | .07 | -.13 | -.31 | .17 | -.14 | .40 | -.37 | .23 | -.03 |
| 20 | .19 | -.02 | .27 | -.19 | .05 | -.27 | .38 | -.23 | .07 |
| 21 | .20 | -.05 | .17 | -.24 | .01 | -.32 | .38 | -.22 | .10 |
| 22 | .41 | .08 | .12 | .05 | .17 | -.15 | .25 | -.28 | .00 |
| 23 | -.28 | -.10 | -.17 | .14 | -.17 | .28 | -.26 | .17 | -.08 |
| 24 | .30 | .02 | .15 | -.10 | .09 | -.10 | -.02 | -.37 | .07 |
| 25 | -.09 | -.29 | -.44 | .11 | -.01 | .09 | -.20 | .05 | -.04 |
| 26 | -.24 | -.07 | .08 | -.01 | .32 | -.44 | .05 | .04 | -.04 |
| 27 | -.24 | .12 | -.09 | .19 | .49 | -.16 | -.04 | -.24 | .00 |
| 28 | -.35 | -.17 | -.35 | .32 | .01 | .09 | -.30 | .22 | -.17 |
| 29 | .21 | .14 | .32 | -.24 | .19 | -.13 | .30 | -.27 | .14 |
| 30 | .25 | .21 | .54 | -.24 | .09 | -.25 | .30 | -.15 | .11 |
| 31 | -.02 | .08 | .15 | -.15 | .10 | -.10 | .38 | -.23 | .11 |
| 32 | .25 | .06 | .17 | -.27 | .15 | -.30 | .10 | -.35 | -.06 |
| 33 | .16 | .22 | .26 | -.30 | .16 | -.28 | .08 | -.36 | .03 |
| 34 | .14 | -.03 | .05 | -.10 | .15 | -.21 | .06 | -.14 | .11 |
| 35 | .42 | -.01 | .17 | -.05 | .15 | -.06 | .11 | -.33 | .04 |
| 36 | .02 | .27 | .20 | .01 | .30 | -.13 | .00 | -.25 | .04 |
| 37 | .15 | .55 | .47 | -.18 | .19 | -.11 | -.04 | .04 | -.14 |
| 38 | .07 | .13 | .34 | -.10 | .19 | .03 | -.08 | -.19 | .00 |
| 39 | .44 | .08 | -.02 | .03 | -.21 | .14 | .20 | -.08 | .05 |
| 40 | .41 | .23 | .29 | -.08 | .17 | -.13 | .20 | .03 | .14 |
| 41 | -.09 | -.12 | -.06 | -.18 | -.21 | -.04 | -.07 | .16 | -.10 |
| 42 | .25 | .12 | .20 | -.24 | .13 | .17 | .12 | -.07 | .07 |
| 43 | -.07 | .11 | .11 | -.15 | .23 | .09 | -.23 | -.09 | -.21 |
| 44 | .29 | .04 | .11 | -.02 | -.17 | -.01 | -.18 | .01 | -.13 |
| 45 | .49 | .10 | .15 | -.03 | -.09 | -.12 | .20 | -.09 | -.09 |
| 46 | 1.00 | -.06 | .01 | -.17 | -.07 | .00 | .04 | -.13 | .02 |
| 47 | 1.00 | .34 | -.01 | .20 | .04 | -.04 | -.23 | -.14 | |
| 48 | 1.00 | -.26 | -.22 | .01 | .04 | .02 | .15 | ||
| 49 | 1.00 | .33 | -.03 | -.21 | .16 | -.04 | |||
| 50 | 1.00 | -.14 | -.06 | -.05 | -.21 | ||||
| 51 | 1.00 | .06 | .03 | .05 | |||||
| 52 | 1.00 | .10 | -.03 | ||||||
| 53 | 1.00 | -.16 | |||||||
| 54 | 1.00 |
Table 3.
Eigenvalues and their associated percentages of variance for the initial and varimax rotated solutions for the Stage 1 PCA. The first four components retained for the Stage 2 analysis collectively are associated with approximately 55% of the total variance among all neurons.
| Initial PCA Extraction | Varimax Rotated PCA | |||||
|---|---|---|---|---|---|---|
| Component | Eigenvalue | % of Variance | Cumulative % of Variance | (Rotated) Eigenvalue | % of Variance | Cumulative % of Variance |
| 1 | 19.12 | 35.40 | 35.40 | 11.95 | 22.13 | 22.13 |
| 2 | 7.16 | 13.26 | 48.66 | 11.77 | 21.80 | 43.93 |
| 3 | 3.23 | 5.98 | 54.64 | 3.42 | 6.34 | 50.27 |
| 4 | 2.86 | 5.30 | 59.94 | 2.74 | 5.08 | 55.35 |
| 5 | 2.28 | 4.22 | 64.16 | 2.34 | 4.33 | 59.68 |
| 6 | 2.01 | 3.72 | 67.88 | 2.08 | 4.23 | 63.91 |
| 7 | 1.89 | 3.50 | 71.38 | 2.09 | 3.88 | 67.79 |
| 8 | 1.64 | 3.04 | 74.42 | 1.96 | 3.62 | 71.41 |
| 9 | 1.34 | 2.49 | 76.91 | 1.84 | 3.40 | 74.81 |
| 10 | 1.32 | 2.44 | 79.35 | 1.69 | 3.13 | 77.94 |
| 11 | 1.23 | 2.28 | 81.63 | 1.59 | 2.94 | 80.88 |
| 12 | 1.15 | 2.12 | 83.75 | 1.55 | 2.88 | 83.75 |
Table 4.
The loadings of neurons on the components extracted during stage 1 of the PCA based categorization procedure for slow phasic firing rate patterns. The first four components retained for the final PCA solution in the Stage 2 analysis are associated with approximately 65% of the total variance among all neurons.
| Components | ||||||||||||
|---|---|---|---|---|---|---|---|---|---|---|---|---|
| Neuron | 1† | 2† | 3† | 4† | 5 | 6 | 7 | 8 | 9 | 10 | 11 | 12 |
| 01* | .906 | |||||||||||
| 02* | .894 | |||||||||||
| 03* | -.877 | |||||||||||
| 04* | .828 | |||||||||||
| 05* | .794 | .336 | ||||||||||
| 06* | .782 | .548 | ||||||||||
| 07* | .768 | .384 | ||||||||||
| 08* | .747 | .461 | .325 | |||||||||
| 09* | -.746 | |||||||||||
| 10* | -.712 | -.373 | ||||||||||
| 11* | .700 | .609 | ||||||||||
| 12* | -.633 | -.488 | ||||||||||
| 13* | .633 | |||||||||||
| 14* | .630 | .373 | ||||||||||
| 15* | -.593 | -.508 | ||||||||||
| 16* | .580 | .433 | .395 | -.346 | ||||||||
| 17* | -.470 | .416 | ||||||||||
| 18* | -.859 | |||||||||||
| 19* | -.353 | -.851 | ||||||||||
| 20* | .436 | .824 | ||||||||||
| 21* | .464 | .795 | ||||||||||
| 22* | .792 | .361 | ||||||||||
| 23* | -.361 | -.743 | -.367 | |||||||||
| 24* | .718 | .348 | ||||||||||
| 25* | -.705 | -.329 | ||||||||||
| 26* | .697 | -.330 | .330 | |||||||||
| 27* | -.549 | .684 | .326 | |||||||||
| 28* | -.459 | -.677 | ||||||||||
| 29* | .356 | .673 | .358 | |||||||||
| 30* | .502 | .613 | .354 | |||||||||
| 31* | .586 | |||||||||||
| 32* | .572 | |||||||||||
| 33* | .569 | .504 | ||||||||||
| 34* | .480 | .425 | ||||||||||
| 35* | .765 | |||||||||||
| 36* | .498 | .678 | ||||||||||
| 37* | .655 | .520 | ||||||||||
| 38* | .521 | .550 | -.336 | |||||||||
| 39* | .717 | |||||||||||
| 40* | .390 | .587 | ||||||||||
| 41* | -.398 | -.546 | ||||||||||
| 42 | .831 | |||||||||||
| 43 | .585 | -.514 | ||||||||||
| 44 | -.545 | .471 | ||||||||||
| 45* | .375 | .809 | ||||||||||
| 46* | .387 | .458 | .634 | |||||||||
| 47 | .908 | |||||||||||
| 48* | .387 | .476 | ||||||||||
| 49* | -.383 | .750 | ||||||||||
| 50 | .621 | |||||||||||
| 51 | -.736 | |||||||||||
| 52 | .774 | |||||||||||
| 53 | -.910 | |||||||||||
| 54 | .886 | |||||||||||
Note: Varimax rotation with Kaiser normalization was used.
Indicates the retained components that were used for determining which neurons would be retained for Stage 2 of the PCA based initial categorization method for slow phasic firing rate patterns.
Indicates the individual neurons that were retained for Stage 2 of the PCA based categorization method.
Table 5.
Eigenvalues and their associated percentages of variance for the initial and varimax rotated solutions for the Stage 2 PCA.
| Initial PCA Extraction | Varimax Rotated PCA | |||||
|---|---|---|---|---|---|---|
| Component | Eigenvalue | % of Variance | Cumulative % of Variance | (Rotated) Eigenvalue | % of Variance | Cumulative % of Variance |
| 1 | 18.73 | 41.61 | 41.61 | 12.09 | 26.87 | 26.87 |
| 2 | 6.81 | 15.14 | 56.75 | 9.47 | 21.04 | 47.90 |
| 3 | 2.81 | 6.24 | 62.98 | 4.71 | 10.47 | 58.38 |
| 4 | 2.67 | 5.94 | 68.93 | 3.02 | 6.71 | 65.08 |
| 5 | 1.83 | 4.06 | 72.99 | 2.48 | 5.51 | 70.59 |
| 6 | 1.39 | 3.10 | 76.08 | 1.96 | 4.36 | 74.95 |
| 7 | 1.23 | 2.73 | 78.81 | 1.55 | 3.44 | 78.39 |
| 8 | 1.10 | 2.45 | 81.27 | 1.30 | 2.88 | 81.27 |
Table 6.
The loadings of neurons on the components extracted during stage 2 of the PCA based categorization procedure for slow phasic firing rate patterns.
| Components | ||||||||
|---|---|---|---|---|---|---|---|---|
| Neuron | 1† | 2† | 3† | 4† | 5 | 6 | 7 | 8 |
| 01* | .926 | |||||||
| 03* | -.905 | |||||||
| 02* | .873 | |||||||
| 04* | .817 | -.344 | ||||||
| 07* | .805 | .378 | ||||||
| 05* | .802 | .326 | ||||||
| 06* | .801 | .507 | ||||||
| 08* | .762 | .321 | .418 | |||||
| 11* | .744 | .562 | ||||||
| 10* | -.723 | |||||||
| 09* | -.714 | -.410 | ||||||
| 12* | -.646 | -.426 | .429 | |||||
| 16* | .628 | .484 | ||||||
| 15* | -.625 | -.433 | ||||||
| 14* | .597 | .426 | .386 | |||||
| 13* | .594 | -.365 | ||||||
| 17* | -.462 | -.349 | .373 | |||||
| 21* | .503 | .783 | ||||||
| 19* | -.401 | -.774 | ||||||
| 20* | .481 | .774 | ||||||
| 26* | .739 | -.355 | ||||||
| 18* | -.324 | -.722 | -.327 | -.366 | ||||
| 22* | .694 | .366 | .344 | |||||
| 29* | .369 | .684 | ||||||
| 31* | .667 | |||||||
| 34* | .661 | |||||||
| 24* | .636 | .323 | .387 | |||||
| 23* | -.371 | -.621 | -.477 | |||||
| 27* | -.534 | .619 | .411 | |||||
| 32* | .616 | |||||||
| 30* | .515 | .547 | .484 | |||||
| 28* | -.487 | -.509 | -.344 | -.451 | ||||
| 37* | .843 | |||||||
| 36* | .404 | .767 | ||||||
| 38* | .588 | .554 | ||||||
| 33* | .493 | .587 | ||||||
| 25* | -.484 | -.566 | -.339 | |||||
| 48* | .427 | .551 | ||||||
| 35* | .527 | .353 | .383 | |||||
| 41* | -.841 | |||||||
| 45* | .343 | .772 | ||||||
| 46 | .731 | .340 | ||||||
| 39 | .744 | |||||||
| 49* | -.436 | -.745 | ||||||
| 40* | .386 | .535 | ||||||
Note: Varimax rotation with Kaiser normalization was used.
Indicates the retained components that were used for determining which neurons would be retained for Stage 2 of the PCA based initial categorization method for slow phasic firing rate patterns.
Indicates the individual neurons that were retained after the Stage 2 PCA analysis for the final solution.
Acknowledgments
This study was supported by the National Institute on Drug Abuse Grants DA 006886 and DA 026252 and the National Institute of Mental Health Grant MH 0919957. The funders had no role in study design, data collection and analysis, decision to publish, or preparation of the manuscript. We thank Linda King, Thomas Grace Sr., Jackie D. Thomas, Smruti Patel, Karina Gotliboym, Dana Silagi, Samir Kumar, Alyssa Ames, and Abigail Klein for technical assistance.
Abbreviations
- NAcc
nucleus accumbens
- VP
ventral pallidum
- VTA
ventral tegmental area
Appendix
Orthogonality
A pilot analysis was conducted to determine if the components of the PCA solution for the slow phasic firing rate data were orthogonal. Components may not always be truly orthogonal, and forcing an orthogonal solution on a set of nonorthogonal components can be problematic, leading to inaccurate conclusions (Gorsuch, 1983; Tabachnick & Fidell, 1989). The slow phasic firing rate data from a previously published report (Fabbricatore et al. 2010) were subjected to two different kinds of oblique rotations: direct oblimin (δ = 0) and promax (κ = 4). When forcing an orthogonal solution, it is ideal to have none or almost none of the intercorrelations meet the criteria of (r > |0.30|) among a set of extracted oblique components (Gorsuch, 1983; Tabacnick & Fidell, 1989). For the direct oblimin solution, it was found that no pairwise intercorrelations among the 12 retained components were r > |0.30|. For the promax solution, it was found among the 12 retained components (eigenvalue > 1) that most intercorrelations (59 / 66) were (r < |0.30|), (6 / 66) intercorrelations were (|0.3| ≤ r < |0.4|) and (1 / 66) was (|.4| ≤ r < |0.5|). Thus, an orthogonal solution to the PCA was justified and applied to the present VP dataset.
Rationale for utilizing the two stage approach
The two stage approach was used because pilot analyses showed that forcing the final PCA solution to include a specific small number of components based on an examination of the scree plot and other criteria from an initial PCA run, as recommended in the PCA literature (see for example, Comrey, 1973; Gorsuch, 1983; Tabachnick & Fidell, 1989), led to the inclusion of neurons whose firing patterns clearly did not conform to any interpretable pattern(s) as defined by previous research (Peoples and West, 1996; Peoples et al. 1998; Fabbricatore et al. 2010). In other words, neurons exhibiting noninterpretable patterns were found to have loadings ≥ |.32| on the final retained components. One possible solution to this problem would be to screen neurons before the PCA was conducted in order to determine if their patterns were interpretable based on previous research (Peoples and West, 1996; Peoples et al. 1998; Fabbricatore et al. 2010). However, this solution was rejected because it required creating inclusion and exclusion criteria for the PCA dataset that ultimately depended on subjective visual inspection. The solution was a two stage analytical approach, as described above. In the two stage approach, neurons that that did not exhibit interpretable slow phasic firing patterns were isolated by allowing them to load highly on their own unique components, and thus, it enabled these neurons to be passively filtered out of the analysis. Furthermore, by utilizing the previously used slow phasic assessment procedure (Peoples and West, 1996; Peoples et al. 1998; Fabbricatore et al. 2010), it was confirmed that the neurons that were removed in the two stage approach failed to meet the criteria for slow phasic change in firing.
Concordance of phasic firing pattern assessments with previous results
The results of the previously used slow phasic assessment procedure (Peoples and West, 1996; Peoples et al. 1998; Fabbricatore et al. 2010) were compared with the results of the new reversal assessment procedure by using each procedure to analyze the same data set, i.e, our recently published dataset of individual neurons recorded from the NAcc (Fabbricatore et al. 2010). Because we previously assessed directionality and reversal type at the individual neuron level, the new reversal assessment procedure was also applied at the individual neuron level for purposes of directly comparing the results with the previous methodology. Cross-tabulation tables were created separately for directionality (increase or decrease) and reversal type (early, progressive and late), in which the firing pattern assessments using the previous procedure were plotted against those of the new procedure. A concordance statistic, Cohen’s κ (Stokes et al. 2009), was computed for each cross-tabulation table to test the degree of similarity between the results of the previous and new reversal procedures. The previous and new procedures for determining post-press change in directionality (increase or decrease) were significantly concordant, Cohen’s κ = 0.956, p < 0.0001.
Two different comparisons were made in assessing the two procedures for determining reversal types. In our most recent report of phasic firing in the accumbens (Fabbricatore et al. 2010), progressive and late reversal patterns were collapsed into one category for the purpose of comparisons with neurons exhibiting early reversal patterns. We have maintained that categorization here and have termed it the “liberal comparison”. The previous and new procedures for determining reversal type for the liberal comparison were significantly concordant, Cohen’s κ = 0.361, p = 0.003. In the other comparison, known as the “conservative comparison”, the progressive and late reversals were kept separate. The previous and new procedures for determining reversal type for the conservative comparison were significantly concordant, Cohen’s κ = 0.261, p = 0.009. Thus concordance analyses indicate that the results of the previous and new methods for determining post-press change direction, liberal comparison of reversal and conservative comparison of reversal were all statistically similar.
Literature Cited
- Alexander GE, DeLong MR, Strick PL. Parallel organization of functionally segregated circuits linking basal ganglia and cortex. Annu Rev Neurosci. 1986;9:357–381. doi: 10.1146/annurev.ne.09.030186.002041. [DOI] [PubMed] [Google Scholar]
- Belin D, Everitt BJ. Cocaine seeking habits depend upon dopamine-dependent serial connectivity linking the ventral with the dorsal striatum. Neuron. 2008;57(3):432–441. doi: 10.1016/j.neuron.2007.12.019. [DOI] [PubMed] [Google Scholar]
- Bell K, Churchill L, Kalivas PW. GABAergic projection from the ventral pallidum and globus pallidus to the subthalamic nucleus. Synapse. 1995;20(1):10–18. doi: 10.1002/syn.890200103. [DOI] [PubMed] [Google Scholar]
- Bengston CP, Lee DJ, Osborne PB. Opposing Electrophysiological Actions of 5-HT on Noncholinergic and Cholinergic Neurons in the Rat Ventral Pallidum In Vitro. J Neurophysiol. 2004;92:433–443. doi: 10.1152/jn.00543.2003. [DOI] [PubMed] [Google Scholar]
- Bevan MD, Smith AD, Bolam JP. The substantia nigra as a site of synaptic integration of functionally diverse information arising from the ventral pallidum and the globus pallidus in the rat. Neuroscience. 1996;75(1):5–12. doi: 10.1016/0306-4522(96)00377-6. [DOI] [PubMed] [Google Scholar]
- Bevan MD, Clarke NP, Bolam JP. Synaptic Integration of Functionally Diverse Pallidal Information in the Entopeduncular Nucleus and Subthalamic Nucleus in the Rat. J Neurosci. 1997;17(1):308–324. doi: 10.1523/JNEUROSCI.17-01-00308.1997. [DOI] [PMC free article] [PubMed] [Google Scholar]
- Brog JS, Salyapongse A, Deutch AY, Zahm DS. The patterns of afferent innervation of the core and shell in the “accumbens” part of the rat ventral striatum: immunohistochemical detection of retrogradely transported fluoro-gold. J Comp Neurol. 1992;338:255–278. doi: 10.1002/cne.903380209. [DOI] [PubMed] [Google Scholar]
- Chrobak JJ, Napier TC. Opioid and GABA modulation of accumbens-evoked ventral pallidal activity. J Neural Transm [GenSect] 1993;93:123–143. doi: 10.1007/BF01245342. [DOI] [PubMed] [Google Scholar]
- Churchill L, Dilts RP, Kalivas PW. Changes in gamma-aminobutyric acid, mu-opioid and neurotensin receptors in the accumbens-pallidal projection after discrete quinolinic acid lesions in the nucleus accumbens. Brain Res. 1990;511(1):41–54. doi: 10.1016/0006-8993(90)90223-x. [DOI] [PubMed] [Google Scholar]
- Churchill L, Zahm DS, Kalivas PW. The mediodorsal nucleus of the thalamus in rats--I. forebrain gabaergic innervation. Neuroscience. 1996;70(1):83–102. doi: 10.1016/0306-4522(95)00351-i. [DOI] [PubMed] [Google Scholar]
- Comrey AL. A First Course on Factor Analysis. New York, NY: Academic Press; 1962. [Google Scholar]
- Fabbricatore AT, Ghitza UE, Prokopenko VF, West MO. Electrophysiological evidence of mediolateral functional dichotomy in the rat accumbens during cocaine self-administration: tonic firing patterns. Eur J Neurosci. 2009;30:2387–2400. doi: 10.1111/j.1460-9568.2009.07033.x. [DOI] [PMC free article] [PubMed] [Google Scholar]
- Fabbricatore AT, Ghitza UE, Prokopenko VF, West MO. Electrophysiological evidence of mediolateral functional dichotomy in the rat accumbens during cocaine self-administration II : phasic firing patterns. Eur J Neurosci. 2010;31:1671–1682. doi: 10.1111/j.1460-9568.2010.07230.x. [DOI] [PMC free article] [PubMed] [Google Scholar]
- Fuller TA, Russchen FT, Price JL. Sources of presumptive glutamergic/aspartergic afferents to the rat ventral striatopallidal region. J Comp Neurol. 1987;258(3):317–338. doi: 10.1002/cne.902580302. [DOI] [PubMed] [Google Scholar]
- Geisler S, Derst C, Veh RW, Zahm DS. Glutamatergic afferents of the ventral tegmental area in the rat. J Neurosci. 2007;27:5730–5743. doi: 10.1523/JNEUROSCI.0012-07.2007. [DOI] [PMC free article] [PubMed] [Google Scholar]
- Ghitza UE, Fabbricatore AT, Prokopenko V, Pawlak AP, West MO. Persistent cue-evoked activity of accumbens neurons after prolonged abstinence from self-administered cocaine. J Neurosci. 2003;23(19):7239–7245. doi: 10.1523/JNEUROSCI.23-19-07239.2003. [DOI] [PMC free article] [PubMed] [Google Scholar]
- Ghitza UE, Fabbricatore AT, Prokopenko VF, West MO. Differences between accumbens core and shell neurons exhibiting phasic firing patterns related to drug-seeking behavior during a discriminative stimulus task. J Neurophysiol. 2004;92:1608–1614. doi: 10.1152/jn.00268.2004. [DOI] [PubMed] [Google Scholar]
- Ghitza UE, Prokopenko VF, West MO, Fabbricatore AT. Higher magnitude accumbal phasic firing changes among core neurons exhibiting tonic firing increases during cocaine self-administration. Neuroscience. 2006;137:1075–1085. doi: 10.1016/j.neuroscience.2005.10.026. [DOI] [PubMed] [Google Scholar]
- Goeders NE, Smith JE. Cortical dopamine involvement in cocaine reinforcement. Science. 1983;221(4612):773–775. doi: 10.1126/science.6879176. [DOI] [PubMed] [Google Scholar]
- Gorsuch RK. Factor Analysis. second edition. Hillsdale, NJ: Lawrence Erlbaum Associates; 1983. [Google Scholar]
- Groenewegen HJ, Berendse HW, Haber SN. Organization of the output of the ventral striatopallidal system in the rat: ventral pallidal efferents. Neuroscience. 1993;57(1):113–142. doi: 10.1016/0306-4522(93)90115-v. [DOI] [PubMed] [Google Scholar]
- Heidenreich BA, Napier TC. Effects of serotonergic 5-HT1A and 5-HT1B ligands on ventral pallidal neuronal activity. Neuroreport. 2000;11(13):2849–2853. doi: 10.1097/00001756-200009110-00005. [DOI] [PubMed] [Google Scholar]
- Heimer L, Wilson RD. The subcortical projections of the allocortex: similarities in the neural associations of the hippocampus, the piriform cortex, and the neocortex. In: Santini M, editor. Golgi Centennial Symposium. Raven Press; New York: 1975. pp. 177–193. [Google Scholar]
- Heimer L, Zahm DS, Churchill L, Kalivas PW, Wohltmann Specificity in the projection patterns of accumbal core and shell in the rat. Neuroscience. 1991;41:89–125. doi: 10.1016/0306-4522(91)90202-y. [DOI] [PubMed] [Google Scholar]
- Hubner CB, Koob GF. The ventral pallidum plays a role in mediating cocaine and heroin self-administration in the rat. Brain Res. 1990;508(1):20–29. doi: 10.1016/0006-8993(90)91112-t. [DOI] [PubMed] [Google Scholar]
- Johnson PI, Napier TC. Contribution of the nucleus accumbens to cocaine-induced responses of ventral pallidal neurons. Synapse. 1996;22(3):253–260. doi: 10.1002/(SICI)1098-2396(199603)22:3<253::AID-SYN8>3.0.CO;2-B. [DOI] [PubMed] [Google Scholar]
- Johnson PI, Napier TC. GABA- and glutamate-evoked responses in the rat ventral pallidum are modulated by dopamine. Eur J Neurosci. 1997;9(7):1397–1406. doi: 10.1111/j.1460-9568.1997.tb01494.x. [DOI] [PubMed] [Google Scholar]
- Kalivas PW, Churchill L, Klitenick MA. GABA and enkephalin projection from the nucleus accumbens and ventral pallidum to the ventral tegmental area. Neuroscience. 1993;57(4):1047–1060. doi: 10.1016/0306-4522(93)90048-k. [DOI] [PubMed] [Google Scholar]
- Klitenick MA, Deutch AY, Churchill L, Kalivas PW. Topography and functional role of dopaminergic projections from the ventral mesencephalic tegmentum to the ventral pallidum. Neuroscience. 1992;50(2):371–386. doi: 10.1016/0306-4522(92)90430-a. [DOI] [PubMed] [Google Scholar]
- Li X, Li J, Peng XQ, Spiller K, Gardner EL, Xi ZX. Metabotropic glutamate receptor 7 modulates the rewarding effects of cocaine in rats: involvement of a ventral pallidal GABAergic mechanism. Neuropharmacology. 2009;34(7):1783–1796. doi: 10.1038/npp.2008.236. [DOI] [PMC free article] [PubMed] [Google Scholar]
- Maickel RP, Cox RH, Jr, Miller FP, Segal DS, Russell RW. Correlation of brain levels of drugs with behavioral effects. Journal of Pharmacology and Experimental Therapeutics. 1969;165(3):216–224. [PubMed] [Google Scholar]
- Maslowski-Cobuzzi RJ, Napier TC. Activation of dopaminergic neurons modulates ventral pallidal response evoked by amygdala stimulation. Neuroscience. 1994;62:1103–1120. doi: 10.1016/0306-4522(94)90347-6. [DOI] [PubMed] [Google Scholar]
- McFarland K, Davidge SB, Lapish CC, Kalivas PW. Limbic and motor circuitry underlying footshock-induced reinstatement of cocaine-seeking behavior. J Neurosci. 2004;24(7):1551–1560. doi: 10.1523/JNEUROSCI.4177-03.2004. [DOI] [PMC free article] [PubMed] [Google Scholar]
- McGregor A, Baker G, Roberts DC. Effect of 6-hydroxydopamine lesions of the medial prefrontal cortex on intravenous cocaine self-administration under a progressive ratio schedule of reinforcement. Pharmacol Biochem Behav. 1996;53(1):5–9. doi: 10.1016/0091-3057(95)00192-1. [DOI] [PubMed] [Google Scholar]
- Mengual E, Pickel VM. Regional and subcellular compartmentation of the dopamine transporter and tyrosine hydroxylase in the rat ventral pallidum. J Comp Neurol. 2004;468:395–409. doi: 10.1002/cne.10979. [DOI] [PubMed] [Google Scholar]
- Mitrovic I, Napier TC. Mu and kappa opioid agonists modulate ventral tegmental area input to the ventral pallidum. Eur J Neurosci. 2002;15(2):257–68. doi: 10.1046/j.0953-816x.2001.01860.x. [DOI] [PubMed] [Google Scholar]
- Mogenson GJ, Jones DL, Yim CY. From motivation to action: functional interface between the limbic system and the motor system. Prog Neurobiol. 1980;14:69–97. doi: 10.1016/0301-0082(80)90018-0. [DOI] [PubMed] [Google Scholar]
- Napier TC, Muench MB, Maslowski RJ, Battaglia G. Is dopamine a neurotransmitter within the ventral pallidum/substantia innominata? In: Napier TC, Kalivas PW, Hanin I, editors. The Basal Forebrain: Anatomy to Function. Advances in Experimental Medicine and Biology. Vol. 295. Plenum Press; New York: 1991. pp. 183–195. [DOI] [PubMed] [Google Scholar]
- Napier TC. Functional pharmacology of basal forebrain dopamine. In: Levin ED, et al., editors. Neurotransmitter Interactions and Cognitive Function. 1992. pp. 66–77. [Google Scholar]
- Napier TC. Contribution of the amygdala and nucleus accumbens to ventral pallidal responses to dopamine agonists. Synapse. 1992;10:110–119. doi: 10.1002/syn.890100205. [DOI] [PubMed] [Google Scholar]
- Napier TC. Transmitter actions and interactions on pallidal neuronal function. In: Kalivas PW, Barnes CS, editors. Limbic Motor Circuits and Neuropsychiatry. CRC Press, Inc; Boca Raton, FL: 1993. pp. 125–152. [Google Scholar]
- Napier TC, Mitrovic I, Churchill L, Klitenick MA, Lu XY, Kalivas PW. Substance P in the ventral pallidum: Projection from the ventral striatum, and electrophysiological and behavioral consequences of pallidal substance P. Neuroscience. 1995;69:59–70. doi: 10.1016/0306-4522(95)00218-8. [DOI] [PubMed] [Google Scholar]
- Nauta WJ, Smith GP, Faull RL, Domesick VB. Efferent connections and nigral afferents of the nucleus accumbens septi in the rat. Neuroscience. 1978;3(4-5):385–401. doi: 10.1016/0306-4522(78)90041-6. [DOI] [PubMed] [Google Scholar]
- Nayak PK, Misra AL, Mulé SJ. Physiological disposition and biotransformation of (3H) cocaine in acutely and chronically treated rats. J Pharmacol Exp Ther. 1976;196(3):556–69. [PubMed] [Google Scholar]
- Nicola SM, Deadwyler SA. Firing rate of nucleus accumbens neurons is dopamine-dependent and reflects the timing of cocaine-seeking behavior in rats on a progressive ratio schedule of reinforcement. J Neurosci. 2000;20(14):5526–5537. doi: 10.1523/JNEUROSCI.20-14-05526.2000. [DOI] [PMC free article] [PubMed] [Google Scholar]
- Norman AB, Tsibulsky VL. The compulsion zone: a pharmacological theory of acquired cocaine self-administration. Brain Res. 2006;1116(1):143–152. doi: 10.1016/j.brainres.2006.07.092. [DOI] [PMC free article] [PubMed] [Google Scholar]
- O’Donnell P, Lavín A, Enquist LW, Grace AA, Card JP. Interconnected parallel circuits between rat nucleus accumbens and thalamus revealed by retrograde transynaptic transport of pseudorabies virus. J Neurosci. 1997;17:2143–2167. doi: 10.1523/JNEUROSCI.17-06-02143.1997. [DOI] [PMC free article] [PubMed] [Google Scholar]
- Paxinos G, Watson C. The Rat Brain in Stereotaxic Coordinates. New York: Academic Press; 1997. [Google Scholar]
- Peoples LL, West MO. Phasic firing of single neurons in the rat nucleus accumbens correlated with the timing of intravenous cocaine self-administration. J Neurosci. 1996;16:3459–3473. doi: 10.1523/JNEUROSCI.16-10-03459.1996. [DOI] [PMC free article] [PubMed] [Google Scholar]
- Peoples LL, Gee F, Bibi R, West MO. Phasic firing time locked to cocaine self-infusion and locomotion: dissociable firing patterns of single nucleus accumbens neurons in the rat. J Neurosci. 1998;18(18):7588–7598. doi: 10.1523/JNEUROSCI.18-18-07588.1998. [DOI] [PMC free article] [PubMed] [Google Scholar]
- Pickens R, Thompson T. Cocaine-reinforced behavior in rats: Effects of reinforcement magnitude and fixed-ratio size. J Pharmacol Exp Ther. 1968;161:122–129. [PubMed] [Google Scholar]
- Roberts DC, Corcoran ME, Fibiger HC. On the role of ascending catecholaminergic systems in intravenous self-administration of cocaine. Pharmacol Biochem Behav. 1977;6(6):615–620. doi: 10.1016/0091-3057(77)90084-3. [DOI] [PubMed] [Google Scholar]
- Roberts DC, Koob GF. Disruption of cocaine self-administration following 6-hydroxydopamine lesions of the ventral tegmental area in rats. Pharmacol Biochem Behav. 1982;17(5):901–904. doi: 10.1016/0091-3057(82)90469-5. [DOI] [PubMed] [Google Scholar]
- Roberts DC, Koob GF, Klonoff P, Fibiger HC. Extinction and recovery of cocaine self-administration following 6-hydroxydopamine lesions of the nucleus accumbens. Pharmacol Biochem Behav. 1980;12(5):781–787. doi: 10.1016/0091-3057(80)90166-5. [DOI] [PubMed] [Google Scholar]
- Robledo P, Koob GF. Two discrete nucleus accumbens projection areas differentially mediate cocaine self-administration in the rat. Behav Brain Res. 1993;55(2):159–166. doi: 10.1016/0166-4328(93)90112-4. [DOI] [PubMed] [Google Scholar]
- Rodgers JL, Ghee S, See RE. The neural circuitry underlying reinstatement of heroin-seeking behavior in an animal model of relapse. Neuroscience. 2008;151(2):579–588. doi: 10.1016/j.neuroscience.2007.10.012. [DOI] [PMC free article] [PubMed] [Google Scholar]
- Root DH, Fabbricatore AT, Ma S, Barker DJ, West MO. Rapid phasic activity of ventral pallidal neurons during cocaine self-administration. Synapse. 2010;64(9):704–713. doi: 10.1002/syn.20792. [DOI] [PMC free article] [PubMed] [Google Scholar]
- Root DH, Barker DJ, Ma S, Coffey KR, Fabbricatore AT, West MO. Evidence for learned skill during cocaine self-administration in rats. Psychopharmacology, Psychopharmacol (Berl) 2011;217(1):91–100. doi: 10.1007/s00213-011-2261-0. [DOI] [PMC free article] [PubMed] [Google Scholar]
- Smith KS, Berridge KC. The ventral pallidum and hedonic reward: neurochemical maps of sucrose “liking” and food intake. J Neurosci. 2005;25(38):8637–8649. doi: 10.1523/JNEUROSCI.1902-05.2005. [DOI] [PMC free article] [PubMed] [Google Scholar]
- Smith JE, Koves TR, Co C. Brain neurotransmitter turnover rates during rat intravenous cocaine self-administration. Neuroscience. 2003;117(2):461–475. doi: 10.1016/s0306-4522(02)00819-9. [DOI] [PubMed] [Google Scholar]
- Sizemore GM, Co C, Smith JE. Ventral pallidal extracellular fluid levels of dopamine, serotonin, gamma amino butyric acid, and glutamate during cocaine self-administration in rats. Psychopharmacology (Berl) 2000;150(4):391–398. doi: 10.1007/s002130000456. [DOI] [PubMed] [Google Scholar]
- Stokes ME, Davis CS, Koch GG. Categorical data analysis using the SAS system. 2. Cary, NC: SAS Publishing; 2009. [Google Scholar]
- Tang XC, McFarland K, Cagle S, Kalivas PW. Cocaine-induced reinstatement requires endogenous stimulation of mu-opioid receptors in the ventral pallidum. J Neurosci. 2005;25(18):4512–4520. doi: 10.1523/JNEUROSCI.0685-05.2005. [DOI] [PMC free article] [PubMed] [Google Scholar]
- Tabachnick BG, Fidell LS. Using multivariale statistics. 2. New York, NY: HarperCollins Publishers; 1989. [Google Scholar]
- Torregrossa MM, Tang XC, Kalivas PW. The glutamatergic projection from the prefrontal cortex to the nucleus accumbens core is required for cocaine-induced decreases in ventral pallidal GABA. Neurosci Lett. 2008;438(2):142–145. doi: 10.1016/j.neulet.2008.04.016. [DOI] [PMC free article] [PubMed] [Google Scholar]
- Totterdell S, Smith AD. Convergence of hippocampal and dopaminergic input onto identified neurons in the nucleus accumbens of the rat. J Chem Neuroanat. 1989;2(5):285–298. [PubMed] [Google Scholar]
- Tripathi A, Prensa L, Cebrian C, Mengual E. Axonal branching patterns of nucleus accumbens neurons in the rat. J Comp Neurol. 2010;518:4649–4673. doi: 10.1002/cne.22484. [DOI] [PubMed] [Google Scholar]
- Walaas I, Fonnum F. The distribution and origin of glutamate decarboxylase and choline acetyltransferase in ventral pallidum and other basal forebrain regions. Brain Res. 1979;177(2):325–336. doi: 10.1016/0006-8993(79)90783-2. [DOI] [PubMed] [Google Scholar]
- Wise RA, Newton P, Leeb K, Burnette B, Pocock D, Justice JB., Jr Fluctuations in nucleus accumbens dopamine concentration during intravenous cocaine self-administration in rats. Psychopharmacology (Berl) 1995;120(1):10–20. doi: 10.1007/BF02246140. [DOI] [PubMed] [Google Scholar]
- Yokel AR, Pickens R. Drug level of d- and l-amphetamine during intravenous self-administration. Psychopharmacologia. 1974;34:255–264. doi: 10.1007/BF00421966. [DOI] [PubMed] [Google Scholar]
- Zahm DS, Záborszky L, Alones VE, Heimer L. Evidence for the coexistence of glutamate decarboxylase and Met-enkephalin immunoreactivities in axon terminals of rat ventral pallidum. Brain Res. 1985;325(1-2):317–321. doi: 10.1016/0006-8993(85)90331-2. [DOI] [PubMed] [Google Scholar]
- Zahm DS, Williams E, Wohltmann C. Ventral striatopallidothalamic projection: IV. Relative involvements of neurochemically distinct subterritories in the ventral pallidum and adjacent parts of the rostroventral forebrain. J Comp Neurol. 1996;364:340–362. doi: 10.1002/(SICI)1096-9861(19960108)364:2<340::AID-CNE11>3.0.CO;2-T. [DOI] [PubMed] [Google Scholar]
Associated Data
This section collects any data citations, data availability statements, or supplementary materials included in this article.