

Summary
Human neurons are functional over an entire lifetime, yet the mechanisms that preserve function and protect against neurodegeneration during aging are unknown. Here we show that induction of the repressor element 1-silencing transcription/neuron-restrictive silencer factor (REST/NRSF) is a universal feature of normal aging in human cortical and hippocampal neurons. REST is lost, however, in mild cognitive impairment (MCI) and Alzheimer’s disease (AD). Chromatin immunoprecipitation with deep sequencing (ChIP-seq) and expression analysis show that REST represses genes that promote cell death and AD pathology, and induces the expression of stress response genes. Moreover, REST potently protects neurons from oxidative stress and amyloid β-protein (Aβ) toxicity, and conditional deletion of REST in the mouse brain leads to age-related neurodegeneration. A functional ortholog of REST, C. elegans SPR-4, also protects against oxidative stress and Aβ toxicity. During normal aging, REST is induced in part by cell non-autonomous Wnt signaling. However, in AD, frontotemporal dementia and dementia with Lewy bodies, REST is lost from the nucleus and appears in autophagosomes together with pathologic misfolded proteins. Finally, REST levels during aging are closely correlated with cognitive preservation and longevity. Thus, the activation state of REST may distinguish neuroprotection from neurodegeneration in the aging brain.
The preservation of cognitive function during aging has emerged as one of the major medical challenges of the 21st century. A fundamental question is why some individuals age with their cognitive function relatively intact whereas others decline and develop Alzheimer’s disease (AD). Early studies suggested that neuronal loss was an integral feature of the aging brain. With the advent of stereological neuronal quantification, however, it became clear that neuronal cell number is largely preserved in the neocortex and hippocampus of the aging human brain, declining only in the setting of neurodegenerative disease1–3. Robust stress response mechanisms must have evolved, therefore, to preserve neurons and cognitive function across an entire lifespan4,5.
REST is a repressor of neuronal genes during embryonic development that is downregulated once terminal neuronal differentiation has occurred6–8. Here we show that REST is induced in the aging human brain and regulates a network of genes that mediate cell death, stress resistance and AD pathology. This gene network becomes dysregulated at early stages of AD when REST is lost from the nucleus. Conditional REST knockout mice and C. elegans models suggest that REST protects neurons from age-related toxic insults. In aging humans, elevated REST levels are associated with preservation of cognitive function and increased longevity, even in the presence of AD pathology. Hence, REST regulates a neuroprotective stress response that may be central to cognitive preservation during aging.
REST is induced in the aging human brain and declines in AD
Transcriptional profiling has demonstrated significant changes in the expression of neuronal genes in the prefrontal cortex of aging humans9,10. Analysis of this dataset using the Ingenuity Systems IPA platform suggests that the transcription factor most strongly predicted to be activated in the aging brain is REST/NRSF (P=9E-10). Moreover, the 21-bp canonical RE1 recognition motif for REST is highly enriched in the age-downregulated gene set (P=3E-7) (Fig. 1a).
Figure 1. Induction of REST in the aging human prefrontal cortex.

a. Hierarchical cluster analysis of predicted REST targets, based on the presence of the canonical RE1 motif29, shows relatively high expression in young adults (red) and lower expression (blue) in the aging population. Each lane represents an individual prefrontal cortical brain sample. b. qRT-PCR shows age-dependent induction of REST mRNA in the PFC. Values represent the mean±S.D., n=3. Shown are p-values indicating significance for the mean of aged (71–95 yrs) versus young (24–29 yrs) cases for each primer. c. Age-dependent increase in total REST protein level in the PFC of controls but not AD patients. REST levels were also measured in isolated nuclear (Nuc REST; lower right panel, upper blot) and cytoplasmic (Cyt REST; lower right panel, lower blot) fractions. Each lane represents an individual case. Young, n=12; Aged, n=15; AD, n=10. d. Confocal immunofluorescence labeling for REST (green), the neuronal marker MAP2 (red) and DNA (DAPI, blue) in the PFC of young adult, aged and AD cases. Scale bar: 25 μm. e. Quantitative analysis of nuclear REST levels by in situ imaging (left panel: Young, n=11; Aged, n=77; AD, n=72; MCI=11) or FACS analysis of isolated PFC neuronal nuclei (right panel: Young, n=11; Aged, n=22; AD, n=11; MCI n=12). For c and e, values are expressed as fold change relative to the young adult group, and represent the mean±S.E.M. *P<0.05, **P<0.01, ***P<0.001 by Student’s unpaired t-test. f. ChIP analysis shows induction of REST-RE1 site binding in normal aging PFC neurons but not in AD.
To explore the role of REST in the aging brain, we measured REST levels in extracts of prefrontal cortex (PFC) from young adult (20–35 years) and aged (73–106 years) individuals without AD. REST expression was significantly increased in the aging human PFC at both the mRNA and protein levels, as determined by quantitative real time RT-PCR (qRT-PCR) and Western blotting (Fig. 1b, c). Full-length REST was markedly increased; the truncated splice variant REST4 was a minor component, comprising 0.1–0.5% of REST mRNA. Immunofluorescence microscopy using three different antibodies against the N- or C-terminal domains of REST showed a striking induction of REST in the nucleus of aging neurons in the PFC and hippocampus (Fig. 1d, e; Extended Data Fig. 1). Much lower levels of REST were detected in microglial cells and astrocytes (data not shown). REST antibody specificity was indicated by ablation of immunoreactivity after antibody preabsorption with a REST blocking peptide, absence of immunoreactivity with matched nonspecific IgG, and loss of immunoreactivity after shRNA-mediated REST knockdown in neural SH-SY5Y cells (Extended Data Fig. 1b, c).
We then asked whether induction of REST in aging neurons leads to increased REST-RE1 site binding. To assess REST targeting specifically in neurons, we isolated neuronal nuclei from the PFC by fluorescence-activated cell sorting (FACS) of NeuN-positive nuclei5 (Methods). ChIP-PCR analysis showed a marked induction of REST binding to canonical RE1 motifs in REST target genes in the aged PFC (Fig. 1f). These results indicate that REST expression and function is increased in aging neurons.
We next examined REST in aging individuals with mild cognitive impairment (MCI) or AD. REST was almost absent from the nucleus of cortical and hippocampal neurons in AD (Fig. 1d, Extended Data Fig. 1a, d). Punctate cytoplasmic REST immunoreactivity was detected in some AD neurons, but was not detectable in other neurons (Fig. 1d). Loss of nuclear REST was confirmed by quantitative immunocytochemical analysis of 77 cases of sporadic AD compared with 72 age-matched cognitively intact controls, and confirmed by FACS analysis of neuronal nuclei in a subset of cases (Fig. 1e). In 23 of 24 cases of amnestic MCI, nuclear REST levels were reduced relative to the mean of aged controls (Fig. 1e). A survey of brain regions showed significantly reduced nuclear REST levels in affected neuronal populations in AD, including prefrontal cortical neurons, and neurons of the CA1, CA3 and CA4 subfields of the hippocampus (Extended Data Fig. 1a, c). In contrast, nuclear REST was not reduced in neurons of the dentate gyrus and cerebellum, which are relatively unaffected in AD (Extended Data Fig. 1a, d). Reduced REST levels in AD were confirmed by Western blotting of prefrontal cortical grey matter samples, as well as isolated cortical nuclei (Fig. 1c, upper and far right panels, respectively). Furthermore, ChIP-PCR analysis of neuronal nuclei showed significantly reduced or absent REST-RE1 site binding in AD relative to normal aging controls (Fig. 1f, 2a). Thus, REST is induced during normal brain aging, but is markedly reduced in AD in vulnerable neuronal populations.
Figure 2. Regulation of REST target genes in aging and AD.

a. ChIP-qPCR analysis of REST binding to target genes in isolated PFC neuronal nuclei. Shown are young adult (Young), normal aged (Aged) and AD cases, which were stratified as AD1 (MMSE score >18) and AD2 (MMSE score <8). Also shown are control ChIP assays with non-specific IgG, and a REST ChIP with PCR primers directed 10 kb 3′ to the SNAP25 RE1 site (SNAP25–10K down). Values represent fold change relative to the mean young adult value, and represent the mean±S.E.M., n=7. *P<0.05 by the Mann-Whitney test. b. mRNA expression of REST target genes determined by qRT-PCR of PFC. Shown are REST target genes related to cell death pathways and AD pathology (left panel), and neurotransmission (right panel). Values are normalized to the mean young adult expression level (100%) and represent the mean±S.E.M. Young, n=9; Aged, n=10; AD1, n=10; AD2, n=10. Asterisks above the “Aged” bars indicate significance relative to young adults; brackets indicate significance of Aged vs AD1 or AD2. *P<0.05 by the Mann-Whitney test. c. Linear regression analysis of nuclear REST versus levels of protein targets or histone H3K9ac in double-labeled PFC neurons. d. Representative images showing inverse relationships between nuclear REST and H3K9ac, PS2, DAXX and BAX in AD1 neurons. Scale bar: 20 μm. e. Global epigenetic regulation in aging and AD. Histone modification H3K9ac was determined in isolated PFC neuronal nuclei. Values are normalized to the mean of the young adult group (100%), and represent the mean±S.E.M., **P<0.005 by Student’s unpaired t-test. Young, n= 8; Aged, n=11; AD1, n=4; AD2, n=4.
REST represses genes involved in cell death and AD
To obtain greater insight into the functional consequences of REST induction in the aging brain, we explored REST targets by chromatin immunoprecipitation and deep sequencing (ChIP-seq) in the neural cell line SH-SY5Y. REST binding to a subset of the identified target genes was confirmed by ChIP-qPCR (Extended Data Fig. 2). REST ChIP-seq sites were significantly enriched among age-regulated genes in human PFC (P=1.65E-12), and were predominantly downregulated from the third to the tenth decades of life (Extended Data Fig. 2a). Pathway analysis of the ChIP-seq database showed a highly significant enrichment for genes in cell death pathways and genes that are associated with AD/dementia (Extended Data Fig. 2b, c). Cell death genes include p38 MAP kinase (MAPK11), FAS, FADD, TRADD, BAX, BID, DAXX, PUMA, the mitochondrial permeability transition pore ANT1 and cytochrome C. REST targets related to the pathology of AD include the gamma secretase complex members presenilin-2 and pen-2 implicated in Aβ generation, and cdk5R1 (p35), cdk5R2 (p39), p38 MAP kinase and 14-3-3zeta implicated in tau phosphorylation. REST repressed the expression of these genes in SH-SY5Y cells (Extended Data Fig. 3a, b), and strongly inhibited tau phosphorylation at the AT8 and PHF1 epitopes associated with AD (Extended Data Fig. 3c).
We next examined the regulation of these REST target genes in the normal aging brain and AD. To distinguish effects at different stages of cognitive decline, we stratified the AD population for least severe (AD1; MMSE score >18) and most severe (AD2; MMSE score <8). REST targets related to cell death and AD pathology showed reduced REST binding and elevated mRNA expression at both stages of AD (Fig. 2a, b). REST target genes related to neurotransmission, however, showed elevated mRNA expression in early stage AD1, but reduced expression in later stage AD2 (Fig. 2b). Regression analysis of protein levels showed that nuclear REST is inversely correlated with levels of pro-apoptotic (BAX and DAXX) and AD-related (presenilin-2) proteins in normal aging and AD neurons (Fig. 2c, d). This was also observed for REST targets associated with neurotransmission (SST and CALB1) during normal aging and early stage AD1, but not in late stage AD2 (Fig. 2c). The activation-associated histone modification H3K9ac, which is typically reduced by REST, was globally downregulated in normal aging PFC neurons (Fig. 2e) and was inversely correlated with REST levels (Fig. 2c, d). In contrast, neuronal H3K9ac increased significantly in early AD (Fig. 2e). Thus, loss of nuclear REST in AD is associated with epigenetic derepression of potentially pathogenic genes.
REST is neuroprotective
Since REST represses pro-apoptotic genes, we explored a role in neuroprotection by assessing vulnerability to oxidative stress and oligomeric Aβ, stressors associated with brain aging9 and AD11. Primary cultures of mouse E16 cortical neurons were established from Nestin-Cre:RESTlx/lx (REST cKO) and littermate control embryos. After 1–2 weeks in culture, neuronal differentiation was comparable in REST-deficient and control cultures. Upon treatment with hydrogen peroxide or oligomeric Aβ42, REST-deficient neurons showed markedly increased degeneration and cell death relative to controls (Fig. 3a, Extended Data Fig. 4a). REST-deficient neurons were rescued by lentiviral transduction of wild-type REST, leading to expression levels 2–2.5-fold that of wild-type (Fig. 3a, Extended Data Fig. 4a). In contrast, a REST mutant that is deficient in nuclear translocation (ΔREST)12,13 was unable to rescue (Fig. 3a, b). REST-deficient neurons showed increased expression of pro-apoptotic genes in response to oxidative stress and oligomeric Aβ (Extended Data Fig. 4b). Thus, endogenous REST is neuroprotective.
Figure 3. REST is neuroprotective.

a. REST-deficient cortical neurons cultured from REST cKO mouse embryos show increased vulnerability to H2O2 and oligomeric Aβ42 toxicity. Cell viability is expressed as percent of the value in untreated cultures. Values represent the mean ± S.E.M., n=6–8. *P<0.05, **P<0.01 by Student’s unpaired t-test. b. Reduced nuclear translocation of the ΔREST mutant. c. REST cKO mice exhibit age-related neurodegeneration. Shown are sections of the hippocampal CA1 subfield from 8 month old REST cKO mice labeled for TUNEL, cleaved caspase 3 (cl-CASP3) and GFAP, or stained with hematoxylin and eosin (H&E). d. Neurodegeneration in 8 months but not 1 month old REST cKO mice in the cortex, and in hippocampal CA1 and dentate gyrus (DG) regions. Values represent the mean ± S.E.M., n=6 mice; **P<0.001 relative to control by Student’s unpaired t-test. Scale bars: 20 μm.
REST-deficient mice showed a progressive age-related neurodegenerative phenotype. At one month of age, neuronal numbers in the cortex and hippocampus of REST cKO mice were not significantly different from controls. Neuronal degeneration and apoptosis appeared by 8 months of age, as indicated by positive neuronal labeling for cleaved caspase-3 and TUNEL (Fig. 3c, d). This was accompanied by significant neuronal loss in the cerebral cortex and hippocampus, and pronounced gliosis (Fig. 3c, d). These results suggest that REST is essential for maintaining neuronal viability in the aging brain.
To confirm the findings on REST-deficient neurons, we assessed vulnerability to oxidative stress after REST overexpression or shRNA-mediated knockdown in neural SH-SY5Y cells. Cell death induced by hydrogen peroxide was significantly reduced when REST was overexpressed by 3-to 20-fold (Extended Data Fig. 4c). Higher levels of REST overexpression increased cell death. REST knockdown by lentiviral shRNA transduction significantly increased H2O2-induced apoptosis in both SH-SY5Y cells and cultured human cortical neurons, which was prevented by shRNA-resistant mouse REST (Extended Data Fig. 4c, d). Furthermore, shRNA-mediated REST knockdown increased levels of reactive oxygen species (ROS), which was prevented by the antioxidant N-acetyl-cysteine (NAC) (Extended Data Fig. 4e, f). Moreover, REST knockdown increased oxidative DNA damage, which was reduced by REST overexpression (Extended Data Fig. 4g). To examine the relationship of REST expression to oxidative DNA damage in the human brain, we double-labeled for REST and the oxidative DNA damage marker 8-oxoguanine (8-oxoG). Linear regression analysis showed a significant inverse relationship between nuclear REST and 8-oxoG levels in normal aging neurons and in AD (Extended Data Fig. 4h). Thus, REST expression during aging may reduce oxidative damage.
The nematode C. elegans has served as a model system of aging and stress resistance4. Two multi-zinc finger transcription factors in C. elegans structurally resemble mammalian REST (spr-3 and spr-4)14,15, and another gene is closely homologous to CoREST (spr-1)16. To test the role of these genes in oxidative stress resistance, we placed adult worms on nematode growth medium supplemented with paraquat, a superoxide generator. C. elegans lines with mutations in spr-1, spr-3, and spr-4 all showed significantly reduced survival relative to wild-type controls (Fig. 4a, Extended Data Fig. 5a). The spr-4(by105) mutant showed the greatest vulnerability. Furthermore, depletion of spr-4 by RNAi significantly reduced survival in wild-type worms after treatment with paraquat (Extended Data Fig. 5b). SPR-4 was expressed predominantly in neurons (Extended Data Fig. 5c), and was induced by oxidative stress (Extended Data Fig. 5d).
Figure 4. C. elegans SPR-4 protects against oxidative stress and Aβ toxicity.

a. Spr-4(by105) worms incubated continuously with paraquat (5 mM) exhibit increased mortality rescued by wild-type SPR-4 or human REST. Shown is a representative experiment replicated three times. b. Quantitative analysis of survival in wild-type worms expressing mCherry or SPR-4 (WT+mCherry and WT+SPR-4), spr-4(by105) mutants, and spr-4(by105) mutants expressing SPR-4 or human REST [spr4(by105)+SPR4 and spr4(by105)+REST]. Shown is the percent change in mean survival relative to wild-type. Values represent the mean ± S.D., n=3 independent replicates of at least 30 animals per genotype; **P<0.01 relative to wild-type by the log-rank test. c. REST and SPR-4 reduce levels of reactive oxygen species (ROS). Shown are representative confocal images of paraquat-treated worms labeled with the ROS-sensitive dye DCFDA. WT, wildtype. Scale bar: 30 μm. d. Quantitation of ROS levels by DCFDA labeling. Horizontal bars indicate the median; boxed areas represent the second and third quartiles. *P<0.05 relative to wild-type by analysis of variance with post-hoc Tukey test; n=30 worms. AFU, arbitrary fluorescence units. e. SPR-4 protects against Aβ neurotoxicity. Shown are Aβ worms (expressing a stably integrated Aβ1-42 transgene17) and Aβ;spr4(by105) worms. Neuronal degeneration does not occur in WT worms or spr4(by105) mutants in the absence of the Aβ transgene. Values represent the % of worms that retain 5 glutamatergic tail neurons at the indicated age (day), and are the mean±S.D., n=3. *P<0.05 by unpaired t-test.
The increased sensitivity of the spr-4 mutant worms to oxidative stress was significantly reduced by transgenic expression of either wild-type SPR-4 or human REST (Fig. 4a, b). To ascertain whether SPR-4 and REST directly modulate ROS levels, worms were labeled with the fluorescent ROS indicator 2′,7′-dichlorodihydrofluorescein diacetate (DCFDA). Spr-4(by105) mutants treated with paraquat showed significantly elevated ROS levels relative to wild-type, which was reduced by transgenic expression of either wild-type SPR-4 or human REST (Fig. 4c, d). To determine whether REST can substitute for SPR-4 as a transcriptional repressor, we assessed the expression of the presenilin gene hop-1, which is repressed by SPR-4. The expression of hop-1 was elevated in adult spr-4 mutants relative to wild-type worms, and was repressed by both wild-type SPR-4 and human REST (Extended Data Fig. 5e). These results suggest that human REST can functionally substitute for SPR-4 in C. elegans.
SPR-4 also modulated the neurotoxicity of Aβ in a C. elegans line that expresses Aβ42 in glutamatergic neurons and undergoes age-dependent neuronal loss17. When this Aβ-expressing line was crossed with the spr-4(by105) mutant, the resulting line expressed Aβ42 in an SPR-4 loss-of-function background and showed significantly accelerated neurodegeneration (Fig. 4e). Thus, SPR-4 protects against both oxidative stress and Aβ toxicity, consistent with a general role in stress resistance.
Induction of REST by stress and Wnt signaling
To determine whether REST might be induced by oxidative and other forms of stress in the aging brain, we subjected primary human cortical neuronal cultures to a variety of stressors. Incubation with redox-active iron (Fe+2), hydrogen peroxide, the glutathione synthesis inhibitor buthionine sulfoxide (BSO), or Aβ42 induced REST mRNA and protein and increased REST-RE1 site binding (Extended Data Fig. 6a–f). To determine whether secreted factors might contribute to REST induction, cortical neurons were incubated with H2O2 followed by removal of H2O2 and generation of conditioned medium. Addition of stress-related conditioned medium to naïve neuronal cultures resulted in a marked induction of REST mRNA expression (Extended Data Fig. 6g). Thus, a variety of stressors induce REST expression, which is mediated at least in part through cell non-autonomous signaling.
To explore the role of cell non-autonomous signaling in the aging brain, we generated extracts of human PFC from young adult and aged samples and assessed their effects on SH-SY5Y cells. REST was robustly induced by extracts of aged human cortex, but minimally by extracts of young adult cortex (Extended Data Fig. 6h). Furthermore, extracts of AD cortex showed reduced REST-inducing activity relative to age-matched controls (Extended Data Fig. 6h). Since REST has been identified as a target of canonical Wnt-β-catenin signaling18, we examined the role of this cell non-autonomous signaling pathway. Extracts of aged cortex and conditioned medium from stressed cells treated with H2O2, tunicamycin or wortmannin induced β-catenin in parallel with REST (Extended Data Figs. 6h, 7a, b). Induction of REST and β-catenin was partially inhibited by the Wnt signaling antagonist Dickkopf (Extended Data Fig. 7a, b). REST was also induced by addition of purified Wnt-3a and Wnt-7a. Moreover, the GSK3-β inhibitors lithium chloride and Chiron 99021 that activate Wnt signaling induced REST, increased REST-RE1 site binding, and augmented nuclear translocation (Extended Data Fig. 7c–f). To assess Wnt signaling in the human brain, we measured nuclear β-catenin levels in the PFC of young adult and aged cases. Nuclear β-catenin was significantly elevated in aging PFC neurons and co-localized with REST (Extended Data Fig. 7g, h). These results suggest that Wnt-β-catenin signaling may contribute to the induction of REST in the aging brain.
Autophagy of REST in neurodegenerative disorders
In AD, loss of REST from the nucleus was often accompanied by localization to punctate cytoplasmic structures that were labeled with the autophagosome markers LC3, ATG7 and ATG12, but not the lysosomal markers LAMP1 and LAMP2 (Extended Data Fig. 8a). To determine if autophagy could alter the nuclear-cytoplasmic distribution of REST, autophagy was activated in SH-SY5Y cells by serum deprivation. This resulted in significantly reduced nuclear REST, which was reversed by treatment with 3-methyladenine (3-MA) or bafilomycin, inhibitors of autophagy (Extended Data Fig. 8b, c). Since activation of autophagy is characteristic of many age-related neurodegenerative disorders, we asked whether REST is also depleted in other dementing diseases. Examination of cortical sections from patients with frontotemporal dementia (FTD) or dementia with Lewy bodies (DLB) showed marked depletion of nuclear REST (Fig. 5a).
Figure 5. REST, autophagy and proteostasis in AD, DLB and FTD.

a. Loss of nuclear REST in DLB and FTD. Left Panel: Immunofluorescence microscopy with labeling for REST (green), the neuronal marker MAP2 (red) and DNA (DAPI, blue). Right Panel: Quantitative analysis of immunfluorescence. Values (AFU) represent the mean±S.E.M., Young, n=11; Aged, n=21; DLB, n=18; FTD, n=16. **P<0.001 by Student’s unpaired t-test. b. Co-localization of REST with disease-associated misfolded proteins in autophagosomes. Cortical sections were triple-labeled for REST, LC3, and either Aβ in AD, α-synuclein (α-syn) in DLB, or phosphorylated tau (PHF1 epitope) or TDP-43 in FTD. Two different representative cases are shown for each disease. Scale bars: 20 μm.
Induction of autophagy in neurodegenerative disorders has been associated with pathogenic misfolded proteins such as Aβ19. In AD, many cortical and hippocampal neurons showed a notable co-localization of REST with Aβ in LC3-positive autophagosomes (Fig. 5b). In contrast, REST did not colocalize with Aβ in amyloid plaques. Phosphorylated tau and TDP-43 have been implicated as abnormally folded pathogenic proteins in FTD, whereas α-synuclein has been implicated in DLB. Every case (8) of tau-positive FTD examined showed co-localization of REST with phosphorylated tau (PHF1) in LC3-positive autophagosomes (Fig. 5b). Similarly, every case (6) of TDP-43-positive FTD showed co-localization of REST with TDP-43 and LC3 (Fig. 5b). All ten cases of DLB examined showed partial co-localization of REST with α-synuclein in autophagosomes (Fig. 5b). Thus, autophagy of REST, together with pathogenic misfolded proteins, may reduce nuclear translocation in AD and other neurodegenerative disorders.
REST, cognitive preservation and longevity
A central question is whether loss of REST in AD contributes to cognitive decline. We explored this question by using measures of cognitive function derived from neuropsychiatric assessments performed longitudinally in the Religious Orders Study and the Rush Memory and Aging Project (Methods). Linear regression analysis showed that nuclear REST levels in prefrontal cortical neurons are positively correlated with a measure of global cognition, and separate measures of episodic, semantic and working memory with high levels of statistical significance (Fig. 6a, Extended Data Fig. 9a). Similar results were obtained in pyramidal neurons in the hippocampal CA1 region. For both brain regions, REST levels were most robustly correlated with episodic memory, which typically declines early in the course of AD. Elevated REST levels also predicted reduced AD neuropathology (Fig. 6b, Extended Data Fig. 9b).
Figure 6. Nuclear REST is positively correlated with cognitive function and longevity.

a. Linear regression analysis of nuclear REST levels in PFC neurons and cognitive test scores. Nuclear REST was imaged by anti-REST immunofluorescence and quantified by Metamorph. Each point represents an individual case. n=111 cases (59 females, 52 males), age range 71–90 yrs. b. Nuclear REST levels are inversely correlated with Braak stage (extent of neurofibrillary tangle formation). c. Nuclear REST levels in PFC from cases with neuropathologic AD (moderate/frequent plaques by CERAD score and intermediate/high likelihood AD by NIA-Reagan criteria) that had mild or no cognitive impairment (NCI/MCI), or AD dementia. Values are the mean±S.E.M. *P<0.01 by Student’s unpaired t-test; NCI/MCI n=30, AD dementia n=21. d. Nuclear REST levels in aging neurons correlate positively with longevity. REST levels were quantified by FACS analysis of isolated PFC neuronal nuclei in 61 individuals without AD (age range 67–104 years).
We then asked if elevated REST levels might confer resistance to AD pathology. Cases with NIA-Reagan and CERAD pathology scores indicative of pathologic AD, but with mild or no cognitive impairment, were compared to cases with pathologic AD together with severe cognitive impairment. Nuclear REST levels were significantly elevated in cognitively preserved cases relative to cognitively impaired cases, despite the fact that both groups met pathologic criteria for AD (Fig. 6c). Thus, elevated REST levels are associated with cognitive preservation in individuals who meet pathologic criteria for AD.
Since REST is associated with stress resistance and preservation of cognitive function, we explored the relationship to human lifespan. Nuclear REST levels in PFC neurons showed a significant positive correlation with longevity (R=0.53; P<e-4) (Fig. 6d). This relationship remained significant after multivariate adjustment for cognitive test scores and indices of neuropathology. Furthermore, the expression of REST target genes showed a highly significant inverse correlation with longevity (Extended Data Fig. 2a). Examination of the neuroanatomical distribution of REST in individuals with extreme longevity showed marked induction in neurons of the PFC and hippocampus, but not in the Purkinje or granule cell neurons of the cerebellum (Extended Data Fig. 10a). Thus, REST expression in specific neuronal populations correlates with longevity.
We then asked if REST regulates genes that have been implicated in stress resistance and the aging process. In addition to repressing cell death genes, REST also promoted expression of the anti-apoptotic gene BCL-2, the antioxidants catalase and SOD1, and the FOXO transcription factor FOXO1a (Extended Data Figs. 3a, 10b). As FOXO1a has been implicated in oxidative stress resistance20 and human longevity21, we assessed its regulation by REST at the protein level. REST knockdown by shRNA transduction in SH-SY5Y cells almost completely abolished FOXO1a expression, which was reversed by an shRNA-resistant mouse REST vector (Extended Data Fig. 10c). Thus, REST may broadly confer stress resistance during aging.
Discussion
We have demonstrated a striking induction of the developmental transcriptional repressor REST in specific neuronal populations of the aging human brain together with epigenetic repression of REST target genes. REST has been investigated extensively as a repressor of neuronal genes during embryonic development, a function that persists in adult non-neuronal cells22. Our findings suggest that REST additionally plays a role as a neuroprotective modulator, in part by repressing genes that promote cell death and the pathology of AD. Moreover, REST increases the expression of FOXO transcription factors that mediate oxidative stress resistance20, as well as the antioxidant enzymes catalase and SOD1, possibly through indirect mechanisms such as repression of micro RNAs. Consistent with these findings, REST confers oxidative stress resistance and protects against toxic insults associated with AD, including Aβ oligomers and tau phosphorylation. Furthermore, REST appears to be essential for maintaining neuronal viability in the normal aging cortex and hippocampus. This protective function is conserved in C.elegans. Previous ChIP-SACO23 and ChIP-chip24 studies also identified REST target genes involved in cell death. In addition, a recent study suggests that REST protects against the toxicity of 1-methyl-4-phenyl-1,2,3,6-tetrahydropyridine (MPTP), a model of Parkinson’s disease25. Thus, REST may coordinate a stress response that is broadly neuroprotective in the aging brain.
REST dysfunction may contribute to the pathogenesis of a number of different neurodegenerative disorders. In addition to AD, REST was also significantly depleted in frontotemporal dementia and dementia with Lewy bodies. In each of these disorders, REST was lost from the nucleus and appeared in autophagosomes together with pathologic misfolded proteins, including Aβ, phosphorylated tau, TDP-43 and α-synuclein. This may represent a common pathogenic mechanism that links altered proteostasis to aberrant gene expression.
Recent studies suggest that epigenetic regulation of chromatin may modulate the cognitive outcome of a variety of neuropathological states26–28. It is intriguing that aging individuals who harbor substantial AD pathology do not appear to progress to dementia when neuronal REST levels are high. This raises the possibility that structural pathology, such as Aβ deposition and neurofibrillary tangles, may not be sufficient to cause dementia. Rather, failure of the brain’s stress response system may also be necessary, suggesting new possibilities for therapeutic intervention.
METHODS
Brain sample procurement
Postmortem human brain material was procured in accordance with institutional guidelines governed by approved protocols. Tissue samples were procured from the Rush University Medical Center, the University of Maryland, Duke University, the Brigham and Women’s Hospital, and the Massachusetts General Hospital. Tissue samples from Rush University Medical Center were derived from participants in the Religious Order Study (ROS) and Rush Memory and Aging Project (MAP) at the Rush Alzheimer’s Disease Center, which are longitudinal, clinical-pathologic studies of aging, cognitive decline and AD30,31. Study participants agreed to comprehensive annual clinical and neuropsychological evaluation and brain donation at death. Informed consent was obtained and the study was approved by the Institutional Review Board (IRB) of Rush University Medical Center.
Cognitive function tests and neuropathology
Measures of cognitive function were derived from neuropsychiatric assessments performed longitudinally in the Religious Orders Study and the Rush Memory and Aging Project (MAP). This population includes individuals across the cognitive spectrum, ranging from normal to AD. The last cognitive test scores obtained during life were related to nuclear REST levels in postmortem prefrontal cortical brain samples by quantitative immunocytochemistry (111 cases, Fig. 6a) and FACS analysis of isolated neuronal nuclei (37 additional cases, Extended Data Fig. 9a). Nineteen cognitive function tests were employed in the present study, including a summary score of all 19 tests used as a measure of global cognition, and separate measures of episodic, semantic, and working memory, and perceptual speed. The follow-up rate exceeds 95% and the autopsy rate exceeds 90%.
Autopsy cases in the Religious Orders and MAP studies underwent a uniform structured neuropathologic evaluation of AD, including assignment of Braak (measure of number and distribution of neurofibrillary tangles), CERAD (Aβ plaque pathology), and NIA-Reagan (composite measure of neurofibrillary tangles and amyloid plaques) scores. The clinical diagnoses of AD and MCI have been described in detail and pathologic confirmation of AD approaches 90%32–34. Frozen brain tissue specimens used in this study were from the prefrontal cortical grey matter (Brodmann area 9, 10) and were snap-frozen and stored at −140°C. Paraffin-embedded brain samples were also obtained from the Massachusetts General Hospital and Brigham and Women’s Hospital. These samples included young adult cases without neurological abnormalities, aged subjects that did not carry a diagnosis of AD or another neurodegenerative disease and showed neuropathological findings within the normal range for age, and cases of AD, FTD and DLB with clinical histories of these disorders and subsequent pathological confirmation. A total of 364 brain specimens with an age range from 19–106 years were utilized for molecular and histopathological analyses. The characteristics of these cases are provided in Supplementary Information Table 1.
Microarray analysis
Gene expression profiling using microarrays has been described previously35. Human brain samples with tissue pH<6.5 or postmortem interval (PMI) >20 hrs were excluded. Prefrontal cortical samples with acceptable parameters of RNA quality were hybridized to Affymetrix Human Genome U133plus 2.0 arrays, which were then scanned and expression data extracted using Affymetrix Microarray Suite Software. The Probe-level Linear Model (PLM) platform was used for analysis of microarray data36. A subset of the data was additionally analyzed using RMA or dCHIP platforms yielding similar results. Significance Analysis of Microarrays (SAM) software37 was used for 2-group comparisons of young adult versus aged with the following criteria for identifying age-related expression changes: 1000 permutations and median false discovery rate (FDR) ≤0.01. Age-regulated genes that overlap with RE1-containing genes38 were visualized by hierarchical clustering using dChip software39 (Fig. 1a). The display range used was 1.5 (a value greater than 1.5 standard deviations above the mean is pure red, below is pure blue, and equal to the mean is white.
Real time RT-PCR and PCR
Primers were designed for 90–300-base-pair (bp) segments to span exon boundaries if possible. PCR or real-time PCR were run for 30–40 cycles (Supplementary Information Table 2). The purity of both PCR and RT-PCR products were determined by single peak melting curves, and further confirmed by agarose gel electrophoresis. To extract RNA, the Cells-to-cDNA™ II Kit was used for cells, and Trizol (Invitrogen) was used for tissue samples. All RNAs were DNase treated. A standard curve for each primer pair was generated by serial dilution of a pool of titrated RNA or DNA. Beta-actin or GAPDH were used as internal controls. Positive control primers for the REST ChIP assay, SYN- RE1 primers, were from Millipore (Cat#17-641), and the C-terminal truncated splice variant, REST4 primers: RES4-F: 5′-GTGAGCGAGTATCACTGGAGG-3′, REST4-R: 5′-CCATCTAGATCACACTCTGAATG-3′ have been reported previously40. Other primers used in this study were designed using Primer3.0, and are listed in Supplementary Table 2.
Western blotting
Tissues were homogenized, whereas cells were directly lysed using RIPA-DOC buffer supplemented with protease and phosphatase inhibitors (Complete and Phosphostop, Roche). A sonication step was performed prior to centrifugation at 10,200g for 10 min at 4°C. The supernatant was removed and the protein concentration determined (BioRad protein assay). SDS sample buffer containing beta mercaptoethanol was added and 20 μg protein was loaded per lane and resolved by 4–20% Mini-PROTEAN TGX precast gels (Biorad). Western blots were quantified by densitometry using the ImageJ software. The antibodies used for this study are described in Supplementary Table 3.
Immunohistochemical analysis of human brain
Antibodies used in this study are described in Supplementary Information Table 3, The following REST-specific antibodies were used for immunolabeling studies: (i) a rabbit polyclonal IgG recognizing a region between residues 1,050 and the C-terminus (residue 1,097) of REST (Bethyl laboratories, IHC-00141); (ii) a rabbit polyclonal IgG recognizing a region between residues 801 and the C-terminus (residue 1097) of REST (Millipore, 07–579); (iii) a goat polyclonal IgG recognizing an internal region of REST (Santa Cruz, sc-15118); and (iv) rabbit monoclonal IgG recognizing a region near the N-terminus of REST (Abcam, ab28018).
Immunohistochemical/immunofluorescence analysis using paraffin-embedded brain sections was performed in the following regions: (1) the prefrontal cortex (Broadmann areas 9, 10 and 47, (2) the hippocampal formation, including the CA1, CA3, CA4 and DG sectors, and (3) the cerebellum. Analysis of REST expression by immunohistochemistry using paraffin-embedded sections obtained from the various sources indicated above led to very similar conclusions.
Paraffin-embedded tissue sections were first deparaffinized in xylene, then rehydrated with decreasing concentrations of ethanol and placed in water. Sections then underwent antigen retrieval using either citrate buffer (Vectorlabs, USA) or the Diva decloaker (BioCare, USA). For diaminobenzidine (DAB) labeling, sections were additionally treated with 3% hydrogen peroxide for 30 minutes. They were then washed and blocked with 3% BSA, 0.2% Triton X-100 in PBS for 1 hr at room temperature. Primary antibodies were diluted in 2% BSA, 0.1% Triton in PBS. Following overnight incubations, sections were washed three times with PBS. Secondary antibodies, diluted in 2% BSA, 0.1% Triton in PBS were either biotin-coupled (1:200, Vector Labs, USA) or coupled to Alexa fluorophores (1:300, Invitrogen). For DAB labeling, sections were additionally incubated with a pre-formed biotin-avidin-horseradish peroxidase complex (1:100, VectorLabs). For immunofluorescence labeling, sections were also incubated with 1% Sudan Black in 70% ethanol, for 10 minutes, to suppress lipofuscin autofluorescence. Following washes in PBS, sections were mounted and imaged using confocal or bright field microscopy. To quantify immunofluorescence or DAB labeling, images were randomly acquired in selected brain regions. Antigen-expressing areas within each neuron and in cellular compartments (such as the nucleus) were selected using the Metamorph® image analysis system and the average signal intensity measured. Values were corrected by subtracting the average slide background intensity (measured outside of cells). Between 50 –100 neurons were analyzed for each case. The investigator was blinded to sample origin or diagnosis.
For linear regression analysis of the relationship between nuclear REST and the levels of proteins encoded by REST targets (BAX, DAXX, PSEN2, calbindin and somatostatin) (Fig. 2c, d); the activating histone mark H3K9Ac (Fig. 2c, d), or oxidative DNA damage (8-oxoguanine) (Extended Data Fig. 4h), we performed double-label immunofluorescence for REST (Bethyl antibody) and each individual protein or marker. Multiple 40x pictures were acquired (at various locations) within the prefrontal cortex displaying pyramidal neurons using an Olympus Fluoview Confocal Microscope. For cases displaying a majority of pyramidal neurons with very high (or very low) nuclear REST levels, fields were also included that displayed lower (or higher, respectively) REST levels, to test for potential correlations between REST and each target. Antigen-expressing areas within each neuron (such as the nucleus or the cytoplasm) were selected using the Metamorph® image analysis system and the average signal intensity was measured. Values were corrected by subtracting the average slide background intensity (measured outside of cells). Between 25 and 75 pyramidal neurons were quantified for each case for linear regression.
Image acquisition
Images were acquired using an Olympus Fluoview confocal microscope, or using a bright field microscope coupled to a CCD camera (Diagnostic Instruments, Inc.). No image processing was performed on the acquired images, with the exception of (i) Fig. 3c (the haematoxylin and eosin image) and (ii) Fig, 5b (the DAPI channel in DLB and FTD panels), which were contrasted to allow better visualization of cell nuclei.
Fluorescence-activated cell sorting (FACS)
Antibodies against nuclear proteins, as well as isotype-matched control IgGs, were preconjugated to Allophycocyanin (APC) using lightning-link APC conjugation kit (Innova Biosciences). The monoclonal antibody against NeuN coupled to Alexa-Fluor 488 (Millipore, MAB 477X) was used for neuron-specific labeling. The antibodies and reagents used in this study are listed in Supplementary Table 3. Approximately 1–2 μg of antibody was added to1×106 nuclei/ml and incubated at 4°C for 12 hrs with gentle rocking in the dark. Labeled nuclei were washed twice by centrifugation and filtered to remove clumps before performing FACS. The DNA binding dyes DAPI or propidium iodide were used for gating of nuclei. Aggregate discrimination was achieved based on the height, area and width parameters for front scattering (FSC) and side scattering (SSC). The purity and identity of isolated neuronal nuclei was further confirmed by microscopy and epigenetic analysis. For each antibody, the geometric mean value of single-nuclei events that is above the matched nonspecific IgG control was determined. An average of 10,000 events was acquired for FACS analysis. For ChIP assays, ~1×10⁶ FACS-sorted neuronal nuclei were collected by centrifugation.
Chromatin immunoprecipitation (ChIP) and nuclear isolation
The ChIP assay protocol has been described previously41. Cells or tissue homogenates were cross-linked using 1% formaldehyde (37% solution, sigma) at room temperature for 10min. Then the reaction was then stopped by adding glycine (1.25M, 10X) and washed twice by centrifugation. The cell pellet was dissolved in SDS lysis buffer (1% SDS, 10mM EDTA and 50mM Tris-HCl, pH 8.1). The genomic DNA was sheared into 300–1000bp by sonication (Bioruptor), followed by centrifugation. The supernatant was removed, diluted with ChIP dilution buffer (0.01%SDS, 1.1% TritonX-100, 1.2mM EDTA, 167mM NaCl, 16.7mM Tris-HCl, pH 8.1), and pre-cleared with Protein A Sephorose beads (Invitrogen) before adding antibody-conjugated beads. 5% of the sheared DNA was used as input control. After incubation with rocking at 4°C for 12 hrs, chromatin bound beads were washed twice with low salt wash buffer (0.1% SDS, 1% Triton X-100, 2mM EDTA, 150mM NaCl, 20mM Tris-HCl, pH 8.1), once with high salt wash buffer (0.1% SDS, 1% Triton X-100, 2mM EDTA, 500mM NaCl, 20mM Tris-HCl, pH 8.1), once with LiCl wash buffer (0.25M LiCl, 1% NP-40, 1% deoxycholic acid, 1mM EDTA, 10mM Tris-HCl, pH 8.1), and twice with TE buffer (1mM EDTA, 10mM Tris-HCl pH 8.1). The beads were then incubated with elution buffer (1% SDS, 0.1M NaHCO3), followed by de-cross-linking at 65 °C for 5 hrs. The eluted preparation was then treated with RNase A and proteinase K followed by isolation of DNA using the Qiagen PCR purification kit. For ChIP-PCR (Figs. 1f, 2a; Extended Data Figs. 2d, 6f), primers were directed to binding sites identified by ChIP-seq analysis of SH-SY5Y cells.
The isolation of nuclei from human brain tissue was performed using a protocol adapted from previously described methods42,43. Briefly, 0.5 g of frozen tissue was Dounce-homogenized in 10 ml of NF1 hypotonic buffer (0.4% Triton X100, 0.3 M Sucrose, 5 mM MgCl2, 0.1 mM EGTA, 1mM DTT, 10 mM Tris-HCl pH 8.0, supplemented with Complete protease inhibitors from Roche) on ice, incubated for 30min, and then Dounce-homogenized with 30 additional strokes. The homogenates were then centrifuged in a swinging-bucket rotor at 180g for 10 min at 4°C. The pellet was washed once with rocking at 4°C for 0.5 hr, and then resuspended in NF1 buffer. Crude nuclei were carefully layered onto a cushion of 5 ml sucrose solution [1.2 M (40%) sucrose, 3 mM MgCl2, 1 mM DTT, 10 mM Tris-HCl, ph 8.0], and centrifuged at 4,700g for 30 min at 4°C. The isolated nuclear preparation was resuspended in 1 ml NF2 buffer (0.1 M Sucrose, 5 mM MgCl2, 0.1 mM EDTA, 1% BSA, 10 mM Tris-HCl, pH 8.0), filtered with a 40 μm strainer (BD Falcon), and the number of nuclei was quantified after DAPI labeling, and then diluted to a concentration of 1×10⁶ nuclei/ml. For FACS-ChIP assays, 1g of brain tissue was Dounce-homogenized in 10 ml PBS with protease inhibitors (Complete, Roche) using pestle A, fixed with 1% formaldehyde for 10 min at room temperature, and then washed twice with NF1 buffer by centrifugation and gentle resuspension. The preparation was then treated as described above for brain tissue samples that did not undergo fixation.
ChIP sequencing
For ChIP-seq analysis, 10×15 cm2 dishes of SH-SY5Y cells at 80% confluence were incubated in the absence or presence of 5 mM LiCl (to induce REST expression) in SH-SY5Y cell culture medium (see “Cell cultures” below) for 12 hrs. ChIP was performed as described above, except that genomic DNA was sheared to 150–300 bp fragments – confirmed by agarose gel electrophoresis. For normalization and analysis of enrichment, input controls for each sample were sequenced. ChIP-DNA (2 ng) was used for library preparation followed by deep sequencing at the High Throughput Sequencing Facility of the University of North Carolina. Approximately 30 million ChIP-seq reads with read length of 36 were aligned to the hg18 genome assembly using ELAND with the default parameters. Sequence reads within REST binding sites were identified from ChIP-seq data using the latest version of MACS44 algorithm (1.4) with the default parameters. Genes that harbor REST binding sites within 10 kb of transcription start sites with at least 3-fold enrichment relative to the input control, statistical q-value<0.01 and P-value<1E-5 were considered as putative REST targets. Binding sites showed the canonical RE1 motif45, as well as previously identified noncanonical REST-binding motifs46,47 (Supplementary Information Table 4a, b). Fisher’s exact test was used to assess the statistical significance of the overlap between REST targets and genes that are age-regulated in the human prefrontal cortex.
REST-deficient mice
Animal housing and experimental procedures were approved by the Institutional Animal Care and Use Committees of Harvard Medical School. Mice carrying floxed alleles of REST flanking exon 2 were described previously48. These mice were crossed to Nestin-Cre transgenic mice (Jackson laboratory; strain No. 003771) to achieve REST conditional inactivation in the nervous system. The Nes-Cre transgene is in the C57BL/6J background, and the RESTlx/lx alleles were in a hybrid C57BL/6J and 129Sv/Ev background. The resulting Nestin-Cre:RESTlx/lx conditional knockout mice (hybrid C57BL/6J and 129Sv/Ev background), referred to as REST cKO, were born at expected Mendelian ratios, were viable and fertile, and did not display any visible alterations. The control group included RESTlx/lx and Nes-Cre mice. Mouse genotyping by PCR was performed using the following primers to amplify a region in the REST gene flanking exon 2: re08 (5’–CATGCGAGTACTGCCATACCCAAC-3’), re09 (5’–GTGATGGGGCAGTCTTCTGGAGG–3’), and re11 (5’–GGGCACACCTTTAATCCTAGCTTC–3’); this allowed the identification of WT (220 bp), floxed (264 bp) or recombined (375 bp) REST alleles48. The experimental groups included both male and female mice. The REST cKO and REST+/+ control groups were composed of littermate mice (same genetic background). Mice were identified by eartag numbers, and were randomly selected for histological processing (perfusion, brain dissection, etc.). The investigator was blind to age and genotype.
Immunohistochemical and histological analysis of mouse brain
Mice were anesthetized with isofulorane and carbon dioxide and then perfused with cold PBS buffer for 20 minutes. Brains were rapidly removed and placed in 4% PFA overnight. They were then processed for paraffin embedding, according to standard procedures. TUNEL labeling was performed following manufacturer’s instructions. For quantification of neuronal density, randomly selected areas within the hippocampus or the cortex, and at various depths within these structures, were imaged at 20x magnification. The number of cells (using either haematoxylin and eosin or NeuN labeling) was determined using the Metamorph® image analysis software and was then divided by the area occupied by these cells. The investigator was blind to the genotype.
Cell culture
REST cKO embryos and littermate controls were used to establish primary cortical and hippocampal cultures as described previously49. Each embryo was individually genotyped by PCR. Moreover, PCR analysis of DNA isolated from primary E16 embryonic neurons confirmed the excision of the REST floxed allele by Cre, in contrast to DNA derived from embryo tails. qRT-PCR was performed on the corresponding neuronal cultures or brain samples for genotype confirmation (RT-PCR: Forward primer: 5′-CTTTGTCCTTACTCAAGCTCTC-3′ Reverse primer: 5′-TTCCTGAGACTCGTTTTCAGCC-3′ Product size is 2034 bp).
Embryonic cultures from E16 fetuses were plated on either coverslips or culture dishes that were pre-coated with both poly-D-lysine (Beckton-Dickinson) and laminin, and maintained in serum-free neurobasal medium containing B27 supplements and GlutaMAX. Hippocampal cultures (7 days in vitro (DIV)) or cortical cultures (14 DIV) were treated with either oligomeric Aβ42 for 24 hrs or H2O2 for 5 hrs. Oligomeric Aβ was prepared as described previously50 and confirmed by SDS gel electrophoresis with and without boiling. Neuronal differentiation was comparable in REST cKO and control cultures after 1–2 weeks, as indicated by immunofluorescence labeling with antibody Tuj1 (MAB1637, Millipore), and Western blotting for the neuronal differentiation marker NeuN (MAB377, Millipore).
The SH-SY5Y neural cell line was maintained in Dulbecco’s Modified Eagle Medium (DMEM) with 4.5 mg/L D-glucose, 2 mM L-glutamine, 1 mM sodium pyruvate, 100 U/mL penicillin, 100 μg/mL streptomycin (all from Invitrogen), supplemented with 10% fetal bovine serum. To induce autophagy, SH-SY5Y cells were maintained in serum-free Opti-MEM medium (Invitrogen) for 24 hrs, and then treated with inhibitors (5 mM 3-methyladenine or 150 nM bafilomycin) or maintained in Opti-MEM without inhibitors for an additional 16 hrs prior to fixation and imaging. The cells did not show morphological changes or evidence of reduced viability under these conditions. Human cortical neuronal cultures (HCNC) were established as previously described51, and were maintained in neurobasal media with 2 mM L-glutamine and B27 supplements (Invitrogen). Mature HCNCs (14 DIV) were used for experiments. B27 supplements without added antioxidants were used for oxidative stress-related experiments.
Assessment of cell viability and apoptosis
Cell viability was assessed using a chromogenic assay that involves the biological reduction by viable cells of the tetrazolium compound 3-(4,5-dimethylthiazol-2-yl)-5-(3-carboxymethoxyphenyl)-2-(4-sulfophenyl)-2H-tetrazolium (MTS). Cells were seeded in either 48- or 96-well plates and treated at 80% confluence. After adding MTS to culture medium and incubating for 2 hrs in the dark at 37°C, absorbance was measured at 490 nm against a blank control with a plate reader. For detection of apoptotic cells, cells were incubated with Annexin V, Allophycocyanin Conjugate (APC Annexin V, Invitrogen) for 15 mins in 1x binding buffer (10 mM HEPES pH7.4, 0.14 M NaCl, 2.5 mM CaCl2). Cells were washed twice by centrifugation and resuspension and analyzed immediately by FACS.
Analysis of reactive oxygen species (ROS)
ROS levels were measured using the cell-permeable fluorescent indicator CellROX® Deep Red (#C10422, Invitrogen) with detection by FACS. SH-SY5Y cells were incubated in the absence or presence of hydrogen peroxide for 1 hr, which was removed followed by centrifugation and resuspension twice. The cells were then incubated with the CellROX Deep Red reagent for 30 mins at 37°C, placed on ice and then analyzed by FACS.
Immunocytochemical analysis of cultured cells
Cells plated on laminin/polylysine-coated coverslips were fixed by incubation with 4% (v/v) paraformaldehyde in PBS for 30 minutes at room temperature, followed by three washes in PBS, and then permeabilized with 0.1% Triton X-100 in PBS for 15 minutes at room temperature. After 3 additional washes in PBS, cells were blocked with 10% goat serum in PBS for 1 hour at room temperature. Primary antibodies were diluted to the appropriate concentration using 10% goat serum, and incubated overnight at 4°C. Cells were then washed 3 times in 1% goat serum in PBS for 10 minutes before adding fluorophore-conjugated secondary antibodies for 2 hours at room temperature. Fluorophore labeled cells were then washed in 1% goat serum in PBS for 3×10 minutes, and then mounted using Prolong Gold mounting medium with DAPI and anti-fade reagent (Invitrogen). To score endogenous nuclear REST in SH-SY5Ycells, Pearson correlations between DAPI and REST were generated from 200–300 cells from multiple coverslips using confocal analysis software. A threshold of R>0.6 was used to indicate positive nuclear localization.
Single cell gel electrophoresis (comet assay)
SH-SY5Y cells were treated with 100 μM hydrogen peroxide for 20 min at 4°C and then suspended in PBS containing 1 mM EDTA on ice. The alkaline comet assay was then performed using the CometAssay HT kit (Trevigen) according to the manufacturer’s protocol. The percentage of DNA in the comet tail was measured in 114–132 cells for each sample using CometScore image analysis software (TriTek).
Generation of cell-conditioned medium and cortical extracts
For conditioned medium transfer experiments (Extended Data Figs. 6g,h and 7a, b), cells were incubated with stress-inducing agents, followed by removal of the medium and 2 changes of fresh medium prior to the final addition of conditioning medium. After a 6 hr incubation period, the medium was removed and centrifuged twice to remove suspended cells or debris. The medium was then transferred to a new well containing naïve cells. After a 10 hr incubation period, the treated cells were harvested and analyzed. To generate extracts of human prefrontal cortex, ~200 mg cortical grey matter tissue samples were gently homogenized on ice using a Dounce A pestle in 2 ml of cell culture medium supplemented with protease inhibitors (Complete, Roche). Brain extracts were cleared by sequential centrifugation and resuspension (2×110g, 2×2,700g and 20,000g spin, each for 10 min at 4°C). The tissue extracts were normalized to the DNA concentration of the starting material, and added to cultured SH-SY5Y cells at 25% of total medium volume.
Generation of recombinant lentiviruses
Viral particles were generated in HEK293T cells by co-transfection of transfer vectors, packaging plasmid (pRSV-REV and pMDLg) and envelope plasmid (pCMV-VSVG) using Lipofectamine 2000 (Invitrogen). Cells were cultured for 2 days and the medium was collected, centrifuged at 180 g for 5 min, and passed through a 0.45 μm low protein binding filter (VWR). Viruses were then centrifuged at 110,000 g for 2 hrs at 4°C (Beckman SW28) and then resuspended in 200 μl of PBS. Viruses were titered by infecting SH-SY5Y cells at serial dilution. The percentage of transduced cells, identified by enhanced green fluorescent protein (EGFP) fluorescence, was measured by flow cytometry 72 hrs post-infection. Cells that express REST-IRS-GFP were sorted into low, middle and high expression populations based on GFP intensity, and the corresponding REST levels were determined by qRT-PCR.
C. elegans strains
The N2 Bristol strain was used as the wild-type background for these studies. C. elegans strains were cultured at 20°C under standard conditions52. The following mutations and chromosome rearrangements were used: LGI: spr-4(by105) 53, spr-4(tm465) (this study), daf-16(mu86)54, hT2[bli-4(e937) qIs48] (I;III); LGII: sod-1(tm776)55; LGV: spr-1(ok2144); and LGX: spr-3(ok2525) (this study). All strains, except for spr-4(tm465), were provided by the Caenorhabditis Genetics Center (CGC), which is funded by the NIH Office of Research Infrastructure Programs (P40 OD010440). Strains obtained from external sources which had been outcrossed previously were outcrossed to our N2 strains twice. Worms which had not been outcrossed previously were outcrossed six times.
C. elegans RNAi
RNAi feeding experiments were performed at 20°C. HT115 bacterial clones from a C. elegans RNAi feeding library (Geneservice) were used for spr-4 (C09H6.1), sod-1 (C15F1.7), and sod-2 (F10D11.1). Control RNAi was performed by feeding HT115 bacteria carrying the empty pL440 vector. Clones were sequence validated and knockdown was confirmed by semi-quantitative RT-PCR. The TU3270 (uIs57 [Punc-119::sid-1+ Punc-119::YFP+Pmec-6::mec-6]) strain was also used to assess neuronal loss-of-function56.
C. elegans microinjection and transgenic strains
Transgenic C. elegans lines were generated by microinjecting the relevant constructs into the gonads of the indicated strains. Prab-3::mCherry (pGH8, Addgene: 19359) was used as a coinjection marker labeling neurons. Three independent lines that demonstrated reliable transmission of the marker were propagated as described above for each experiment. Transgene expression was verified by qRT-PCR (see below), using primers that spanned exon junctions for spr-4 or human REST, normalized for possible DNA carryover by using two pairs of primers to the ampicillin resistance gene (present in all plasmids) and a specific site in pD152.79 (see table below for primer sequences). The spr-4 transgene was overexpressed by 18–24-fold relative to endogenous spr-4 expression in wild-type worms. The human REST transgene was expressed at levels comparable to the cdc-42 housekeeping gene.
To analyze RNA from transgenic lines, 100 Prab-3::mCherry positive worms (24 hours post-L4) of each strain (including controls) were placed into 1.5 ml M9 buffer. Worms were washed once in M9, pelleted by centrifugation, resuspended in 200 μl Trizol, vortexed for 2 minutes and flash frozen in liquid nitrogen. Worms were then freeze-cracked by thawing in a 37°C water bath and re-freezing in liquid nitrogen. This was repeated 2 more times. After the final thaw, 100 μl of Trizol was added and the tubes were maintained at room temperature for 5 minutes. RNA was then extracted with 140 μl of chloroform, precipitated with an equal volume of 70% ethanol and transferred to an RNeasy spin column (Qiagen) and purified. Quantitative RT-PCR was performed directly from isolated RNA, using 1ng of RNA and the Qiagen One Step qPCR mix. All reactions were performed in triplicate.
Analysis of Aβ toxicity in C. elegans
The UA198 Aβ-expressing strain (baIn34 [Peat-4::Abeta42, Pmyo-2::mCherry]; adIs1240[Peat-4::GFP]) was provided by the Caldwell lab57. This strain was crossed to wild-type males, and the resulting male progeny were crossed to spr-4(by105) homozygotes. Single F1 progeny bearing both fluorescent markers were each placed on individual plates (singled) and the subsequent F2 generation was singled and genotyped for spr-4. Homozygous spr-4(by105) mutants were then singled for several generations to ensure homozygosity of the transgenes before analysis. To assess toxicity of the Aβ42 transgene, worms were synchronized by transferring 8–10 young adults (24 hours post-L4) to a fresh plate, and allowing them to lay eggs for 12–14 hours. The adults were then removed and eggs were allowed to hatch at 20°C. Worms were then aged by transferring adults to fresh, seeded plates every other day. At days 3 and 7 of adulthood, approximately 25–40 worms were immobilized with sodium azide on 2% agarose pads on slides. Confocal z-sections covering the entire depth of the worms were taken on an Olympus Fluoview Confocal Microscope using the 488 laser and a GFP filter. The image files were then assigned to randomly named folders to blind the scoring of the number of tail neurons per worm. Control and mutant worms were always hatched, grown, aged and imaged in parallel, and the assay was repeated three times. Statistical significance was assessed by paired t-test on both the distribution of neuronal number and the mean percent of the population without neurodegeneration.
SPR-4 localization and induction by paraquat
To create SPR-4::GFP transgenic animals, unc-119(ed3) worms were bombarded with a cosmid that had been subjected to recombineering to introduce a GFP cassette onto the last exon of spr-4, creating a C-terminal fusion. Wild-type moving worms were isolated and singled. GFP signal was examined by confocal microscopy and worms with a bright, reproducible, and stable fluorescence were propagated. As described for the stress assay, worms were then transferred to plates containing either 5 mM paraquat and 100 μg/ml fluorodeoxyuridine (FUdR) or FUdR alone. On day four of treatment, worms were mounted on 2% agarose pads with sodium azide, and imaged by confocal microscopy at 60x magnification with a 1.5x digital zoom and 488 laser and GFP filter. z-stacks were taken throughout the head and tail regions of the worms, and fluorescence intensity of the punctate GFP signal was analyzed in ImageJ58. To assess statistical significance, a paired t-test between control and treated fluorescence intensity distributions was performed. Images were taken for at least 15 worms for each condition and each strain was analyzed in an independent paraquat treatment. For localization, SPR-4::GFP transgenic animals were mated to wild type males carrying the Prab-3::mCherry extrachromosomal array, and images were taken by confocal microscopy.
ROS detection in C. elegans
To measure ROS levels, 100 4-day old adult worms, grown as described for the paraquat survival assays, were transferred to Eppendorf tubes containing 1.5 ml of M9 buffer, washed once in M9, and then stained for 1 hour in 500 μl of M9 containing 25 μM 2′,7′-dichlorodihydrofluorescein diacetate (DCFDA, Life Sciences/Invitrogen) while rotating in the dark. Worms were then washed once with M9, and transferred to 1.5% agarose pads on glass slides, covered, and immediately imaged within 1 hour of washing out the DCFDA. Imaging was performed on an Olympus Fluoview Confocal Microscope using the 488 laser and GFP filter. At least 15 images were taken per genotype per replicate. Images were analyzed in ImageJ, where average intensity of the head region above the terminal pharyngeal bulb was scored and plotted using the boxplot function in R.
REST cDNA constructs and shRNAs
The pHAGE-CMV-Flag-REST-IRES-ZsGreen and pHAGE-CMV-ZsGreen plasmids were generously provided by Peter Mulligan59,60. The cDNA for wild type mouse REST in the pCS2+MT vector61 was amplified by high fidelity PCR with BamH I and EcoR I restriction sites at 5′ and 3′ ends, respectively. The PCR amplicon was digested with BamH I and EcoR I followed by gel purification and ligation into the FUGW lentiviral vector driven by the human ubiquitin C gene promoter62, and sequence verified. To generate the nuclear translocation-defective mutant ΔREST (Fig. 3a, b), a nuclear localization signal (amino acids 515–525)63 and the fifth zinc finger motif (amino acids 294–324)64 were deleted by high fidelity PCR using primers listed in Supplementary Table 2. The restriction site Xba I replaces amino acids 515–525 and adds two new amino acids Ser-Arg. The restriction site Nhe I replaces amino acids 294–324 and adds two new amino acids Ala-Ser.
Short-hairpin RNAs against human REST were expressed from the lentiviral plasmid pGIPZ (Open Biosystems). Mature antisense sequences of effective shRNAs are TCGATTAGTATTGTAGCCG (663–681) (shRESTa) and TTTGAACTGTAAATATCTG (392–410) (shRESTb). Numbers in parenthesis indicate the position of mature antisense sequences corresponding to the coding domain sequence (CDS) of human REST (3294 bp). As a control, the GIPZ non-silencing shRNAmir was used (Open Biosystems).
For C. elegans studies, full length spr-4 was isolated from fosmid DNA (WRM0628bF09, from the Sanger Institute collection) by PCR amplification with primers specific to the promoter regions (1.5 kb upstream of the transcriptional start site) and the UTR. The PCR product was sequence verified and used directly for injection. Human REST was isolated from cDNA and cloned into the vector pD152.79 MCS, downstream of the dpy-30 promoter and upstream of GFP. Sequencing verified the correct reading frame. The SPR-4::GFP fusion fosmid used in bombardment (Clone: 3167840880351681 C09) was provided by the Transgenome consortium65. Primers for sub-cloning are listed in Supplementary Table 2.
Statistical Analysis
Statistical analysis was performed using Graphpad software and the R program. Student’s t-tests were used to make comparisons between two groups with a normal distribution of data points. The Mann-Whitney-Wilcoxon Test was used for multiple samples without knowledge of their distribution. Age-related gene expression changes were identified by the Significant Analysis of Microarray (SAM) in R program. SAM identifies differentially expressed genes between young adult (less than 40 yrs, n=12) and Aged (greater than 70 yrs, n=16) by carrying out gene specific t-tests. Power analysis was used to ensure adequate statistical power for detecting significant differentially expressed genes in the microarray analysis. For sample n>12 in each group, there is 80% power to detect 1.5-fold changes at p-value < 0.01. We therefore report significant age-related gene expression changes using the cutoff q-value < 0.01 and fold change > 1.5. The overlap of age-regulated genes with REST targets genes identified by ChIP-seq was assessed using the Hypergeometric test (p-value=1.65E-12). Age-down-regulated genes are enriched in ChIP-seq targets based on the binomial test (p-value=3.5E-7). Pathway and upstream regulator enrichment for age-regulated genes and ChIP-seq target genes were analyzed by the Hypergeometric test using Ingenuity pathway analysis (IPA). Pearson’s correlation is used in this paper. By the central limit theorem, the distribution of the correlation coefficient is asymptotically normally distributed when the sample size is sufficiently large (n>30). Hence, the p-value for the Pearson’s correlation coefficient for Figures 6a, b, and d are calculated based on the normal distribution. Figure 6a shows plots for REST protein levels vs. cognitive test scores for multiple individual subjects. The correlation coefficient between REST protein level and cognitive variables are calculated based on n=111. Figure 6b shows a plot of REST protein level vs. Braak Score. The correlation coefficient between REST protein level and Braak Score is calculated based on n=37. Figure 6d shows a plot of REST protein level vs. age at death. The correlation coefficient between REST protein level and age is calculated based on n=61. Extended Fig. 2a compares the weighted mean expression level of REST target genes vs. age at death. Each point represents the mean of weighted expression of 342 REST target probe-sets that are age-regulated based on microarray. These mean values were weighted by the total expression level for each probe-set across all samples and were further normalized to the youngest adult value (24 yrs; 100%).
Extended Data
Extended Data Figure 1. Neuroanatomical distribution of REST induction in the aging human brain.
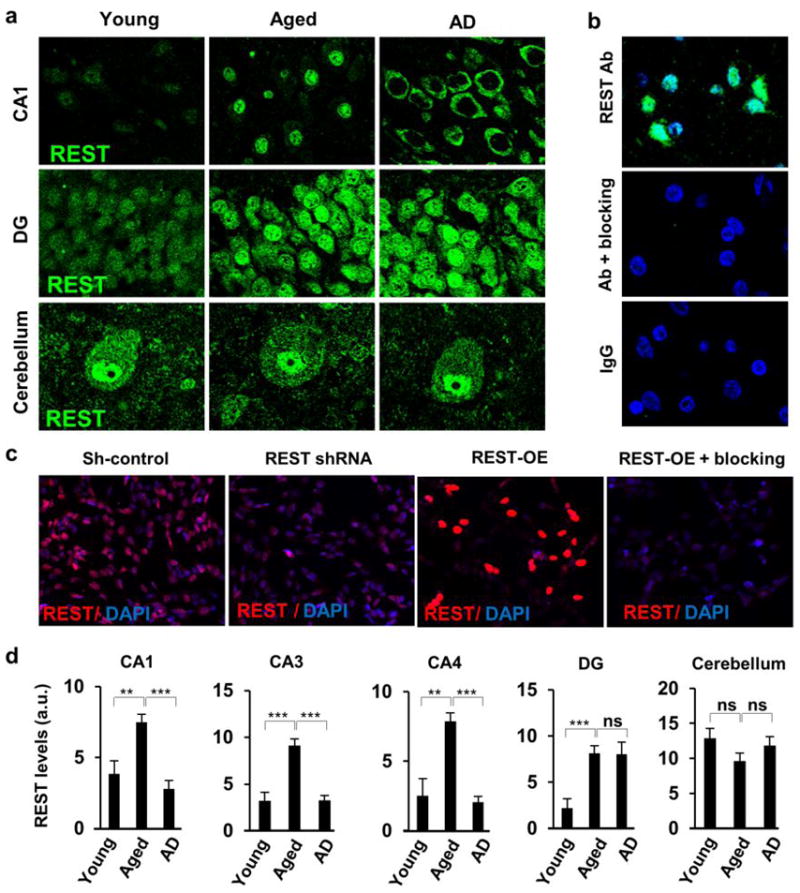
a. Representative confocal photomicrographs of hippocampal CA1 pyramidal neurons (upper panel), dentate gyrus granule neurons (middle panel, DG) and cerebellar Purkinje and granule cell neurons (lower panel), from young, aged or AD cases that were labeled for REST (green). Note the increased expression of REST in hippocampal CA1 pyramidal and dentate granule cell neurons in aged cases relative to young adult cases. Also note that nuclear REST is markedly reduced in AD in hippocampal CA1 neurons, but not in dentate granule cell or cerebellar neurons. b. Specificity of REST immunohistochemistry. Shown are sections of normal aged PFC labeled with anti-REST (Bethyl) (upper panel), anti-REST preincubated with a REST blocking peptide (middle panel), and non-specific IgG (lower panel). REST labeling is green; nuclear labeling with DAPI is blue. c. REST knockdown (REST shRNA) and overexpession (REST-OE) in SH-SY5Y cells confirm antibody specificity. Also shown is labeling with antibody preincubated with REST blocking peptide (REST-OE+blocking). REST knockdown and overexpression were confirmed by Western blotting (Extended Data Fig. 3b). d. Quantification of nuclear REST levels in hippocampal CA1, CA3, CA4 regions, in dentate gyrus granule cells (DG), and in cerebellar Purkinje cell neurons. REST is induced with age in CA1, CA3, CA4 and DG neurons, but not in cerebellar neurons. REST expression is reduced in AD in CA1, CA3, and CA4 neurons, but not in DG or cerebellar neurons. CA1: young n=11, aged n=30, AD n=33. CA3, CA4, DG and cerebellum: young n=8–9, aged n=7–8, AD= 9–10. Values are the mean ±S.E.M., * p<0.05, ** p<0.01 and *** p<0.001 by Student’s unpaired t-test. Scale bar: 25 μm.
Extended Data Figure 2. ChIP-seq analysis of REST target genes shows enrichment for genes related to cell death and the pathology of AD.

a. Genes identified by REST ChIP-seq in SH-SY5Y cells are downregulated in the aging human PFC. Expression of age-regulated REST target genes identified by ChIP-seq shows a highly significant inverse correlation with age at death. For each case, a weighted expression index was derived for age-regulated target genes based on microarray analysis. These values were normalized to the youngest adult value (24 yrs; 100%). N=43, age range 24–106 yrs. b. Canonical pathways by Ingenuity IPA analysis of REST ChiP-seq targets. c. REST ChIP-seq binding peaks in genes related to cell death pathways and AD pathology. d. Confirmation of ChIP-seq targets by quantitative ChIP-PCR following REST overexpression (OE-REST) or REST knockdown (sh-RESTa and sh-RESTb) in SH-SY5Y cells. Shown is ChIP followed by real time PCR using primers that amplify REST binding sites identified by ChIP-seq. PCR amplification of a region of the actin promoter not proximal to a known RE1 site was used as a negative control. Values are normalized to the input control and represent the mean±S.E.M., n=3. *P<0.05 relative to control by Student’s unpaired t-test.
Extended Data Figure 3. REST regulates expression of genes related to cell death and the neuropathology of AD.

a. REST knockdown with either of two distinct shRNAs (sh-RESTa and sh-RESTb) significantly increase mRNA expression of ChIP-seq targets related to cell death and AD pathology, whereas REST overexpression (REST) represses gene expression. Values are the mean ± S.D., n=3. *P<0.05 by Student’s unpaired t-test. b. Shown are Western blots of lysates from SH-SY5Y cells transduced with a control lentiviral vector (CTRL), or 3 separate REST shRNAs (sh-REST; each lane represents a different shRNA) or REST cDNA (REST) to knockdown or overexpress REST, respectively. c. REST knockdown (sh-REST) markedly induces phosho-tau epitopes (PHF-1 and AT8). Induction of these epitopes is blocked by lithium chloride (LiCl), an inhibitor of the tau kinase GSK3β.
Extended Data Fig. 4. REST protects against oxidative stress.

a. Cortical neuronal cultures from REST-deficient (REST cKO) mice show extensive neuritic degeneration relative to control cultures after incubation with 5 μM oligomeric Aβ42 for 24 hrs, which is prevented by lentiviral transduction of REST (REST cKO + REST). Neuritic processes are labeled with antibody TUJ1. Scale bar: 30 μm. b. Pro-apoptotic genes show increased mRNA expression in REST-deficient cortical neuronal cultures after treatment with hydrogen peroxide (50 μM H2O2, 3 hrs) or oligomeric Aβ42 (5 μM, 8 hrs). Increased expression was reversed by lentiviral transduction of REST (REST cKO+REST). Values are the mean ±S.E.M., n=4. *P<0.05 by Student’s unpaired t-test. c. REST knockdown potentiates hydrogen peroxide-induced apoptosis in SH-SY5Y cells. Increased cell death was prevented by transducing a REST construct (mouse REST) resistant to the shRNA. Cells were incubated with 800 μM H2O2 for 2 hrs, and apoptotic cells were quantified by FACS analysis of Annexin V-APC. Values represent fold change relative to the untreated control. d. REST knockdown (Sh-REST) increases vulnerability to oxidative stress in cultured primary human cortical neurons treated with 100 μM H2O2 for 2 hrs relative to control cultures (Sh-CTRL). e. REST knockdown increases generation of reactive oxygen species (ROS). Shown are FACS profiles of a fluorescent ROS indicator (CellRox). Note right-ward shift (increased ROS) in H2O2-treated (600 μM, 2 hrs) SH-SY5Y cells (red) vs untreated controls (blue) following lentiviral transduction of REST shRNA (Sh-REST). f. Increased ROS levels in SH-SY5Y cells expressing either of two different REST shRNAs (sh-RESTa and sh-RESTb) is reversed by the antioxidant N-acetyl cysteine (NAC, 5 mM). g. REST protects against oxidative DNA damage. Shown is a measure of DNA fragmentation in the Comet Assay following treatment of SH-SY5Y cells with H2O2. Note increase in DNA damage induced by either of two REST shRNAs (Sh-RESTa and Sh-RESTb) relative to cells transduced with a control shRNA (Sh-CTRL). Conversely, overexpression of REST reduces oxidative DNA damage relative to overexpression of GFP (CTRL). Horizontal bars indicate the mean value. **P<0.0001 by the Mann-Whitney test; n=114–134. Values in b, c, d and f represent the mean ± S.E.M, n=6–10, *P<0.05, **P<0.01 by Student’s unpaired t-test. h. Inverse correlation between oxidative DNA damage and nuclear REST levels in normal aging and early AD (AD1). Shown is double-labeling for REST and 8-oxoguanine (8oxoG) in hippocampal CA1 neurons. Scale bar, 20μm.
Extended Data Figure 5. Caenorhabditis elegans spr genes and oxidative stress resistance.

a. Mutations of spr-1, spr-3 and spr-4 reduce survival in the presence of oxidative stress. Worms were continuously incubated with the superoxide-generating agent paraquat (5 mM). Shown are representative time courses of survival, and quantification of reduced mean lifespan relative to wild-type in worms incubated with paraquat. Shown are mutants in spr-1 and spr-3, two different mutants in spr-4, and a double spr-3/spr-4 mutant [spr-4(by105);spr-3(ok2525)]. The spr-4(by105);spr-3(ok2525) mutant showed similar survival to wild-type in the absence of paraquat. Values represent the decrease in mean lifespan as % relative to wild-type and represent the mean ± S.D., n=3. *P<0.05 by log-rank test. b. Depletion of spr-4 by RNAi increases sensitivity to oxidative stress and phenocopies the spr-4(by105) mutation. Worms were fed RNAi against the indicated genes or an empty vector control and then transferred to plates seeded with standard OP50 bacteria and containing 5 mM paraquat. Shown is the percent decrease in mean survival relative to the empty vector control from 3 independent experiments. Two spr-4 RNAi-expressing bacterial strains were used (Methods). In addition to N2, we also utilized a C. elegans strain (TU3270) with enhanced dsRNA uptake in neurons (Methods). One of the spr-4 RNAi strains generated a significantly greater reduction in survival in the TU3270 background compared with N2. The paraquat sensitivity of worms fed RNAi against the antioxidant gene sod-1 was used as a positive control. Values are the mean ± S.D., n=3. *P<0.05 by log-rank test. c. A stably integrated SPR4::GFP construct under the control of the endogenous spr-4 promoter is expressed predominantly in neurons in adult worms, as indicated by co-localization with the neuronal marker prab-3::mCherry. Upper panels: pharyngeal ring neurons; lower panels: tail neurons. Scale bar: 20 μm. d. Treatment of adult worms with paraquat (+PQ) from day 1 to day 4 induces expression of SPR4::GFP. Untreated worms (−PQ). Upper panels show confocal imaging of a representative strain; the lower panel graph shows quantitative analysis of SPR4::GFP expression in 3 separate strains. Horizontal bars indicate the median; boxed areas represent the second and third quartiles. n=3 (15 worms each); ***P<0.001 by unpaired t-test. e. REST represses expression of the presenilin hop-1 in C. elegans. Expression of hop-1 mRNA was measured by qRT-PCR in 24-hour post L4 worms of the indicated genotypes. For each replicate, transcript values were normalized to cdc-42. Note that hop-1 mRNA expression is increased in the spr-4(by105) mutant, and that repression is partially restored by wild-type spr-4 or human REST (REST). Values represent fold change relative to the wild-type control (1) and represent the mean ± S.D., n=3. *P<0.05 by Student’s t-test. Scale bars, 20μm.
Extended Data Figure 6. Induction of REST by stress and cell non-autonomous signaling.

a–d. Redox-active Fe+2 (15 μM), Aβ42 (15 μM), H2O2 (indicated concentrations), and the glutathione synthesis inhibitor BSO (50 μM) increase REST protein levels in primary human cortical neuronal cultures. Shown are Western blots for REST and actin. e. REST mRNA levels determined by qRT-PCR. f. Treatment of human neurons with Fe+2 or Aβ42 increase REST-RE1 site binding in the SNAP25 and calbindin 1 genes as determined by ChIP-qPCR. g. REST mRNA levels measured by qRT-PCR after addition of conditioned medium from H2O2-treated (30 μM- H30, 100 μM-H100, 300 μM-H300, 600 μM- H600, 800 μM- H800) or control neuronal cultures (CTRL CM) to naïve neurons. h. Extracts from aged human PFC (O) induce REST when added to SH-SY5Y cells. Much lower levels of induction are induced by extracts derived from young adult (Y) or AD cortex. Shown are Western blots for REST, β-catenin and β-actin. Values in e-g represent the mean±S.D., n=3. *P<0.05, **P<0.01 by Student’s unpaired t-test.
Extended Data Figure 7. Induction of REST by Wnt signaling.

a. Cell non-autonomous induction of REST by aged brain extracts is partially inhibited by the Wnt antagonist Dickkopf (DKK). Extracts were derived from young adult (Y), aged (O) or AD PFC of the indicated ages and then incubated with SH-SY5Y cells in the absence (−) or presence (+) of DKK (250 ng/ml). b. Conditioned medium transferred from SH-SY5Y cells, treated with either wortmannin (2 μM), tunicamycin (2 μM), H2O2 (100 μM) or LiCl (10 mM), induce REST when added to naïve cells, which is inhibited by DKK. c. REST levels are increased by treatment of SH-SY5Y cells with Wnt 3a or 7a (250 ng/ml, 16 hrs; upper Western blot), and by LiCl (5 or 10 mM, 6 hrs) or Chiron 99021 (20 nM, 6 hrs) (lower Western blot).
d. REST ChIP-seq shows that the Wnt activator LiCl (5 mM) broadly increases REST binding to target genes. Shown are REST targets P<10−5 with REST-RE1 site binding within 10 kb of the transcription start site. They include genes related to AD pathology, such as the gamma secretase presenilin-2 (PSEN2), and pro-apoptotic genes (PUMA, BAX, DAXX, TRADD and BCL2L11). e, f. SH-SY5Y cells incubated with LiCl (10 mM, 24 hrs) or Chiron 99021 (100 nM, 24 hrs) exhibit increased nuclear REST. Nuclei are stained dark blue with DAPI, which become light blue when there is overlap with the green REST staining (e). Quantitative analysis of % REST-positive nuclei (f). g. Increased nuclear β-catenin in the PFC in normal aging, and reduced levels in AD. Shown is FACS analysis of neuronal nuclei isolated from PFC. Values are the mean±S.E.M. *P<0.05, **P<0.01 by Student’s unpaired t-test. Young, n=13; Aged, n=18; AD, n=10. h. Co-localization of REST and β-catenin in the nucleus of aging neurons in the PFC. Aged and AD cases were double-labeled for REST (green) and β-catenin (red). Scale bars, 20μm.
Extended Data Figure 8. Autophagy and REST.

a. REST is distributed in a vesicular punctate distribution in the cytoplasm of cortical neurons in AD. Confocal immunofluorescence microscopy shows co-localization of REST with the autophagosome markers LC3, Atg 7 and Atg 12, but not with the lysosomal markers LAMP-1 or LAMP-2. b. Nuclear REST levels are reduced by activation of autophagy. SH-SY5Y cells were subject to serum withdrawal (-FBS, 40 hrs) to induce autophagy and maintained in Opti-MEM to preserve cell viability. Note that serum withdrawal results in depletion of nuclear REST (loss of green labeling that overlaps with the blue DAPI nuclear stain), which is restored by bafilomycin (-FBS/Baf). c. The autophagy inhibitors 3-methyladenine (3-MA, 5 mM) and bafilomycin (Baf, 150 nM) increase nuclear REST. Values represent % of cells positive for nuclear REST, and represent the mean ± S.E.M., n=3; **P<0.01 by Student’s t-test. Scale bars: 15 μm.
Extended Data Figure 9. Neuronal REST levels are positively correlated with cognitive function and inversely correlated with AD neuropathology.

a. Linear regression analysis shows that nuclear REST levels in PFC neurons are positively correlated with measures of cognition function. REST levels were determined by FACS analysis of isolated PFC neuronal nuclei. Each point represents an individual case, and is normalized as fold change relative to the mean value of the young adult group. N=37, age range 67–90 yrs. b. Nuclear REST levels in prefrontal cortical neurons decrease with increasing AD pathology. Shown are CERAD (1-frequent plaques, 2–3 sparse/moderate plaques, 4-no plaques) and NIA-Reagan scores (composite index of neuritic plaques and neurofibrillary tangles; 1-high likelihood of AD, 2-intermediate likelihood, 3-low likelihood). Values are the mean±S.E.M. CERAD 1, n=20; 2–3, n=11; 4, n=9; NIA-Reagan 1, n=12; 2, n=14; 3, n=14. * p<0.05, *** p<0.001.
Extended Data Figure 10. REST, longevity and stress resistance.

a. Prefrontal cortical (upper panel), hippocampal CA1 (middle panel) and cerebellar (lower panel) sections of individuals ranging in age from 57–102 years were double-labeled for REST (green) and the neuronal marker MAP2 (red). Cases with extreme longevity (98, 102 years) are associated with marked induction of REST in prefrontal cortical and hippocampal CA1 neurons, but not in cerebellar Purkinje cell (ovals) or granule cell neurons (to the right of the dashed line). Scale bar: 20 μm. b. REST increases the expression of genes associated with stress resistance and longevity. Shown are fold changes in mRNA levels for catalase (CAT), superoxide dismutase (SOD1) and FOXO1a (FOXO1) following REST knockdown (sh-RESTa or sh-RESTb) or overexpression (REST). Values represent the mean±S.D., *P<0.05 by Student’s unpaired t-test. n=3. c. FOXO1a expression is dependent on REST. Western blotting of SH-SY5Y cells shows that shRNA-mediated REST knockdown (sh-REST +) almost completely abolishes FOXO1a protein, which is prevented by shRNA-resistant mouse REST.
Supplementary Material
Acknowledgments
We thank members of the Yankner laboratory for suggestions and discussion, Monlan Yuan, Allison Harwick, Kelly Dakin and Gregory Klein for assistance, and Cheng Li and Dana Gabuzda for helpful discussion. We also acknowledge the Rush Alzheimer’s Disease Center, the Brigham and Women’s Hospital Brain Bank, the Massachusetts General Hospital ADRC Brain Bank, and the Kathleen Price Bryan Brain Bank at Duke University for providing tissue samples. This work was supported by an NIH Director’s Pioneer Award (DP1OD006849) and NIH grants PO1AG27916 and RO1AG26651 to B.A.Y., RO1GM072551 to M.P.C., P30AG10161, R01AG15819 and R01AG17917 to D.A.B, and a grant from the Glenn Foundation for Medical Research to B.A.Y. J.Z. is a Molecular Biology of Neurodegeneration fellow at Harvard Medical School.
Footnotes
Supplementary Information is available in the online version of the paper.
Author Contributions: T.L, L.A., J.Z., Y.P., H.K., and H.-M.K. performed experiments. T.L., L.A., J.Z., M.C. and B.A.Y. contributed to the overall study design. T.L., Y.C., T.-H.Y., D.D. and X.L. performed informatics analysis. D.A.B. contributed tissue samples, cognitive test data and analysis. B.A.Y. directed the study and B.A.Y., T.L., L.A. and J.Z. wrote the manuscript, which was edited by all the coauthors.
Data are available in the Gene Expression Omnibus (GEO) under accession GSE53890.
Reprints and permissions information is available at www.nature.com/reprints.
The authors declare no competing financial interests.
References
- 1.Gomez-Isla T, et al. Profound loss of layer II entorhinal cortex neurons occurs in very mild Alzheimer’s disease. J Neurosci. 1996;16:4491–4500. doi: 10.1523/JNEUROSCI.16-14-04491.1996. [DOI] [PMC free article] [PubMed] [Google Scholar]
- 2.Peters A, Sethares C, Moss MB. The effects of aging on layer 1 in area 46 of prefrontal cortex in the rhesus monkey. Cereb Cortex. 1998;8:671–684. doi: 10.1093/cercor/8.8.671. [DOI] [PubMed] [Google Scholar]
- 3.Yankner BA, Lu T, Loerch P. The aging brain. Annu Rev Pathol. 2008;3:41–66. doi: 10.1146/annurev.pathmechdis.2.010506.092044. [DOI] [PubMed] [Google Scholar]
- 4.Kenyon CJ. The genetics of ageing. Nature. 2010;464:504–512. doi: 10.1038/nature08980. [DOI] [PubMed] [Google Scholar]
- 5.Spalding KL, Bhardwaj RD, Buchholz BA, Druid H, Frisen J. Retrospective birth dating of cells in humans. Cell. 2005;122:133–143. doi: 10.1016/j.cell.2005.04.028. [DOI] [PubMed] [Google Scholar]
- 6.Chong JA, et al. REST: a mammalian silencer protein that restricts sodium channel gene expression to neurons. Cell. 1995;80:949–957. doi: 10.1016/0092-8674(95)90298-8. [DOI] [PubMed] [Google Scholar]
- 7.Schoenherr CJ, Anderson DJ. The neuron-restrictive silencer factor (NRSF): a coordinate repressor of multiple neuron-specific genes. Science. 1995;267:1360–1363. doi: 10.1126/science.7871435. [DOI] [PubMed] [Google Scholar]
- 8.Ballas N, Grunseich C, Lu DD, Speh JC, Mandel G. REST and its corepressors mediate plasticity of neuronal gene chromatin throughout neurogenesis. Cell. 2005;121:645–657. doi: 10.1016/j.cell.2005.03.013. [DOI] [PubMed] [Google Scholar]
- 9.Lu T, et al. Gene regulation and DNA damage in the ageing human brain. Nature. 2004;429:883–891. doi: 10.1038/nature02661. [DOI] [PubMed] [Google Scholar]
- 10.Loerch PM, et al. Evolution of the aging brain transcriptome and synaptic regulation. PLoS One. 2008;3:e3329. doi: 10.1371/journal.pone.0003329. [DOI] [PMC free article] [PubMed] [Google Scholar]
- 11.Holtzman DM, Morris JC, Goate AM. Alzheimer’s disease: the challenge of the second century. Sci Transl Med. 2011;3:77sr71. doi: 10.1126/scitranslmed.3002369. [DOI] [PMC free article] [PubMed] [Google Scholar]
- 12.Grimes JA, et al. The co-repressor mSin3A is a functional component of the REST-CoREST repressor complex. J Biol Chem. 2000;275:9461–9467. doi: 10.1074/jbc.275.13.9461. [DOI] [PubMed] [Google Scholar]
- 13.Shimojo M. Characterization of the nuclear targeting signal of REST/NRSF. Neurosci Lett. 2006;398:161–166. doi: 10.1016/j.neulet.2005.12.080. [DOI] [PubMed] [Google Scholar]
- 14.Wen C, Levitan D, Li X, Greenwald I. spr-2, a suppressor of the egg-laying defect caused by loss of sel-12 presenilin in Caenorhabditis elegans, is a member of the SET protein subfamily. Proc Natl Acad Sci USA. 2000;97:14524–14529. doi: 10.1073/pnas.011446498. [DOI] [PMC free article] [PubMed] [Google Scholar]
- 15.Lakowski B, et al. Two suppressors of sel-12 encode C2H2 zinc-finger proteins that regulate presenilin transcription in Caenorhabditis elegans. Development. 2003;130:2117–2128. doi: 10.1242/dev.00429. [DOI] [PubMed] [Google Scholar]
- 16.Jarriault S, Greenwald I. Suppressors of the egg-laying defective phenotype of sel-12 presenilin mutants implicate the CoREST corepressor complex in LIN-12/Notch signaling in C. elegans. Genes Dev. 2002;16:2713–2728. doi: 10.1101/gad.1022402. [DOI] [PMC free article] [PubMed] [Google Scholar]
- 17.Treusch S, et al. Functional links between Abeta toxicity, endocytic trafficking, and Alzheimer’s disease risk factors in yeast. Science. 2011;334:1241–1245. doi: 10.1126/science.1213210. [DOI] [PMC free article] [PubMed] [Google Scholar]
- 18.Willert J, Epping M, Pollack JR, Brown PO, Nusse R. A transcriptional response to Wnt protein in human embryonic carcinoma cells. BMC Dev Biol. 2002;2:8. doi: 10.1186/1471-213x-2-8. [DOI] [PMC free article] [PubMed] [Google Scholar]
- 19.Lipinski MM, et al. Genome-wide analysis reveals mechanisms modulating autophagy in normal brain aging and in Alzheimer’s disease. Proc Natl Acad Sci USA. 2010;107:14164–14169. doi: 10.1073/pnas.1009485107. [DOI] [PMC free article] [PubMed] [Google Scholar]
- 20.Tothova Z, et al. FoxOs are critical mediators of hematopoietic stem cell resistance to physiologic oxidative stress. Cell. 2007;128:325–339. doi: 10.1016/j.cell.2007.01.003. [DOI] [PubMed] [Google Scholar]
- 21.Li Y, et al. Genetic association of FOXO1A and FOXO3A with longevity trait in Han Chinese populations. Hum Mol Genet. 2009;18:4897–4904. doi: 10.1093/hmg/ddp459. [DOI] [PMC free article] [PubMed] [Google Scholar]
- 22.Ballas N, Mandel G. The many faces of REST oversee epigenetic programming of neuronal genes. Curr Opin Neurobiol. 2005;15:500–506. doi: 10.1016/j.conb.2005.08.015. [DOI] [PubMed] [Google Scholar]
- 23.Otto SJ, et al. A new binding motif for the transcriptional repressor REST uncovers large gene networks devoted to neuronal functions. J Neurosci. 2007;27:6729–6739. doi: 10.1523/jneurosci.0091-07.2007. [DOI] [PMC free article] [PubMed] [Google Scholar]
- 24.Abrajano JJ, et al. REST and CoREST modulate neuronal subtype specification, maturation and maintenance. PLoS ONE. 2009;4:e7936. doi: 10.1371/journal.pone.0007936. [DOI] [PMC free article] [PubMed] [Google Scholar]
- 25.Yu M, et al. NRSF/REST neuronal deficient mice are more vulnerable to the neurotoxin MPTP. Neurobiol Aging. 2013;34:916–927. doi: 10.1016/j.neurobiolaging.2012.06.002. [DOI] [PubMed] [Google Scholar]
- 26.Fischer A, Sananbenesi F, Wang X, Dobbin M, Tsai LH. Recovery of learning and memory is associated with chromatin remodelling. Nature. 2007;447:178–182. doi: 10.1038/nature05772. [DOI] [PubMed] [Google Scholar]
- 27.Graff J, Tsai LH. Histone acetylation: molecular mnemonics on the chromatin. Nat Rev Neurosci. 2013;14:97–111. doi: 10.1038/nrn3427. [DOI] [PubMed] [Google Scholar]
- 28.Ronan JL, Wu W, Crabtree GR. From neural development to cognition: unexpected roles for chromatin. Nat Rev Genet. 2013;14:347–359. doi: 10.1038/nrg3413. [DOI] [PMC free article] [PubMed] [Google Scholar]
- 29.Bruce AW, et al. Genome-wide analysis of repressor element 1 silencing transcription factor/neuron-restrictive silencing factor (REST/NRSF) target genes. Proc Natl Acad Sci U S A. 2004;101:10458–10463. doi: 10.1073/pnas.0401827101. [DOI] [PMC free article] [PubMed] [Google Scholar]
- 30.Bennett DA, Schneider JA, Arvanitakis Z, Wilson RS. Overview and findings from the religious orders study. Curr Alzheimer Res. 2012;9:628–645. doi: 10.2174/156720512801322573. [DOI] [PMC free article] [PubMed] [Google Scholar]
- 31.Bennett DA, et al. Overview and findings from the rush Memory and Aging Project. Curr Alzheimer Res. 2012;9:646–663. doi: 10.2174/156720512801322663. [DOI] [PMC free article] [PubMed] [Google Scholar]
- 32.Bennett DA, et al. Decision rules guiding the clinical diagnosis of Alzheimer’s disease in two community-based cohort studies compared to standard practice in a clinic-based cohort study. Neuroepidemiology. 2006;27:169–176. doi: 10.1159/000096129. [DOI] [PubMed] [Google Scholar]
- 33.Bennett DA, et al. Natural history of mild cognitive impairment in older persons. Neurology. 2002;59:198–205. doi: 10.1212/wnl.59.2.198. [DOI] [PubMed] [Google Scholar]
- 34.Schneider JA, Arvanitakis Z, Leurgans SE, Bennett DA. The neuropathology of probable Alzheimer disease and mild cognitive impairment. Ann Neurol. 2009;66:200–208. doi: 10.1002/ana.21706. [DOI] [PMC free article] [PubMed] [Google Scholar]
- 35.Loerch PM, et al. Evolution of the aging brain transcriptome and synaptic regulation. PLoS One. 2008;3:e3329. doi: 10.1371/journal.pone.0003329. [DOI] [PMC free article] [PubMed] [Google Scholar]
- 36.Bolstad BM, Irizarry RA, Astrand M, Speed TP. A comparison of normalization methods for high density oligonucleotide array data based on variance and bias. Bioinformatics. 2003;19:185–193. doi: 10.1093/bioinformatics/19.2.185. [DOI] [PubMed] [Google Scholar]
- 37.Tusher VG, Tibshirani R, Chu G. Significance analysis of microarrays applied to the ionizing radiation response. Proc Natl Acad Sci USA. 2001;98:5116–5121. doi: 10.1073/pnas.091062498. [DOI] [PMC free article] [PubMed] [Google Scholar]
- 38.Bruce AW, et al. Genome-wide analysis of repressor element 1 silencing transcription factor/neuron-restrictive silencing factor (REST/NRSF) target genes. Proc Natl Acad Sci USA. 2004;101:10458–10463. doi: 10.1073/pnas.0401827101. [DOI] [PMC free article] [PubMed] [Google Scholar]
- 39.Li C, Wong WH. Model-based analysis of oligonucleotide arrays: expression index computation and outlier detection. Proc Natl Acad Sci USA. 2001;98:31–36. doi: 10.1073/pnas.011404098. [DOI] [PMC free article] [PubMed] [Google Scholar]
- 40.Yu M, et al. Alteration of NRSF expression exacerbating 1-methyl-4-phenyl-pyridinium ion-induced cell death of SH-SY5Y cells. Neurosci Res. 2009;65:236–244. doi: 10.1016/j.neures.2009.07.006. [DOI] [PubMed] [Google Scholar]
- 41.Lu T, et al. Gene regulation and DNA damage in the ageing human brain. Nature. 2004;429:883–891. doi: 10.1038/nature02661. [DOI] [PubMed] [Google Scholar]
- 42.Spalding KL, Bhardwaj RD, Buchholz BA, Druid H, Frisen J. Retrospective birth dating of cells in humans. Cell. 2005;122:133–143. doi: 10.1016/j.cell.2005.04.028. [DOI] [PubMed] [Google Scholar]
- 43.Siegmund KD, et al. DNA methylation in the human cerebral cortex is dynamically regulated throughout the life span and involves differentiated neurons. PLoS One. 2007;2:e895. doi: 10.1371/journal.pone.0000895. [DOI] [PMC free article] [PubMed] [Google Scholar]
- 44.Zhang Y, et al. Model-based analysis of ChIP-Seq (MACS) Genome Biol. 2008;9:R137. doi: 10.1186/gb-2008-9-9-r137. [DOI] [PMC free article] [PubMed] [Google Scholar]
- 45.Schoenherr CJ, Anderson DJ. The neuron-restrictive silencer factor (NRSF): a coordinate repressor of multiple neuron-specific genes. Science. 1995;267:1360–1363. doi: 10.1126/science.7871435. [DOI] [PubMed] [Google Scholar]
- 46.Johnson DS, Mortazavi A, Myers RM, Wold B. Genome-wide mapping of in vivo protein-DNA interactions. Science. 2007;316:1497–1502. doi: 10.1126/science.1141319. [DOI] [PubMed] [Google Scholar]
- 47.Otto SJ, et al. A new binding motif for the transcriptional repressor REST uncovers large gene networks devoted to neuronal functions. J Neurosci. 2007;27:6729–6739. doi: 10.1523/jneurosci.0091-07.2007. [DOI] [PMC free article] [PubMed] [Google Scholar]
- 48.Mao CA, et al. Neuronal transcriptional repressor REST suppresses an Atoh7-independent program for initiating retinal ganglion cell development. Dev Biol. 2011;349:90–99. doi: 10.1016/j.ydbio.2010.10.008. [DOI] [PMC free article] [PubMed] [Google Scholar]
- 49.Lorenzo A, et al. Amyloid beta interacts with the amyloid precursor protein: a potential toxic mechanism in Alzheimer’s disease. Nat Neurosci. 2000;3:460–464. doi: 10.1038/74833. [DOI] [PubMed] [Google Scholar]
- 50.Kayed R, et al. Fibril specific, conformation dependent antibodies recognize a generic epitope common to amyloid fibrils and fibrillar oligomers that is absent in prefibrillar oligomers. Mol Neurodegener. 2007;2:18. doi: 10.1186/1750-1326-2-18. [DOI] [PMC free article] [PubMed] [Google Scholar]
- 51.Busciglio J, Yankner BA. Apoptosis and increased generation of reactive oxygen species in Down’s syndrome neurons in vitro. Nature. 1995;378:776–779. doi: 10.1038/378776a0. [DOI] [PubMed] [Google Scholar]
- 52.Brenner S. The genetics of Caenorhabditis elegans. Genetics. 1974;77:71–94. doi: 10.1093/genetics/77.1.71. [DOI] [PMC free article] [PubMed] [Google Scholar]
- 53.Lakowski B, et al. Two suppressors of sel-12 encode C2H2 zinc-finger proteins that regulate presenilin transcription in Caenorhabditis elegans. Development (Cambridge, England) 2003;130:2117–2128. doi: 10.1242/dev.00429. [DOI] [PubMed] [Google Scholar]
- 54.Lin K, Dorman JB, Rodan A, Kenyon C. daf-16: An HNF-3/forkhead Family Member That Can Function to Double the Life-Span of Caenorhabditis elegans. Science. 1997;278:1319–1322. doi: 10.1126/science.278.5341.1319. [DOI] [PubMed] [Google Scholar]
- 55.Van Raamsdonk JM, Hekimi S. Deletion of the mitochondrial superoxide dismutase sod-2 extends lifespan in Caenorhabditis elegans. PLoS Genet. 2009;5:e1000361. doi: 10.1371/journal.pgen.1000361. [DOI] [PMC free article] [PubMed] [Google Scholar]
- 56.Calixto A, Chelur D, Topalidou I, Chen X, Chalfie M. Enhanced neuronal RNAi in C. elegans using SID-1. Nat Methods. 2010;7:554–559. doi: 10.1038/nmeth.1463. [DOI] [PMC free article] [PubMed] [Google Scholar]
- 57.Treusch S, et al. Functional Links Between Aβ Toxicity, Endocytic Trafficking, and Alzheimer’s Disease Risk Factors in Yeast. Science. 2011;334:1241–1245. doi: 10.1126/science.1213210. [DOI] [PMC free article] [PubMed] [Google Scholar]
- 58.Abràmoff MD, Magalhães PJ, Ram SJ. Image processing with ImageJ. Biophotonics international. 2004;11:36–42. [Google Scholar]
- 59.Mulligan P, et al. CDYL bridges REST and histone methyltransferases for gene repression and suppression of cellular transformation. Mol Cell. 2008;32:718–726. doi: 10.1016/j.molcel.2008.10.025. [DOI] [PMC free article] [PubMed] [Google Scholar]
- 60.Westbrook TF, et al. SCFbeta-TRCP controls oncogenic transformation and neural differentiation through REST degradation. Nature. 2008;452:370–374. doi: 10.1038/nature06780. [DOI] [PMC free article] [PubMed] [Google Scholar]
- 61.Shimojo M, Hersh LB. Characterization of the REST/NRSF-interacting LIM domain protein (RILP): localization and interaction with REST/NRSF. J Neurochem. 2006;96:1130–1138. doi: 10.1111/j.1471-4159.2005.03608.x. [DOI] [PubMed] [Google Scholar]
- 62.Lois C, Hong EJ, Pease S, Brown EJ, Baltimore D. Germline transmission and tissue-specific expression of transgenes delivered by lentiviral vectors. Science. 2002;295:868–872. doi: 10.1126/science.1067081. [DOI] [PubMed] [Google Scholar]
- 63.Grimes JA, et al. The co-repressor mSin3A is a functional component of the REST-CoREST repressor complex. J Biol Chem. 2000;275:9461–9467. doi: 10.1074/jbc.275.13.9461. [DOI] [PubMed] [Google Scholar]
- 64.Shimojo M. Characterization of the nuclear targeting signal of REST/NRSF. Neurosci Lett. 2006;398:161–166. doi: 10.1016/j.neulet.2005.12.080. [DOI] [PubMed] [Google Scholar]
- 65.Sarov M, et al. A genome-scale resource for in vivo tag-based protein function exploration in C. elegans. Cell. 2012;150:855–866. doi: 10.1016/j.cell.2012.08.001. [DOI] [PMC free article] [PubMed] [Google Scholar]
Associated Data
This section collects any data citations, data availability statements, or supplementary materials included in this article.