

Abstract
Co-activation of distinct brain regions is a measure of functional interaction, or connectivity, between those regions. The co-activation pattern of a given region can be investigated using seed-based activation likelihood estimation meta-analysis of functional neuroimaging data stored in databases such as BrainMap. This method reveals inter-regional functional connectivity by determining brain regions that are consistently co-activated with a given region of interest (the “seed”) across a broad range of experiments. In current implementations of this meta-analytic connectivity modelling (MACM), significant spatial convergence (i.e. consistent co-activation) is distinguished from noise by comparing it against an unbiased null-distribution of random spatial associations between experiments according to which all grey-matter voxels have the same chance of convergence. As the a priori probability of finding activation in different voxels markedly differs across the brain, computing such a quasi-rectangular null-distribution renders the detection of significant convergence more likely in those voxels that are frequently activated. Here, we propose and test a modified MACM approach that takes this activation frequency bias into account. In this new specific co-activation likelihood estimation (SCALE) algorithm, a null-distribution is generated that reflects the base rate of reporting activation in any given voxel and thus equalizes the a priori chance of finding across-study convergence in each voxel of the brain. Using four exemplary seed regions (right visual area V4, left anterior insula, right intraparietal sulcus, and subgenual cingulum), our tests corroborated the enhanced specificity of the modified algorithm, indicating that SCALE may be especially useful for delineating distinct core networks of co-activation.
Keywords: neuroimaging, coordinate-based meta-analysis, functional connectivity, ALE, BrainMap
1. Introduction
Understanding the functional organization of the human brain requires the consideration of both regional specificity and interregional interaction (Eickhoff and Grefkes 2011). The advent of modern neuroimaging methods, especially functional magnetic resonance imaging (fMRI), has spurred investigations into both aspects. With respect to interregional coupling, several dimension of brain connectivity have been explored non-invasively, including structural connectivity using diffusion-weighted imaging (Dell’Acqua and Catani 2012), effective connectivity during task performance using Dynamic Causal Modeling (Friston et al. 2003), and functional connectivity during task-dependent or task-unconstrained (“resting state”) cognition (van den Heuvel and Hulshoff Pol 2010).
An alternative approach to exploring the brain-wide functional connectivity (FC) pattern of a given brain region is provided by meta-analytic connectivity modelling (MACM; Laird et al. 2013). This approach examines which brain regions are co-activated above chance with a given seed region across a large and diverse set of neuroimaging experiments (Eickhoff et al. 2010; Robinson et al. 2010). To this end, MACM capitalizes on databases such as BrainMap, in which a great many of published results from neuroimaging studies are stored (Laird et al. 2011; Laird et al. 2009a). Such databases are first filtered to identify all experiments reporting activations in or near a given seed region. Subsequently, the identified subset of experiments is meta-analyzed by a coordinate-based algorithm such as activation likelihood estimation (ALE) to determine the convergence of the reported activation foci in these experiments (Turkeltaub et al. 2002; Eickhoff et al. 2009). As all experiments were defined by activation in the seed region, the highest convergence will consequently be found there. Significant convergence outside the seed, in turn, indicates significant across-study co-activation (i.e., FC; cf. Amft et al. 2014; Hoffstaedter et al. 2013; Reetz et al. 2012; Jakobs et al. 2012). Thus, MACM exploits the accumulated wealth of data on brain activity associated with many kinds of psychological processes and conditions. In contrast to resting-state FC analyses, MACM provides a measure of FC during task-constrained states and, by way of analyzing the descriptive meta-data associated with each databased activation, enables the functional characterization of the resulting set of consistently co-activated regions (Rottschy et al. 2013; Müller et al. 2013; Kellermann et al. 2013).
It should be noted, however, that findings from functional neuroimaging experiments are not equally distributed across the entire brain. Rather, from large compilations of findings in databases such as BrainMap (Laird et al. 2009a) or Neurosynth (Yarkoni et al. 2011) it becomes evident that certain locations are found much more frequently activated than others (cf. Fig. 1). The results of a MACM analysis, in turn, may be influenced by such non-stationary a priori probabilities for each voxel to be activated across the entire database. That is, if a given voxel is frequently activated in the databased experiments, the likelihood of this voxel to co-activate with any given seed region is increased a priori. The frequency of activation across all databased experiments is naturally high for heteromodal regions that are involved in a wide range of tasks (e.g., anterior insula; cf. Kurth et al. 2010), but it also depends on experimental epiphenomena such as the high prevalence of neuroimaging experiments using visual stimulus input, manual responses, and/or tasks with verbal material. When using the standard MACM approach, this frequency bias of activated regions may lead to partially unspecific or generic co-activation patterns. To address this potential bias, we propose a modification to MACM that takes this frequency bias into account in order to map more specific co-activation patterns of seed regions.
Fig. 1.
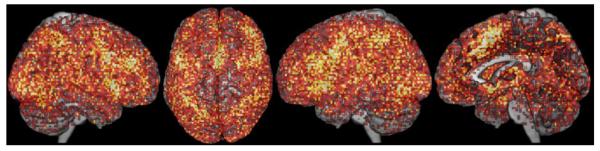
The population of activation foci contained in the BrainMap database (at that time) rendered on a standard template brain. Color lightness codes frequency of activation of a given voxel, with lighter colors indicating higher frequencies.
The key idea behind the proposed modification is to abandon the quasi-rectangular null-distribution reflecting an unbiased random spatial association between experiments, in favor of a random association structure that reflects the a priori probability of each voxel being activated across the entire database. That is, rather than testing for voxels that show higher convergence than expected from a flat distribution of random associations, the new specific co-activation likelihood estimation (SCALE) algorithm tests for voxels that show higher convergence than expected given their a priori likelihood of activation.
2. Methods
2.1. Sample
All MACM analyses were performed using the BrainMap database (Laird et al. 2009a) (www.brainmap.org). From that database, we included only those experiments that reported coordinates in standard stereotaxic space from normal functional mapping studies (i.e., no interventions such as pharmacological challenges or practice and no interindividual-differences analyses) in healthy participants using either fMRI or positron emission tomography. Apart from that, we refrained from any pre-selection based on descriptive BrainMap meta-data (i.e., taxonomic categories). In total, this yielded 7209 eligible experiments at the time of analysis.
To evaluate the performance of our bias-adjusted MACM algorithm, both standard and modified algorithms were applied to four exemplary seed regions (Fig. 2). These four regions comprised (1) the cytoarchitectonically defined right visual area V4 (hOC4v; Rottschy et al. 2007) as well as three functionally defined clusters in: (2) left anterior insula (aIns), (3) right intraparietal sulcus (IPS; extending to adjacent superior and inferior parietal lobules), and (4) the subgenual cingulum (SGC). Both left aIns and right IPS clusters were derived from a conjunction map across two previous neuroimaging meta-analyses on working memory (Rottschy et al. 2012) and sustained attention (Langner and Eickhoff 2013). The SGC cluster, in turn, was derived from a conjunction across two previous meta-analyses on brain activity at rest (i.e., the so-called default mode) and affective processing, respectively (Schilbach et al. 2012; see also Amft et al. 2014). These four seed regions were chosen on the basis of their spatial and functional heterogeneity, given that they are representative of varying locations in the brain, extend across multiple functional systems, and are marked by different degrees of functional specialization.
Fig. 2.

The 4 seed regions used in the exemplary analyses: right area hOC4v (red), left anterior insula (blue), right intraparietal sulcus (green), and subgenual cingulum (violet).
Filtering the BrainMap database for experiments that reported at least one focus of activation in the given seed regions, we found: (1) 367 experiments reporting activation in right area hOC4v (in total: 5467 foci, 4771 participants); (2) 354 experiments reporting activation in the left aIns cluster (5725 foci, 4952 participants); (3) 220 experiments reporting activation in the right IPS cluster (3385 foci, 2768 participants); and (4) 100 experiments reporting activation in the SGC cluster (1192 foci, 1520 participants).
2.2. Standard and modified MACM algorithms
2.2.1. Standard algorithm
Following established procedures (Roski et al. 2013; Balsters et al. 2013; Clos et al. 2013; Bzdok et al. 2013b), we first computed the task-based functional connectivity (i.e., co-activation patterns) for each of the four seed regions using the standard MACM implementation: First, we identified the experiments in our sample that reported activation in the currently considered seed region. The brain-wide co-activation pattern for each individual seed voxel was then computed by a meta-analysis over the retrieved experiments. That is, experiments were defined by activation in the particular seed region, and a quantitative meta-analysis of all foci reported in these experiments was performed to assess how likely any other voxel throughout the brain co-activated with the given seed voxel. Meta-analysis was performed using the revised version of the ALE approach (Eickhoff et al. 2012; Eickhoff et al. 2009; Turkeltaub et al. 2012). This algorithm treats activation foci reported from a given experiment as centers of 3-D Gaussian probability distributions that reflect the spatial uncertainty associated with neuroimaging results. The probability distributions of all reported foci were combined into a modeled activation (MA) map for each experiment. The voxel-wise union of these MA maps across all experiments associated with a particular seed voxel then yielded an ALE score for each voxel of the brain describing the co-activation probability of that particular location with the current seed.
Significance of these co-activation probabilities is then computed by comparison with an analytical null-distribution as described in Eickhoff et al. (2012). In short, this null-distribution reflects the distribution of ALE scores under the null-hypothesis of a random spatial association across experiments. Conceptually, this is equivalent to drawing one voxel from each experiment independently at random and then computing the ALE value across these as done for the (spatially contingent) voxel-values in the true analysis (Eickhoff et al. 2009). In contrast to such a Monte-Carlo simulation procedure, however, the analytical solution pools over identical values at different locations, which allows deriving the null-distribution from a much faster histogram permutation. The p-value of a “true” ALE score was then given by the proportion of equal or higher values under the null distribution. ALE maps were thresholded at cluster-level p < .05 [family-wise error (FWE)– corrected for multiple comparisons; voxel-level height threshold: p < .001].
2.2.2. Modified algorithm (SCALE)
In contrast to the global null-distribution employed for the standard ALE (and hence MACM) analysis, the modified algorithm provides voxel-specific null-distributions that reflect the base rate of activation observed in a given voxel. To illustrate this crucial distinction, first consider a region such as the supplementary motor area (SMA), in which many experiments report activation: given this elevated base rate, a high ALE value (i.e., observed co-activation likelihood) would actually be expected by chance. Nevertheless, comparing this high ALE value against a global (i.e., medium-level) null-distribution may still result in a significant difference. In contradistinction, in a region that is rarely activated by neuroimaging experiments, observing an intermediate degree of convergence of co-activations (as indicated by a medium-level ALE value) may be highly unexpected by chance and should therefore be significant. A comparison against the global (medium-level) null distribution of the standard MACM approach, however, would still result in a non-significant difference. Therefore, accounting for the different base rates of activation across the brain should lead to less over- or underestimation of significant convergence of co-activations and, thus, to more specific findings.
To compute voxel-specific null-distributions we propose to use a Monte-Carlo simulation procedure. In a first step, convergence across experiments is computed as described above, yielding the “true” ALE value at each location. In a second step, this procedure is repeated, but only after replacing the reported location of the activation foci for each experiment by foci randomly sampled (without replacement) from the BrainMap database. Importantly, all other aspects of the dataset (number of experiments, number of foci for each experiment, number of participants and hence the uncertainty model for each experiment, etc.) are retained from the original analysis. That is, we repeated the exact same ALE analysis with only the location of activation randomly replaced by those stored in BrainMap. Given the random sampling from all foci in BrainMap, the ensuing ALE map reflects a realization of the null-distribution provided by the a priori chance of activating any voxel in the brain across the entire database. In other words, by using an unbiased sample from the (inherently biased) database, we can compute ALE scores that reflect the biased a priori probabilities for activation. The ALE score at each voxel is recorded and the entire procedure is repeated 2,500 times in order to generate an empirical null-distribution of expected convergence at each voxel of the brain, given the a priori distribution of activation foci in the database. This voxel-specific null-distribution thus accounts for the database-inherent distributional bias toward certain locations. These distributions were then used to threshold the “true” co-activation map at voxel-level p < .001 (uncorrected). In addition, we applied a cluster extent threshold of k = 50 to further reduce the risk of false positives. Applying a multiple-comparison correction at cluster level, analogous to what is done in the standard MACM approach, was impossible here, because in the bias-adjusted MACM approach, there is no global null-hypothesis about the (equal) probability of spatial convergence across the brain. This follows from the voxel-specific adjustment of the null-distribution according to the activation base rate inherent in the modified approach. A global null-distribution, however, would be needed to set an FWE-corrected significance threshold for cluster extent. Although this (formally) uncorrected thresholding approach left our modified MACM algorithm somewhat more lenient than the standard one, it ultimately strengthens our argumentation for greater specificity of the modified algorithm as long as the resulting co-activation maps are generally sparser and more specific than those resulting from the standard approach. Nevertheless, we acknowledge that a formal correction for multiple comparisons across these tests against (voxel-specific) null-distributions would provide additional, though not yet possible stringency.
3. Results
In the following sections, we will present the results of MACM analyses for each of the four seed regions (cf. Fig. 2), as obtained with the standard and modified algorithm, respectively.
3.1. Ventral area V4 (hOC4v)
The co-activation pattern for the anatomically defined right hOC4v seed region as revealed by the standard MACM approach comprised several clusters (Fig. 3A, Table 1). The largest one covered major aspects of bilateral visual cortex from V1 to V5 and extended antero-ventrally into fusiform and lingual gyri and dorsally into IPS and superior parietal lobule. Further co-activations were observed in bilateral aIns, dorsal and ventral premotor cortex (PMC), and (pre-)SMA/midcingulate cortex (MCC), as well as left amygdala and left thalamus.
Fig. 3.

Results of the standard (A) and bias-adjusted (B) meta-analytic connectivity modelling of right area hOC4v.
Table 1.
Meta-Analytic Connectivity Modelling (MACM) Results for the Anatomically Defined Right Ventral Visual Cortex 4 (hOC4v) Using Standard or Modified Algorithm
| Standard MACM |
Modified MACM |
|||
|---|---|---|---|---|
| Cluster (Size) /Brain Region (Histological Assignmenta) |
x y z | z-score | x y z | z-score |
| Cluster 1 (kS = 15119 / kM = 11093) | ||||
| R inferior occipital gyrus (hOC4v, FG1) | 38 −76 −12 | 8.78 | 38 −76 −12 | 8.45 |
| R fusiform gyrus (FG2) | 40 −52 −20 | 8.40 | 40 −52 −20 | 8.26 |
| R middle occipital gyrus | 34 −90 0 | 8.52 | 34 −90 0 | 8.32 |
| R superior occipital gyrus b | 30 −64 42 | 7.66 | 30 −66 40 | 8.23 |
| R intraparietal sulcus (hIP3) b | 30 −56 52 | 7.99 | 30 −56 46 | 8.24 |
| L inferior occipital gyrus (hOC4v, FG1) | −24 −84 −14 | 8.37 | −24 −84 −14 | 8.25 |
| L fusiform gyrus (FG2) | −40 58 −20 | 8.37 | −40 58 −20 | 8.25 |
| L calcarine gyrus | −12 −98 −6 | 7.55 | −12 −98 −6 | 8.23 |
| L middle occipital gyrus | −32 −90 0 | 8.43 | −32 −90 0 | 8.28 |
| L superior occipital gyrus c | −26 −70 40 | 8.01 | −26 −70 40 | 8.24 |
| L intraparietal sulcus (hIP3) | −30 −54 52 | 8.41 | - | - |
| Cluster 2 (kS = 1408) | ||||
| L ventral precentral gyrus | −48 6 34 | 8.41 | - | - |
| L IFG (Area 44/45) / inferior frontal junction | −46 16 24 | 6.57 | - | - |
| Cluster 3 (kS = 1367) | ||||
| L/R posterior medial SFG | −2 12 52 | 8.42 | - | - |
| L/R midcingulate cortex (Area 32′/a24′) | 0 28 36 | 4.52 | - | - |
| Cluster 4 (kS = 612) | ||||
| L anterior insula | −34 20 4 | 7.69 | - | - |
| L IFG, pars orbitalis | −44 28 −4 | 4.43 | - | - |
| L IFG, pars opercularis (Area 44) | −52 12 6 | 4.30 | - | - |
| Cluster 5 (kS = 509) | ||||
| R anterior insula | 36 20 −2 | 7.64 | - | - |
| Cluster 6 (kS = 455) | ||||
| R posterior MFG / precentral sulcus | 38 −2 52 | 6.49 | - | - |
| R posterior SFG | 24 0 58 | 5.74 | - | - |
| Cluster 7 (kS = 371) | ||||
| R inferior frontal junction | 42 6 32 | 6.30 | - | - |
| Cluster 8 (kS = 205) | ||||
| R posterior SFG / precentral sulcus | −28 −4 60 | 6.07 | - | - |
| Cluster 9 (kS = 201) | ||||
| L amygdala (CM, SF, LB) | −20 −6 14 | 6.79 | - | - |
| Cluster 10 (kS = 170) | ||||
| L thalamus | −14 −16 10 | 6.01 | - | - |
| Cluster 11 (kM = 133) | ||||
| R hippocampus (subiculum) | - | - | 18 −30 −4 | 8.21 |
Notes. x, y, z = peak voxel coordinates in MNI space; kS/kM = number of voxels in cluster obtained with standard/modified MACM algorithm.
References for cytoarchitectonically defined areas: Amunts et al. 1999; Amunts et al. 2005; Caspers et al. 2013; Palomero-Gallagher et al. 2009; Scheperjans et al. 2008.
Forming a separate cluster with modified MACM: kM = 303.
Forming a separate cluster with modified MACM: kM = 177.
L = left; R = right; IFG/MFG/SFG = inferior/middle/superior frontal gyrus.
The modified MACM approach produced a substantially smaller pattern of (specific) co-activation (Fig. 3B, Table 1). The pattern in visual areas was highly similar (without extending into right V5), but posterior parietal co-activation was much less pronounced, especially in the left hemisphere. Likewise, no significant frontal co-activations were observed, but the modified analysis yielded a new cluster of significant specific co-activation in right hippocampus. In summary, the pattern of across-study co-activation with the anatomically defined seed region V4 (cytoarchitectonic area hOC4v) obtained with the new SCALE algorithm was substantially more focused on occipital regions, as compared to the results obtained with the standard ALE algorithm.
3.2. Anterior insula
The co-activation pattern for the left aIns seed region as revealed by the standard MACM approach (Fig. 4A, Table 2) comprised a large bilateral cluster including aIns, inferior frontal gyrus (IFG) and junction (IFJ), dorsal and ventral PMC, mid-lateral prefrontal cortex (MLPFC), thalamus, and basal ganglia (putamen, pallidum, and ventral caudate). Further extensive bilateral clusters were found in (pre-)SMA and MCC as well as in the IPS, cerebellum (in the left hemisphere extending into fusiform gyrus), and in posterior aspects of the superior temporal gyrus (STG).
Fig. 4.

Results of the standard (A) and bias-adjusted (B) meta-analytic connectivity modelling of the left anterior insula seed.
Table 2.
Meta-Analytic Connectivity Modelling (MACM) Results for the Left Anterior Insula Cluster Using Standard or Modified Algorithm
| Standard MACM |
Modified MACM |
|||
|---|---|---|---|---|
| Cluster (Number of Voxels) / Brain Region (Histological Assignmenta) |
x y z | z-score | x y z | z-score |
| Cluster 1 (kS = 13330 / kM = 1456) | ||||
| L anterior insula | −34 20 −2 | 9.43 | −34 20 −2 | 8.78 |
| L IFG (Area 44) / inferior frontal junction b | −46 8 30 | 8.48 | −46 8 30 | 8.30 |
| L thalamus c | −10 −16 6 | 8.41 | −8 −20 6 | 8.26 |
| L IFG, pars triangularis | −46 26 22 | 8.37 | - | - |
| L putamen (pontes grisei) | −20 6 2 | 8.36 | - | - |
| L MFG d | −36 50 8 | 7.16 | −36 50 8 | 8.23 |
| R anterior insula c | 36 20 −2 | 8.85 | 36 20 −2 | 8.49 |
| R thalamus c | 8 −16 6 | 8.39 | 6 −16 6 | 8.26 |
| R IFG (Area 44) / inferior frontal junction | 46 10 28 | 8.38 | - | - |
| R pallidum c | 14 6 −2 | 8.36 | 14 6 −2 | 8.24 |
| R nucleus caudatus (ventral caudate) c | 10 6 2 | 7.99 | 10 6 2 | 8.24 |
| R MFG e | 42 38 18 | 7.97 | 42 40 18 | 8.24 |
| Cluster 2 (kS = 3215 / kM = 1453) | ||||
| L/R posterior medial SFG | −2 16 46 | 8.61 | −2 16 46 | 8.37 |
| L/R midcingulate cortex (Area 32′/a24′) | 4 22 38 | 8.57 | 4 22 38 | 8.35 |
| Cluster 3 (kS = 1656) | ||||
| L intraparietal sulcus (hIP3, hIP2, hIP1) | −32 −52 48 | 8.38 | - | - |
| L superior parietal lobule (7A, 7PC) | −24 −66 50 | 7.12 | - | - |
| L inferior parietal lobule (PFt) | −46 −36 42 | 6.88 | - | - |
| Cluster 4 (kS = 939 / kM = 76) | ||||
| L fusiform gyrus (FG2) | −42 −60 −16 | 8.38 | - | - |
| L cerebellum | −28 −62 −26 | 6.11 | −28 −62 −26 | 8.21 |
| Cluster 5 (kS = 892) | ||||
| R intraparietal sulcus (hIP3, hIP2, hIP1) | 32 −60 48 | 6.83 | - | - |
| Cluster 6 (kS = 333) | ||||
| L posterior STG / STS | −52 −40 12 | 5.14 | - | - |
| L inferior parietal lobule (PFcm) | −56 −38 20 | 4.19 | - | - |
| Cluster 7 (kS = 270) | ||||
| R cerebellum | 34 −64 −26 | 5.38 | - | - |
| Cluster 8 (kS = 226) | ||||
| R posterior STG | 60 −30 6 | 4.88 | - | - |
Notes. x, y, z = peak voxel coordinates in MNI space; kS/kM = number of voxels in cluster obtained with standard/modified MACM algorithm.
References for cytoarchitectonically defined areas: Amunts et al. 1999; Caspers et al. 2013; Caspers et al. 2006; Choi et al. 2006; Palomero-Gallagher et al. 2009; Scheperjans et al. 2008.
Forming a separate cluster with modified MACM: kM = 185.
Forming a separate cluster with modified MACM: kM = 1791.
Forming a separate cluster with modified MACM: kM = 209.
Forming a separate cluster with modified MACM: kM = 133.
L = left; R = right; IFG/MFG/SFG = inferior/middle/superior frontal gyrus; STG/STS = superior temporal gyrus/sulcus.
The modified MACM approach yielded clusters of specific co-activation in bilateral aIns, (pre-)SMA/MCC, MFG, and thalamus (Fig. 4B, Table 2). Of note, although these clusters’ peaks had the same localization as obtained with the standard algorithm, the clusters’ extent was much smaller, resulting in several distinct, more circumscribed clusters of specific co-activation. Furthermore, previously bilateral co-activations in IFJ, cerebellum, and basal ganglia were now restricted to the left (IFJ, cerebellum) or right hemisphere (basal ganglia). No specific co-activation with the parietal cortex was observed. In conclusion, the bias-adjusted SCALE algorithm again produced a substantially reduced pattern of co-activation, as compared with the standard algorithm. The location of the statistical peaks within the retained specific co-activations, however, closely resembled those obtained in the standard analysis.
3.3. Intraparietal sulcus
The co-activation pattern for our right IPS seed cluster (Fig. 5A, Table 3), as revealed by the standard MACM approach, comprised a set of regions very similar to what was previously observed for left aIns. In particular, we found large bilateral clusters in IPS, aIns, dorsal and ventral PMC, MLPFC, and (pre-)SMA/MCC.
Fig. 5.

Results of the standard (A) and bias-adjusted (B) meta-analytic connectivity modelling of the right intraparietal sulcus seed.
Table 3.
Meta-Analytic Connectivity Modelling (MACM) Results for the Right Intraparietal Sulcus Cluster Using Standard or Modified Algorithm
| Standard MACM |
Modified MACM |
|||
|---|---|---|---|---|
| Cluster (Number of Voxels) / Brain Region (Histological Assignmenta) |
x y z | z-score | x y z | z-score |
| Cluster 1 (kS = 10629 / kM = 4844) | ||||
| R intraparietal sulcus (hIP1, hIP2, hIP3) | 42 −44 46 | 9.00 | 42 −44 46 | 8.56 |
| R superior parietal lobule (7A, 7P, 7PC) | 22 −70 55 | 8.32 | 22 −66 50 | 8.22 |
| R superior occipital gyrus | 30 −66 42 | 7.87 | 30 −66 42 | 8.22 |
| L intraparietal sulcus (hIP1, hIP2, hIP3) | −40 −54 53 | 8.37 | −40 −54 53 | 8.25 |
| L superior parietal lobule (7A, 7P, 7PC) | −22 −66 50 | 8.34 | −22 −66 50 | 8.23 |
| L IFG (Area 44) / IFJ b | −50 8 26 | 8.34 | −50 8 26 | 8.23 |
| L anterior insula | −34 22 4 | 8.34 | - | - |
| L posterior MFG / precentral sulcus c | −28 −2 52 | 8.32 | −28 −2 52 | 8.22 |
| L MFG / IFG, pars triangularis d | −40 34 24 | 7.76 | −40 34 24 | 8.22 |
| L precuneus | −8 −70 46 | 5.17 | −8 −70 46 | 8.18 |
| Cluster 2 (kS = 4455 / kM = 1180) | ||||
| R anterior insula e | 36 22 −2 | 8.44 | 36 22 −2 | 8.28 |
| R MFG | 42 38 24 | 8.39 | 42 38 24 | 8.26 |
| R IFG, pars opercularis / IFJ | 48 10 26 | 8.34 | 48 10 26 | 8.23 |
| R posterior SFG / MFG f | 26 −2 58 | 7.96 | 26 −2 58 | 8.22 |
| R IFG, pars triangularis | 52 24 26 | 6.18 | 52 24 26 | 8.20 |
| Cluster 3 (kS = 2214 / kM = 172) | ||||
| R posterior medial SFG | 4 20 46 | 8.35 | 4 20 46 | 8.24 |
| L posterior medial SFG | −2 8 52 | 8.32 | - | - |
| R midcingulate cortex (Area 32′) | 4 26 38 | 7.96 | 4 26 38 | 8.22 |
| L midcingulate cortex (Area 32′, a24′) | −2 30 32 | 5.23 | - | - |
| Cluster 4 (kS = 153) | ||||
| R thalamus | 12 −14 6 | 5.81 | - | - |
| R thalamus | 6 −20 −2 | 3.17 | - | - |
Notes. x, y, z = peak voxel coordinates in MNI space; kS/kM = number of voxels in cluster obtained with standard/modified MACM algorithm.
References for cytoarchitectonically defined areas: Amunts et al. 1999; Choi et al. 2006; Palomero-Gallagher et al. 2009; Scheperjans et al. 2008.
Forming a separate cluster with modified MACM: kM = 51
Forming a separate cluster with modified MACM: kM = 218.
Forming a separate cluster with modified MACM: kM = 369.
Forming a separate cluster with modified MACM: kM = 263.
Forming a separate cluster with modified MACM: kM = 615.
L = left; R = right; IFG/MFG/SFG = inferior/middle/superior frontal gyrus; IFJ = inferior frontal junction; STG/STS = superior temporal gyrus/sulcus.
Somewhat in contrast to the findings for the left aIns, however, the pattern of specific co-activation obtained with the modified MACM approach did not feature a substantial reduction in the number of co-activated brain regions (Fig. 5B, Table 3). The only regions missing here, in comparison with the standard MACM approach, were left aIns, left (pre-)SMA/MCC, and thalamus. The clusters’ extent, however, was again markedly reduced. Thus, for the right IPS, the bias-adjusted SCALE algorithm yielded rather similar, albeit smaller and more circumscribed clusters of co-activation, as compared with the standard ALE algorithm.
3.4. Subgenual cingulum
The co-activation pattern of our SGC seed as revealed by the standard MACM approach comprised a large bilateral cluster in sub- and perigenual anterior cingulate cortex, extending antero-dorsally to fronto-polar cortex, and postero-ventrally to the nucleus accumbens (Fig. 6A, Table 4). Further SGC co-activations were observed in bilateral posterior cingulate cortex, left hippocampus/amygdala, and left inferior parietal lobule.
Fig. 6.

Results of the standard (A) and bias-adjusted (B) meta-analytic connectivity modelling of the subgenual cingulum seed.
Table 4.
Meta-Analytic Connectivity Modelling (MACM) Results for the Subgenual Cingulum Cluster Using Standard or Modified Algorithm
| Standard MACM |
Modified MACM |
|||
|---|---|---|---|---|
| Cluster (Number of Voxels) / Brain Region (Histological Assignmenta) |
x y z | z-score | x y z | z-score |
| Cluster 1 (kS = 2632 / kM = 2531) | ||||
| L/R subgenual cingulate cortex (Area s32) | −4 36 −10 | 8.57 | −4 36 −10 | 8.35 |
| L/R perigenual cingulate cortex (Area p24) | 2 38 0 | 8.33 | 2 38 0 | 8.23 |
| L perigenual cingulate cortex / frontal pole (Area p32, Fp2) b |
−4 56 −10 | 5.06 | −4 56 −10 | 8.16 |
| R subgenual cingulate cortex (Area s24) | 8 16 −12 | 4.67 | 8 16 −12 | 8.16 |
| L Ncl. Accumbens / Ventral Pallidum | −8 4 −8 | 4.61 | −8 4 −10 | 8.16 |
| R Ncl. Accumbens | 10 10 −10 | 3.96 | - | - |
| L subgenual cingulate cortex (Area 25, 33) | −2 10 −6 | 3.90 | −2 10 −6 | 8.15 |
| Cluster 2 (kS = 535 / kM = 484) | ||||
| L dorsal posterior cingulate cortex | −6 −52 24 | 7.04 | −6 −52 24 | 8.18 |
| L ventral posterior cingulate cortex | −4 −50 14 | 4.04 | −6 52 14 | 8.15 |
| R dorsal posterior cingulate cortex | 8 −52 30 | 3.70 | 8 −54 30 | 8.15 |
| Cluster 3 (kS = 272 / kM = 108) | ||||
| L hippocampus (CA2, CA3) | −22 −14 −20 | 5.71 | −22 −14 −20 | 8.17 |
| L amygdala (LB, SF) | −20 −8 −22 | 4.97 | −20 −8 −22 | 8.16 |
| Cluster 4 (kS = 119 / kM = 72) | ||||
| L inferior parietal lobule (PGp, PGa) | −48 −66 32 | 4.30 | −48 −66 32 | 8.16 |
| Cluster 5 (kM = 250) | ||||
| R anterior ITG | - | - | 50 −2 −34 | 8.14 |
| Cluster 6 (kM = 70) | ||||
| L anterior ITG | - | - | −54 −12 −26 | 8.15 |
| Cluster 7 (kM = 69) | ||||
| R medial temporal pole | - | - | 30 14 −34 | 8.15 |
| Cluster 8 (kM = 69) | ||||
| R medial cerebellum | - | - | 10 −62 −40 | 8.15 |
| Cluster 9 (kM = 66) | ||||
| L medial cerebellum | - | - | −8 −52 −44 | 8.14 |
| Cluster 10 (kM = 51) | ||||
| R superior frontal gyrus | - | - | 20 32 48 | 8.15 |
Notes. x, y, z = peak voxel coordinates in MNI space; kS/kM = number of voxels in cluster obtained with standard/modified MACM algorithm.
References for cytoarchitectonically defined areas: Amunts et al. 2005; Bludau et al. 2013; Caspers et al. 2006; Palomero-Gallagher et al. 2009.
Forming a separate cluster with modified MACM: kM = 221.
L = left; R = right; Ncl. = nucleus; ITG = inferior temporal gyrus.
The modified MACM algorithm yielded a pattern of co-activation that included the same regions as obtained with the standard approach (except for right nucleus accumbens) but comprised further clusters in bilateral inferior temporal gyrus and right medial temporal pole, bilateral medial cerebellum, and right superior frontal gyrus (Fig. 6B, Table 4). Here, the extent of co-activated clusters resulting from the bias-adjusted algorithm was largely similar to the standard one, but several new clusters appeared, most prominently in bilateral inferior temporal cortex.
3.5. Summary
In summary, we note that the modified MACM approach often yielded substantially more restricted clusters of (specific) co-activation in spite of the fact that this analysis was not formally corrected for multiple comparisons. Moreover, it may be noted that for those regions that were retained in the specific co-activation analysis, the statistical peaks were highly consistent with those obtained from the standard MACM implementation. The mapping of specific co-activations thus appears to generally provide a more conservative estimate of interaction patterns. As has become evident from the fourth example (SGC), however, our modification, which aimed at identifying specific co-activation patterns (relative to the a priori probability of activation), may also reveal co-activations not obtained in the standard MACM analysis, indicating that the proposed modification is not merely a more conservative implementation but rather based on a substantially different concept.
4. Discussion
Meta-analytic connectivity modelling (Eickhoff et al. 2010; Laird et al. 2009b; Robinson et al. 2010) has established itself over the past years as an important tool for the investigation of task-based FC, providing an important complement to task-independent resting-state FC approaches (Bzdok et al. 2013b; Cieslik et al. 2013; Langner et al. 2014). Here, we introduced a modification of the standard MACM algorithm (Eickhoff et al. 2011; Eickhoff et al. 2010) that aims to identify specific co-activations, and examined its effect on the observed pattern of consistently co-activated brain regions for several seed regions representing different anatomical locations and functional brain systems. Our modification sought to make MACM more specific by adjusting significance testing in a way that accounts for differences in the prevalence (i.e. base rate) of activity foci across the neuroimaging literature and, hence, databases such as BrainMap. Specifically, the new SCALE algorithm tested the significance of co-activation against an empirical null-distribution that reflects the expected convergence of activations in a set of experiments that have the same characteristics as the “true” set but features random locations that reflect the current locational distribution across the database. This contrasts with the global null-distribution used in standard MACM significance testing, which reflects the expected convergence across foci given a random spatial association between experiments. Put differently, while the inference in standard MACM is performed against a random convergence of activation within the examined set of experiments, the modified approach now references the observed convergence against what is expected given the frequency distribution of activation foci across the entire database.
This conceptual distinction and the resulting adjustment of the null-distribution computation procedure aimed to compensate for the different a priori probabilities of different brain loci to co-activate with a given seed. As pointed out above, these different probabilities arise from the biased (i.e., non-rectangular) frequency distribution of activation foci in BrainMap. In particular, loci that are found activated more often in neuroimaging research and, therefore, are more prevalent in databases such as BrainMap have a higher a priori chance to be found co-activated with (any) given seed region of interest. A high a priori probability of activation in a specific region within a set of databased experiments will thus yield a high empirically estimated (i.e. observed) likelihood of convergence at that particular region in an ALE analysis of experiments from that database. This region will consequently appear as significantly co-activated in MACM analyses seeded at most other brain locations. We would like to stress, however, that this is not faulty algorithmic behavior or a problem in the approach per se. Rather, the co-activation probability (provided by the ALE value) at that particular location is high indeed, and it may be high for many or even all seed locations.
This predicament is best illustrated in an extreme example: If a given location of the brain was activated by all experiments in the database, then this location would have a co-activation likelihood (ALE score) of 1 in any (standard) MACM analysis, independently of the location of the seed. Importantly, however, this perfect co-activation likelihood would not be unexpected but rather exactly conform to the expectation based on the a priori likelihood. In other words, in that example, the convergence at the always-activated voxel would be much higher than expected under the null-hypothesis of random spatial association (within the set of retrieved experiments that feature activation at a particular seed). It would not be higher than expected, however, under the null-hypothesis that co-activation probabilities reflect the a priori probability of activation across the database.
In that context, we need to differentiate between the co-activation probability (voxel-wise ALE score indicating the convergence of foci in those experiments that were retrieved based on activation in a particular seed region), which remains unchanged between the standard approach and the proposed revision, and the statistical inference thereon (which changes due to the new reference, i.e., the adjusted null-distribution). In the standard MACM approach, significance reflects above-chance convergence across the retrieved experiments; that is, the algorithm is agnostic to the a priori likelihoods. The inherent bias in the neuroimaging literature towards some locations may thus result in a neurobiologically (though not mathematically) distorted significance estimation. In particular, if a global null-distribution is used, brain locations with a higher-than-average base rate in BrainMap will effectively be favored against locations with a lower-than-average base rate. The new approach adjusts for this bias by providing a voxel-specific null-distribution accommodating the a priori likelihood of activation across the entire database. Significance testing with SCALE should thus be equally conservative in regions featuring many or few experiments, respectively.
Nevertheless, given non-linear relations between ALE scores and activation prevalence in the database, the voxel-wise adjustment of the null-distribution for activation base rate might potentially lead to “over-specificity” (i.e., false negative results due to over-conservativeness) in voxels with very high base rates. This question of validity of the modified MACM approach can only be answered empirically, by providing evidence for the neurobiological plausibility of the findings. We think that our four exemplary analyses (see below) demonstrate sufficient validity and, thus, warrant application of the modified approach, keeping in mind that it is designed to uncover specific, rather than general co-activation (which does the standard MACM approach).
Finally, it needs to be stressed that our rationale for adjusting the ALE algorithm only holds for seed-based (i.e., neuroanatomically grounded) meta-analytic approaches that interrogate large databases such as BrainMap in order to model across-study FC by means of co-activation mapping, without regard to the specific tasks or mental processes associated with the experiments selected for analysis. That is because only for such database-driven approaches, a distributional a priori bias is known. In contrast, in “topic-based” (i.e., psychologically grounded) ALE meta-analyses, such as those that focus on activation patterns observed within a specific task category (e.g., the Stroop task), this bias is not only unknown, but finding such a bias (i.e., the above-chance convergence across studies on a particular task), is in itself the object of investigation. That is, when aiming to study regional brain–behavior associations meta-analytically, then the null-hypothesis assuming no task-/process-specific convergence of activation foci needs to be falsified by finding a significant bias towards activating a given location across the studies selected.
For evaluation, both standard and new (bias-adjusted) MACM algorithms were applied to four exemplary seed regions: right area hOC4v (ventral area V4), left aIns, right IPS, and bilateral SGC. First, we examined the cytoarchitectonically defined area hOC4v (Rottschy et al. 2007), which is a “late” visual area predominantly involved in processing visual object features of intermediate complexity such as orientation, shape, and color (Roe et al. 2012; Eickhoff et al. 2008). Thus, it is a unimodal sensory region with a relatively high degree of functional specialization. For this seed region, the standard MACM algorithm yielded an extensive pattern of co-activation that included both large parts of the visual cortex and a bilateral fronto-parieto-insular network, with the latter being involved in controlling attention and action (Cole and Schneider 2007; Corbetta and Shulman 2002; Langner et al. 2011; Petersen and Posner 2012). In contrast, the bias-adjusted SCALE algorithm revealed a pattern of co-activation that was mainly restricted to occipital regions. Thus, the pattern was much more focused on visual areas of the brain than that obtained with the standard algorithm. This focus of across-study, task-constrained functional connectivity makes much sense for a highly specialized, unimodal (visual) area like hOC4v and attests to the higher specificity of the new algorithm, as compared with the standard one.
Of course, actions are often guided by visual input, which necessitates functional connections between regions associated with either processing domain (action: fronto-parietal regions; vision: occipital regions) and explains the findings with the standard MACM approach. Our results, however, suggest that the degree of task-related FC between our seed region and regions involved in attentional or action control is substantially less specific than what is observed for FC among different visual areas. That is, the likelihood of fronto-parietal regions co-activating together with hOC4v in relation to the a priori chance of finding activations in these fronto-parietal regions across the entire database is rather limited – in contrast to the high relative likelihood of observing occipital co-activation with hOC4v. Thus, despite the plausibility and necessity of inter-domain FC, as corroborated by the standard MACM approach, the hOC4v core network appears to almost exclusively consist of other visual areas, as revealed by the new (bias-adjusted) MACM algorithm. This visual core network specificity is in agreement with studies determining FC-based subnetworks by a data-driven analysis of fluctuations in “resting state” brain activity (e.g., Smith et al. 2009).
Next, we looked at a region much less functionally specialized than area hOC4v: left aIns. This supramodal region is involved in many aspects of perception, cognition, and emotion, among them working memory and vigilant attention, as indicated by the two meta-analyses our aIns seed was derived from (Langner and Eickhoff 2013; Rottschy et al. 2012). However, despite many methodological approaches, this region’s fundamental function has yet to be comprehensively characterized (Dosenbach et al. 2006; Kurth et al. 2010). As expected, using the standard MACM algorithm, this seed region was found to be functionally connected (i.e., co-activated across studies) with an extensive fronto-parieto-thalamo-basal ganglia network. In that context, it is interesting to note the similarities to the co-activation pattern for area hOC4v, attesting to the inherent bias of MACM towards frequently activated regions (cf. Fig. 1). When using the new (bias-adjusted) SCALE algorithm, however, the picture changed even more drastically than it did for hOC4v: the remaining specific network of functionally connected regions was strongly reduced and much more focused, with homotopic right aIns and pre-SMA/MCC being the two major clusters of consistent across-study co-activation. Analogous to hOC4v, these findings suggest that beyond the broad overall MACM connectivity pattern, there is a more specifically inter-connected subset of regions that interact with the left aIns across many different tasks. This specific co-activation core agrees well with results by Dosenbach et al. (2006), which indicated that the very same set of regions (bilateral aIns and pre-SMA/MCC), out of many less-specific others like those revealed in the standard MACM analysis, may constitute a common core system for implementing task sets, also known as the “salience network” (Seeley et al. 2007).
Subsequently, we examined the across-study co-activation pattern of our right IPS seed. Like the aIns, the IPS also is a supramodal brain region. However, in contrast to the very broad functional profile (or domain-general function) discussed for the aIns, the IPS appears to be more specifically involved in attentional control and (spatial) action planning (Grefkes and Fink 2005; Andersen and Cui 2009; Bisley and Goldberg 2010). This view is also corroborated by the two meta-analyses that the IPS seed was derived from (Langner and Eickhoff 2013; Rottschy et al. 2012) as well as other work (Cieslik et al. 2010; Langner et al. 2013). Using the standard MACM algorithm, we expectedly found an extensive bilateral fronto-parieto-thalamo-insular set of co-activated regions. This time, however, the pattern changed much less than it did for the aIns when using the modified algorithm. That is, although the co-activation clusters found with the new algorithm were more circumscribed, attesting to the more specific nature of the revised approach, their topography was rather similar to what was obtained with the standard approach. The few exceptions were restricted to the contralateral hemisphere (left aIns, left pre-SMA/MCC) and the thalamus. Thus, there was again evidence for a more focused pattern of co-activation when using the modified algorithm, but the original network essentially remained intact.
Together, these results suggest that the right IPS, other than left aIns, is a core part of the frequently observed fronto-parietal-insular network. In particular, the differentiation between fronto-parietal and cingulo-insular networks observed with the new SCALE algorithm is consistent with connectivity-based results obtained from task-unconstrained (“resting state”) neural activity (Dosenbach et al. 2007; Seeley et al. 2007). Thus, the results of the bias-adjusted, but not the standard, MACM algorithm corroborate the view of two distinct networks involved in executive control (Dosenbach et al. 2008; see also Petersen and Posner 2012).
More generally, the differences in results from the standard and modified algorithms indicated no dependence on the degree of functional specialization of the seed (e.g., compare hOC4v with aIns, or IPS with aIns). Rather, the amount of change appears to depend on whether or not the other regions do co-activate specifically with the seed, rather than co-activating with many other seeds as well, such as aIns, which was found (using the standard algorithm) to co-activate with both hOC4v and IPS. This conclusion is further supported by the analysis of the fourth and final exemplary seed region chosen here, where we examined the co-activation pattern of the SGC. Functionally, the SGC is in marked contrast to the other seeds, reflecting affective and introspective processing in the so-called “default mode” (Amft et al. 2014; Schilbach et al. 2012). The standard MACM algorithm yielded across-study FC of this region with neighboring perigenual cingulum and nucleus accumbens, as well as a major cluster in posterior cingulum and two smaller clusters in left amygdala and left inferior parietal cortex. These results were mirrored by the revised MACM analysis and are in fact not very surprising, since all these regions have been previously associated with resting-state cognition and/or social-cognitive/emotional processing (Schilbach et al. 2012; Buckner et al. 2008; Sabatinelli et al. 2011). Unlike the other three seeds, however, applying the new, bias-adjusted SCALE algorithm resulted in an increased number of consistently co-activated brain regions. That is, the revised approach revealed significant specific co-activations beyond the previously observed ones, including bilateral anterior temporal regions, bilateral medial cerebellum, and right superior frontal gyrus.
As all but the right temporal co-activation formed rather minor clusters (50 < k ≤ 70; cf. Table 4), these additional findings might be false positives due to the somewhat more lenient significance thresholding used in the modified approach. There are, however, several arguments against this view: First, this potential leniency has not led to an increase in the number of (small) clusters in the previous three analyses. On the contrary, the number of clusters observed with the modified algorithm was generally smaller, which supports the claim that the new approach is more specific and inherently more stringent. Second, there was a new cluster larger than the smallest one obtained with the standard approach employing cluster-level FWE-corrected thresholding. Thus, the new approach can indeed yield additional clusters that cannot be explained by differences in thresholding. Third and most importantly, all of the clusters additionally observed with the modified approach are neurobiologically very plausible, as they were found in regions known to activate during resting state, social-cognitive/affective processing, or both (Buckner et al. 2008; Bzdok et al. 2012; Bzdok et al. 2013a; Schilbach et al. 2012; Shulman et al. 1997; Laird et al. 2009b). This corroborates the results obtained with the new algorithm and, given the previously demonstrated enhanced specificity of this algorithm, suggests that these additionally observed regions might also be part of a socio-affective core network. On the conceptual side, the emergence of additional findings not present in the standard analysis highlights the reverse of the above-mentioned bias for the standard MACM approach towards frequently activated regions. The global null-distribution employed in the classic approach actually makes significant co-activations generally less likely in regions that are less frequently activated across the neuroimaging literature such as the anterior temporal lobe. Thus, the standard approach may underestimate true effects in those more rarely activated parts of the brain. The revised approach, in turn, accommodates the lower a priori probability for activation in these regions and hence results in lower ALE thresholds here, as compared with regions that are activated very frequently, resulting in increased specificity.
As discussed above, accounting for the topographic distribution of activation foci across the entire database in the revised approach appears to be a generally more conservative approach providing a higher specificity. In particular, computing the null-distribution in reference to the database structure rather than the actual experiments in the ALE analysis effectively removes many presumably unspecific co-activation findings in regions that are activated frequently. In addition, the algorithm effectively lowers the ALE threshold for regions that are activated only sparsely, providing greater sensitivity than the standard global null-distribution.
Nevertheless, the risk of an enhanced rate of false positive findings due to more lenient thresholding might still be worrisome to users of the new approach. One potential solution is using minimum conjunctions to combine the results from both the standard and modified approach: the resulting (conjunction) map will contain only voxels that passed the less specific but FWE-corrected standard MACM analysis, while at the same time constraining the results of the standard approach to those voxels that were also found co-active by the new SCALE algorithm. This conjunction procedure thus offers the possibility to control three different sources of false positive findings at the same time: (i) low specificity of the standard approach as well as (ii) lenient thresholding and (iii) overestimated significance due to low prevalence in the database in the modified approach. The results of this conjunction approach applied to the exemplary analyses of our four seed regions are depicted in the Supplementary Material (Fig. S1). It should be noted, though, that this approach prevents the detection of (potentially valid and interesting) clusters of specific co-activation in less frequently activated regions (cf. SGC results). As a particularly conservative approach it is thus at the same risk to produce false negative results as is the standard MACM approach. This risk might be especially high for regions that are only sparsely activated. Given that the null-distribution assumes equal chances of spatial convergence across all gray-matter voxels, such regions have a smaller-than-average a priori chance of being found consistently co-activated with a particular seed.
In conclusion, the new bias-adjusted MACM algorithm indeed appears to achieve a higher level of specificity in modelling task-constrained across-study FC, as compared with the standard approach. However, depending on the seed region of interest, standard (ALE) versus bias-adjusted (SCALE) algorithms can produce both strongly different (e.g., hOC4v or aIns) and rather similar (e.g., IPS or SGC) co-activation patterns. In our examples, most of the regions that were co-activated with right IPS or SGC according to the standard approach thus appeared to reflect specific (rather than generic) co-activations with the given seed. In contradistinction, the strong reduction in significant co-activations for right area hOC4v and left aIns when using the bias-adjusted approach suggests that the results of the standard MACM analysis for these seeds are, at least in part, driven by the high prevalence of certain regions in the BrainMap database, rather than by their consistent and specific co-activation with the given seed.
Our exemplary results demonstrate that the modified MACM algorithm is a useful complementary approach to the standard one, providing information on specific functional associations between brain regions. This increased level of specificity might be especially useful when functional core networks are to be defined or functional sub-networks need to be differentiated. It should be emphasized again, though, that the conventional MACM approach is not inherently flawed but rather is designed to yield the co-activation pattern of a particular seed under a global null-hypothesis assuming equal chances of spatial convergence for every grey-matter location. The classic and revised MACM approaches thus offer answers to different but equally valid questions: “Which brain regions do generally co-activate with a given seed?” versus “Which regions do specifically co-activate with it?”
Supplementary Material
Acknowledgments
The study was in part supported by the National Institute of Mental Health (R01-MH074457-01A1 to S.B.E., P.T.F., and A.R.L.), the European Union (Human Brain Project to S.B.E), and the Deutsche Forschungsgemeinschaft (DFG: EI 816/4-1 to S.B.E.; LA 3071/3-1 to R.L. and S.B.E.).
Footnotes
Publisher's Disclaimer: This is a PDF file of an unedited manuscript that has been accepted for publication. As a service to our customers we are providing this early version of the manuscript. The manuscript will undergo copyediting, typesetting, and review of the resulting proof before it is published in its final citable form. Please note that during the production process errors may be discovered which could affect the content, and all legal disclaimers that apply to the journal pertain.
References
- Amft M, Bzdok D, Laird AR, Fox PT, Schilbach L, Eickhoff SB. Definition and characterization of an extended social-affective default network. Brain structure & function. 2014 doi: 10.1007/s00429-013-0698-0. doi:10.1007/s00429-013-0698-0. [DOI] [PMC free article] [PubMed] [Google Scholar]
- Amunts K, Kedo O, Kindler M, Pieperhoff P, Mohlberg H, Shah NJ, Habel U, Schneider F, Zilles K. Cytoarchitectonic mapping of the human amygdala, hippocampal region and entorhinal cortex: intersubject variability and probability maps. Anat Embryol (Berl) 2005;210(5-6):343–352. doi: 10.1007/s00429-005-0025-5. [DOI] [PubMed] [Google Scholar]
- Amunts K, Schleicher A, Bürgel U, Mohlberg H, Uylings HB, Zilles K. Broca’s region revisited: cytoarchitecture and intersubject variability. J Comp Neurol. 1999;412(2):319–341. doi: 10.1002/(sici)1096-9861(19990920)412:2<319::aid-cne10>3.0.co;2-7. [DOI] [PubMed] [Google Scholar]
- Andersen RA, Cui H. Intention, action planning, and decision making in parietal-frontal circuits. Neuron. 2009;63(5):568–583. doi: 10.1016/j.neuron.2009.08.028. doi:10.1016/j.neuron.2009.08.028. [DOI] [PubMed] [Google Scholar]
- Balsters JH, Laird AR, Fox PT, Eickhoff SB. Bridging the gap between functional and anatomical features of cortico-cerebellar circuits using meta-analytic connectivity modeling. Human brain mapping. 2013 doi: 10.1002/hbm.22392. doi:10.1002/hbm.22392. [DOI] [PMC free article] [PubMed] [Google Scholar]
- Bisley JW, Goldberg ME. Attention, intention, and priority in the parietal lobe. Annual review of neuroscience. 2010;33:1–21. doi: 10.1146/annurev-neuro-060909-152823. doi:10.1146/annurev-neuro-060909-152823. [DOI] [PMC free article] [PubMed] [Google Scholar]
- Bludau S, Eickhoff SB, Mohlberg H, Caspers S, Laird AR, Fox PT, Schleicher A, Zilles K, Amunts K. Cytoarchitecture, probability maps and functions of the human frontal pole. NeuroImage. 2013 doi: 10.1016/j.neuroimage.2013.05.052. doi:10.1016/j.neuroimage.2013.05.052. [DOI] [PMC free article] [PubMed] [Google Scholar]
- Buckner RL, Andrews-Hanna JR, Schacter DL. The brain’s default network - Anatomy, function, and relevance to disease. Ann Ny Acad Sci. 2008;1124:1–38. doi: 10.1196/annals.1440.011. doi:DOI 10.1196/annals.1440.011. [DOI] [PubMed] [Google Scholar]
- Bzdok D, Langner R, Hoffstaedter F, Turetsky BI, Zilles K, Eickhoff SB. The Modular Neuroarchitecture of Social Judgments on Faces. Cerebral Cortex. 2012;22(4):951–961. doi: 10.1093/cercor/bhr166. doi:10.1093/cercor/bhr166. [DOI] [PMC free article] [PubMed] [Google Scholar]
- Bzdok D, Langner R, Schilbach L, Engemann DA, Laird AR, Fox PT, Eickhoff SB. Segregation of the human medial prefrontal cortex in social cognition. Frontiers in human neuroscience. 2013a;7:232. doi: 10.3389/fnhum.2013.00232. doi:10.3389/Fnhum.2013.00232. [DOI] [PMC free article] [PubMed] [Google Scholar]
- Bzdok D, Langner R, Schilbach L, Jakobs O, Roski C, Caspers S, Laird AR, Fox PT, Zilles K, Eickhoff SB. Characterization of the temporo-parietal junction by combining data-driven parcellation, complementary connectivity analyses, and functional decoding. NeuroImage. 2013b;81:381–392. doi: 10.1016/j.neuroimage.2013.05.046. doi:10.1016/j.neuroimage.2013.05.046. [DOI] [PMC free article] [PubMed] [Google Scholar]
- Caspers J, Zilles K, Eickhoff SB, Schleicher A, Mohlberg H, Amunts K. Cytoarchitectonical analysis and probabilistic mapping of two extrastriate areas of the human posterior fusiform gyrus. Brain structure & function. 2013;218(2):511–526. doi: 10.1007/s00429-012-0411-8. doi:10.1007/s00429-012-0411-8. [DOI] [PMC free article] [PubMed] [Google Scholar]
- Caspers S, Geyer S, Schleicher A, Mohlberg H, Amunts K, Zilles K. The human inferior parietal cortex: cytoarchitectonic parcellation and interindividual variability. NeuroImage. 2006;33(2):430–448. doi: 10.1016/j.neuroimage.2006.06.054. [DOI] [PubMed] [Google Scholar]
- Choi HJ, Zilles K, Mohlberg H, Schleicher A, Fink GR, Armstrong E, Amunts K. Cytoarchitectonic identification and probabilistic mapping of two distinct areas within the anterior ventral bank of the human intraparietal sulcus. J Comp Neurol. 2006;495(1):53–69. doi: 10.1002/cne.20849. [DOI] [PMC free article] [PubMed] [Google Scholar]
- Cieslik EC, Zilles K, Caspers S, Roski C, Kellermann TS, Jakobs O, Langner R, Laird AR, Fox PT, Eickhoff SB. Is there "one" DLPFC in cognitive action control? Evidence for heterogeneity from co-activation-based parcellation. Cereb Cortex. 2013;23(11):2677–2689. doi: 10.1093/cercor/bhs256. doi:10.1093/cercor/bhs256. [DOI] [PMC free article] [PubMed] [Google Scholar]
- Cieslik EC, Zilles K, Kurth F, Eickhoff SB. Dissociating bottom-up and top-down processes in a manual stimulus-response compatibility task. J Neurophysiol. 2010;104(3):1472–1483. doi: 10.1152/jn.00261.2010. [DOI] [PMC free article] [PubMed] [Google Scholar]
- Clos M, Amunts K, Laird AR, Fox PT, Eickhoff SB. Tackling the multifunctional nature of Broca’s region meta-analytically: co-activation-based parcellation of area 44. NeuroImage. 2013;83:174–188. doi: 10.1016/j.neuroimage.2013.06.041. doi:10.1016/j.neuroimage.2013.06.041. [DOI] [PMC free article] [PubMed] [Google Scholar]
- Cole MW, Schneider W. The cognitive control network: Integrated cortical regions with dissociable functions. NeuroImage. 2007;37(1):343–360. doi: 10.1016/j.neuroimage.2007.03.071. doi:10.1016/j.neuroimage.2007.03.071. [DOI] [PubMed] [Google Scholar]
- Corbetta M, Shulman GL. Control of goal-directed and stimulus-driven attention in the brain. Nature reviews Neuroscience. 2002;3(3):201–215. doi: 10.1038/nrn755. doi:10.1038/nrn755. [DOI] [PubMed] [Google Scholar]
- Dell’Acqua F, Catani M. Structural human brain networks: hot topics in diffusion tractography. Current opinion in neurology. 2012;25(4):375–383. doi: 10.1097/WCO.0b013e328355d544. doi:10.1097/WCO.0b013e328355d544. [DOI] [PubMed] [Google Scholar]
- Dosenbach NU, Fair DA, Cohen AL, Schlaggar BL, Petersen SE. A dual-networks architecture of top-down control. Trends in cognitive sciences. 2008;12(3):99–105. doi: 10.1016/j.tics.2008.01.001. doi:10.1016/j.tics.2008.01.001. [DOI] [PMC free article] [PubMed] [Google Scholar]
- Dosenbach NU, Fair DA, Miezin FM, Cohen AL, Wenger KK, Dosenbach RA, Fox MD, Snyder AZ, Vincent JL, Raichle ME, Schlaggar BL, Petersen SE. Distinct brain networks for adaptive and stable task control in humans. Proceedings of the National Academy of Sciences of the United States of America. 2007;104(26):11073–11078. doi: 10.1073/pnas.0704320104. doi:10.1073/pnas.0704320104. [DOI] [PMC free article] [PubMed] [Google Scholar]
- Dosenbach NU, Visscher KM, Palmer ED, Miezin FM, Wenger KK, Kang HC, Burgund ED, Grimes AL, Schlaggar BL, Petersen SE. A core system for the implementation of task sets. Neuron. 2006;50(5):799–812. doi: 10.1016/j.neuron.2006.04.031. doi:10.1016/j.neuron.2006.04.031. [DOI] [PMC free article] [PubMed] [Google Scholar]
- Eickhoff SB, Bzdok D, Laird AR, Kurth F, Fox PT. Activation likelihood estimation meta-analysis revisited. NeuroImage. 2012;59(3):2349–2361. doi: 10.1016/j.neuroimage.2011.09.017. doi:10.1016/j.neuroimage.2011.09.017. [DOI] [PMC free article] [PubMed] [Google Scholar]
- Eickhoff SB, Bzdok D, Laird AR, Roski C, Caspers S, Zilles K, Fox PT. Co-activation patterns distinguish cortical modules, their connectivity and functional differentiation. NeuroImage. 2011;57(3):938–949. doi: 10.1016/j.neuroimage.2011.05.021. doi:10.1016/j.neuroimage.2011.05.021. [DOI] [PMC free article] [PubMed] [Google Scholar]
- Eickhoff SB, Grefkes C. Approaches for the integrated analysis of structure, function and connectivity of the human brain. Clinical EEG and neuroscience. 2011;42(2):107–121. doi: 10.1177/155005941104200211. [DOI] [PMC free article] [PubMed] [Google Scholar]
- Eickhoff SB, Jbabdi S, Caspers S, Laird AR, Fox PT, Zilles K, Behrens TE. Anatomical and functional connectivity of cytoarchitectonic areas within the human parietal operculum. The Journal of neuroscience : the official journal of the Society for Neuroscience. 2010;30(18):6409–6421. doi: 10.1523/JNEUROSCI.5664-09.2010. doi:10.1523/JNEUROSCI.5664-09.2010. [DOI] [PMC free article] [PubMed] [Google Scholar]
- Eickhoff SB, Laird AR, Grefkes C, Wang LE, Zilles K, Fox PT. Coordinate-based activation likelihood estimation meta-analysis of neuroimaging data: a random-effects approach based on empirical estimates of spatial uncertainty. Human brain mapping. 2009;30(9):2907–2926. doi: 10.1002/hbm.20718. doi:10.1002/hbm.20718. [DOI] [PMC free article] [PubMed] [Google Scholar]
- Eickhoff SB, Rottschy C, Kujovic M, Palomero-Gallagher N, Zilles K. Organizational principles of human visual cortex revealed by receptor mapping. Cereb Cortex. 2008;18(11):2637–2645. doi: 10.1093/cercor/bhn024. doi:10.1093/cercor/bhn024. [DOI] [PMC free article] [PubMed] [Google Scholar]
- Friston KJ, Harrison L, Penny W. Dynamic causal modelling. NeuroImage. 2003;19(4):1273–1302. doi: 10.1016/s1053-8119(03)00202-7. [DOI] [PubMed] [Google Scholar]
- Grefkes C, Fink GR. The functional organization of the intraparietal sulcus in humans and monkeys. Journal of anatomy. 2005;207(1):3–17. doi: 10.1111/j.1469-7580.2005.00426.x. doi:10.1111/j.1469-7580.2005.00426.x. [DOI] [PMC free article] [PubMed] [Google Scholar]
- Hoffstaedter F, Grefkes C, Caspers S, Roski C, Palomero-Gallagher N, Laird AR, Fox PT, Eickhoff SB. The role of anterior midcingulate cortex in cognitive motor control: Evidence from functional connectivity analyses. Human brain mapping. 2013 doi: 10.1002/hbm.22363. doi:10.1002/hbm.22363. [DOI] [PMC free article] [PubMed] [Google Scholar]
- Jakobs O, Langner R, Caspers S, Roski C, Cieslik EC, Zilles K, Laird AR, Fox PT, Eickhoff SB. Across-study and within-subject functional connectivity of a right temporo-parietal junction subregion involved in stimulus-context integration. NeuroImage. 2012;60(4):2389–2398. doi: 10.1016/j.neuroimage.2012.02.037. doi:10.1016/j.neuroimage.2012.02.037. [DOI] [PMC free article] [PubMed] [Google Scholar]
- Kellermann TS, Caspers S, Fox PT, Zilles K, Roski C, Laird AR, Turetsky BI, Eickhoff SB. Task- and resting-state functional connectivity of brain regions related to affection and susceptible to concurrent cognitive demand. NeuroImage. 2013;72:69–82. doi: 10.1016/j.neuroimage.2013.01.046. doi:10.1016/j.neuroimage.2013.01.046. [DOI] [PMC free article] [PubMed] [Google Scholar]
- Kurth F, Zilles K, Fox PT, Laird AR, Eickhoff SB. A link between the systems: functional differentiation and integration within the human insula revealed by meta-analysis. Brain structure & function. 2010;214(5-6):519–534. doi: 10.1007/s00429-010-0255-z. doi:10.1007/s00429-010-0255-z. [DOI] [PMC free article] [PubMed] [Google Scholar]
- Laird AR, Eickhoff SB, Fox PM, Uecker AM, Ray KL, Saenz JJ, Jr., McKay DR, Bzdok D, Laird RW, Robinson JL, Turner JA, Turkeltaub PE, Lancaster JL, Fox PT. The BrainMap strategy for standardization, sharing, and meta-analysis of neuroimaging data. BMC research notes. 2011;4:349. doi: 10.1186/1756-0500-4-349. doi:10.1186/1756-0500-4-349. [DOI] [PMC free article] [PubMed] [Google Scholar]
- Laird AR, Eickhoff SB, Kurth F, Fox PM, Uecker AM, Turner JA, Robinson JL, Lancaster JL, Fox PT. ALE Meta-Analysis Workflows Via the Brainmap Database: Progress Towards A Probabilistic Functional Brain Atlas. Frontiers in neuroinformatics. 2009a;3:23. doi: 10.3389/neuro.11.023.2009. doi:10.3389/neuro.11.023.2009. [DOI] [PMC free article] [PubMed] [Google Scholar]
- Laird AR, Eickhoff SB, Li K, Robin DA, Glahn DC, Fox PT. Investigating the functional heterogeneity of the default mode network using coordinate-based meta-analytic modeling. The Journal of neuroscience. 2009b;29(46):14496–14505. doi: 10.1523/JNEUROSCI.4004-09.2009. doi:10.1523/JNEUROSCI.4004-09.2009. [DOI] [PMC free article] [PubMed] [Google Scholar]
- Laird AR, Eickhoff SB, Rottschy C, Bzdok D, Ray KL, Fox PT. Networks of task co-activations. NeuroImage. 2013;80:505–514. doi: 10.1016/j.neuroimage.2013.04.073. doi:10.1016/j.neuroimage.2013.04.073. [DOI] [PMC free article] [PubMed] [Google Scholar]
- Langner R, Cieslik EC, Behrwind SD, Roski C, Caspers S, Amunts K, Eickhoff SB. Aging and response conflict solution: behavioural and functional connectivity changes. Brain Struct Funct. 2014 doi: 10.1007/s00429-014-0758-0. [Advance online publication]. doi:10.1007/s00429-014-0758-0. [DOI] [PMC free article] [PubMed] [Google Scholar]
- Langner R, Eickhoff SB. Sustaining attention to simple tasks: a meta-analytic review of the neural mechanisms of vigilant attention. Psychological bulletin. 2013;139(4):870–900. doi: 10.1037/a0030694. doi:10.1037/a0030694. [DOI] [PMC free article] [PubMed] [Google Scholar]
- Langner R, Kellermann T, Boers F, Sturm W, Willmes K, Eickhoff SB. Modality-specific perceptual expectations selectively modulate baseline activity in auditory, somatosensory, and visual cortices. Cereb Cortex. 2011;21(12):2850–2862. doi: 10.1093/cercor/bhr083. doi:10.1093/cercor/bhr083. [DOI] [PubMed] [Google Scholar]
- Langner R, Sternkopf MA, Kellermann TS, Grefkes C, Kurth F, Schneider F, Zilles K, Eickhoff SB. Translating working memory into action: Behavioral and neural evidence for using motor representations in encoding visuo-spatial sequences. Human brain mapping. 2013 doi: 10.1002/hbm.22415. doi:10.1002/hbm.22415. [DOI] [PMC free article] [PubMed] [Google Scholar]
- Müller VI, Cieslik EC, Laird AR, Fox PT, Eickhoff SB. Dysregulated left inferior parietal activity in schizophrenia and depression: functional connectivity and characterization. Frontiers in human neuroscience. 2013;7:268. doi: 10.3389/fnhum.2013.00268. doi:10.3389/fnhum.2013.00268. [DOI] [PMC free article] [PubMed] [Google Scholar]
- Palomero-Gallagher N, Vogt BA, Schleicher A, Mayberg HS, Zilles K. Receptor architecture of human cingulate cortex: evaluation of the four-region neurobiological model. Human brain mapping. 2009;30(8):2336–2355. doi: 10.1002/hbm.20667. doi:10.1002/hbm.20667. [DOI] [PMC free article] [PubMed] [Google Scholar]
- Petersen SE, Posner MI. The attention system of the human brain: 20 years after. Annual review of neuroscience. 2012;35:73–89. doi: 10.1146/annurev-neuro-062111-150525. doi:10.1146/annurev-neuro-062111-150525. [DOI] [PMC free article] [PubMed] [Google Scholar]
- Reetz K, Dogan I, Rolfs A, Binkofski F, Schulz JB, Laird AR, Fox PT, Eickhoff SB. Investigating function and connectivity of morphometric findings--exemplified on cerebellar atrophy in spinocerebellar ataxia 17 (SCA17) NeuroImage. 2012;62(3):1354–1366. doi: 10.1016/j.neuroimage.2012.05.058. doi:10.1016/j.neuroimage.2012.05.058. [DOI] [PMC free article] [PubMed] [Google Scholar]
- Robinson JL, Laird AR, Glahn DC, Lovallo WR, Fox PT. Metaanalytic connectivity modeling: delineating the functional connectivity of the human amygdala. Human brain mapping. 2010;31(2):173–184. doi: 10.1002/hbm.20854. doi:10.1002/hbm.20854. [DOI] [PMC free article] [PubMed] [Google Scholar]
- Roe AW, Chelazzi L, Connor CE, Conway BR, Fujita I, Gallant JL, Lu H, Vanduffel W. Toward a unified theory of visual area V4. Neuron. 2012;74(1):12–29. doi: 10.1016/j.neuron.2012.03.011. doi:10.1016/j.neuron.2012.03.011. [DOI] [PMC free article] [PubMed] [Google Scholar]
- Roski C, Caspers S, Langner R, Laird AR, Fox PT, Zilles K, Amunts K, Eickhoff SB. Adult age-dependent differences in resting-state connectivity within and between visual-attention and sensorimotor networks. Frontiers in aging neuroscience. 2013;5:67. doi: 10.3389/fnagi.2013.00067. doi:10.3389/fnagi.2013.00067. [DOI] [PMC free article] [PubMed] [Google Scholar]
- Rottschy C, Caspers S, Roski C, Reetz K, Dogan I, Schulz JB, Zilles K, Laird AR, Fox PT, Eickhoff SB. Differentiated parietal connectivity of frontal regions for "what" and "where" memory. Brain structure & function. 2013;218(6):1551–1567. doi: 10.1007/s00429-012-0476-4. doi:10.1007/s00429-012-0476-4. [DOI] [PMC free article] [PubMed] [Google Scholar]
- Rottschy C, Eickhoff SB, Schleicher A, Mohlberg H, Kujovic M, Zilles K, Amunts K. Ventral visual cortex in humans: cytoarchitectonic mapping of two extrastriate areas. Human brain mapping. 2007;28(10):1045–1059. doi: 10.1002/hbm.20348. doi:10.1002/hbm.20348. [DOI] [PMC free article] [PubMed] [Google Scholar]
- Rottschy C, Langner R, Dogan I, Reetz K, Laird AR, Schulz JB, Fox PT, Eickhoff SB. Modelling neural correlates of working memory: a coordinate-based meta-analysis. NeuroImage. 2012;60(1):830–846. doi: 10.1016/j.neuroimage.2011.11.050. doi:10.1016/j.neuroimage.2011.11.050. [DOI] [PMC free article] [PubMed] [Google Scholar]
- Sabatinelli D, Fortune EE, Li QY, Siddiqui A, Krafft C, Oliver WT, Beck S, Jeffries J. Emotional perception: Meta-analyses of face and natural scene processing. NeuroImage. 2011;54(3):2524–2533. doi: 10.1016/j.neuroimage.2010.10.011. doi:10.1016/j.neuroimage.2010.10.011. [DOI] [PubMed] [Google Scholar]
- Scheperjans F, Eickhoff SB, Hömke L, Mohlberg H, Hermann K, Amunts K, Zilles K. Probabilistic maps, morphometry, and variability of cytoarchitectonic areas in the human superior parietal cortex. Cereb Cortex. 2008;18(9):2141–2157. doi: 10.1093/cercor/bhm241. [DOI] [PMC free article] [PubMed] [Google Scholar]
- Schilbach L, Bzdok D, Timmermans B, Fox PT, Laird AR, Vogeley K, Eickhoff SB. Introspective minds: using ALE meta-analyses to study commonalities in the neural correlates of emotional processing, social & unconstrained cognition. PloS one. 2012;7(2):e30920. doi: 10.1371/journal.pone.0030920. doi:10.1371/journal.pone.0030920. [DOI] [PMC free article] [PubMed] [Google Scholar]
- Seeley WW, Menon V, Schatzberg AF, Keller J, Glover GH, Kenna H, Reiss AL, Greicius MD. Dissociable intrinsic connectivity networks for salience processing and executive control. The Journal of neuroscience : the official journal of the Society for Neuroscience. 2007;27(9):2349–2356. doi: 10.1523/JNEUROSCI.5587-06.2007. doi:10.1523/JNEUROSCI.5587-06.2007. [DOI] [PMC free article] [PubMed] [Google Scholar]
- Shulman GL, Fiez JA, Corbetta M, Buckner RL, Miezin FM, Raichle ME, Petersen SE. Common blood flow changes across visual tasks: II. Decreases in cerebral cortex. J Cognitive Neurosci. 1997;9(5):648–663. doi: 10.1162/jocn.1997.9.5.648. doi:10.1162/jocn.1997.9.5.648. [DOI] [PubMed] [Google Scholar]
- Smith SM, Fox PT, Miller KL, Glahn DC, Fox PM, Mackay CE, Filippini N, Watkins KE, Toro R, Laird AR, Beckmann CF. Correspondence of the brain’s functional architecture during activation and rest. Proceedings of the National Academy of Sciences of the United States of America. 2009;106(31):13040–13045. doi: 10.1073/pnas.0905267106. doi:10.1073/pnas.0905267106. [DOI] [PMC free article] [PubMed] [Google Scholar]
- Turkeltaub PE, Eden GF, Jones KM, Zeffiro TA. Meta-analysis of the functional neuroanatomy of single-word reading: method and validation. NeuroImage. 2002;16(3 Pt 1):765–780. doi: 10.1006/nimg.2002.1131. [DOI] [PubMed] [Google Scholar]
- Turkeltaub PE, Eickhoff SB, Laird AR, Fox M, Wiener M, Fox P. Minimizing within-experiment and within-group effects in activation likelihood estimation meta-analyses. Human brain mapping. 2012;33(1):1–13. doi: 10.1002/hbm.21186. doi:10.1002/hbm.21186. [DOI] [PMC free article] [PubMed] [Google Scholar]
- van den Heuvel MP, Hulshoff Pol HE. Exploring the brain network: a review on resting-state fMRI functional connectivity. European neuropsychopharmacology : the journal of the European College of Neuropsychopharmacology. 2010;20(8):519–534. doi: 10.1016/j.euroneuro.2010.03.008. doi:10.1016/j.euroneuro.2010.03.008. [DOI] [PubMed] [Google Scholar]
- Yarkoni T, Poldrack RA, Nichols TE, Van Essen DC, Wager TD. Large-scale automated synthesis of human functional neuroimaging data. Nature methods. 2011;8(8):665–670. doi: 10.1038/nmeth.1635. doi:10.1038/nmeth.1635. [DOI] [PMC free article] [PubMed] [Google Scholar]
Associated Data
This section collects any data citations, data availability statements, or supplementary materials included in this article.