

Abstract
Caffeine is the most popular psychoactive drug in the world which contributes to behavioral and metabolic changes when ingested. Within the central nervous system (CNS), caffeine has a high affinity for A1 and A2a adenosine receptors. Serving as an antagonist, caffeine affects the ability for adenosine to bind to these receptors. Caffeine has been shown to alter neuronal functioning through increasing spontaneous firing. However, the effects of caffeine on non-neuronal cells in the CNS has been not been studied extensively. Microglia are one phenotype of non-neuronal glia within the CNS. Acting as phagocytes, they contribute to the immune defense system of the brain and express A1 and A2a adenosine receptors. Caffeine, therefore, may affect microglia. In order to test this hypothesis, CD-1 mice were randomly placed into one of three groups: control, low caffeine (0.3g/L water) and high caffeine (1.0g/L water) and were allowed to drink freely for 30 days. Following 30 days, brain sections were stained to reveal microglia. Morphological reconstructions and density measurements were examined in cortical and subcortical areas including the primary sensory cortex, primary motor cortex and striatum. Results indicate that microglial density throughout the brain is decreased in the caffeine groups as compared to the control. Caffeine also impacted microglia morphology shortening process length and decreasing branching. These results suggest that chronic caffeine ingestion has a systemic impact on microglia density and their activation.
Keywords: Microglia, Caffeine, Adenosine
1. Introduction
The psychostimulant, caffeine is the most widely used psychoactive drug in the world (Julien 2005). Caffeine is found in coffee, tea, soft drinks, chocolate as well as several over-the-counter pain relievers. According to the Food and Drug Administration (FDA), the average American adult consumes 300 mg/day and the average teenager consumes 100 mg/day (Somogyi, 2010). Once consumed, caffeine produces a variety of behavioral effects including increased attention, reduced fatigue and enhanced motor activity (reviewed by Smith 2002). Caffeine readily crosses the blood brain barrier (McCall et al., 1982) and the mechanism of action appears involve blocking adenosine receptors, thus reducing adenosine transmission throughout the brain (reviewed by Fisone et al. 2004). Caffeine also does not display stimulant effects on mice lacking the adenosine receptor A2a (Ledent 1997).
Adenosine is a purine nucleoside produced extracellularly through the breakdown of adenosine triphosphate (ATP). Furthermore, while not traditionally classified as neurotransmitter, there are numerous receptors specific for adenosine found throughout the central nervous system. These g-protein coupled receptors include A1, A2a, A2b and A3 receptors. Caffeine binds primarily to A1 and A2a receptors serving as an antagonist to those receptors (reviewed by Fisone et al. 2004). Xanthines, such as caffeine, function as an antagonist to adenosine, which prevents the suppression of neuronal activity (Daly and Fredholm 1998, Garrett and Griffiths 1997). Adenosine is also involved in neuroprotection following brain injury, and is known to play a role in central immune responses (reviewed by Cunha 2005, Wardas 2002; Li et al., 2013; Gyoneva et al., 2009; Wollmer et al., 2001). However, although the behavioral effects of caffeine, as well as its action on neurons, have been well studied, the effects of caffeine on the brain's immune responses have yet to be fully investigated. Microglia are one type of glial cell and serve as the immune system of the central nervous system (Gehrmann et al. 1995). Primarily acting as phagocytes, microglia engulf and destroy dangerous or foreign material in the brain. Microglia transition between two states: activated and surveillant. When microglia are in the surveillant state, they have extended and heavily branched processes which survey their surroundings. When in contact with infectious or otherwise dangerous material, they enter an activated state during which their processes retract and engage in phagocytosis; engulfing and eliminating harmful debris (Ling and Wong, 1993, Gehrmann et al., 1995). Numerous studies have shown that microglia response is regulated, in part, by adenosine (Li et al., 2013; Gyoneva et al., 2009; Wollmer et al., 2001). For instance, A2a receptor stimulation during brain inflammation causes microglia to retract their processes and take on the characteristic ambeloid shape indicating its activation (Orr et al., 2009). In addition, stimulation of A1 and A2 receptors promote microglia proliferation whereas A1 receptor blockade reduces proliferation (Gebicke-Haerter et al., 1996). More recently, it was confirmed that microglia contain A1 receptors and that stimulation of these receptors using adenosine agonists inhibits microglia activation (Luongo et al., 2013).
While microglia has been most associated with immune response, there is evidence that microglia play an important role in the active maintenance of the brain. Recent studies have revealed that microglia are capable of removing weak synapses (Bialas and Stevens, 2013; reviewed by Šišková and Tremblay, 2013) as well as weak, but still viable, neurons (Brown and Neher, 2014). Within the healthy brain, microglia regulates synaptic activity and aides in the reorganization of neuronal circuits (Trembly et al., 2011). In this resepect we should reconsider the role of microglia, and examine how microglia function, and how that function can be altered, within the healthy brain.
As microglia contain A1 and A2a receptors, we believe caffeine can exert an effect on these cells. Indeed, it was found that caffeine suppresses the proinflammatory response that occurs during prolonged activation of microglia (Lee et al., 2013; Ruiz-Medina et al., 2013; Kang et al., 2012; Brothers et al., 2010) and therefore may be neuroprotective in neurodegenertive diseases such as Parkinson's disease and multiple sclerosis (Yadav et al., 2012, Tsuitsui et al., 2004). Caffiene also increases microglia reactivity when treated with 3,4-methylenedioxy-N-methylamphetamine (MDMA) (Khairnar et al., 2009). However, the afforementioned studies examined caffiene's effect on mircoglia following brain insult. The purpose of the current study is to better understand how caffeine affects microglia in the healthy brain.
2. Methods
2.1 Animals and Materials
Female CD-1 mice (n=21, Charles River Laboratories) were randomly divided into three groups: low caffeine, which received 0.3 g/L of caffeine dissolved in tap water, high caffeine, which received 1.0g/L of caffeine dissolved in tap water, and control, which received only tap water (n= 7 per group). Females were used as caffeine can cause dramatic effects in females including altering estrogen levels (Schliep et al., 2012) and affecting reproductive outcomes (Klonoff-Cohen et al., 2002). However, it should be noted males receive a larger therapeutic benefit of caffeine in regard to Parkinson's disease (Palacios et al., 2012) and amyotrophic lateral sclerosis (ALS) (Seevaratnam et al., 2009). Dosages were determined based on previous literature (Reig et al., 2007; Li et al., 2008). All animals were postnatal day (P)30. There was no significant difference in the initial weight of the control, low dose and high dose groups (13.04 ± 0.20g, 13.27 ± 0.31g and 13.06 ± 0.32g, respectively; ANOVA, P>0.05). Mice were handled in accordance with Queens College, CUNY IACUC (Protocol #100, approved July 3, 2012) and NIH rules governing the ethical and responsible treatment of animals for biomedical research.
2.2 Experimental Procedure
Mice were housed individually in standard plastic cages and allowed to drink and eat freely for 30 days. The weight of the mice was measured every week and the volume of liquid consumed was recorded daily (Figure 1A, B. Daily caffeine intake was also calculated (Figure 1C).
Figure 1. Effects of Caffeine on Drinking Behavior.
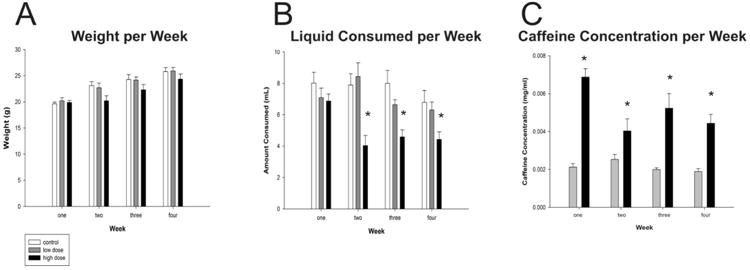
(A) Weight of mice in grams per week (B) Total liquid consumed, in milliliters, per week. (C) Concentration of caffeine ingested in the low and high dose group per week. Asterisks denote significant differences between groups (p<0.05). Plots represent population means and error bars represent one standard error of the mean.
2.3 Immunohistochemistry
At the end of the 30 day treatment period mice were anesthetized with an intraperitoneal injection of Euthasol (Virbac AH, Inc.), perfused transcardially with 0.9% saline in distilled water followed by 4% paraformaldehyde in 0.1M phosphate buffered saline (PBS), and their brains were post-fixed in 4% formaldehyde in 0.01 M PBS for seven days. Brains were sectioned at 70 μm on a Vibratome (Leica, VTs1000) using the slowest cutting speed and greatest amplitude to minimize tissue damage. The brain slices were first washed with 0.01M PBS three times for 10 minutes per wash. To decrease endogenous peroxidases, we then incubated the slices for 30 minutes in a solution containing 20μl of 30% H2O2, 10μl 100% CH3OH dissolved in 1L of 0.01 M PBS. Following this step, slices were once again washed in 0.01 M PBS three times for 10 minutes per wash. We then permeabilized each slice with 0.3% Triton X-100 and blocked with 5% normal serum (Vector Laborotories) at room temperature for 1 hr in 0.01 M PBS. Primary antibody to Iba-1 made in rabbit (2% normal rabbit serum, 1:1000 dilution Iba-1 primary antibody(abcam (catalog#ab5076)) in 0.01M PBS) were administered to the floating brain sections for approximately 48 hours at 4°C. The antibody to Iba-1 was used as it specifically labels microglia (Haselkorn et al., 2009). Following the incubation period, slices were once again washed three times in 0.01 M PBS for 10 minutes per wash. Slices were then treated with the appropriate biotinylated secondary antibodies (1:500 dilution in 0.01 M PBS: biotinylated rabbit anti-goat, (Jackson Immuno) + 2% normal rabbit serum) for 150 minutes. After rinsing three times in 0.01 M PBS, slices were incubated in avidin-biotin HRP complex (ABC solution, Vector Laboratories) for 60 minutes. Finally, slices were reacted in a solution of 0.7mg 3.3′-Diaminobenzidine (DAB, Sigma-Aldrich (catalog #Sigma D-5905)) + 2.5 μl of 30% H2O2 in 5ml of 0.01M PBS solution for 5 minutes in order to reveal Iba-1 labeling. Following incubation, slices were washed in 0.01 M PBS three times for 10 minutes, mounted onto gelatinized slides and then dehydrated with ethanol, defatted with a xylene substitute (Safeclear II, ThermoFisher Scientific) and cover slipped using permount (Figure 2A, B).
Figure 2. Representative photomicrographs of Iba-1+ microglia.
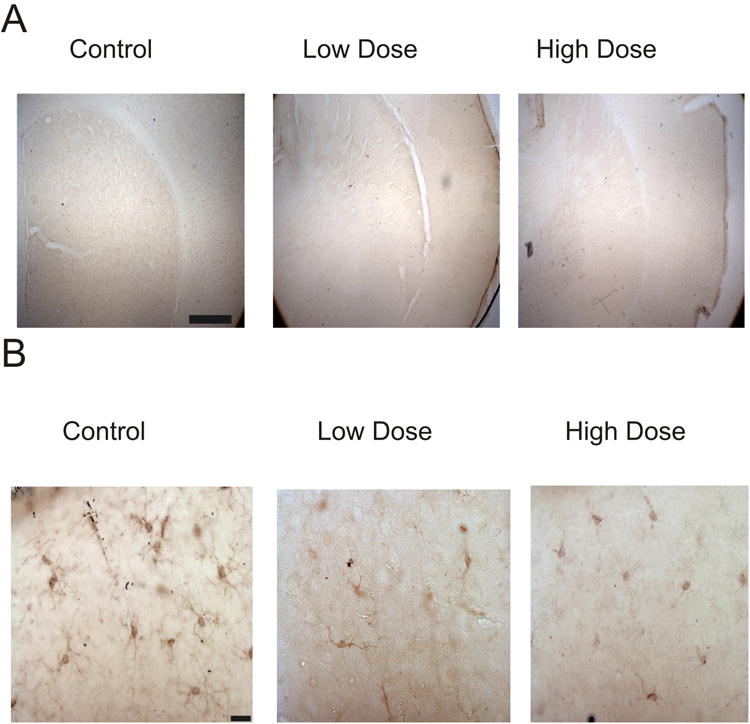
Images of striatum taken at low magnification (A) and individual microglia at high magnification (B). Scalebars represent 100μm (A) and 10μm (B).
2.4 Luminance Measurements
In order to examine the effect of caffeine on microglia throughout the brain, we identified the primary motor cortex (M1), primary somatosensory cortex (S1), striatum, thalamus, hypothalamus and cortical white matter using a mouse brain atlas (Paxinos and Franklin 2001). Images of these areas were taken using a computer assisted program (Neurolucida, MBF Biosciences Inc.). Measurements were performed on an Olympus BX51 microscope. We used 4× (0.1 numerical aperture (NA)) and 10× (0.4 NA) objectives for imaging. Digital images were taken in 10× (0.4 NA) magnification after calibrating the microscope using an Optronics Microfire Camera attached to a dedicated PC. During data collection, camera exposure levels and gain were held constant throughout. Following image collection, we used the Neurolucida “manual contour mapping” tool which allowed us to define our desired region of interest (ROI). Luminance measurements were recorded using Neurolucida, which measures the amount of light transmitted within the traced ROI. We calculated the ratio between brightness and area for each slice in each group to account for ROIs of different areas. For each region, we normalized to the staining intensity of the closest white mater which showed little immunoreactivity (Figure 2). We divided the intensity of the ROI by the intensity of white matter ROI to obtain normalized staining intensity. The mean luminance of the cortical white matter was not significantly different (p = 0.70) between control (176.50 ± 1.55) low dose (173.94 ± 2.47) and high dose (173.57 ± 3.932) groups (n=7 sections from 7 animals per group, N=21 total animals).
2.5 Stereology
To validate our luminance measurements, stereological counts were done within region M1 on n = 4 slices per group (N = 12 slices) using the software program Stereo Investigator (MBF Biosciences Inc.). The contours of M1 were outlined using our 4× objective. We chose 10 sampling areas randomly for each section to quantify IBA-1+ microglia. Numerical densities were estimated using the optical fractionator method with a 10× objective. Stereo Investigator was used to superimpose a randomized grid onto the contour of interest. The randomized grid created sampling sites within each contour. A minimum of ten random sampling sites were analyzed within each contour, with a grid size of 130 μm × 130 μm and a counting frame size of 60 μm × 60 μm. Using these samples, Stereo Investigator provided an estimate of total number of microglia in the contour area. To account for any differences in contour size, the estimated number was divided by contour area and used for statistical analyses.
2.6 Morphological Reconstruction
We reconstructed microglia cells in brain slices using a 60× (1.4 NA) oil emersion objective, using the computer assisted program Neurolucida (version 10, MBF Biosciences Inc.). For each group, we traced n=10 cells of microglia (1-2 microglia were randomly from each mouse for each group for each area) from each of the five previously quantified brain areas for each group; M1, S1, thalamus, hypothalamus and striatum (N=150 reconstructed microglia). Morphological analysis was performed for each cell from each brain area for each group in the computer using the NeuroExplorer software package (MBF Biosciences Inc). We compared the following structural measures of microglia: size of the cell body (μm), and the length (μm) and branching of their processes (quantity).
2.7 Statistical Analysis
Statistics were computed using the Sigmaplot software package (Systat Software Inc.) for between group analyses. One way analyses of variance (ANOVA) were conducted and Tukey's post-hoc tests were used to determine the source of the variance, if any. We compared the luminance of each treatment condition with respect to each the five brain areas measured. ANOVAs were also performed in order to analyze the morphological differences in microglia across groups. Comparisons also include the weight and liquid consumed per week for each condition. Statistical significance was set at p < 0.05. All data are reported as means ± standard error of the mean (SEM).
3. Results
3.1 Eating and Drinking Behavior
In order to examine the possible impact caffeine has on weight gain or loss, animals were weighed at the end of every week. At the end of week one, control, low dose and high dose animals weighed 19.63±0.34g, 20.20±0.61g, and 19.9±0.36g, respectively. By the end of week four, animals weighed 25.80±0.75g, 25.90±0.70g and 24.35±0.98g for control, high dose and low dose groups, respectively. While the high dose group weighed less than the others throughout the experiment, no significant differences in body weight were found at time of sacrifice (week four: F(2,18) = 0.35, p=0.351; Figure 1A). There were also no significant differences found in the amount of liquid consumed in the first week (F(2,18) = 1.05, p=0.37). At the end of week one, control, low dose and high dose animals consumed 8.01±0.70mL, 7.09±0.71mL, and 6.87±0.45mL of liquid, respectively. However, by the end of week four, control animals drank 6.79±0.51mL and low and high dose groups drank 6.30±0.51mL and 4.43±0.48mL, respectively (F(2,18) = 4.4, p<0.05; Figure 1B). A Tukey's post hoc test revealed that the high dose group consumed significantly less than the control group, but not the low dose group. The low dose group also did not drink significantly less than the control group or the high dose group. We suggest that since caffeine is bitter, it may have been aversive to drink. However, we calculated the amount of caffeine consumed by the low and high dose groups and despite drinking less the high dose group still ingested more caffeine (Figure 1C).
3.2 Microglia Density
Following thirty days of free eating and drinking, animals were sacrificed. We then examined microglia expression using immunohistochemistry for the microglia specific marker Iba-1. Microglia density was examined by measuring the brightness of the brain area of interest. Brightness is an indirect indicator of microglia density; it is assumed that stained microglia absorb light and reduce the amount of light passing through the tissue, thus decreasing the luminance of the slice. Therefore, lower brightness level will be indicative of higher densities of microglia.
We calculated the brightness of the following representative areas: primary motor cortex (M1), primary somatosensory cortex (S1), thalamus, hypothalamus and striatum and normalized their values to the values obtained from the immediately adjacent white matter that had no microglia staining (Table 1).
Table 1. Relative Density of Microglia.
Summary of relative luminance measurements in control, low dose and high dose groups. All data are reported as means ± standard error of the mean (SEM). Statistical significance compared to the other two groups (p<0.05) is reported with the symbol *
| Condition | n | Brain Area | ||||
|---|---|---|---|---|---|---|
| S1 | M1 | Striatum | Thalamus | Hypothalamus | ||
| Control | 7 | 0.46±0.27 * | 0.39±0.23 * | 0.37±0.02 * | 0.36±0.05 * | 0.36±0.02 * |
| Low Dose | 7 | 0.82±0.02 | 0.82±0.19 | 0.85±0.14 | 0.85±0.04 | 0.86±0.20 |
| High Dose | 7 | 0.75±0.01 | 0.76±0.02 | 0.78±0.01 | 0.84±0.75 | 0.84±0.17 |
There was a significant decrease of microglia staining in the cortical areas: primary motor cortex and primary somatosensory cortex in both the low caffeine and high caffeine groups compared to control group (p < 0.001 for all). Caffeine significantly decreased microglia density in subcortical areas as well: thalamus, hypothalamus and striatum in low caffeine and high caffeine groups compared to the control group (p < 0.001 for all). It appears caffeine had a global effect as density was similarly affected in all brain areas (Figure 3A). In order to confirm that the brightness measurements were accurate, unbiased stereological counts were conducted within M1. Similar to the brightness results, significant differences were found between groups (F(2,10)=21.58, p<0.001). A Tukey post-hoc test revealed that, as in the brightness results, the high and low dose group had decreased amounts of microglia than control, but did not differ from each other (Figure 3B).
Figure 3. Caffeine impacts microglia density.
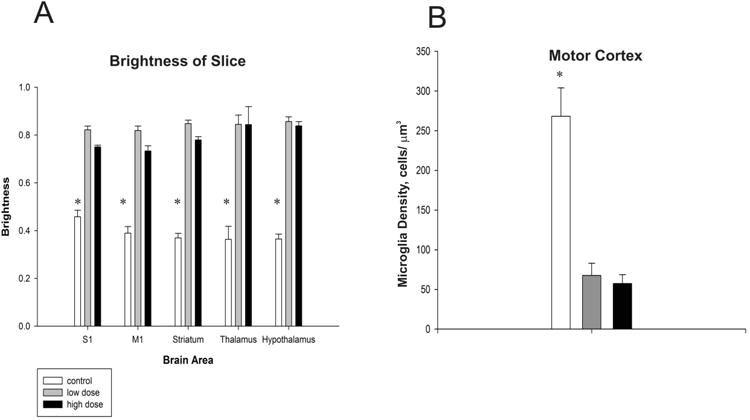
Differences in luminosity between groups in each of the five brain areas quantified (A). A lower index indicates a higher density of microglia. (B) Unbiased stereological quantification of microglia in the primary Motor Cortex. Asterisks denote significant differences between groups (p<0.05). Plots represent population means and error bars represent one standard error of the mean.
3.3 Microglia Morphology
We then examined whether caffeine not only affected the density of microglia, but also cell morphology. Microglia were traced under high magnification (60× oil immersion) in the same brain areas previously described (Figure 4, n=10 cells per group per brain area).
Figure 4. Morphological reconstructions of microglia.

Representative reconstructions of microglia in control, low dose and high dose groups from the primary motor cortex, primary sensory cortex, striatum, thalamus and hypothalamus. Scalebars = 10μm.
We quantified several features including process length, branching (nodes), and cell body perimeter (Table 2). There was no significant difference in the cell body perimeter in the following areas: M1 (control = 21.49 ± 0.78 μm; low dose = 19.27 ± 1.24 μm; high dose = 20.28 ± 0.72; p > 0.05), thalamus (control = 19.37 ± 0.36 μm; low dose = 16.06 ± 1.28 μm; high dose = 18.70 ± 0.72; p > 0.05), and hypothalamus (control = 20.38 ± 0.72 μm; low dose = 17.96 ± 0.82 μm; high dose = 20.26 ± 0.62; p > 0.05). However it was found there were significant differences in S1(control = 21.20 ± 0.65 μm; low dose = 16.49 ± 1.28 μm; high dose = 21.87 ± 1.01; p < 0.05), and the striatum (control = 21.44 ± 1.59 μm; low dose = 15.96 ± 1.49 μm; high dose = 18.01 ± 0.81; p < 0.05). Pairwise comparisons revealed that within S1, the high dose group had larger cell bodies compared to the low dose group. The control group did not differ from the low dose or high dose group. We also found that within the striatum, the control group had larger cell bodies than the low dose group, but not the high dose group (Figure 5A). Microglia morphology, however, remained mostly stable within each group. No differences were found in any region within the control group (p > 0.05) or the low dose group (p > 0.05). A significant difference between brain areas was found within the high dose group (p<0.05). However, a tukey's post hoc test revealed the only significant differences were between S1 and the striatum, where S1 microglia had the larger somata. While there were not many differences in cell body size, it was found that microglia process length (Figure 5B) was significantly different in the following areas S1 (control = 153 ± 22.16 μm; low dose = 35.98 ± 2.93 μm; high dose = 48.51 ± 3.01; p < 0.05), M1 (control = 106.74 ± 16.74 μm; low dose = 55.27 ± 14.71 μm; high dose = 41.68 ± 3.02; p < 0.05), striatum (control = 111.94 ± 17.90 μm; low dose = 29.38 ± 2.30 μm; high dose = 51.95 ± 3.59; p < 0.05),, thalamus (control = 91.23 ± 31.24 μm; low dose = 33.09 ±1.76 μm; high dose = 37.77 ± 1.76; p < 0.05), and hypothalamus (control = 148.59 ± 33.89 μm; low dose = 33.89 ± 2.63 μm; high dose = 78.10 ± 14.30; p < 0.05). Post-hoc analysis revealed that in regions S1 and M1, the control group had longer processes than both the high and low dose groups, but the low dose group did not differ from the high dose group. It was also found that within the striatum, all three groups differed significantly where the control had the longest processes followed by the high dose group. Within the hypothalamus and thalamus, the control group had longer processes compared to the low dose group. No differences were found between the low dose and high dose group or the high dose group and control.
Table 2. Morphological characteristics of microglia.
All data are reported as means ± standard error of the mean. Statistical significance (p<0.05) is reported in the text.
| Brain Area | |||||||
|---|---|---|---|---|---|---|---|
| condition | n | S1 | M1 | Striatum | Thalamus | Hypothalamus | |
| Cell Body Perimeter(μm) | Control | 10 | 21.2±0.65 | 21.49±0.78 | 21.44±1.59 | 19.37±0.36 | 20.38±0.72 |
| Low Dose | 10 | 16.49±1.28 | 19.27±1.24 | 15.96±1.49 | 16.06±1.28 | 17.96±0.82 | |
| High Dose | 10 | 21.87±1.01 | 20.29±0.72 | 18.01±0.81 | 18.70±0.72 | 20.26±0.62 | |
| Process Length (μm) | Control | 10 | 153±22.16 | 106.74±16.74 | 111.94±17.90 | 91.23±31.24 | 148.59±13.80 |
| Low Dose | 10 | 35.98±2.93 | 55.27±14.71 | 29.38±2.30 | 33.09±1.76 | 33.89±2.63 | |
| High Dose | 10 | 48.51±3.01 | 41.68±3.02 | 51.95±3.59 | 37.77±1.76 | 78.1±14.30 | |
| Process Nodes(Quantity) | Control | 10 | 3.82±0.33 | 2.6±0.37 | 2.9±0.29 | 2.4±0.16 | 2.5±0,22 |
| Low Dose | 10 | 1.30±0.15 | 1.5±0.17 | 1.1±0.10 | 1.1±0.10 | 1.6±0.22 | |
| High Dose | 10 | 2.10±0.28 | 1.5±0.31 | 4.8±0.18 | 1.9±0.23 | 1.7±0.15 | |
Figure 5. Caffeine induces morphological changes.
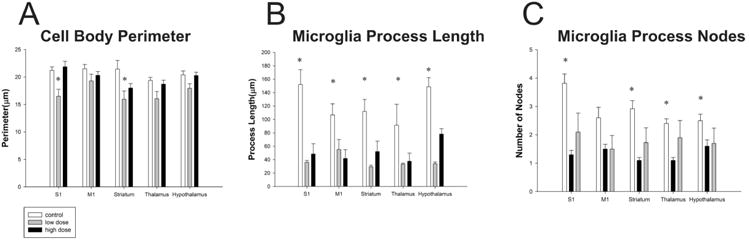
Following ingestion of caffeine microglia evidenced differences in their cell body (A), process lengths (B) and process branching patterns (C). Asterisks denote significant differences between groups (p<0.05). Plots represent population means and error bars indicate one standard error of the mean.
Finally we also compared microglia process nodes (Figure 5C): S1 (control = 3.82 ± 0.33; low dose = 1.30 ± 0.15; high dose = 2.10 ± 0.28; p < 0.05), M1 (control = 2.60 ± 0.37; low dose = 1.50 ± 0.17; high dose = 1.50 ± 0.31; p < 0.05), striatum (control = 2.90 ± 0.29; low dose = 1.10 ± 0.10; high dose = 4.18 ± 0.18; p < 0.05), thalamus (control = 2.40 ± 0.16; low dose = 1.10 ± 0.10; high dose = 1.90 ± 0.23; p < 0.05), hypothalamus (control = 2.50 ± 0.22; low dose = 1.60 ± 0.22; high dose = 1.70 ± 0.15; p < 0.05), Post-hoc analysis revealed that within regions S1, M1 and hypothalamus, the control group had more nodes than both the low dose group and high dose group. The low and high dose groups did not differ within these regions. Within the thalamus, the control group had more nodes than the low dose group, but not from the high dose group. The high dose group also had more nodes than the low dose group. Interestingly, within the striatum, the high dose group had more nodes than the control and low dose group. The control also had more nodes than the low dose group. However, for the majority of brain regions explored, both the low dose and high dose groups had shorter processes and fewer branches as compared to control, which is indicative of activated microglia (Morrison and Filosa, 2013).
4. Discussion
In the present report, we observed that caffeine impacted microglia density and morphology. Specifically, it was observed that caffeine induced retraction of microglia processes and enlargement of their somata which is indicative of activated microglia (Graeber and Streit 2010). The results of our experiment show that chronic caffeine ingestion impacts microglia density as well as their three dimensional structure, with microglia exposed to caffeine having shorter and less elaborate processes and larger somata. Interestingly, the impact of caffeine on microglia cell bodies varied as a function of brain region, in S1 and striatum the low does group had the smaller cell bodies then when exposed to the high dose of caffeine. These results suggest that the impact of caffeine may vary as a function of brain region. Never the less our results suggest that caffeine impacts microglia and transitions them from a surveillant to what is likely an activated state.
It is important to note that we found that both the low and high dose caffeine ingestion resulted in similar outcomes. The high dose caffeine concentration was 1.0g caffeine/L of tap water, and low dose caffeine concentration was 0.3g caffeine/L of tap water. However, caffeine by itself produces a bitter taste causing animals to decrease their drinking behavior. Hence, the high dose caffeine group consumed a lower volume of caffeine mixture than the low dose caffeine group. Despite the differences in volume consumed, the high dose group ingested more caffeine. Therefore, we speculate that moderate amount of caffeine ingestion impact microglia distribution and their morphological structures throughout the central nervous system. While activated microglia is often associated with proliferation, activation does not necessitate proliferation. An excitotoxin, such as kainic acid, causes activation, but not proliferation (Rogove et al., 2002). Similar results were found with the administration of lipopolysaccharides (LPS), where LPS caused rapid microglia response, but not increased proliferation (Chen et al., 2012). This result was also observed after the administration of the antiviral drug ganciclover (Ding et al., 2014).
Recently, there has been more interest in caffeine and how it affects the progression of neurodegenerative disease. Experimental data has suggested that A2a receptors play an important role in Parkinson's disease and brain ischemia. Consumption of caffeine is correlated with lower incidence of Parkinson's disease and may be beneficial in reducing symptoms of Parkinson's Therefore, caffeine, and potentially other A2a receptor antagonists, could be used as a therapeutic agent in the treatment of Parkinson's disease (Gyoneva, Orr & Traynelis, 2009). In fact, moderate intake of caffeine (200-300 mg/day) is associated with lowest risk of Parkinson's disease (Ascherio et al., 2001). Similarly, people who consumed between 100 – 300 mg/day of caffeine were less likely to develop Alzheimer's disease than those who drank less than 100 mg/day (Maia and de Mendonca, 2002).
While, recent research has mostly examined the role of caffeine in response to stroke or disease, this study focused on the effect of caffeine ingestion on healthy brains. There may be a fundamental difference between the immune response in healthy individuals versus those individuals with a neurological disorder. Indeed, the role of microglia is not limited to being reactive to injury, but also is also necessary to protect and maintain the health of the CNS outside of trauma. We believe it important to better understand how microglia functions in the healthy brain, and how that function may be altered through the influence of psychoactive drugs, such as caffeine. A caveat to this study is that we did not know the concentration of caffeine in the brain itself. Recent research has also revealed two phenotypic subtypes of microglia: classical, or M1, and alternative, or M2. These subtypes of microglia express different antigenic markers during activation (Crain et al., 2013). Future studies may reveal if caffeine has a higher affinity for one subtype over the other or influenced the relative numbers of one phenotype versus the other. It is known that caffeine crosses the blood brain barrier (McCall et al., 1982, Oldendorf, 1974) and affects brain function and behavior (reviewed by Fredholm et al., 1999). In this respect, we believe caffeine was able to directly impact microglia activation in our study. Based on the present study, caffeine has an effect on microglia function in the healthy brain and provides a basis for future studies.
Highlights.
Caffeine impacts microglia in both cortical and subcortical regions.
Caffeine led to lower microglia densities throughout the brain.
Caffeine transitions microglia into what appears to be an active state.
Acknowledgments
We thank the members of the Brumberg lab for assistance and helpful discussion. Support provided by PSC-CUNY and NS058758 to J.C.B and a DSRG award to R.S.
Abbreviations
- 3D
three-dimensional
- ANOVA
analysis of variance
- DAB
3,3′-Diaminobenzidine
- IBA-1
ionized calcium-binding adapter molecule 1
- M1
primary motor cortex
- NA
numericalaperture
- P
postnatal day
- PBS
phosphate buffered saline
- S1
primary somatosensory cortex
Footnotes
Publisher's Disclaimer: This is a PDF file of an unedited manuscript that has been accepted for publication. As a service to our customers we are providing this early version of the manuscript. The manuscript will undergo copyediting, typesetting, and review of the resulting proof before it is published in its final citable form. Please note that during the production process errors may be discovered which could affect the content, and all legal disclaimers that apply to the journal pertain.
References
- Ascherio A, Zhang SM, Hernán MA, Kawachi I, Colditz GA, Speizer FE, Willett WC. Prospective study of caffeine consumption and risk of Parkinson's disease in men and women. Ann Neurol. 2001;50(1):56–63. doi: 10.1002/ana.1052. [DOI] [PubMed] [Google Scholar]
- Bialas A, Stevens B. TGF-β signaling regulates neuronal C1q expression and developmental synaptic refinement. Nature Neuroscience. 2013;16(12):1773–1782. doi: 10.1038/nn.3560. [DOI] [PMC free article] [PubMed] [Google Scholar] [Retracted]
- Brown GC, Neher JJ. Microglial phagocytosis of live neurons. Nat Rev Neurosci. 2014;15(4):209–216. doi: 10.1038/nrn3710. [DOI] [PubMed] [Google Scholar]
- Brothers HM, Marchalant Y, Wenk GL. Caffeine attenuates lipopolysaccharide-induced neuroinflammation. Neurosci Lett. 2010;480(2):97–100. doi: 10.1016/j.neulet.2010.06.013. [DOI] [PMC free article] [PubMed] [Google Scholar]
- Chen Z, Jalabi W, Shpargel KB, Farabaugh KT, Dutta R, Yin X, Kidd GJ, Bergmann CC, Stohlman SA, Trapp BD. Lipopolysaccharide-induced microglial activation and neuroprotection against experimental brain injury is independent of hematogenous TLR4. J Neurosci. 2012;32(34):11706–11715. doi: 10.1523/JNEUROSCI.0730-12.2012. [DOI] [PMC free article] [PubMed] [Google Scholar]
- Crain JM, Nikodemova M, Watters JJ. Microglia express distinct M1 and M2 phenotypic markers in the postnatal and adult central nervous system in male and female mice. J Neurosci Res. 2013;91(9):1143–1151. doi: 10.1002/jnr.23242. [DOI] [PMC free article] [PubMed] [Google Scholar]
- Cunha RA. Neuroprotection by adenosine in the brain: From A1 receptor activation to A2A receptor blockade. Purinergic Signalling. 2005;1(2):111–134. doi: 10.1007/s11302-005-0649-1. [DOI] [PMC free article] [PubMed] [Google Scholar]
- Daly JW, Fredholm BB. Caffeine--an atypical drug of dependence. Drug Alcohol Depend. 1998;51(1-2):199–206. doi: 10.1016/s0376-8716(98)00077-5. [DOI] [PubMed] [Google Scholar]
- Ding Z, Mathur V, Ho PP, James ML, Lucin KM, Hoehne A, Wyss-Coray T. Antiviral drug ganciclovir is a potent inhibitor of microglial proliferation and neuroinflammation. J Exp Med. 2014;211(2):189–198. doi: 10.1084/jem.20120696. [DOI] [PMC free article] [PubMed] [Google Scholar]
- Fisone G, Borgkvist A, Usiello A. Caffeine as a psychomotor stimulant: mechanism of action. Cellular and Molecular Life Sciences CMLS. 2004;61(7-8):857–872. doi: 10.1007/s00018-003-3269-3. [DOI] [PMC free article] [PubMed] [Google Scholar]
- Fredholm BB, Bättig K, Holmén J, Nehlig A, Zvartau EE. Actions of Caffeine in the Brain with Special Reference to Factors That Contribute to Its Widespread Use. Pharmacol Rev. 1999;51(1):83–133. [PubMed] [Google Scholar]
- Garrett BE, Griffiths RR. The Role of Dopamine in the Behavioral Effects of Caffeine in Animals and Humans. Pharmacology Biochemistry and Behavior. 1997;57(3):533–541. doi: 10.1016/s0091-3057(96)00435-2. [DOI] [PubMed] [Google Scholar]
- Gebicke-Haerter PJ, Van Calker D, Norenberg W, Illes P. Molecular mechanisms of microglial activation. A. Implications for regeneration and neurodegenerative diseases. Neurochem Int. 1996;29(1):1–12. [PubMed] [Google Scholar]
- Gehrmann J, Matsumoto Y, Kreutzberg GW. Microglia: intrinsic immuneffector cell of the brain. Brain Res Brain Res Rev. 1995;20(3):269–287. doi: 10.1016/0165-0173(94)00015-h. [DOI] [PubMed] [Google Scholar]
- Graeber MB, Streit WJ. Microglia: biology and pathology. [Review] Acta Neuropathol. 2010;119(1):89–105. doi: 10.1007/s00401-009-0622-0. [DOI] [PubMed] [Google Scholar]
- Gyoneva S, Orr AG, Traynelis SF. Differential regulation of microglial motility by ATP/ADP and adenosine. Parkinsonism Relat Disord. 2009;15(Suppl 3):S195–199. doi: 10.1016/S1353-8020(09)70813-2. [DOI] [PMC free article] [PubMed] [Google Scholar]
- Julien RM, Advokat CD, Comaty JE. A Primer of Drug Action. Twelfth New York, NY: Worth Publishers; 2010. [Google Scholar]
- Kang CH, Jayasooriya RG, Dilshara MG, Choi YH, Jeong YK, Kim ND, Kim GY. Caffeine suppresses lipopolysaccharide-stimulated BV2 microglial cells by suppressing Akt-mediated NF-kappaB activation and ERK phosphorylation. Food Chem Toxicol. 2012;50(12):4270–4276. doi: 10.1016/j.fct.2012.08.041. [DOI] [PubMed] [Google Scholar]
- Khairnar A, Plumitallo A, Frau L, Schintu N, Morelli M. Caffeine enhances astroglia and microglia reactivity induced by 3,4-methylenedioxymethamphetamine (‘ecstasy’) in mouse brain. Neurotox Res. 2010;17(4):435–439. doi: 10.1007/s12640-009-9125-y. [DOI] [PubMed] [Google Scholar]
- Klonoff-Cohen H, Chu E, Natarajan L, Sieber W. A prospective study of stress among women undergoing in vitro fertilization or gamete intrafallopian transfer. Fertil Steril. 2001;76(4):675–687. doi: 10.1016/s0015-0282(01)02008-8. [DOI] [PubMed] [Google Scholar]
- Ledent C, Vaugeois JM, Schiffmann SN, Pedrazzini T, Yacoubi ME, Vanderhaeghen JJ, Parmentier M. Aggressiveness, hypoalgesia and high blood pressure in mice lacking the adenosine A2a receptor. Nature. 1997;388(6643):674–678. doi: 10.1038/41771. [DOI] [PubMed] [Google Scholar]
- Lee KW, Im JY, Woo JM, Grosso H, Kim YS, Cristovao A, et al. Mouradian MM. Neuroprotective and Anti-inflammatory Properties of a Coffee Component in the MPTP Model of Parkinson's Disease. Neurotherapeutics. 2013;10(1):143–153. doi: 10.1007/s13311-012-0165-2. [DOI] [PMC free article] [PubMed] [Google Scholar]
- Li W, Dai S, An J, Li P, Chen X, Xiong R, et al. Zhou Y. Chronic but not acute treatment with caffeine attenuates traumatic brain injury in the mouse cortical impact model. Neuroscience. 2008;151(4):1198–1207. doi: 10.1016/j.neuroscience.2007.11.020. [DOI] [PubMed] [Google Scholar]
- Ling EA, Wong WC. The origin and nature of ramified and amoeboid microglia: a historical review and current concepts. [Review] Glia. 1993;7(1):9–18. doi: 10.1002/glia.440070105. [DOI] [PubMed] [Google Scholar]
- Luongo L, Guida F, Imperatore R, Napolitano F, Gatta L, Cristino L, Maione S. The A1 adenosine receptor as a new player in microglia physiology. Glia. 2014;62(1):122–132. doi: 10.1002/glia.22592. [DOI] [PubMed] [Google Scholar]
- Maia L, De Mendonça A. Does caffeine intake protect from Alzheimer's disease? European Journal of Neurology. 2002;9(4):377–382. doi: 10.1046/j.1468-1331.2002.00421.x. [DOI] [PubMed] [Google Scholar]
- Morrison HW, Filosa JA. A quantitative spatiotemporal analysis of microglia morphology during ischemic stroke and reperfusion. Journal of Neuroinflammation. 2013;10(4):1742–2094. doi: 10.1186/1742-2094-10-4. [DOI] [PMC free article] [PubMed] [Google Scholar]
- McCall AL, Millington WR, Wurtman RJ. Blood-brain barrier transport of caffeine: dose-related restriction of adenine transport. Life Sci. 1982;31(24):2709–2715. doi: 10.1016/0024-3205(82)90715-9. [DOI] [PubMed] [Google Scholar]
- Oldendorf WH. Lipid Solubility and Drug Penetration of the Blood Brain Barrier. Experimental Biology and Medicine. 1974;147(3):813–816. doi: 10.3181/00379727-147-38444. [DOI] [PubMed] [Google Scholar]
- Orr AG, Orr AL, Li XJ, Gross RE, Traynelis SF. Adenosine A(2A) receptor mediates microglial process retraction. Nat Neurosci. 2009;12(7):872–878. doi: 10.1038/nn.2341. [DOI] [PMC free article] [PubMed] [Google Scholar]
- Palacios N, Gao X, McCullough ML, Schwarzschild MA, Shah R, Gapstur S, Ascherio A. Caffeine and risk of Parkinson's disease in a large cohort of men and women. Movement Disorders. 2012;27(10):1276–1282. doi: 10.1002/mds.25076. [DOI] [PMC free article] [PubMed] [Google Scholar]
- Rieg T, Schnermann J, Vallon V. Adenosine A1 receptors determine effects of caffeine on total fluid intake but not caffeine appetite. Eur J Pharmacol. 2007;555(2–3):174–177. doi: 10.1016/j.ejphar.2006.10.039. [DOI] [PubMed] [Google Scholar]
- Rogove D, Lu W, Tsirka SE. Microglial activation and recruitment, but not proliferation, suffice to mediate neurodegeneration. Cell Death Differ. 2002;9(8):801–806. doi: 10.1038/sj.cdd.4401041. [DOI] [PubMed] [Google Scholar]
- Ruiz-Medina J, Pinto-Xavier A, Rodriguez-Arias M, Minarro J, Valverde O. Influence of chronic caffeine on MDMA-induced behavioral and neuroinflammatory response in mice. Psychopharmacology (Berl) 2013;226(2):433–444. doi: 10.1007/s00213-012-2918-3. [DOI] [PubMed] [Google Scholar]
- Schliep KC, Schisterman EF, Mumford SL, Pollack AZ, Zhang C, Ye A, et al. Wactawski-Wende J. Caffeinated beverage intake and reproductive hormones among premenopausal women in the BioCycle Study. Am J Clin Nutr. 2012;95(2):488–497. doi: 10.3945/ajcn.111.021287. [DOI] [PMC free article] [PubMed] [Google Scholar]
- Seevaratnam R, Hamadeh MJ, Raha S, Tarnopolsky MA. Caffeine Appears To Be Beneficial In Males-But Not Females-With Lou Gehrig's Disease; Poster sessison presented at the meeting of the American Psychological Association; New Orleans, La. 2009. Apr, [Google Scholar]
- Siskova Z, Tremblay ME. Microglia and synapse: interactions in health and neurodegeneration. Neural Plast. 2013;2013 doi: 10.1155/2013/425845. [DOI] [PMC free article] [PubMed] [Google Scholar]
- Smith A. Effects of caffeine on human behavior. Food and Chemical Toxicology. 2002;40(9):1243–1255. doi: 10.1016/s0278-6915(02)00096-0. [DOI] [PubMed] [Google Scholar]
- Tremblay M, Stevens B, et al. The Role of Microglia in the Healthy Brain. J Neuroscience. 2011;31(45):16064–9. doi: 10.1523/JNEUROSCI.4158-11.2011. [DOI] [PMC free article] [PubMed] [Google Scholar]
- Tsutsui S, Schnermann J, Noorbakhsh F, Henry S, Yong VW, Winston BW, et al. Power C. A1 adenosine receptor upregulation and activation attenuates neuroinflammation and demyelination in a model of multiple sclerosis. J Neurosci. 2004;24(6):1521–1529. doi: 10.1523/JNEUROSCI.4271-03.2004. [DOI] [PMC free article] [PubMed] [Google Scholar]
- Wardas J. Neuroprotective role of adenosine in the CNS. Polish journal of pharmacology. 2002;54(4):313–326. [PubMed] [Google Scholar]
- Wollmer MA, Lucius R, Wilms H, Held-Feindt J, Sievers J, Mentlein R. ATP and adenosine induce ramification of microglia in vitro. J Neuroimmunol. 2001;115(1–2):19–27. doi: 10.1016/s0165-5728(01)00257-0. [DOI] [PubMed] [Google Scholar]
- Yadav S, Gupta SP, Srivastava G, Srivastava PK, Singh MP. Role of secondary mediators in caffeine-mediated neuroprotection in maneb- and paraquat-induced Parkinson's disease phenotype in the mouse. Neurochem Res. 2012;37(4):875–884. doi: 10.1007/s11064-011-0682-0. [DOI] [PubMed] [Google Scholar]