Abstract
A “shotgun” tandem mass spectrometry (MS) approach involving the use of multiple lipid-class-specific precursor ion and neutral loss scan mode experiments has been employed to identify and characterize the glycerophosphatidylethanolamine (GPEtn) lipids that were present within a crude lipid extract of a normal rat retina, obtained with minimal sample handling prior to analysis. Characterization of these lipids was performed by complementary analysis of their protonated and deprotonated precursor ions, as well as their various ionic adducts (e.g., Na+, Cl−), using a triple-quadrupole mass spectrometer. Notably, the application of novel precursor ion and neutral loss scans of m/z 164 and m/z 43, respectively, for the specific identification of sodiated GPEtn precursor ions following the addition of 500 μM NaCl to the crude lipid extracts was demonstrated. The use of these novel MS/MS scans in parallel provided simplified MS/MS spectra and enhanced the detection of 1-alkenyl, 2-acyl (plasmenyl) GPEtn lipids relative to the positive ion mode neutral loss m/z 141 commonly used for GPEtn analysis. Furthermore, the novel use of a “low energy” neutral loss scan mode experiment to monitor for the exclusive loss of 36m/z (HCl) from [M+Cl]-GPEtn adducts was demonstrated to provide a more than 25-fold enhancement for the detection of GPEtn lipids in negative ion mode analysis. Subsequent “high-energy” pseudo MS3 product ion scans on the precursor ions identified from this experiment were then employed to rapidly characterize the fatty acyl chain substituents of the GPEtn lipids.
Keywords: Retina, Lipidomics, Glycerophosphatidylethanolamine, Electrospray ionization, Tandem mass spectrometry
Introduction
The identification of biomarkers that enable the early detection and prognosis of disease, or that facilitate measurement of the efficacy of response to a specific therapeutic intervention, hold great promise in advancing the capabilities of individualized medicine [1–3]. Recent technological advances in mass spectrometry (MS) have enabled large-scale biomarker discovery efforts to be initiated, including in the field of lipidomics [3, 4], without prior requirement for detailed insights into the mechanisms responsible for the disease. In recent years, electrospray ionization (ESI) and matrix assisted laser desorption/ionization techniques coupled with high-resolution MS analysis have emerged as a valuable tool to rapidly identify differences between the abundances of individual lipid precursor ions within complex lipid mixtures extracted from limited quantities of sample tissue in different physiological or disease states [4–6]. However, the resolution and mass accuracy obtainable from many MS platforms precludes the unambiguous identification or characterization of individual lipid species with the same nominal masses, on the basis of their masses alone. Furthermore, numerous lipid species have isobaric masses that can all be present at a given m/z value, thereby limiting the general utility of this approach. Finally, the presence of many classes of low-abundance lipid species, such as ceramides, cholesteryl esters, monoacylglycerols, diacylglycerols, and triacylglycerols, that may often be present at or below the level of chemical noise in the mass spectra can generally not be determined by MS measurements alone. Thus, tandem MS (MS/MS) methods are typically required for the unambiguous identification and quantitative analysis of the individual species that may be present within a complex unfractionated lipid mixture [7–10].
Extensive previous studies have demonstrated that the collision-induced-dissociation (CID) MS/MS of lipid precursor ions results in the observation of characteristic product ions formed via cleavage of either the lipid head group or the fatty acyl chains esterified to the glycerol backbone, from which information regarding the identity and structure of the lipid may be elucidated [11]. The results of these studies have facilitated the development of “shotgun” lipidomics approaches employing selective precursor ion and neutral loss scan mode MS/MS methods for rapid and sensitive monitoring of the molecular compositions and abundances of individual lipid species in complex lipid extracts, with a significantly reduced requirement for extensive sample preparation or fractionation (e.g., high-performance liquid chromatography) prior to analysis [8, 9, 12–14]. Additionally, the introduction of automated nano-ESI ion sources has improved the sensitivity, dynamic range, and throughput of shotgun lipid analyses, enabling the acquisition of a large number of precursor ion or neutral loss CID-MS/MS scans from minute amounts of cells or tissue [15]. However, the formation and abundance of the characteristic product ions that are required for these precursor ion and neutral loss scan mode MS/MS experiments are known to be highly dependent on the structure of the lipid, the polarity of the precursor ion (positive versus negative), and the nature of the ionizing charge (e.g.,+H+, +Na+,+Li+, -H−,+Cl−,+CH3OCO2 −), as well as the instrumentation and collisional activation conditions that are employed [11, 16]. Multiple ionic forms of individual lipids within a given lipid class are commonly observed under typical sample preparation and analysis conditions, potentially adding significant complexity to the mixture (i.e., the same lipid is observed at several m/z values). However, the different product ions formed upon fragmentation of these various precursor ions may allow the development of more selective or sensitive precursor ion and neutral loss scan mode MS/MS methods for use in comprehensive lipid-class-specific identification and quantification.
Materials and methods
Materials
All solvents used were of high performance liquid chromatography grade. Methanol, water, and NaCl were purchased from J.T. Baker (Phillipsburg, NJ, USA). NH4OH, HCl, and chloroform were from EMD Chemicals (Gibbstown, NJ, USA). 2-Propanol was from Fisher Scientific (Pittsburgh, PA, USA). Lipid standards were obtained from Avanti Polar Lipids (Alabaster, AL, USA).
Animals
All procedures for the use and care of animals for laboratory research were approved by the All University Committee for Animal Use and Care at Michigan State University. Male Wistar rats were maintained on Harlan-Teklad laboratory chow (no. 8640) and water ad libitum. At 12 weeks of age, rats were killed under anesthesia (isoflurane/Vapomatic). For the determination of lipid profiles from total retina, eyes were enucleated and rinsed three times in ice-cold phosphate-buffered saline, opened by a circumferential incision just below the ora serrata, and the anterior segment and vitreous were discarded. With the aid of a dissecting microscope, the retina was gently lifted off the eyecup using an eye spatula, weighed, placed in a precleaned glass vial, and snap-frozen in liquid nitrogen.
Retina tissue lipid extraction
Lipids were extracted using a modified method of Folch et al. [17]. Whole retinas (approximately 12 mg tissue) were placed in an ice-chilled Teflon/glass tissue grinder and homogenized on ice in 50 μL/mg tissue of 40% methanol in water. Retina homogenates were then extracted by vortexing for 1 min in 200 μL/mg tissue of chloroform–methanol (2:1 v/v). After centrifugation at 3000 g for 10 min, the lower organic phase was recovered and transferred to a new glass tube. The aqueous upper phase was then reextracted by vortexing for 1 min in 200 μL/mg tissue of chloroform and centrifuged as before. The lower organic phase was then collected and combined with the lower phase from the first extraction. The pooled organic phases were then evaporated under nitrogen and further dried in a SpeedVac overnight. Dried lipid extracts were resuspended in 50 μL/mg tissue of 2-propanol–methanol–chloroform (4:2:1 v/v/v) and stored under nitrogen in glass vials in the dark at −80 °C until further use. For some experiments, 0.2 N HCl was added to the aqueous extraction phase to induce hydrolysis of retinal plasmenyl lipids, while the remaining retina from the same animal was extracted under nonacidified conditions.
Mass spectrometry analysis of crude retina lipid extracts
Immediately prior to analysis, aliquots of crude retina lipid extracts were further diluted 1:20 in 2-propanol–methanol–chloroform (4:2:1 v/v/v) containing 20 mM NH4OH. For some experiments, 0.5 mM NaCl was also added to the samples. Synthetic glycerophosphatidylethanolamine (GPEtn) lipid standards were diluted in 2-propanol–methanol–chloroform (4:2:1 v/v/v) containing 20 mM NH4OH to a final concentration of 2 μM. All samples were centrifuged, then loaded into Whatman Multichem 96-well plates (Fisher Scientific, Pittsburgh, PA, USA) and sealed with Teflon ultrathin sealing tape (Analytical Sales and Services, Pompton Plains, NJ, USA). Lipid extracts were introduced into a triple-quadrupole mass spectrometer (TSQ Quantum Ultra, Thermo Scientific, San Jose, CA, USA) via a chip-based nano-ESI source (Advion NanoMate, Ithaca, NY, USA) operating in infusion mode. Chipsoft version 7.1 (Advion, Ithaca, NY, USA) was used to set the NanoMate spray voltage to 1.4 kV, the gas pressure to 0.3 psi, and the postaspiration air gap of 2 μL. The ion transfer tube of the mass spectrometer was maintained at 150 °C. All MS and MS/MS spectra were acquired automatically for 2.5–10 min at a rate of 500 m/z per second by methods created using Xcalibur software (Thermo Scientific, San Jose, CA, USA). GPEtn lipids were identified by ESI-MS and by precursor ion, neutral loss, and product ion scan mode CID-MS/MS analysis of their [M+H]+, [M+Na]+, [M-H]−, or [M+Cl]-precursor ions. The Lipid Mass Spectrum Analysis version 1.0 [18] peak model fit algorithm was used in conjunction with a user-defined database of hypothetical lipid compounds for automated peak finding and correction for 13C isotope effects, to identify the individual GPEtn lipid species detected by each precursor ion and neutral loss scan mode MS/MS experiment. Identification of the fatty acid constituents of identified GPEtn lipids was achieved by CID-MS/MS product ion scans at the specific m/z values of the [M-H]− or [M+Cl]− precursor ions of identified GPEtn lipids observed in negative ion mode, or by negative ion mode precursor ion scan experiments to selectively monitor for specific deprotonated fatty acid anions. In MS mode, the quadrupole 1 isolation window was maintained at 0.5 Da. For neutral loss and precursor ion MS/MS scans, the isolation windows of both quadrupole 1 and quadrupole 3 were maintained at 0.5 Da. For product ion scan mode MS/MS experiments, quadrupole 1 and quadrupole 3 were operated with isolation windows of 1.0 Da. The quadrupole 2 collision gas pressure was set at 0.5 mtorr of argon. Collision energies were individually optimized for each neutral loss, precursor ion, or product ion scan mode MS/MS experiment of interest using commercially available lipid standards.
Results and discussion
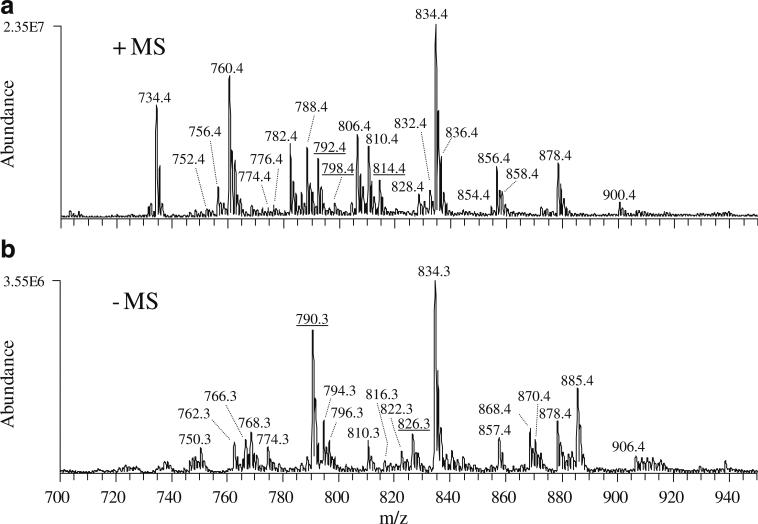
To obtain an initial “snapshot” of the global GPEtn lipid composition of a normal retina, a crude lipid extract isolated from a whole retina of a 12-week-old male Wistar rat was introduced into a triple-quadrupole mass spectrometer via infusion using a chip-based nano-ESI source, then it was subjected to MS analysis in both positive and negative ion modes. The mass spectra obtained from these experiments, corresponding to the region of m/z 700–950 containing the major glycerophospholipids, are shown in Fig. 1. The positive ion mode spectrum (Fig. 1, spectrum A) was dominated by glycerophosphatidylcholine (GPCho) lipid species, the most abundant of which contained the n3 polyunsaturated DHA22:6 fatty acid (i.e., GPCho(18:0/22:6), m/z 834.4). An unusual 44:12 GPCho species was also observed, containing DHA22:6n3 fatty acids at both the sn1 and the sn2 positions of the lipid glycerol backbone (GPCho(22:6/22:6), m/z 878.4). Other abundant molecular ions observed included very long chain fatty acid containing GPCho lipids (i.e., GPCho(22:6/32:6), m/z 1,018.6 and GPCho(22:6/34:6), m/z 1,046.7); data not shown. In negative ion mode (Fig. 1, spectrum B), the mass spectrum was dominated by glycerophosphatidylserine (GPSer), GPEtn, and glycerophosphatidylinositol (GPIns) molecular ions. Similar to what was observed in the positive ion mode analysis, the most abundant ions were found to contain DHA22:6n3 fatty acids, including GPSer(18:0/22:6) (m/z 834.3) and GPEtn(18:0/22:6) (m/z 790.3). Once again, lipids containing DHA22:6n3 fatty acids at both the sn1 and the sn2 positions of the lipid glycerol backbone were also observed (e.g., GPSer(22:6/22:6), m/z 878.4). Lipid species containing the n6 polyunsaturated 20:4 fatty acid, such as GPEtn(18:0/20:4) (m/z 768.3), GPIns(16:0/20:4) (m/z 857.4), and GPIns(18:0/20:4) (m/z 885.4), were also observed as abundant molecular ions. Analysis of lipid extracts from three separate rat retinas resulted in spectra essentially identical to those shown in Fig. 1, indicating that minimal biological variability was observed between these animals (data not shown). This was expected given that these samples were obtained from animals with identical genetic backgrounds that were maintained under essentially identical conditions.
Fig. 1.
A positive and B negative ion spectra (selected region from m/z 700 to m/z 950) obtained by electrospray ionization (ESI) triple quadrupole mass spectrometry (MS) analysis of a crude lipid extract from whole rat retina
CID-MS/MS of protonated ([M+H]+) GPEtn precursor ions is well known to give rise to a characteristic product ion corresponding to the neutral loss of phosphoethanolamine (141 m/z) [11], while the dissociation of sodiated ([M+Na]+) GPEtn precursor ions also gives rise to a phosphoethanolamine +Na+ product ion at m/z 164 [19]. Thus, to identify the m/z values (and relative abundances) at which GPEtn lipids are located, as well as to determine their specific ionic forms (e.g., protonated versus sodiated), a series of neutral loss and precursor ion scan mode MS/MS experiments can be performed. The use of multiple neutral loss and precursor ion scans to identify and characterize the individual components of a particular lipid class enables the compositions of overlapping ions present at a particular m/z value in either positive or negative ionization mode to be more fully elucidated, and allows the list of “spectral features” (i.e., the various ionic forms of a given lipid class that are observed in both ionization modes) to be significantly expanded.
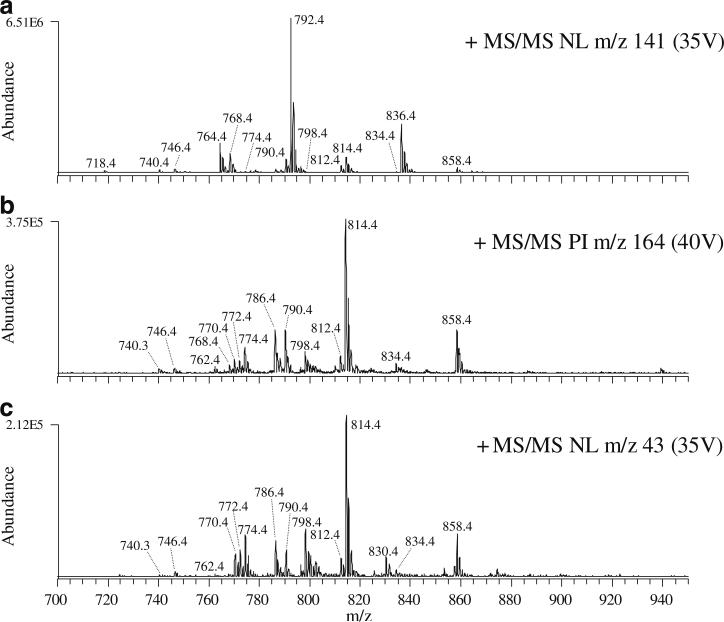
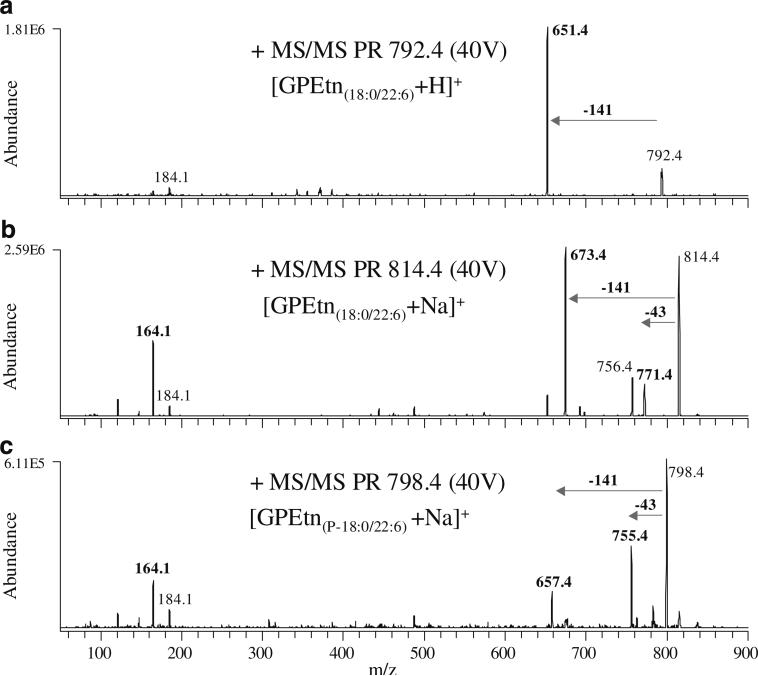
The mass spectrum obtained by the use of a neutral loss m/z 141 scan mode CID-MS/MS experiment in positive ion mode to monitor for the presence of GPEtn lipids via the characteristic loss of phosphoethanolamine from their protonated or sodiated precursor ions is shown in Fig. 2, spectrum A. The product ion spectrum obtained from the most abundant precursor ion identified in this scan (m/z 792.4, [GPEtn(18:0/22:6)+H]+) is shown in Fig. 3, spectrum A. For the spectra shown in Fig. 3, the identities of each lipid species were confirmed by comparison with authentic standards, as well as by correlation with the information provided from specific precursor ion scan mode MS/MS spectra in negative ion mode (e.g., precursor ion m/z 283 and precursor ion m/z 327 to monitor for lipids containing 18:0 and 22:6 fatty acyl chains, respectively). Note that sodium adducts of GPEtn lipids (e.g., the ion at m/z 814.4, 22 m/z higher in mass than the protonated GPEtn lipid precursor ion at m/z 792.4), which also give rise to the neutral loss of 141 m/z, can potentially overlap at the same m/z with longer-chain protonated GPEtn lipid ions or with ether-linked GPEtn lipid species, thereby precluding their unambiguous determination [20]. However, these ions can be readily distinguished via the use of a precursor ion m/z 164 MS/MS scan, to monitor for the characteristic phosphoethanolamine +Na+ product ion at m/z 164 (Fig. 2, spectrum B). The product ion spectrum obtained from the most abundant precursor ion identified from this scan (m/z 814.4, [GPEtn(18:0/22:6)+Na]+) is shown in Fig. 3, spectrum B, indicating the relative abundance of the characteristic m/z 164 product ion, the neutral loss of 141 m/z, and a low-abundance product ion resulting from the neutral loss of 43 m/z, corresponding to vinylamine [19] or aziridine [21]. Protonated precursor ions of ether-linked 1-alkenyl, 2-acyl (plasmenyl) GPEtn lipids are not observed in the neutral loss m/z 141 spectrum shown in Fig. 2, spectrum A, as these ions do not give rise to an abundant loss of 141 [22]. However, these GPEtn lipids are readily observed as sodium ion adducts [19]. The spectrum obtained by product ion scan mode CID-MS/MS of the precursor ion at m/z 798.4 shown in Fig. 1, spectrum A is shown in Fig. 3, spectrum C. Although the GPEtn-specific neutral loss of m/z 141 and the sodiated-GPEtn-specific product ion at m/z 164 are both observed in this spectrum, the most abundant product ion formed from this precursor ion corresponds to the neutral loss of 43 m/z, consistent with the presence of plasmenyl GPEtn lipids in rat retina [19]. Subsequent comparison of rat retina lipids from retinas of the same animal extracted in the presence or absence of 0.2 N HCl demonstrated that acidic extraction conditions led to the loss of ions corresponding to all putative ether-linked GPEtn species, with a corresponding appearance of lyso-GPEtn species, consistent with the presence of acid-labile plasmalogen species [23] (data not shown). The identity of the precursor ion at m/z 798.4 was therefore established as a plasmenyl lipid (GPEtn(P-18:0/22:6)+Na+).
Fig. 2.
Identification of glycerophosphatidylethanolamine (GPEtn) lipids from a crude lipid extract of whole rat retina by positive ion ESI and neutral loss (NL) or precursor ion (PI) scan mode collision induced dissociation (CID) tandem MS (MS/MS). A NL m/z 141 scan mode analysis to identify [M+H]+ or [M+Na]+ PIs, B PI m/z 164 scan mode analysis to selectively identify [M+Na]+ PIs, and C NL m/z 43 scan mode analysis to selectively identify [M+Na]+ PIs
Fig. 3.
Product ion (PR) scan mode CID-MS/MS of selected GPEtn lipid PIs from Fig. 1, spectrum A and Fig. 2. A m/z 792.4 (GPEtn(18:0/22:6)+H+), B m/z 814.4 (GPEtn(18:0/22:6)+Na+), and C m/z 798.4 (GPEtn(P-18:0/22:6)+Na+)
Thus, plasmenyl GPEtn+Na+ lipid precursor ions may be readily distinguished from diacyl-linked GPEtn+Na+ precursor ions by comparing the abundances of the ions formed by the use of a neutral loss m/z 43 scan (Fig. 2, spectrum C) with the abundances of those ions formed by the use of a precursor ion m/z 164 scan (Fig. 2, spectrum B). For example, an approximately twofold increase in the relative abundance of the GPEtn(P-18:0/22:6) +Na+ m/z 798.4 ion is observed in Fig. 2, spectrum C compared with that in Fig. 2, spectrum B, owing to the suppression of diacyl species in the neutral loss m/z 43 spectrum. Clearly, as only sodiated adducts of GPEtn lipids (both diacyl and plasmenyl) are observed upon the use of precursor ion m/z 164 and neutral loss m/z 43 scans, albeit at a somewhat lower level of sensitivity compared with the use of a conventional neutral loss m/z 141 scan where both protonated and sodiated adducts are identified, the resultant spectra are greatly simplified, and enable the facile identification of plasmenyl GPEtn species. Moreover, comparison of the spectra obtained from the neutral loss m/z 43 scan with the spectra obtained from the neutral loss m/z 141 scan should enable the rapid identification of low-abundance plasmenyl species (after taking into account the mass differences of the [M+H]+ and [M+Na]+ precursor ions), as these GPEtn lipids are virtually absent from the neutral loss m/z 141 spectrum. Another advantage of the neutral loss m/z 43 scan is the ability to simultaneously detect all plasmenyl GPEtn species for rapid and facile quantitation against an internal standard. As the neutral loss m/z 43 experiment does not provide structural specificity at the sn1 and sn2 positions of the lipid glycerol backbone, characterization of plasmenyl GPEtn species could be achieved through the initial use of a positive ion mode neutral loss m/z 43 scan to detect or quantify plasmenyl [M+Na]+ ions, followed by data-dependent product ion scan mode MS/MS analysis of the corresponding [M+H]+ precursor ions to unambiguously identify the alkenyl and acyl substituents, as previously described [22]. Although the characteristic product ion observed at m/z 164 and the neutral loss of 43 m/z have both been previously reported to occur upon CID-MS/MS of GPEtn [M+Na]+ precursor ions [19], an exploration of their utility as precursor ion m/z 164 and neutral loss m/z 43 MS/MS scans has not been previously reported. The neutral loss of 43 m/z has also been reported to occur upon CID-MS/MS of [GPEtn+Li]+ precursor ions [24]. In the present study, no Li+ was added to the retina lipid extract, such that the neutral loss m/z 43 scan was used exclusively to detect the presence of sodiated GPEtn lipid species.
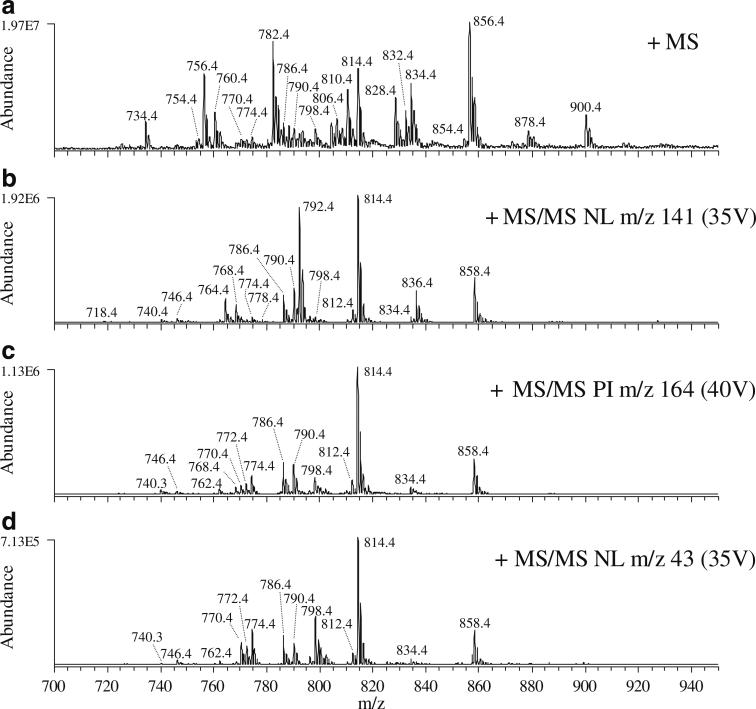
As it is difficult to remove 100% of endogenous salts from any biological sample, as well as small amounts of contaminating salts that may be present in organic solutions, differential amounts of low-level salts across samples could lead to variability in the relative quantification of GPEtn lipids using the precursor ion and neutral loss sodiated adduct scans described above. Thus, the addition of exogenous sodium to the samples would serve to minimize cross-sample differences and simultaneously enhance the detection sensitivity. The results obtained by MS and precursor ion and neutral loss scan mode CID-MS/MS analysis of the same crude retina lipid extract shown in Figs. 1 and 2, following the addition of 0.5 mM NaCl to the sample prior to analysis, are shown in Fig. 4. Addition of NaCl concentrations ranging from 0.05 to 0.5 mM were evaluated and were found not to adversely affect the spray stability, and resulted in only a minor decrease in the absolute sensitivity upon MS analysis (compare Fig. 4, spectrum A and Fig. 1, spectrum A). Extensive evaluation of the selectivity dependence on pH was not evaluated in this study.
Fig. 4.
Identification of GPEtn lipids from a crude lipid extract of whole rat retina containing 0.5 mM NaCl, by positive ion ESI and NL or PI scan mode CID-MS/MS. A positive ion mode mass spectrum, B NL m/z 141 scan mode analysis to identify [M+H]+ or [M+Na]+ PIs, C PI m/z 164 scan mode analysis to selectively identify [M+Na]+ PIs, and D NL m/z 43 scan mode analysis to selectively identify [M+Na]+ PIs
Analysis of the sodiated GPEtn ions in this sample using the conventional neutral loss m/z 141 MS/MS scan (Fig. 4, spectrum B) or the alternative precursor ion m/z 164 or neutral loss m/z 43 MS/MS scans (Fig. 4, spectra C and D, respectively) resulted in an approximately threefold increase in detection sensitivity, while the sensitivity for detection of the protonated GPEtn precursor ions in Fig. 4, spectrum A was found to decrease by approximately threefold.
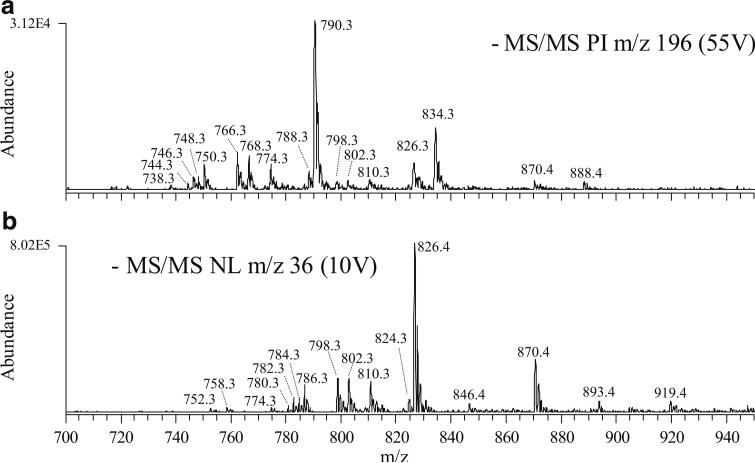
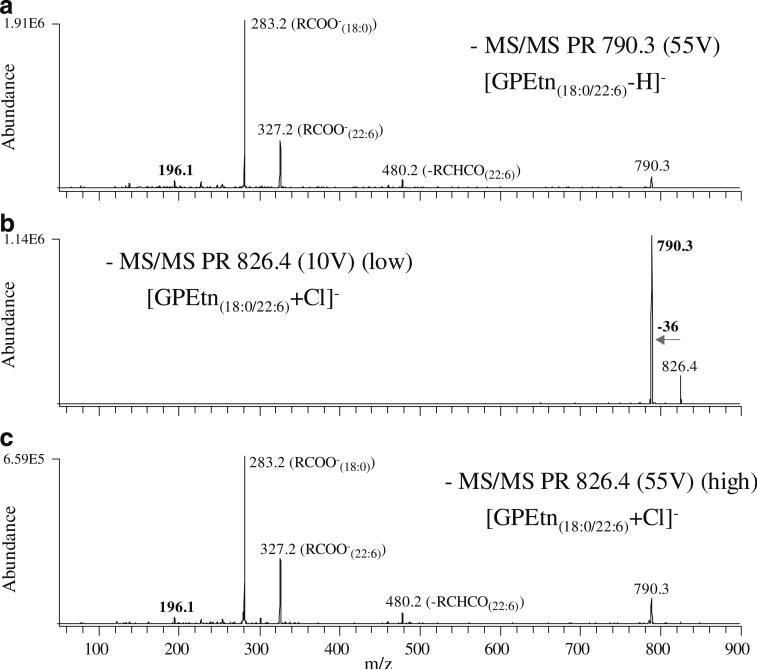
The detection of GPEtn lipids in negative ion mode is typically achieved by using a precursor ion m/z 196 scan to monitor for formation of a characteristic glycerol phosphoethanolamine product ion at m/z 196 from their deprotonated precursor ions (Fig. 5, spectrum A) [12]. However, product ions indicative of the fatty acyl chains are generally observed as the dominant products, while the m/z 196 GPEtn head group specific product ion is observed only at very low abundance (Fig. 6, spectrum A), thereby generally limiting the use of this negative ion mode scan for detecting GPEtn lipids. It is well known, however, that the negative ion mode dissociation of selected anionic ([M+X]−) adducts of GPCho precursor ions (where X is Cl−, HCO2 −, or CH3CO2 −) initially results in the formation of a characteristic product corresponding to the loss of CH3X from the choline head group, followed by the formation of characteristic anions specific to the fatty acyl chains upon further dissociation at higher collision energies (or upon MS3 in a quadrupole ion trap mass spectrometer) [25]. These sequential fragmentation reactions are particularly attractive to enable the identity of both the lipid class and the fatty acyl chain substituents to be determined in a single ionization mode of analysis. However, it has also been reported recently that the characteristic product ions formed by dissociation of other anionic adducts of GPCho (e.g., [M+CH3OCO2]−) are strongly influenced by the identity of the anion [16].
Fig. 5.
Identification of GPEtn lipids from a crude lipid extract of whole rat retina by negative ion ESI and PI or NL scan mode CID-MS/MS. A PI m/z 196 scan mode analysis to selectively identify [M-H]− PIs and B NL m/z 36 scan mode MS/MS analysis to selectively identify [M+Cl]− PIs
Fig. 6.
PR scan mode CID-MS/MS of selected GPEtn lipid PIs from Fig. 1, spectrum B and Fig. 5. A m/z 790.3 (GPEtn(18:0/22:6)-H−), B m/z 826.4 (GPEtn(18:0/22:6)+Cl−) (“low” collision energy), and C m/z 826.4 (GPEtn(18:0/22:6)+Cl−) (“high” collision energy)
Here, we have observed that GPEtn lipids also form abundant stable anionic chloride adducts ([M+Cl]−), and that the dissociation of these adducts under low-energy CID conditions results in the exclusive loss of HCl (36 m/z) (Fig. 6, spectrum B), thereby enabling the use of a neutral loss m/z 36 scan for sensitive GPEtn lipid identification in negative ion mode (Fig. 5, spectrum B), followed by a product ion scan at higher quadrupole 2 acceleration potential (Fig. 6, spectrum C) or precursor ion scans for specific fatty acyl chains for complete characterization of the identified GPEtn lipids in a single (i.e., negative) ionization mode. Notably, a more than 25-fold increase in sensitivity was associated with the neutral loss m/z 36 scan spectrum in Fig. 6, spectrum B compared with the conventional precursor ion m/z 196 scan spectrum in Fig. 6, spectrum A under the analytical conditions employed. Although the same number of scans was averaged to produce the spectra shown in Fig. 6, spectra A and B, the improved sensitivity associated with the neutral loss m/z 36 scan allows the use of significantly shorter data acquisition times (less signal averaging) for the detection of GPEtn lipids in negative ion mode analysis. Similar to that discussed above for the neutral loss m/z 141 scan in positive ion mode, where both protonated and sodiated GPEtn lipids are identified, the use of precursor ion m/z 196 in negative ion mode identifies both deprotonated species and [M+Cl]− adducts, thereby complicating analysis of the resultant spectra. However, as with the sodiated-GPEtn-specific precursor ion m/z 164 or neutral loss m/z 43 scans in positive ion mode, the use of neutral loss m/z 36 for GPEtn chloride adducts in negative ion mode results in greatly simplified spectra for GPEtn lipid analysis.
Neutral losses of 36 m/z due to the loss of HCl have also been previously reported to occur from low-abundance cerebroside species under collisional activation conditions [26]. However, these experiments were conducted at considerably higher collision energies and CID gas pressures than those employed here. Thus, potential interferences in the detection of GPEtn lipids, due to the codetection of cerebrosides, were not observed in the low-energy neutral loss m/z 36 scan employed here. However, this possibility should be considered when other tissues are investigated. Under the conditions employed in this study, chloride adducts of GPCho and sphingomyelin were readily detected (data not shown), while anionic chloride adducts were not observed for other classes of glycerophospholipids during the analysis of rat retina lipid extracts or synthetic lipid standards.
Complementary analyses to identify each of the GPEtn precursor ions in their various ionic forms (e.g., +H+, +Na+, -H−, and +Cl−) present within the crude retina lipid extract, using the various positive and negative ion scan modes outlined above, resulted in the identification of 88 GPEtn “spectral features” (i.e., GPEtn molecular ions), comprising 26 distinct molecular GPEtn lipid species (15 diacyl GPEtn and 11 plasmenyl GPEtn) (Table S1). With the exception of two plasmenyl GPEtn lipid species, all of the lipids were observed in negative ion mode by analysis of either their deprotonated or their chloride adduct precursor ions. In comparison with the positive ion mode GPEtn lipid analysis, the negative ion analysis strategy described here is a viable, and potentially simpler, alternative for use in future large-scale lipidome analysis efforts.
Supplementary Material
Biography
 Gavin Reid has been an Assistant Professor in the Department of Chemistry and the Department of Biochemistry and Molecular Biology at Michigan State University since 2004. He received a National Science Foundation CAREER Award in 2006 and an American Society for Mass Spectrometry Research Award in 2007. His research interests include fundamental and applied studies toward the development of improved mass spectrometry methods for proteome and lipidome analysis.
Footnotes
Electronic supplementary material The online version of this article (doi:10.1007/s00216-009-2717-9) contains supplementary material, which is available to authorized users.
Contributor Information
Todd A. Lydic, Department of Physiology, Michigan State University, East Lansing, MI 48824, USA
Julia V. Busik, Department of Physiology, Michigan State University, East Lansing, MI 48824, USA
Walter J. Esselman, Department of Microbiology and Molecular Genetics, Michigan State University, East Lansing, MI 48824, USA
Gavin E. Reid, Department of Chemistry, Michigan State University, East Lansing, MI 48824, USA Department of Biochemistry and Molecular Biology, Michigan State University, 229 Chemistry Building, East Lansing, MI 48824, USA.
References
- 1.LaBaer J. J Proteome Res. 2005;4:1053–1059. doi: 10.1021/pr0501259. [DOI] [PubMed] [Google Scholar]
- 2.Semmes OJ, Malik G, Ward M. J Cell Biochem. 2006;98:496–503. doi: 10.1002/jcb.20855. [DOI] [PubMed] [Google Scholar]
- 3.Wenk MR. Nat Rev Drug Discov. 2005;4:594–610. doi: 10.1038/nrd1776. [DOI] [PubMed] [Google Scholar]
- 4.Jones JJ, Borgmann S, Wilkins CL, et al. Anal Chem. 2006;78:3062–3071. doi: 10.1021/ac0600858. [DOI] [PubMed] [Google Scholar]
- 5.Estrada R, Yappert MC. J Mass Spectrom. 2004;39:412–422. doi: 10.1002/jms.603. [DOI] [PubMed] [Google Scholar]
- 6.Jones JJ, Batoy SM, Wilkins CL. Comput Biol Chem. 2005;29:294–302. doi: 10.1016/j.compbiolchem.2005.06.001. [DOI] [PubMed] [Google Scholar]
- 7.Brugger B, Erben G, Sandhoff R, et al. Proc Natl Acad Sci USA. 1997;94:2339–2344. doi: 10.1073/pnas.94.6.2339. [DOI] [PMC free article] [PubMed] [Google Scholar]
- 8.Ejsing CS, Duchoslav E, Sampaio J, et al. Anal Chem. 2006;78:6202–6214. doi: 10.1021/ac060545x. [DOI] [PubMed] [Google Scholar]
- 9.Ekroos K, Chernushevich IV, Simons K, et al. Anal Chem. 2002;74:941–949. doi: 10.1021/ac015655c. [DOI] [PubMed] [Google Scholar]
- 10.Han X, Gross RW. J Lipid Res. 2003;44:1071–1079. doi: 10.1194/jlr.R300004-JLR200. [DOI] [PubMed] [Google Scholar]
- 11.Pulfer M, Murphy RC. Mass Spectrom Rev. 2003;22:332–364. doi: 10.1002/mas.10061. [DOI] [PubMed] [Google Scholar]
- 12.Han X, Gross RW. Mass Spectrom Rev. 2005;24:367–412. doi: 10.1002/mas.20023. [DOI] [PubMed] [Google Scholar]
- 13.Schwudke D, Hannich JT, Surendranath V, et al. Anal Chem. 2007;79:4083–4093. doi: 10.1021/ac062455y. [DOI] [PubMed] [Google Scholar]
- 14.Schwudke D, Oegema J, Burton L, et al. Anal Chem. 2006;78:585–595. doi: 10.1021/ac051605m. [DOI] [PubMed] [Google Scholar]
- 15.Ejsing C. Doctoral dissertation. Technische Universitat Dresden; Dresden: 2007. [Google Scholar]
- 16.Zhang X, Reid GE. Int J Mass Spectrom. 2006;252:242–255. [Google Scholar]
- 17.Folch J, Lees M, Sloane Stanley GH. J Biol Chem. 1957;226:497–509. [PubMed] [Google Scholar]
- 18.Haimi P, Uphoff A, Hermansson M, et al. Anal Chem. 2006;78:8324–8331. doi: 10.1021/ac061390w. [DOI] [PubMed] [Google Scholar]
- 19.Han X, Gross R. J Am Soc Mass Spectrom. 1995;6:1202–1210. doi: 10.1016/1044-0305(95)00568-4. [DOI] [PubMed] [Google Scholar]
- 20.Murphy R. Mass spectrometry of phospholipids: tables of molecular and product ions. Illuminati, Denver: 2002. [Google Scholar]
- 21.Simões C, Simões V, Reis A, et al. Rapid Commun Mass Spectrom. 2008;22:3238–3244. doi: 10.1002/rcm.3727. [DOI] [PubMed] [Google Scholar]
- 22.Zemski Berry K, Murphy R. J Am Soc Mass Spectrom. 2004;15:1499–1508. doi: 10.1016/j.jasms.2004.07.009. [DOI] [PubMed] [Google Scholar]
- 23.Murphy EJ, Stephens R, Jurkowitz-Alexander M, et al. Lipids. 1993;28:565–568. doi: 10.1007/BF02536090. [DOI] [PubMed] [Google Scholar]
- 24.Hsu F, Turk J. J Mass Spectrom. 2000;35:596–606. doi: 10.1002/(SICI)1096-9888(200005)35:5<595::AID-JMS965>3.0.CO;2-D. [DOI] [PubMed] [Google Scholar]
- 25.Harrison K, Murphy R. J Mass Spectrom. 1995;30:1772–1773. [Google Scholar]
- 26.Fahy E, Subramaniam S, Brown HA, et al. J Lipid Res. 2005;46:839–861. doi: 10.1194/jlr.E400004-JLR200. [DOI] [PubMed] [Google Scholar]
Associated Data
This section collects any data citations, data availability statements, or supplementary materials included in this article.


