Short abstract
Noninvasive measurement of mechanical wave motion (sound and vibration) in the lungs may be of diagnostic value, as it can provide information about the mechanical properties of the lungs, which in turn are affected by disease and injury. In this study, two previously derived theoretical models of the vibroacoustic behavior of the lung parenchyma are compared: (1) a Biot theory of poroviscoelasticity and (2) an effective medium theory for compression wave behavior (also known as a “bubble swarm” model). A fractional derivative formulation of shear viscoelasticity is integrated into both models. A measurable “fast” compression wave speed predicted by the Biot theory formulation has a significant frequency dependence that is not predicted by the effective medium theory. Biot theory also predicts a slow compression wave. The experimentally measured fast compression wave speed and attenuation in a pig lung ex vivo model agreed well with the Biot theory. To obtain the parameters for the Biot theory prediction, the following experiments were undertaken: quasistatic mechanical indentation measurements were performed to estimate the lung static shear modulus; surface wave measurements were performed to estimate lung tissue shear viscoelasticity; and flow permeability was measured on dried lung specimens. This study suggests that the Biot theory may provide a more robust and accurate model than the effective medium theory for wave propagation in the lungs over a wider frequency range.
1. Introduction
1.1. Background.
Like no other anatomical region in the body, the lungs are a unique, multiphase porous structure that has defied conventional noninvasive medical imaging methods and our ability to contrast and quantify changes in its macroscopic properties that can be indicative of disease and that may be fundamentally linked to behavioral and structural changes at the microscopic scale. Patients can suffer from a wide range of pulmonary ailments that result in significant changes, locally or diffusely, to the stiffness or density in the lungs [1]. For example, lung parenchymal stiffness increases with the degree of fibrosis in fibrotic lung [2,3]. While in asthma, increased degree of bronchoconstriction is associated with an increase in parenchymal shear modulus [4]. In contrast, the lung becomes less stiff with the degree of emphysema, primarily due to the remodeling of collagen fibers [5,6]. These changes often are not easily identifiable by most imaging modalities.
The utility of conventional ultrasound pulmonary imaging is severely limited, due to the acoustic impedance mismatch between the air in the lungs and soft tissue. X-ray computed tomography (CT) and magnetic resonance imaging (MRI) provide useful anatomic information, but are often limited in their diagnostic accuracy, especially in distinguishing benign, infectious, and malignant pathologies. CT also has the disadvantage of cancer risk associated with ionizing radiation. Spirometry, including the measurement of the volume of inhaled or exhaled air as a function of time, provides a global measure of lung and airway properties but often provides relatively nonspecific findings. Sputum monitoring and respiratory tests before and after the administration of bronchial dilators to assess changes in airway plasticity similarly provide global and, at best, indirect information on spatial extent. MRI using RF tagging techniques has been suggested as a method for assessing the regional mechanical properties of the parenchyma [7,8], but this approach has limitations and does not permit tracking through an entire respiratory cycle.
Lung functional and structural imaging based on an array of contact acoustic sensors placed on the back has been researched for the past decade or so [9–11] and has recently gained more prominence through the burgeoning success of such systems as Deep Breeze™, a commercial product utilizing up to 40 vacuum-mounted contact acoustic sensors on the patient's back or integrated into their bed to provide a real-time assessment of lung sound strength, spectral content, and regional variation, all of which may be beneficial to diagnosis [12–14]. Beyond obtaining an image that depicts the distribution of lung sounds on the torso surface, if a better understanding of mechanical wave propagation within the lungs and torso were available, one may be able to reconstruct the wave field within the lungs and torso based on the noninvasive surface measurements. This would take the two-dimensional surface image into three dimensions and could potentially provide not only the location but also more quantitative information about the properties of the lung that can affect how sound and vibration propagate through it [8]. The benefit of coupling an array measurement on the surface with an improved computational model of sound propagation within the torso was demonstrated fundamentally in Ozer et al. [15]. In phantom studies, it was shown that the use of a computational boundary element model of lung acoustics combined with a surface array measurement was significantly superior in identifying the dominant source location of the sound as compared to a simple “ray acoustics” model that neglects the more complex nature of sound transmission in a finite and complex dimensioned structure.
Also recently, the phase-contrast-based technique known as magnetic resonance elastography (MRE) has been applied to the lungs in pilot studies with limited success [16–19]. MRE seeks to provide a map of the viscoelastic properties within the region of interest that will affect the shear wave motion that MRE measures. Previously, MRE has been successfully applied to the study of the mechanical properties of a variety of other organs and soft tissue regions in vivo, including the breast, brain, kidney, prostate, liver, and muscle [20–24]. Application to the lungs has proven more challenging, given the poor signal-to-noise available in imaging due to a lower presence of hydrogen in air than in soft tissue (water) and the complex nature of vibratory wave propagation found in the lungs. Again, the authors propose that a better understanding of mechanical wave motion in the lungs would aid in the interpretation of the wave images that are acquired using MRE to reconstruct a quantitative map of variation in mechanical properties that can correlate with injury, the progression of disease, and/or the response to therapy.
The lung parenchyma is comprised of soft biological tissue and vasculature, as well as millions of microscopic air sacs (alveoli) that are connected through a complex branching airway structure. Thus, microscopically, the lungs are highly heterogeneous in terms of their physical properties, combining gas (air) that is linked through a complex and tortuous network of channels and microscopic sacs, non-Newtonian liquid (blood) that flows through an equally complex network of vessels of wide-ranging dimensions, and solid tissue structure comprised of a mixture of viscoelastic soft tissues that exhibit nonlinear behavior under large deformation.
However, for the purpose of developing a tractable set of equations for predicting small-amplitude mechanical wave motion in the parenchyma for wavelengths larger than the microscopic heterogeneous features of the lung, macroscopic homogenized representations of the lung's physical properties have been proposed. Based on this homogenous or stochastic spatially averaged view, two different models for wave propagation have been put forth. One is sometimes referred to as the “effective medium” or “bubble swarm” theory. It has been prominently used in the literature for modeling lung acoustics since the 1980s [25–27]. More recently, there has been an interest in applying Biot's theory of poroelasticity to the lung [28]. Application of Biot theory leads to a more complex theoretical model that predicts more wave types as compared to the effective medium theory. From a practical and ultimately clinical perspective, questions of interest include: (1) how do these theories compare to each other and to experimental measurements; (2) how complex does the theory need to be to capture the salient phenomena that is measurable and can be linked to disease or injury; and (3) how easily are these theories applied or integrated into computational frameworks that would enable one to better understand and quantify with specificity and significance how mechanical wave phenomena, which may be measured by application of the existing or nascent imaging technologies mentioned above, are affected by disease and pathology.
1.2. Objectives.
In this article, these theories are compared through analytical and experimental studies. In Sec. 2, the key aspects of both theories, as applied to the lungs, are reviewed, culminating in a comparison of predicted wave attributes, namely wave speed and attenuation. In Sec. 3, several experiments are detailed that are aimed at identifying key parameters used and predicted by the theories. The applicability of the proposed theories is experimentally assessed by comparison of their predictions to experimental measurements made on freshly excised pig lungs. Experiments at different transpulmonary pressures include sound transmission measurements that primarily provide information about compression waves, surface wave measurements that are linked to shear wave behavior, and quasistatic measurements of basic lung mechanical properties. Experimental results and discussion are reported in Sec. 4 and Sec. 5 followed by an overall conclusion in Sec. 6.
2. Theory
2.1. Effective Medium or Bubble Swarm Theory of Compression Waves in the Lungs.
Previously, it has been proposed that, for the purpose of calculating compression wave behavior over the audible frequency range, parenchymal tissue can be modeled as a homogenous isotropic material with properties analogous to those observed in water that is uniformly populated with small gas bubbles [25–27]. This is a “closed cell” approximation, meaning that it assumes that the oscillating motion caused by the compression wave is so fast that the air in the lungs does not have time to flow between different regions. It has been estimated that such an assumption will only be valid above ∼100 Hz. For compression wavelengths much larger than alveoli size (which will be the case in the low audible frequency range considered here up to several kHz), compression wave speed is approximated as
| (1a) |
with
| (1b) |
| (1c) |
where is the bulk modulus of the composite mixture, an effective bulk modulus comprised of a reciprocal of bulk moduli of the nongaseous (soft tissue and blood) () and gaseous (air) () components of the lung. Here, denotes the volume fraction of the gas portion of the lungs and is defined as , where is the volume of the gas in the lungs and is the total volume of the lung. In a similar manner, the composite density of the lungs is a weighted sum of the densities of the gas portion () and the nongaseous portion (). The above equation is sometimes referred to as Wood's formula [25]. As frequency increases and compression wavelength approaches that of alveoli size, the resonant behavior of the individual alveoli adds more complexity to the calculation of the wave speed. See Wodicka et al. [26] for a detailed discussion.
As the gas component is air, we assume , where n is the polytropic constant and denotes the pressure in the lungs (atmospheric pressure plus the lung inflation pressure). The polytropic constant n will be somewhere between 1 (isothermal process) and the ratio of specific heats of air (constant pressure-specific heat over constant volume-specific heat ), which is 1.41 (adiabatic process) at 300 K. As frequency increases and the speed of fluctuations in local temperature and motion in the gas associated with wave passage increase, it is expected that the process will transition from being closer to isothermal to become closer to adiabatic.
Attenuation of compression waves as they propagate is driven by both thermal dissipation (if nonadiabatic) and viscous (solid and fluid) effects. The thermal dissipation also varies with frequency as wavelength approaches that of the alveoli size. In the gas portion, thermal dissipation is calculated to be dominant [26] and will be the primary source of attenuation for compression waves. For harmonic motion and time dependence , the resulting complex-valued compression wave number can be expressed as [27]
| (2a) |
with
| (2b) |
Here, N is the number of bubbles (alveoli) per unit volume and , which is frequency-dependent, is the extinction cross section for each bubble. For frequencies such that wavelengths are much larger than the alveoli size, the value of is proportional to [26,27]. Here, the real part of is related to compression wave speed and the imaginary part defines the attenuation.
2.2. Shear Waves in the Lungs.
The above effective medium analogy is only useful in calculating compression wave behavior, not shear wave behavior. However, a decoupled equation for shear wave motion can be formulated based on using the above average lung density value combined with a value for shear viscoelasticity of the lungs , which may be rate-dependent due to shear viscosity such that, in the frequency domain, the complex-valued wave speed and shear wave number are
| (3a) |
| (3b) |
Here, the real part of governs shear wave speed and the imaginary part defines the attenuation. The appropriate form of a shear viscoelastic model for soft biological tissues, let alone the lung parenchyma, is still a subject of much research, particularly in the elastography literature [29,30]. Suffice it to say, the model choices are empirical, based on their ability to match experimental measurements over a range of frequencies. It is noted that a number of recent studies have emphasized the appropriateness of fractional order viscoelastic models for biological tissues [31–35]. The fractional derivative operator does not present a mathematical difficulty when it is applied to well-conditioned functions. For harmonic functions, for a derivative with respect to time of order α where 0 < α < 1, the Weyl definition of the fractional derivative results in simply raising jω to the power α when transforming to frequency domain [30]. Specifically, . This will be investigated further with regard to experimental studies in Sec. 3.
2.3. Biot Theory of Poroviscoelasticity Applied to the Lungs.
Assuming a homogenous isotropic poroviscoelastic medium and small deformations such that linear theory is valid, per Biot theory [36,37], we have the following set of coupled differential equations (written in the frequency domain, neglecting initial conditions, where multiplication by jω denotes a derivative with respect to time) describing steady-state dynamic oscillatory displacement of the nongaseous portion and dynamic pressure of the gaseous portion [38]:
| (4a) |
| (4b) |
Specifically, these are equations 6.17–18 in Ref. [38] written in the frequency domain for and under a steady-state assumption. Here, Einstein summation notation is used, such that a repeated index in the subscript denotes summation of all the terms (such as x, y, and z in a Cartesian coordinate system). Subscripts after the comma denote partial derivatives in those directions. (Only as a subscript does j denote partial derivative; it denotes elsewhere.) Here, is the bulk modulus of the solid skeleton (tissue part of the lung when it is inflated). Many of the other material constants in the above equations were defined in Sec. 2.1. Shear viscoelasticity will be assumed, such that is frequency-dependent and complex in value. Newly introduced terms and denote external inputs of force per unit volume (e.g., Newtons per cubic meter) and the rate of introduction of gas volume per unit volume (e.g., inverse seconds), respectively. We also have the following [38]:
| (5a) |
| (5b) |
| (5c) |
| (5d) |
where is the tortuosity, which (as normally defined) is the square of the ratio of the minimum path length of a contiguous path through the pore network to the straight path length. It is a shape factor depending on the pore geometry. The pore space in the lungs (respiratory tree) can be approximated as a sinuous cylindrical channel network with varying diameter, so the tortuosity at low frequencies (frequencies where viscosity dominates over inertia) is 1.33 [39,40]. Also, , where is the permeability of the porous medium, and for a network of tortuous capillaries of any cross section, [41], where S is the specific area of the pore space. is the complex-valued fluid (gas) viscosity defined as [37]
| (6a) |
where is the frequency correction function for the viscosity and is the dynamic viscosity of the fluid (in). By applying Biot theory to the lungs, the fluid (air) in the pores (bronchioles and alveolar sacs) is modeled as three-dimensional flow in a circular straight duct with radius r. As the respiratory tree progressively subdivides, it finally reaches the alveolar sac, which is made of clusters of alveoli. An alveolar duct is formed by a series of alveoli lying adjacent to one another. A microscope image showing morphometric parameters h (alveolar depth) and r (alveolar duct radius) for an alveolar duct is displayed in Fig. 1. The flow type is Poiseuille flow when the duct wall is at rest. When the fluid and the solid skeleton oscillates at a frequency , there is a deviation from the Poiseuille flow and the dynamic viscosity of the fluid is multiplied by a frequency correction function . is defined as [37]
Fig. 1.
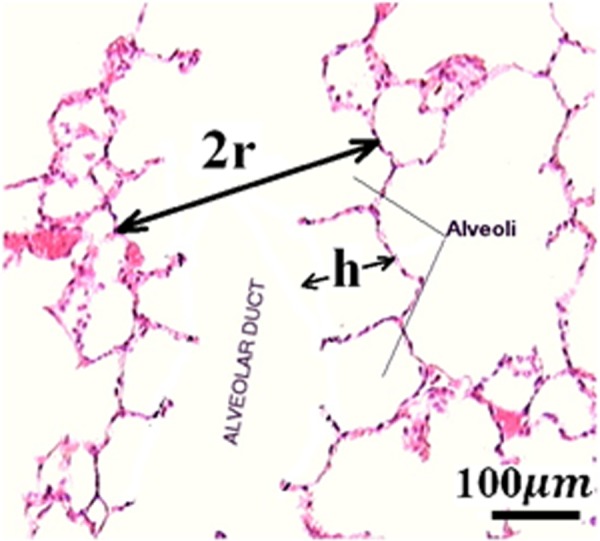
Microscope image showing morphometric parameters h and r for an alveolar duct
| (6b) |
where and . As the pores are not parallel but sinuous, a sinuosity factor is introduced to account for this effect and is the square root of the tortuosity. Here, are Bessel functions of the first kind. At high frequencies, . As the friction between the fluid and the duct wall is proportional to , the friction is proportional to the square root of the frequency and is 45 degrees out of phase with the velocity.
Neglecting external excitations and taking the divergence of Eq. (4a) yields the following equation that, when coupled with Eq. (4b), governs compression wave behavior:
| (7) |
Suppose that the dilatation is zero and, again, neglecting external excitations, Eq. (4a) reduces to the following equation, which governs shear wave behavior:
| (8) |
From Eq. (8), we see that the complex-valued wave speed and shear wave number are
| (9a) |
| (9b) |
Here, the real part of governs the shear wave speed and the imaginary part defines the attenuation.
Without loss of generality, consider plane wave motion in the x direction; assuming there are no variations in y and z directions and neglecting external excitations, Eqs. (4a) and (4b) simplify to the following for steady-state compression waves (expressed in the frequency domain):
| (10a) |
| (10b) |
where , , , , , , and ″ denotes second-order spatial derivative with respect to x. Assume that the plane wave motion in the x direction is oscillating at frequency ω; the displacement and pressure p have the form
| (11a) |
| (11b) |
Inserting Eqs. (11a) and (11b) into Eqs. (10a) and (10b), we have the expression of and p in the matrix form,
| (12) |
The nontrivial solution of and p requires that the determinant of the coefficient matrix be zero, which leads to a quadratic equation for . This then provides for two possible solutions for and thus positive-valued , which are denoted as and , the slow and fast compression wave numbers. The two compression waves attenuate due to the relative motion between the solid and fluid and due to the viscous property of . So, and are complex valued; the real part of and governs compression wave phase velocity and the imaginary part governs the attenuation. The phase velocities of the fast and slow compression waves are defined as and . The group velocities of the fast and slow compression waves are defined as and . The phase velocity value and the group velocity value are not equal for a dispersive medium.
2.4. Comparison of Wave Speed and Attenuation Predictions.
The theories described in Secs. 2.1–2.3 for mechanical wave motion in the lung parenchyma can be compared in terms of their predictions for wave speed and attenuation, given the set of nominal property values at a transpulmonary pressure (Ptp, airway pressure relative to pleural or atmospheric pressure) of 20 cm H2O for the effective medium model provided in Table 1 and additional parameters for Biot theory provided in Table 2. The lung parenchyma permeability, lung skeleton bulk modulus, and lung shear modulus are taken from experimental measurements described in Sec. 4. These comparisons are shown in Figs. 2 and 3. Both theories predict a “fast” compression wave speed. The group velocity as well as the phase velocity (not plotted here) of the fast compression wave predicted by Biot theory increases with frequency, indicating the lung as a dispersive medium, while the effective medium theory predicts a frequency-independent velocity. However, Biot theory predicts an additional slow compression wave that is not predicted by the effective medium theory. The shear wave, based on Eq. (8), is decoupled from equations for the compression waves. Based on the parameters in Tables 1 and 2, the shear wave phase velocity calculated by Eqs. (3) and (8) are virtually the same for the expected additional parameter values in Biot theory (which are not known precisely). Thus, Eq. (3) is used for the shear wave speed in this study. The slow compression wave has a larger attenuation coefficient than the fast compression wave, as shown in Fig. 3. The shear wave attenuation is mainly due to the lung shear viscosity. However, the wave attenuation predicted by Biot theory and by the effective medium model has significant differences. At frequencies above 1000 Hz, the effective medium model predicts a much larger attenuation coefficient than the Biot theory. The wave speed and attenuation predictions will be compared with experimental measurements detailed in Secs. 3 and 4.
Table 1.
Parameters for effective medium theory
Table 2.
Additional parameters for Biot theory at 20 cm H2O Ptp
Fig. 2.
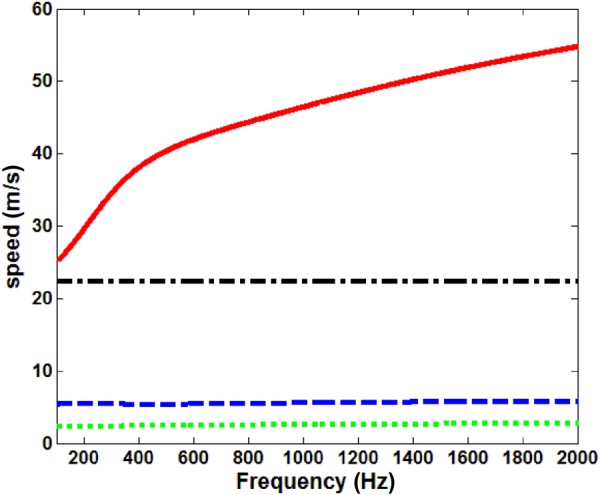
Compression and shear wave group velocity at 20 cm H2O Ptp, ––– fast compression wave, Biot theory, – – slow compression wave, Biot theory, – - – compression wave, effective medium model, - - - shear wave
Fig. 3.
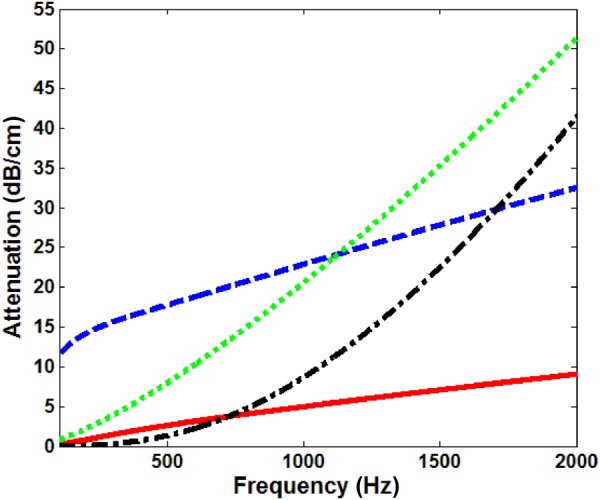
Compression and shear wave attenuation at 20 cm H2O Ptp, ––– fast compression wave, Biot theory, – – slow compression wave, Biot theory, – - – compression wave, effective medium model, - - - shear wave
3. Experiments on Freshly Excised Pig Lungs
3.1. Freshly Excised Lung Preparation.
Experiments detailed in Secs. 3.2–3.4 were carried out on the lung of a freshly sacrificed pig that weighed 33 kg. Immediately upon sacrifice, the lung was inflated by air with positive pressure of 20 cm H2O gage. As the chest cavity was surgically opened and pleural pressure became atmospheric pressure, the transpulmonary pressure was maintained at 20 cm H2O. It was observed that all the lung lobes were uniformly inflated and no noticeable amounts of gas trapping were found under the pleural membrane. The lung was removed from the chest of the pig, blood drained, and placed on a vibration-isolated test bench in a room maintained at 20 °C. The sequence of experiments on the lung included quasistatic mechanical indentation measurements, surface wave measurements, and compression wave measurements. After the above measurements, the lung volume was measured by water displacement and the lung mass was also measured. The time range of these measurements postmortem was about 0.5–1 h, 1–1.5 h, 1.5–2 h, and 2–2.25 h, respectively. During this time, the lung was periodically sprayed with water to keep the surface moist. Separately, permeability measurements were made on dried specimens of porcine lung (Sec. 3.5).
3.2. Mechanical Indentation Tests on Excised and Inflated Lung of Freshly Sacrificed Pig.
A quasistatic mechanical indentation test was performed to determine the lung relaxed shear modulus at two different Ptp's. A steel cylindrical indenter with a 1.1-cm diameter was indented on the surface of the cranial lobe. The increment in displacement (d) was 0.25 mm, and the maximum displacement was kept to 1.5 mm to ensure small deformation. The displacement was measured by a micrometer, and the applied force F was measured by a digital force gauge (DS2-1, Imada, Northbrook, IL). As the lung surface dimension is much larger than the indenter radius, the indentation can be well approximated as contact between a cylindrical indenter and an elastic half space. The applied force F is related to the displacement d by
| (13) |
where , and and are the Young's moduli and and the Poisson ratios associated with the lung and the steel indenter, respectively [42]. In Eq. (13), R is the radius of the cylindrical indenter. The steel indenter is much stiffer than the lung tissue, so and the lung relaxed shear modulus (shear elasticity) is related to its relaxed Young's modulus by . Thus, the applied force and displacement relation can be expressed as
| (14) |
where can be evaluated from the F by d slope. It is reported that the Poisson ratio of the lung is in the range of 0.4 and 0.44 [43,44]; here, we take . Thus, with Eq. (14), the lung relaxed shear modulus can be calculated under quasistatic conditions.
3.3. Surface Wave Studies on Excised and Inflated Lung of Freshly Sacrificed Pig.
Next, surface wave propagation on the inflated lung surface was measured by a scanning laser Doppler vibrometer (SLDV) (PSV-400, Polytec, Irvine, CA). The lung was placed on a vibration isolation bench. A sinusoidal signal was generated from the SLDV and fed into a power amplifier (P 3500S, Yamaha, Buena Park, CA) that was connected to an electromagnetic shaker (ET-132, Lab-Works Inc., Mesa Costa, CA). The shaker has a flat dynamic response up to 11 kHz. The impedance head (288D01, PCB Piezotronics, Depew, NY) was connected to the shaker by a stinger, and a plexiglass disk with radius of 10 mm was mounted at the end of the impedance head. The frequencies of sinusoidal excitation were from 100 Hz to 600 Hz with an increment of 100 Hz. A harmonic force was applied on the lung surface by the plexiglass disk. Out-of-plane velocity of the points on the lung surface was measured by the SLDV. The measurements were taken at 20 cm H2O and 10 cm H2O Ptp. Scanning was along two adjacent lines radially outward from the excitation area over a distance of 25 mm with a 2.5 mm increment (measured by a flexible ruler placed on the lung surface), and the measurement point closest to the excitation was 5 mm from the rim of the plexiglass disk. The acceleration and velocity measurements were fed into the SLDV data acquisition system with a sampling frequency of 10.24 kHz. The experimental setup is shown in Fig. 4.
Fig. 4.
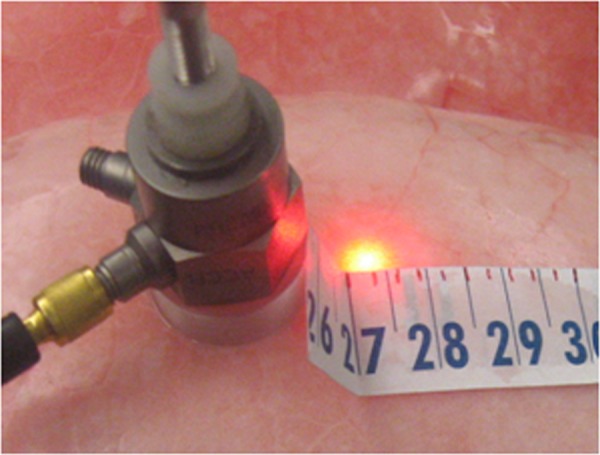
Experimental setup for surface wave measurement
From the surface wave measurements, the frequency response function (FRF) at each point between the output signal (vertical velocity of the surface points) and reference signal (acceleration of the impedance head) was calculated. The surface wave phase velocity at each frequency was calculated from the change of the phase angle of the FRF with respect to radial position using linear regression,
| (15) |
where is the distance between two measuring points, is the wave phase angle between the same two points in radians, and is the frequency in Hz. Parametric studies show that, for the lung, the shear wave speed calculated by Eqs. (3a) and (3b) is almost the same as the one calculated by Eqs. (9a) and (9b); so Eqs. (3a) and (3b) are used here for the shear viscosity estimation described below. Surface wave speed in the lungs increases with frequency due to rate-dependent viscous effects. Frequency-dependent surface wave speed results from a complex shear modulus that can be expressed in the frequency domain by its real and imaginary part as
| (16) |
The shear wave speed of a viscoelastic material is expressed as [29]
| (17) |
An approximate relation between surface wave and shear wave speed is [45]
| (18) |
By fitting the measured surface wave speed with Eq. (18), and can be estimated. Then, and were fit with Voigt, fractional Voigt, and standard linear solid (SLS) models of viscoelasticity to estimate the lung shear modulus over the whole frequency range of interest. For the band of frequencies analyzed here, it was found that the fractional Voigt model [29,30] with fractional order provided a reasonable fit to experimental data and only requires optimization of one parameter based on surface wave measurements (as was determined by the quasistatic indentation tests). The shear modulus is expressible as () = + , where and are coefficients of shear elasticity and shear viscosity, respectively [29]. and are related to and by
| (19) |
where is the frequency in radians/second.
3.4. Compression Wave Studies on Excised and Inflated Lung of Freshly Sacrificed Pig.
The same power amplifier, electromagnetic shaker, and impedance head were used in compression wave studies. A 20-cycle, tone-burst signal was generated from a dynamic signal analyzer (SignalCalc ACE, Data Physics, San Jose, CA) and was fed into the power amplifier that was connected to the electromagnetic shaker. The impedance head was mounted on the shaker with its end connected to a plexiglass disk with radius of 15 mm, which in turn was gently pressed against the inflated and excised lung's surface. The frequencies of the tone-burst signal were from 100 Hz to 2000 Hz. A point on the lung surface was driven by the plexiglass disk, and its acceleration was measured by the impedance head. Out-of-plane velocity of the point on the other side of lung surface was measured by a laser Doppler vibrometer (LDV) (PDV-100, Polytec, Irvine, CA). The measurements were taken at cranial lobes, as they provide enough space for the full contact between the plexiglass disk and the lung surface. The distance between the point at the center of the plexiglass disk and the point measured by LDV was measured by a caliper to the nearest tenth of a mm. The acceleration and velocity measurements were recorded by the same signal analyzer with a sampling frequency of 102.4 kHz. The wave speeds were measured at three locations (each location twice) at each Ptp. A schematic diagram of the experiment is shown in Fig. 5. The acceleration measured on one side of the lung surface was regarded as the input signal x(t), the velocity measured on the other side of the lung surface was numerically differentiated, and the resulting acceleration was regarded as the output signal y(t). The cross-correlation function of the two signals is calculated by
Fig. 5.
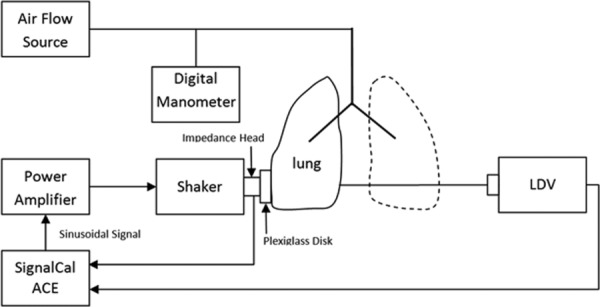
Schematic diagram of compression wave measurement
| (20) |
was found to be the peak location of the curve. Thus, the transit time of the compression wave traveling at a constant velocity between two points on the lung surface is
| (21) |
where is the time delay of the LDV, which is 1.243 ms (per the manufacturer and in agreement with calibration measurements taken in our lab). The compression wave speed is then given by , where d is the distance between two points measured by a caliper. Since the excitation signal is a narrow-banded, finite-duration oscillatory pulse, this excitation waveform propagates undistorted in shape and at the group velocity [45]; thus, the estimated wave speed is the group velocity of compression waves propagating in the lungs.
Due to complex geometries of the lungs and wave reflection/transmission at the lung and air interface, attenuation estimated from the velocity measured by the LDV with respect to the reference acceleration will be unreliable; so two subminiature microphones (BL-21785-000 Knowles Electronics, Itasca, IL) were used to measure the wave attenuation. As it is difficult to establish planar compression waves throughout the lung, creating spherical compression waves throughout the lung will make it easier to separate the attenuation due to geometric spreading from total attenuation. To achieve this, the plexiglass disk with a radius of 1 cm connected to a shaker was replaced by a hose with a radius of 3.1 mm connected to an 88.9-mm (3.5-in.) speaker (PDWR30W, PylePro, Brooklyn, NY). A needle with an inner diameter of 0.413 mm was inserted into the lung at the same height as that of the sound input. The needle end was connected to a 50-mm-long hose, and the pressure was measured by the microphone through the hose. The data acquisition system remained the same. The measurements were taken at three different locations (each location twice) at each Ptp. The pressure amplitudes at two measurement points (except the near field) have the form
| (22a) |
| (22b) |
where A is an arbitrary constant, is the imaginary part of the wave number, and and are the distances of the measurement points from the sound input. From Eqs. (22a) and (22b), the attenuation (dB/m) is
| (23) |
3.5. Lung Permeability Studies on Dried Porcine Lung.
Permeability is a measure of the ability of a porous material to allow fluids to pass through it. It is an important parameter that affects the compression wave speeds and attenuation in the Biot theory. It is part of the proportionality constant in Darcy's law, which relates discharge (flow rate) and fluid physical properties (e.g., viscosity) to a pressure gradient applied to the porous media; it is defined as
| (24) |
where is the superficial fluid flow velocity through the medium (i.e., the average velocity calculated as if the fluid were the only phase present in the porous medium), is the dynamic viscosity of the fluid, Δp is the applied pressure difference, and Δx is the thickness of the porous medium. As any piece of lung parenchyma cut from an inflated fresh lung will collapse and cannot keep its shape, dry-preserved swine lung pieces (LS03686, Nasco, Fort Atkinson, WI) were used to estimate lung parenchyma permeability. The dry-preserved lung was inflated to its maximum volume and dried by the manufacturer. Cylindrical samples were carefully cut from dry-preserved lung pieces, and clearly visible airways were avoided as best as possible to keep the test samples close to a homogeneous and isotropic medium. The test sample was put into a plastic test tube and connected to an air flow source with constant volume flow rate. The pressure difference at two ends of the sample was measured by a differential pressure manometer (HD 750, Extech, Nashua, NH). The downstream volume flow rate was measured by a Visi–Float® flowmeter (Series VFB, Dwyer Instruments, Michigan City, IN). The experimental setup and diagram are shown in Fig. 6. The superficial fluid flow velocity was calculated by dividing the volume flow rate by the test sample cross-sectional area. For each test sample, experiments were carried out for five pressure differences and the permeability was estimated from Eq. (24).
Fig. 6.
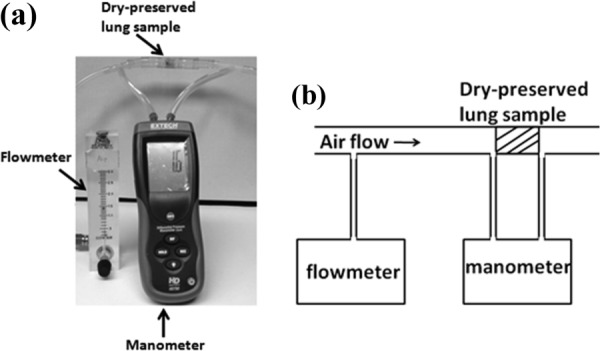
Lung parenchyma permeability measurement (a) experimental setup and (b) schematic diagram
4. Results
As the air volume fraction and the permeability will be used to calculate the fast wave speed from Biot theory and compared with experiments, measurements on these two parameters are first reported. The mass of the pig lung at zero Ptp was 331 g. As the soft tissue density is very close to , the soft tissue volume was taken to be 331 . The total volumes of the lung at 20 cm H2O and 10 cm H2O were 1141 and 770 , respectively, so the air volume fraction of the lung was 71% and 57%, respectively. For the permeability measurement, different superficial fluid flow velocities and applied pressure differences form a good linear relationship for each dried lung sample. The lung parenchyma permeability with its mean and standard deviation is shown in Table 3. The average value of the permeability of the four samples is , and this is taken as an approximation of the parenchymal permeability value at 20 cm H2O. As , the lung permeability at different Ptps is different. The pore space in the lungs is the respiratory tree, which is comprised of the conducting airways and the respiratory zone (the respiratory bronchioles, the alveolar ducts, alveolar sacs, and alveoli). The length and diameter of the conducting airways and the respiratory bronchioles almost remain the same over the range of different Ptps, so the tortuosity is approximated as a constant. Although there are still inconsistencies in the literature regarding alveolar surface area at different Ptp, in a recent study, Hajari et al. [46] demonstrated that, by using the 3He MRI technique, the healthy human lungs inflate primarily by alveolar recruitment combined to a lesser extent with anisotropic expansion of alveolar ducts. From their study, the alveolar surface area changes little with pressure. So the pore surface area for the lungs may not significantly affect the permeability. Then, from and by considering the change of air volume fraction, the permeability of the lung parenchyma at 10 cm H2O is .
Table 3.
Lung parenchyma permeability
| Sample # | 1 | 2 | 3 | 4 |
|---|---|---|---|---|
| Diameter (cm) | 1.50 | 1.50 | 0.98 | 0.98 |
| Length (cm) | 1.60 | 1.45 | 1.20 | 1.00 |
| Permeability () | 32.30 ± 1.95 | 21.75 ± 0.61 | 26.24 ± 1.33 | 21.00 ± 0.89 |
The applied force and displacement relation for the indentation measurements are shown in Fig. 7. From Eq. (14), the lung shear modulus is estimated to be 1.40 kPa and 0.79 kPa at 20 cm H2O and 10 cm H2O, respectively.
Fig. 7.
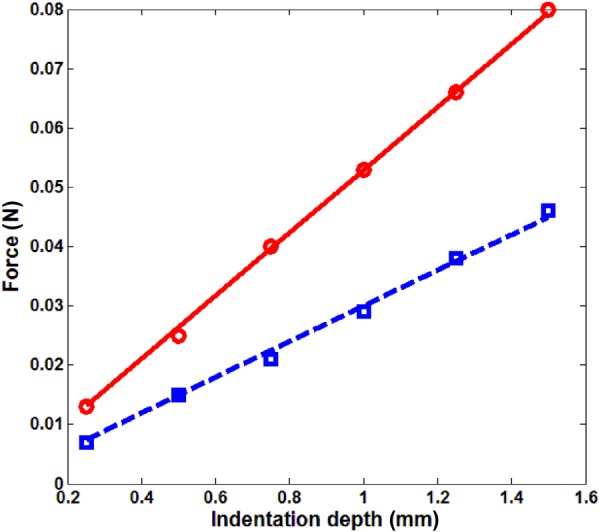
Force and indentation depth relation in indentation measurement, ○ ○ ○ experiment, 20 cm H2O, ––– least square fit, 20 cm H2O, ◻ ◻ ◻ experiment, 10 cm H2O, – – least square fit, 10 cm H2O
In Figs. 8(a) and 8(b), the surface wave speed along lines 1 and 2 are close to each other; the small discrepancy between the values of the two lines is likely caused by nonhomogeneity of the lung tissue. The surface wave speeds along the two lines were averaged and used to fit Eq. (18) in a least square error sense to obtain the optimal values of and . The curve fits of different viscoelastic models at each Ptp are also plotted in Fig. 8. Using Eq. (19) and known from the indentation tests, the shear viscosity can be calculated from or At 20 cm H2O and 10 cm H2O Ptp , and , respectively. When the frequency approaches zero, the shear wave speed approaches .
Fig. 8.
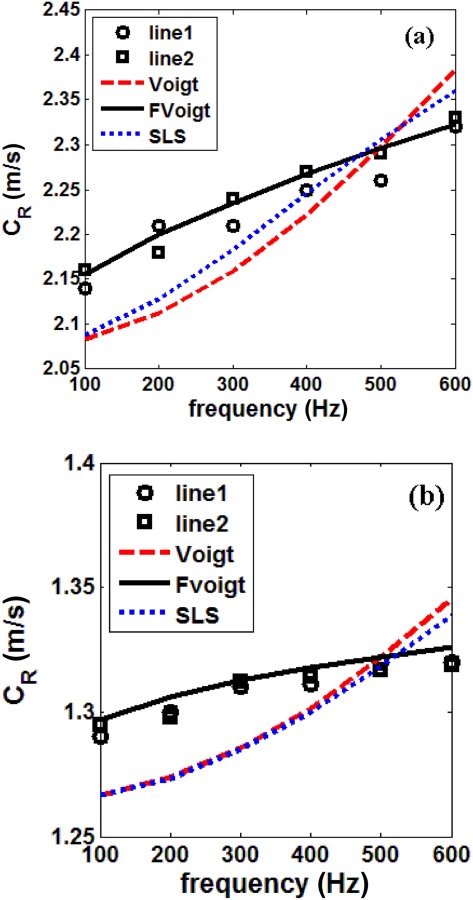
Surface wave speed, (a) 20 cm H2O and (b) 10 cm H2O, ○ ○ ○ experiment, line 1, ◻ ◻ ◻ experiment, line 2, ––– Voigt model least square fit, ––– fractional Voigt model least square fit, - - - SLS model least square fit
From the compression wave studies, the time history of the acceleration and velocity of a point as a result of a 20-cycle, 400 Hz tone-burst input is shown in Fig. 9. The distance between two points was 33.2 mm at 10 cm H2O. The amplitude of the velocity is very small, so it was increased by 2000 times for ease of viewing in the figure. From Fig. 9, it is observed that there is only one type of compression wave (fast wave) propagating in the lung parenchyma, while the slow wave is not observed. This can be explained as follows. In Biot theory, it is assumed that the flow of the fluid relative to the solid through the pores is of the Poiseuille type. For Poiseuille flow in a porous medium, the characterizing boundary layer is known as the viscous skin depth , and it is expressed as [41]
Fig. 9.
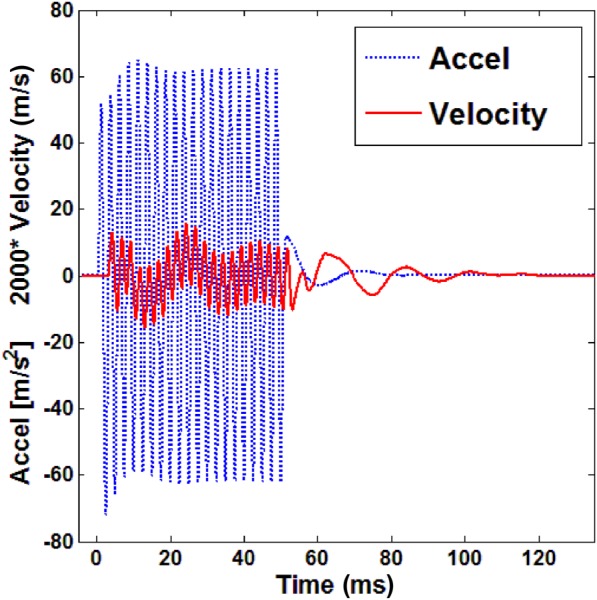
Time history of the acceleration and velocity of a point at 400 Hz with 10 cm H2O as a result of a 20-cycle tone-burst input. The amplitude of the velocity is increased by 2000 times for ease of viewing here.
| (25) |
The assumption of Poiseuille flow fails when is equal to or greater than the pore radius. It is important for the observation of the slow wave that should be much smaller than the pore radius, as the relative motion of the solid and the fluid is not impeded by viscous drag so that the slow wave can propagate [41]. In our frequency range of interest (100–2000 Hz), ranges from 0.05 to 0.22 mm. The typical pore radius is the alveolar duct radius, which is around 0.25 mm. The slow compression wave was first observed by Plona [47] in water-saturated disks composed of sintered glass spheres with diameters between 0.21 and 0.29 mm. Slow wave velocity measurements were made using the 500-kHz transducer pair. So, from Eq. (25), the viscous skin depth is 0.8 and the sphere radius is about 300 times . The slow compression wave was also observed in water-saturated bovine plexiform and human Haversian bone [48]. To observe the slow wave, the lowest frequency in bovine plexiform bone cut perpendicular to longitudinal direction is 0.73 MHz and the radius (round 0.02 mm) of the main canals for blood supply is taken as the pore size. Thus, is 0.66 and the pore size is about 30 times of . However, in the current experiment, is not small enough compared with the pore radius; so it is not possible to observe the slow compression wave in our frequency range of interest. Under very high frequencies, it might also be impossible to observe the slow wave, as it attenuates faster than at lower frequencies.
The measured compression wave speed (group velocity) at 20 cm H2O and 10 cm H2O are shown in Fig. 10. The theoretical predictions by Biot theory and the effective medium model are also plotted for comparison. The signals measured by the microphone have more noise than those from the LDV, and hence they were not used to estimate the wave speed. In order to have a good estimate of the true mean of the compression wave speed in the lung parenchyma based on a finite-sized sample, a 95% confidence interval is used as a quantified measure of the random error in the estimate of the true value of the compression wave speed. Thus, the estimate of the true mean value based on a finite data set experiment is stated as
Fig. 10.
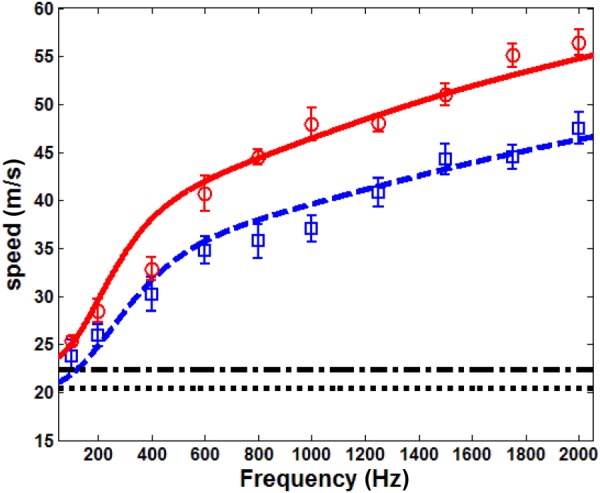
Fast compression wave group velocity, ○ ○ ○ experiment, 20 cm H2O, ––– Biot theory, 20 cm H2O, –.– effective medium model, 20 cm H2O, ◻ ◻ ◻ experiment, 10 cm H2O, – – Biot theory, 10 cm H2O, - - - effective medium model, 10 cm H2O. Bars on the experimental data denote a 95% confidence interval, as described in Sec. 4.
| (26) |
where is the estimator of the Student's t distribution with 0.95 probability and 5 degrees of freedom. is the standard deviation of the means and is defined as with as the sample standard deviation and N as the sample size of six. The parameters used for theoretical predictions are listed as follows. The air density at 20 °C is . The air pressure in the lung at 20 cm H2O and 10 cm H2O is and , respectively. The soft tissue density is , the tissue bulk modulus is taken to be that of the water as 2.2 GPa [49]. Air viscosity at 20 °C is . The complex shear modulus of the lung is and at 20 cm H2O and 10 cm H2O, respectively. The solid skeleton bulk modulus is 8.26 kPa and 4.68 kPa at 20 cm H2O and 10 cm H2O, respectively. The pore size also affects the fast compression wave speed. Using the 3He MRI technique, Hajari et al. [46,50] demonstrated that the alveolar duct radius of both human and dog lung increases with pressure. As the weight of the pig used in this experiment was close to that of the dog, we took the alveolar duct radius as 0.225 mm at 20 cm H2O and 0.2 mm at 10 cm H2O, which are within the range of the measurements made by Hajari. The polytropic constant is taken as n = 1. This fits the wave speed in the experiments better than n = 1.41. When n = 1.41, all the experimental data are below theoretical predictions by about 7–8 m/s for both pressures. In the attenuation results below, n = 1 also has a better fit. As mentioned above, n can be between 1 and 1.41. Since the bulk modulus of the lung tissue is about five times the order of magnitude of that of the air, from Eq. (1b), the bulk modulus of the lung is approximately . Yen et al. [51] measured the compression wave speed, density, and the bulk modulus of the rabbit lung. From their measured lung density and bulk modulus, the polytropic constants at the different Ptp used here are close to 1.09, which supports our choice of n = 1. The polytropic constant was also n = 1 in Wodicka et al. [26]. It is observed in Fig. 10 that the compression wave speed increases with frequency, and these trends agree well with the Biot theory prediction. As Ptp increases from 10 cm H2O to 20 cm H2O, the Biot theory also predicts a larger wave speed, which is confirmed from the experiment. The measured wave speed at 100 Hz and 200 Hz is within the range of reported values at similar densities in Rice [25]. The effective medium model predicts a frequency-independent wave speed, and the values it predicts are lower than those of Biot theory above 200 Hz. For frequencies higher than 2000 Hz, the low-LDV signal-to-noise ratio (SNR) makes the estimation of the transit time unreliable; thus, 2000 Hz was the highest excitation frequency in the current experimental protocol.
The attenuation of the compression wave at 20 cm H2O and 10 cm H2O are shown in Fig. 11. The theoretical predictions by Biot theory and the effective medium theory are also plotted for comparison. As the signals with poor SNR were discarded, only two measurements with different microphone distances were shown for each pressure. The Biot theory prediction has a relatively good match with the experiments, while the thermal damping predictions from the bubble swarm theory do not provide a good match. As seen from Fig. 11, above 300 Hz, the attenuation at 10 cm H2O is larger than that of 20 cm H2O. This attenuation increase likely arises from the increase of friction between the alveolar duct wall and the air. Microscopically, the increase of friction is due to the significant drop of permeability, which increases the pressure gradient along the pore space. As and assuming that the alveolar duct radius increases with the air volume fraction, the attenuation has a maximum at a certain air volume fraction based on the Biot theory prediction. Using the parameters above, the maximum attenuation shifts from an air volume fraction of 0.68 to 0.5 as the frequency increases from 100 to 2000 Hz. At frequencies above 1000 Hz, the maximum attenuation occurs at a volume fraction slightly less than 0.57 (air volume fraction at 10 cm H2O); so the attenuation coefficient at 20 cm H2O is significantly smaller than that at 10 cm H2O. The discrepancies between the experimental measurements and the Biot theory prediction show that, even though the viscous dissipation is the major source of dissipation for fast compression wave in the lungs, there likely are other nonnegligible sources of dissipation, including thermal dissipation. In summary, in terms of the compression wave speed and attenuation in the lungs, the Biot theory yields a better prediction than the effective medium theory and the thermal dissipation model.
Fig. 11.
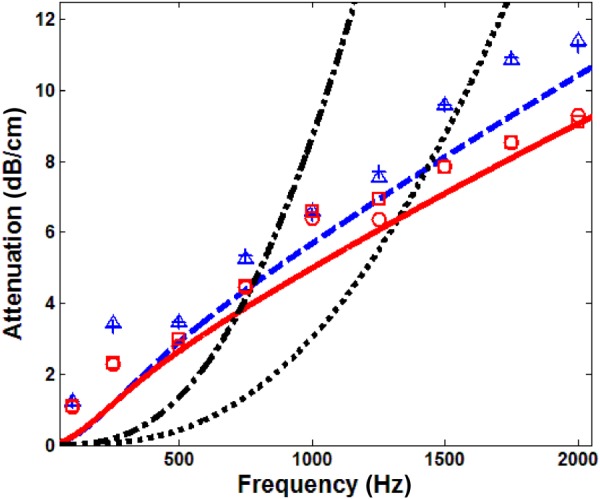
Fast compression wave attenuation, ○ ○ ○ experiment, 20 cm H2O, location 1, ◻ ◻ ◻ experiment, 20 cm H2O, location 2, ––– Biot theory, 20 cm H2O, –.– effective medium model, 20 cm H2O, △ △ △ experiment, 10 cm H2O, location 1, + + + experiment, 10 cm H2O, location 2, – – Biot theory, 10 cm H2O, - - - effective medium model, 10 cm H2O
5. Discussion
In this study, the application of Biot theory treats air as the only fluid in the lungs. As mentioned in Sec. 3, the blood has been drained, at least from the major vessels. Likely, remnants left in the smaller vessels coagulate and are effectively trapped, more aptly treated as part of the solid phase within Biot theory. Another liquid to consider is mucus in the airways; its amount is small compared to that of air in the lung. Within the current theoretical framework, any contribution from the mucus was not directly taken into account. As mucus also affects viscosity in the airways, this might be one of the causes of the discrepancy between measured and predicted fast compression wave attenuation in Fig. 11.
While the permeability was necessarily measured on dried lungs, a possible discrepancy due to drying is that mucus, which was removed from the lung, will no longer impede airflow; so one might expect the permeability to be higher than it would actually be in a fresh lung. To evaluate how changes in permeability affect the fast compression wave group velocity and attenuation, permeability was increased by 10% for each transpulmonary pressure. Theoretically predicted fast compression wave group velocity increased by about 4.5% for both transpulmonary pressures. The attenuation decreased by 0.7% and 0.2% for 20 cm H2O and 10 cm H2O, respectively. This suggests that the fast compression wave group velocity and attenuation were not very sensitive to the possible permeability value discrepancy.
The only other estimates of the quasistatic lung shear modulus the authors are aware of are based on extrapolation of dynamic (frequency response) surface wave speed and MRE measurements to the quasistatic condition. In Zhang et al. [52,53], a Voigt model of shear viscoelasticity with shear modulus and shear viscosity was used to fit the measured frequency-dependent, surface wave speed on a pig lung. The reported value of was 4.68 kPa and 7.99 kPa at 10 cm and 20 cm H2O, respectively, which is higher than our measured values (0.79 and 1.4 kPa). It is noted that variation exists in different lungs and postmortem time also contributes to such differences. In other pig lungs, the authors have measured as high as 1.29 kPa and 2.29 kPa at 10 cm and 20 cm H2O, respectively. In Mariappan et al. [19], based on MRE, the reported dynamic shear stiffness in an in situ porcine lung at 100 Hz was 1.68 and 2.23 kPa at 10 cm and 20 cm H2O, respectively. In Mariappan et al. [54], based on MRE, the reported dynamic shear stiffness in an in vivo human lung at 50 Hz varied throughout the respiratory cycle from 0.9 to 1.6 kPa. Recall that, from Eq. (17), the shear stiffness , so . Taking this all into consideration, the values reported in the present study are in a comparable range to those reported previously using other techniques.
6. Conclusions
Two theoretical models of the vibroacoustic behavior of the lung parenchyma are compared: (1) a Biot theory of poroviscoelasticity and (2) an effective medium theory for compression wave behavior. A fractional derivative formulation of viscoelasticity is integrated into both models. A measurable fast compression wave speed predicted by the Biot theory formulation has a significant frequency dependence, which is not predicted by the effective medium theory. Biot theory also predicts a slow compression wave and a shear wave. The frequency-dependent, compression wave group velocity was measured experimentally from 100 to 2000 Hz by applying narrow-banded pulses on freshly excised pig lung ex vivo. Both the experimentally measured fast compression wave speed and attenuation in an ex vivo pig lung model agreed well with the Biot theory. To obtain the parameters for Biot theory prediction, quasistatic mechanical indentation tests were performed to measure the lung static shear modulus, surface wave measurements were performed to estimate lung tissue shear viscoelasticity, and lung permeability was separately measured on dried lung specimens. The slow compression wave was not observed in the experiment, as the relative motion of the solid and the fluid was impeded by viscous drag due to the relatively large viscous skin depth in the frequency range considered. Compression wave propagation in the lungs has been primarily studied below several hundred Hz, and limited information about wave speed versus frequency has been obtained. In the current study, compression wave speed measurements were extended to 2000 Hz, revealing that the lung is a dispersive medium for both compression and shear waves. This study suggests that the Biot theory may provide a more robust and accurate model than the effective medium theory for wave propagation in the lungs over a wider frequency range.
Acknowledgment
The financial support of the National Institutes of Health (Grant No. EB012142) is acknowledged. The authors also would like to thank Mr. Temal K. Yasar for building the circuits for the microphone and Mr. Abdul Rahman Abutaleb and Mr. Brian Henry for assistance in the pig lung experiment.
Contributor Information
Zoujun Dai, University of Illinois at Chicago, Chicago, IL 60607.
Ying Peng, University of Illinois at Chicago, Chicago, IL 60607.
Hansen A. Mansy, University of Central Florida, Orlando, FL 32816 Rush University Medical Center, Chicago, IL 60612.
Richard H. Sandler, University of Central Florida, Orlando, FL 32816 Nemours Children's Hospital, Orlando, FL 32827.
Thomas J. Royston, University of Illinois at Chicago, Chicago, IL 60607, e-mail: troyston@uic.edu.
References
- [1]. Faffe, D. S. , and Zin, W. A. , 2009, “Lung Parenchymal Mechanics in Health and Disease,” Physiol. Rev., 89, pp. 759–77510.1152/physrev.00019.2007 [DOI] [PMC free article] [PubMed] [Google Scholar]
- [2]. Goldstein, R. H. , Lucey, E. C. , Franzblau, C. , and Snider, G. L. , 1979, “Failure of Mechanical Properties to Parallel Changes in Lung Connective Tissue Composition in Bleomycin-Induced Pulmonary Fibrosis in Hamsters,” Am. Rev. Respir. Dis., 120(1), pp. 67–73 [DOI] [PubMed] [Google Scholar]
- [3]. Ebihara, T. , Venkatesan, N. , Tanaka, R. , and Ludwig, M. S. , 2000, “Changes in Extracellular Matrix and Tissue Viscoelasticity in Bleomycin-Induced Lung Fibrosis. Temporal Aspects,” Am. J. Respir. Crit. Care Med., 162, pp. 1569–157610.1164/ajrccm.162.4.9912011 [DOI] [PubMed] [Google Scholar]
- [4]. Salerno, F. G. , and Ludwig, M. S. , 1999, “Elastic Moduli of Excised Constricted Rat Lungs,” J. Appl. Physiol., 86(1), pp. 66–70 [DOI] [PubMed] [Google Scholar]
- [5]. Kononov, S. , Brewer, K. , Sakai, H. , Cavalcante, F. S. , Sabayanagam, C. R. , Ingenito, E. P. , and Suki, B. , 2001, “Roles of Mechanical Forces and Collagen Failure in the Development of Elastase-Induced Emphysema,” Am. J. Respir. Crit. Care Med., 164, pp. 1920–192610.1164/ajrccm.164.10.2101083 [DOI] [PubMed] [Google Scholar]
- [6]. Ito, S. , Ingenito, E. P. , Brewer, K. K. , Black, L. D. , Parameswaran, H. , Lutchen, K. R. , and Suki, B. , 2005, “Mechanics, Nonlinearity, and Failure Strength of Lung Tissue in a Mouse Model of Emphysema: Possible Role of Collagen Remodeling,” J. Appl. Physiol., 98, pp. 503–51110.1152/japplphysiol.00590.2004 [DOI] [PubMed] [Google Scholar]
- [7]. Chen, Q. , Mai, V. M. , Bankier, A. A. , Napadow, V. J. , Gilbert, R. J. , and Edelman, R. R. , 2001, “Ultrafast MR Grid-Tagging Sequence for Assessment of Local Mechanical Properties of the Lungs,” Magn. Reson. Med., 45(1), pp. 24–2810.1002/1522-2594(200101)45:1<24::AID-MRM1004>3.0.CO;2-6 [DOI] [PubMed] [Google Scholar]
- [8]. Napadow, V. J. , Mai, V. M. , Bankier, A. A. , Gilbert, R. J. , Edelman, R. R. , and Chen, Q. , 2001, “Determination of Regional Pulmonary Parenchymal Strain During Normal Respiration Using Spin Inversion Tagged Magnetization,” J. Magn. Reson. Imaging, 13(3), pp. 467–47410.1002/jmri.1068 [DOI] [PubMed] [Google Scholar]
- [9]. Murphy, R. , 2007, “Computerized Multichannel Lung Sound Analysis: Development of Acoustic Instruments for Diagnosis and Management of Medical Conditions,” IEEE Eng. Med. Bio., 26, pp. 16–1910.1109/MEMB.2007.289117 [DOI] [PubMed] [Google Scholar]
- [10]. Charleston-Villalobos, S. , Cortés-Rubiano, S. , González-Camerena, R. , Chi-Lem, G. , and Aljama-Corrales, T. , 2004, “Respiratory Acoustic Thoracic Imaging (RATHI): Assessing Deterministic Interpolation Techniques,” Med. Biol. Eng. Comput., 42(5), pp. 618–62610.1007/BF02347543 [DOI] [PubMed] [Google Scholar]
- [11]. Kompis, M. , Pasterkamp, H. , and Wodicka, G. R. , 2001, “Acoustic Imaging of the Chest,” Chest, 120, pp. 1309–132110.1378/chest.120.4.1309 [DOI] [PubMed] [Google Scholar]
- [12]. Dellinger, R. P. , Parrillo, J. E. , Kushnir, A. , Rossi, M. , and Kushnir, I. , 2008, “Dynamic Visualization of Lung Sounds With a Vibration Response Device: A Case Series,” Respiration, 75(1), pp. 60–7210.1159/000103558 [DOI] [PubMed] [Google Scholar]
- [13]. Maher, T. M. , Gat, M. , Allen, D. , Devaraj, A. , Wells, A. U. , and Geddes, D. M. , 2008, “Reproducibility of Dynamically Represented Acoustic Lung Images From Healthy Individuals,” Thorax, 63(6), pp. 542–54810.1136/thx.2007.086405 [DOI] [PMC free article] [PubMed] [Google Scholar]
- [14]. Wang, Z. , Jean, S. , and Bartter, T. , 2009, “Lung Sound Analysis in the Diagnosis of Obstructive Airway Disease,” Respiration, 77(2), pp. 134–13810.1159/000178023 [DOI] [PubMed] [Google Scholar]
- [15]. Ozer, M. B. , Acikgoz, S. , Royston, T. J. , Mansy, H. A. , and Sandler, R. H. , 2007, “Boundary Element Model for Simulating Sound Propagation and Source Localization Within the Lungs,” J. Acoust. Soc. Am., 122(1), pp. 657–67110.1121/1.2715453 [DOI] [PubMed] [Google Scholar]
- [16]. Goss, B. C. , McGee, K. P. , Ehman, E. C. , Manduca, A. , and Ehman, R. L. , 2006, “Magnetic Resonance Elastography of the Lung: Technical Feasibility,” Magn. Reson. Med., 56, pp. 1060–106610.1002/mrm.21053 [DOI] [PubMed] [Google Scholar]
- [17]. McGee, K. P. , Hubmayr, R. D. , and Ehman, R. L. , 2008, “MR Elastography of the Lung With Hyperpolarized 3He,” Magn. Reson. Med., 59, pp. 14–1810.1002/mrm.21465 [DOI] [PubMed] [Google Scholar]
- [18]. McGee, K. P. , Lake, D. , Mariappan, Y. , Hubmayr, R. D. , Manduca, A. , Ansell, K. , and Ehman, R. L. , 2011, “Calculation of Shear Stiffness in Noise Dominated Magnetic Resonance Elastography Data Based on Principal Frequency Estimation,” Phys. Med. Biol., 56, pp. 4291–430910.1088/0031-9155/56/14/006 [DOI] [PMC free article] [PubMed] [Google Scholar]
- [19]. Mariappan, Y. K. , Kolipaka, A. , Manduca, A. , Hubmayr, R. D. , Ehman, R. L. , Araoz, P. , and McGee, K. P. , 2012, “Magnetic Resonance Elastography of the Lung Parenchyma in an In Situ Porcine Model With a Noninvasive Mechanical Driver: Correlation of Shear Stiffness With Trans-Respiratory System Pressures,” Magn. Reson. Med., 67, pp. 210–21710.1002/mrm.22976 [DOI] [PMC free article] [PubMed] [Google Scholar]
- [20]. Sinkus, R. , Tanter, M. , Xydeas, T. , Catheline, S. , Bercoff, J. , and Fink, M. , 2005, “Viscoelastic Shear Properties of In Vivo Breast Lesions Measured by MR Elastography,” Magn. Reson. Imaging, 23(2), pp. 159–16510.1016/j.mri.2004.11.060 [DOI] [PubMed] [Google Scholar]
- [21]. Shah, N. S. , Kruse, S. A. , Lager, D. J. , Farell-Baril, G. , Lieske, J. C. , King, B. F. , and Ehman, R. L. , 2004, “Evaluation of Renal Parenchymal Disease in a Rat Model With Magnetic Resonance Elastography,” Magn. Reson. Med., 52(1), pp. 56–6410.1002/mrm.20101 [DOI] [PubMed] [Google Scholar]
- [22]. Kemper, J. , Sinkus, R. , Lorenzen, J. , Nolte-Ernsting, C. , Stork, A. , and Adam, G. , 2004, “MR Elastography of the Prostate: Initial In-Vivo Application,” Rofo, 176(8), pp. 1094–109910.1055/s-2004-813279 [DOI] [PubMed] [Google Scholar]
- [23]. Jenkyn, T. R. , Ehman, R. L. , and An, K. , 2003, “Noninvasive Muscle Tension Measurement Using the Novel Technique of Magnetic Resonance Elastography (MRE),” J. Biomech., 36(12), pp. 1917–192110.1016/S0021-9290(03)00005-8 [DOI] [PubMed] [Google Scholar]
- [24]. Klatt, D. , Hamhaber, U. , Asbach, P. , Braun, J. , and Sack, I . , 2007, “Noninvasive Assessment of the Rheological Behavior of Human Organs Using Multifrequency MR Elastography: A Study of Brain and Liver Viscoelasticity,” Phys. Med. Biol., 52(24), pp. 7281–729410.1088/0031-9155/52/24/006 [DOI] [PubMed] [Google Scholar]
- [25]. Rice, D. A. , 1983, “Sound Speed in Pulmonary Parenchyma,” J. Appl. Physiol., 54(1), pp. 304–308 [DOI] [PubMed] [Google Scholar]
- [26]. Wodicka, G. R. , Stevens, K. N. , Golub, H. L. , Cravalho, E. G. , and Shannon, D. C. , 1989, “A Model of Acoustic Transmission in the Respiratory System,” IEEE Trans. Biomed. Eng., 36, pp. 925–93410.1109/10.35301 [DOI] [PubMed] [Google Scholar]
- [27]. Royston, T. J. , Zhang, X. , Mansy, H. A. , and Sandler, R. H. , 2002, “Modeling Sound Transmission Through the Pulmonary System and Chest With Application to Diagnosis of a Collapsed Lung,” J. Acoust. Soc. Am., 111(4), pp. 1931–194610.1121/1.1452742 [DOI] [PubMed] [Google Scholar]
- [28]. Siklosi, M. , Jensen, O. E. , Tew, R. H. , and Logg, A. , 2008, “Multiscale Modeling of the Acoustic Properties of Lung Parenchyma,” ESAIM: Proc., 23, pp. 78–9710.1051/proc:082306 [Google Scholar]
- [29]. Royston, T. J. , Dai, Z. , Chaunsali, R. , Liu, Y. , Peng, Y. , and Magin, R. L. , 2011, “Estimating Material Viscoelastic Properties Based on Surface Wave Measurements: A Comparison of Techniques and Modeling Assumptions,” J. Acoust. Soc. Am., 130(6), pp. 4126–413810.1121/1.3655883 [DOI] [PMC free article] [PubMed] [Google Scholar]
- [30]. Yasar, T. K. , Royston, T. J. , and Magin, R. L. , 2013, “Wideband MR Elastography for Viscoelasticity Model Identification,” Magn. Reson. Med., 70, pp. 479–48910.1002/mrm.24495 [DOI] [PMC free article] [PubMed] [Google Scholar]
- [31]. Kiss, M. Z. , Varghese, T. , and Hall, T. J. , 2004, “Viscoelastic Characterization of In Vitro Canine Tissue,” Phys. Med. Biol., 49(18), pp. 4207–421810.1088/0031-9155/49/18/002 [DOI] [PMC free article] [PubMed] [Google Scholar]
- [32]. Kohandel, M. , Sivaloganathan, S. , Tenti, G. , and Darvish, K. , 2005, “Frequency Dependence of Complex Moduli of Brain Tissue Using a Fractional Zener Model,” Phys. Med. Biol., 50(12), pp. 2799–280610.1088/0031-9155/50/12/005 [DOI] [PubMed] [Google Scholar]
- [33]. Sinkus, R. , Siegmann, K. , Xydeas, T. , Tanter, M. , Claussen, C. , and Fink, M. , 2007, “MR Elastography of Breast Lesions: Understanding the Solid/Liquid Duality Can Improve the Specificity of Contrast-Enhanced MR Mammography,” Magn. Reson. Med., 58(6), pp. 1135–114410.1002/mrm.21404 [DOI] [PubMed] [Google Scholar]
- [34]. Zhang, M. , Castaneda, B. , Wu, Z. , Nigwekar, P. , Joseph, J. V. , Rubens, D. J. , and Parker, K. J. , 2007, “Congruence of Imaging Estimators and Mechanical Measurements of Viscoelastic Properties of Soft Tissues,” Ultrasound Med. Biol., 33(10), pp. 1617–163110.1016/j.ultrasmedbio.2007.04.012 [DOI] [PMC free article] [PubMed] [Google Scholar]
- [35]. Riek, K. , Klatt, D. , Nuzha, H. , Mueller, S. , Neumann, U. , Sack, I. , and Braun, J. , 2011, “Wide-Range Dynamic Magnetic Resonance Elastography,” J. Biomech., 44(7), pp. 1380–138610.1016/j.jbiomech.2010.12.031 [DOI] [PubMed] [Google Scholar]
- [36]. Biot, M. A. , 1956, “Theory of Propagation of Elastic Waves in a Fluid-Saturated Porous Solid. I. Low-Frequency Range,” J. Acoust. Soc. Am., 28(2), pp. 168–17810.1121/1.1908239 [Google Scholar]
- [37]. Biot, M. A. , 1956, “Theory of Propagation of Elastic Waves in a Fluid-Saturated Porous Solid. II. Higher Frequency Range,” J. Acoust. Soc. Am., 28(2), pp. 179–19110.1121/1.1908241 [Google Scholar]
- [38]. Schanz, M. , 2001, Wave Propagation in Viscoelastic and Poroelastic Continua: A Boundary Element Approach, Springer, Berlin [Google Scholar]
- [39]. Bonnet, G. , and Auriault, J. L. , 1985, “Dynamics of Saturated and Deformable Porous Media: Homogenization Theory and Determination of the Solid-Liquid Coupling Coefficients,” Physics of Finely Divided Matter, Springer, Berlin [Google Scholar]
- [40]. Smeulders, D. M. J. , 1992, “On Wave Propagation in Saturated and Partially Saturated Porous Media,” Ph.D. dissertation, Technische Universiteit Eindhoven, Eindhoven, Netherlands. [Google Scholar]
- [41]. Bourbie, T. , Coussy, O. , and Zinszner, B. , 1987, Acoustics of Porous Media, Gulf, Houston, TX [Google Scholar]
- [42]. Timoshenko, S. P. , and Goodier, J. N. , 1970, Theory of Elasticity, 3rd ed., McGraw-Hill, New York [Google Scholar]
- [43]. Butler, J. P. , Nakamura, M. , Sasaki, H. , Sasaki, T. , and Takishima, T. , 1986, “Poissons' Ratio of Lung Parenchyma and Parenchymal Interaction With Bronchi,” Jpn. J. Physiol., 36(1), pp. 91–10610.2170/jjphysiol.36.91 [DOI] [PubMed] [Google Scholar]
- [44]. Lai-Fook, S. , and Hyatt, R. , 2000, “Effects of Age on Elastic Moduli of Human Lungs,” J. Appl. Physiol., 89(1), pp. 163–168 [DOI] [PubMed] [Google Scholar]
- [45]. Graff, K. F. , 1991, Wave Motion in Elastic Solids, Dover, New York [Google Scholar]
- [46]. Hajari, A. J. , Yablonskiy, D. A. , Quirk, J. D. , Sukstanskii, A. L. , Pierce, R. A. , Deslée, G. , Conradi, M. S. , and Woods, J. C. , 2011, “Imaging Alveolar-Duct Geometry During Expiration Via 3He Lung Morphometry,” J. Appl. Physiol., 110, pp. 1448–145410.1152/japplphysiol.01352.2010 [DOI] [PMC free article] [PubMed] [Google Scholar]
- [47]. Plona, T. J. , 1980, “Observation of a Second Bulk Compressional Wave in a Porous Medium at Ultrasonic Frequencies,” Appl. Phys. Lett., 36, pp. 259–26110.1063/1.91445 [Google Scholar]
- [48]. Lakes, R. , Yoon, H. S. , and Katz, J. L. , 1983, “Slow Compressional Wave Propagation in Wet Human and Bovine Cortical Bone,” Science, 220(4596), pp. 513–51510.1126/science.6836296 [DOI] [PubMed] [Google Scholar]
- [49]. von Gierke, H. E. , Oestreicher, H. L. , Franke, E. K. , Parrack, H. O. , and von Wittern, W. W. , 1952, “Physics of Vibrations in Living Tissue,” J. Appl. Physiol., 4, pp. 886–900 [DOI] [PubMed] [Google Scholar]
- [50]. Hajari, A. J. , Yablonskiy, D. A. , Sukstanskii, A. L. , Quirk, J. D. , Conradi, M. S. , and Woods, J. C. , 2012, “Morphometric Changes in the Human Pulmonary Acinus During Inflation,” J. Appl. Physiol., 112, pp. 937–94310.1152/japplphysiol.00768.2011 [DOI] [PMC free article] [PubMed] [Google Scholar]
- [51]. Yen, R. T. , Fung, Y. C. , Ho, H. H. , and Butterman, G. , 1986, “Speed of Stress Wave Propagation in Lung,” J. Appl. Physiol., 61(2), pp. 701–705 [DOI] [PubMed] [Google Scholar]
- [52]. Zhang, X. M. , Kinnick, R. R. , and Greenleaf, J. F. , 2008, “Viscoelasticity of Lung Tissue With Surface Wave Method,” IEEE Ultrasonics Symposium (IUS 2008), Beijing, November 2–5, pp. 21–2310.1109/ULTSYM.2008.0006 [Google Scholar]
- [53]. Zhang, X. M. , Qiang, B. , Urban, M. W. , Kinnick, R. R. , Hubmayr, R. , and Greenleaf, J. F. , 2009, “Quantitative Surface Wave Method for Measuring Local Viscoelasticity of Lungs,” IEEE International Ultrasonics Symposium (IUS 2009), Rome, September 20–23, pp. 479–48210.1109/ULTSYM.2009.5441822 [Google Scholar]
- [54]. Mariappan, Y. K. , Glaser, K. J. , Levin, D. L. , Vassallo, R. , Hubmayr, R. D. , Mottram, C. , Ehman, R. L. , and McGee, K. P. , “Estimation of the Absolute Shear Stiffness of Human Lung Parenchyma Using 1H Spin Echo, Echo Planar MR Elastography,” J. Magn. Reson. Imaging, (in press).10.1002/jmri.24479 [DOI] [PMC free article] [PubMed] [Google Scholar]


