

Abstract
Objective
Zinc-Alpha 2-Glycoprotein (ZAG) has recently been implicated in the regulation of adipose tissue metabolism due to its negative association with obesity and insulin resistance. The purpose of this study is to investigate the relationships between adipose tissue ZAG expression and central obesity, and the effects of six-months of weight loss (WL) or aerobic exercise + weight loss (AEX+WL) on ZAG expression.
Design and Methods
A six-month, longitudinal study of 33 healthy, overweight or obese postmenopausal women (BMI: 25–46 kg/m2) was conducted. Abdominal and gluteal adipose tissue samples were obtained before and after AEX+WL (n=17) and WL (n=16). ZAG expression was determined by RT-PCR.
Results
Prior to interventions, abdominal ZAG expression was negatively correlated with visceral fat (r=−0.50, P<0.005), sagittal diameter (r=−0.42, P<0.05), and positively related to VO2max (r=0.37, P<0.05). Gluteal ZAG expression was negatively correlated with weight, fat-free mass, visceral fat, resting metabolic rate, and fasting insulin (r=−0.39 to −0.50, all P<0.05). Abdominal ZAG mRNA levels increased, though not significantly, 5% after AEX+WL and 11% after WL. Gluteal ZAG mRNA levels also did not change significantly with AEX+WL and WL.
Conclusions
Abdominal ZAG expression may be important in central fat accumulation and fitness that modestly but not significantly increases with weight reduction alone or with aerobic training in obese postmenopausal women.
Keywords: ZAG, weight loss, aerobic exercise, obesity, aging
INTRODUCTION
Twenty-five percent of adults in the U.S. suffer from obesity and obesity-related health risks1. ZAG has recently been implicated in the regulation of adipose tissue metabolism due to its negative correlation with obesity2. Originally discovered in plasma of cancer cachexia patients, ZAG is overexpressed by various malignant tumors and later shown secreted by healthy tissue3,4,5.
Much of the known molecular mechanisms of ZAG are derived from animal studies. Research shows that the introduction of ZAG producing tumors leads to up-regulation of ZAG in adipose tissue accompanied by profound WL due to fat depletion, without changing FFM or nutrient intake1, 6. ZAG knockout animals are more prone to weight gain than their wild-type siblings when given a high-fat diet7, 8. In addition, treatment with β-AR agonists stimulates ZAG production while β-AR antagonists suppress it, implying overexpression of ZAG is most likely regulated through β-AR and the sympathetic system in cachectic mice3, 4. Since the administration of isolated human ZAG to mice via drinking water causes an increase in endogenous murine serum and adipose ZAG protein and mRNA, ZAG may induce its own regulation4.
There are limited human studies of ZAG expression and little is known of ZAG’s role in fitness, energy expenditure and body composition. Plasma ZAG levels are not different between lean and obese young and middle-aged adults7. In contrast, ZAG expression is significantly lower in omental and subcutaneous adipose tissue as well as liver of morbidly obese individuals compared to non-obese individuals2. Considering the interplay between physical activity and obesity, it is conceivable that ZAG expression could be influenced by WL and exercise. We propose a novel hypothesis that adipose tissue ZAG expression is inversely related to visceral and subcutaneous abdominal fat area, aerobic capacity, and glucose tolerance, and that exercise and WL could increase ZAG expression. Our purpose was to investigate these relationships and to test the effects of six months of AEX+WL or WL alone on ZAG expression.
RESEARCH METHODS
Healthy, overweight/obese (BMI>25 kg/m2), postmenopausal women aged 50–78 years were screened by medical history, physical examination, fasting blood profile, and treadmill test, and showed no evidence of any medical disorders. Women were nonsmokers, weight stable, and sedentary. Data are reported here on 33 women who met study criteria, completed AEX+WL (n=17) and WL (n=16), and had adipose tissue aspirations. The study sample was Caucasian (n=22) and African American (n=11). The Institutional Review Board of University of Maryland approved all methods and procedures. Each participant provided written informed consent.
Study Protocol
Physical Characteristics
Height, weight, waist circumference, VO2max and body composition by dual-energy X-ray absorptiometry and computed tomography were determined as described9. CT Scans were missing due to scheduling conflicts (n=3 WL and n=3 AEX+WL) or small field of view to determine abdominal subcutaneous fat (WL n=9 and AEX+WL n=7).
Fat aspirations with RT-PCR, OGTT, and blood samples
Women were instructed in TLC diet by a registered dietitian 1x/week for 6–8 weeks prior to the fat aspiration and OGTT10. Subjects were weight stable (±2%) at least two weeks prior to baseline testing, and maintained the TLC diet throughout the study. Women were provided with an eucaloric diet for two days before abdominal and gluteal fat aspirations were performed after a 12-hr overnight fast and 36–48 hours after the last exercise bout for AEX+WL11. Total RNA was first extracted from adipose tissue and RT-PCR conducted as described11. A two-hour OGTT with measurement of plasma glucose and insulin were performed9.
WL and AEX+WL
For six months, all women attended weekly WL classes and restricted caloric intake by 500 kcal/d. The AEX+WL group used treadmills and elliptical trainers three times a week for 6 months at the exercise facility9. There was a ~86% average compliance to exercise and WL classes.
Statistical Analyses
Univariate ANOVA tested for differences in changes between AEX+WL and WL. Paired t-tests tested differences between pre- and post-intervention measures within each intervention. Regression analyses determined relationships between adipose tissue ZAG, body composition, and glucose metabolism. Data were analyzed by SPSS (PASW Statistics 18) (SPSS Inc., Chicago), expressed as mean±SEM, and significance at P<0.05.
RESULTS
Prior to the interventions, abdominal ZAG mRNA were negatively correlated with VAT (r=−0.50, P=0.003, Figure 1a) and sagittal diameter (r=−0.42, P<0.05). In addition, abdominal ZAG was related to VO2max (r=0.34, P=0.05, n=31). In a multiple regression analyses with VAT and VO2max, VAT remained an independent predictor of abdominal ZAG (P=0.03). Gluteal ZAG mRNA were negatively correlated with weight (r=−0.39, P<0.05, n=32), FFM (r=−0.39, P<0.05, n=32), VAT (r=−0.41, P<0.05, n=33), RMR (r=−0.50, P<0.01, n=29), and fasting insulin (r=−0.42, P<0.05, n=32, Figure 1b). In a multiple regression analyses with weight, FFM, VAT, RMR and insulin, RMR remained an independent predictor of gluteal ZAG (P=0.02). Abdominal and gluteal ZAG mRNA were both related to muscle attenuation (r=0.39, P<0.05 and r=0.31, P=0.08, n=32, respectively). Neither abdominal nor gluteal mRNA were related to subcutaneous abdominal fat, fasting or 120 min glucose.
Figure 1.
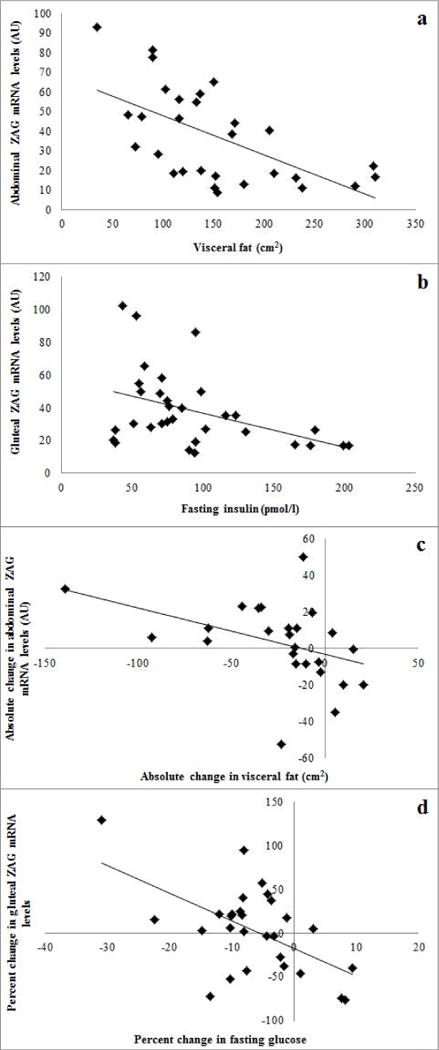
(a) The relationship between abdominal ZAG mRNA levels and VAT mass (r=−0.50, P<0.005). (b) The relationship between gluteal ZAG mRNA levels and fasting insulin (r=−0.42, P< 0.05). (c) The relationship between absolute changes in abdominal ZAG mRNA expression and absolute changes in VAT mass (r=−0.40, P=0.05). (d) The relationship between percent change in gluteal ZAG mRNA expression and percent change in fasting glucose (r=−0.54, P<0.01).
There were no significant differences in baseline age, weight, BMI, VO2max, body composition, fasting glucose, 2-hour glucose, and fasting insulin between WL and AEX+WL (Table 1). Fifteen women had impaired glucose tolerance in the combined group (WL, n=8 and AEX+WL, n=7).
Table 1.
Effects of AEX+WL and WL interventions
| AEX+WL (n=17) | WL (n=16) | |||
|---|---|---|---|---|
|
| ||||
| Pre | Post | Pre | Post | |
|
|
||||
| Weight (kg) | 87 ± 5 | 80 ± 5‡ | 96 ± 3 | 87 ± 3‡ |
| Percent body fat | 47 ± 2 | 44± 2‡ | 49 ± 1 | 47 ± 1‡ |
| Fat mass (kg) | 43 ± 4 | 36 ± 3‡ | 48 ± 2 | 41 ± 2‡ |
| FFM (kg) | 46 ± 2 | 45 ± 2 | 49 ± 1 | 46 ± 1‡ |
| VAT (cm2) | 145 ± 25 | 130 ± 22 | 164 ± 17 | 131 ± 10* |
| Sagittal diameter (mm) | 25 ± 2 | 23 ± 1‡ | 27 ± 1 | 24.8 ± 1† |
| Subcutaneous abdominal fat (cm2) | 437 ± 38 | 347 ± 46† | 430 ± 45 | 420 ± 35 |
| Muscle attenuation (HU) | 37 ± 3 | 41 ± 3 | 36 ± 2 | 34 ± 2 |
| RMR (kcal/day) | 1468 ± 59 | 1368 ± 75 | 1704 ± 89 | 1536 ± 109 |
| VO2max (1/min) | 1.74 ± 0.20 | 1.95 ± 0.23† | 1.59 ± 0.12 | 1.60 ± 0.10 |
| Fasting glucose (mmol/l) | 93 ± 2 | 89 ± 2 | 100 ± 3 | 91 ± 2† |
| Glucose@ 120 min (mmol/1) | 130 ± 8 | 125 ± 7 | 139 ± 14 | 124 ± 8 |
| Fasting insulin (pmol/1) | 83 ± 12 | 63 ± 7* | 102 ± 10 | 74 ± 7* |
P<0.05;
P<0.01;
P<0.001.
There was a ~8% decrease in body weight after AEX+WL and WL (both P<0.001, Table 1) with reductions in percent body fat (both P<0.001), fat mass (both P<0.001), and sagittal diameter (P<0.01). VAT decreased after WL (P<0.05) and AEX+WL (P=0.05). Subcutaneous abdominal fat decreased after AEX+WL (P<0.01). FFM decreased only with WL (P<0.001). VO2max increased 10% after AEX+WL (P<0.01). RMR did not change. Fasting insulin decreased 24% after AEX+WL and 27% after WL (both P<0.05).
Abdominal ZAG mRNA increased 5% after AEX+WL (39.5±5.4 vs. 41.4±6.8) and 11% after WL (29.2±4.8 vs. 32.3±3.5) but were not statistically significant. After removal of four people whose VO2max did not improve more than 5% after AEX+WL, abdominal ZAG mRNA increased 20% (36.8±6.9 vs. 44.0±8.7, n=12, P=0.15). Gluteal ZAG mRNA also did not change significantly with AEX+WL (46.6±7.2 vs. 44.0±6.7) and WL (28.8±2.9 vs. 24.3±2.7). In the total group, the absolute change in abdominal ZAG mRNA was negatively correlated with changes in VAT (r=−0.40, P=0.05, n=24, Figure 1c). In the total group, the absolute and percent changes in gluteal ZAG mRNA are negatively correlated with absolute (r=−0.45, P<0.05, n=25) as well as percent changes (r=−0.54, P=0.005, n=25, Figure 1d) in fasting plasma glucose, respectively. In AEX+WL group, the percent change in gluteal ZAG mRNA was negatively correlated with the percent change in fasting glucose (r=−0.79, P<0.0001).
DISCUSSION
We are the first to investigate the effects of AEX+WL and WL on adipose tissue ZAG expression. Our study demonstrates that low ZAG expression is associated with obesity, fitness, and hyperinsulinemia. Although increases in ZAG expression after WL or AEX+WL were not statistically significant, the inverse relationships between increased ZAG expression and loss of VAT and reduction in fasting glucose lend support to the idea that modifications to ZAG are potentially important to changes in abdominal obesity and glycemia.
ZAG promotes lipid metabolism through β-AR, stimulates uncoupler proteins in the mitochondria inner membrane to increase energy expenditure, increases number of skeletal muscle glucose transporters, stimulates AMP-activated protein kinase and acetyl-CoA carboxylase activity that promote fatty acid oxidation and glycerol release, and inhibits the activity of several key enzymes in the lipogenesis pathway1, 4, 8, 12. Due to its anti-obesity effects, ZAG is now considered a target for future therapeutic approaches.
In our subjects, weight, fat mass, VAT, and sagittal diameter are negatively correlated with ZAG, which could support that ZAG promotes lipolysis and the utilization of body fat via the stimulation of important enzymes that promote fatty acid oxidation and inhibit lipogenesis. The strong negative correlation of ZAG with VAT suggests that ZAG protein may induce loss of fat around organs. The positive correlation of ZAG with muscle attenuation suggests that ZAG may promote fat oxidation in skeletal muscle and reduce intramuscular fat. The changes in ZAG with interventions suggest that those with a greater increase in ZAG lost more VAT and reduced hyperglycemia.
Previous murine studies have shown that ZAG may stimulate uncoupler proteins in the mitochondria inner membrane to increase energy expenditure through proton gradient dissipation13. This may suggest that an increase in ZAG could increase RMR. We observed a negative correlation between ZAG expression and RMR prior to the interventions. It is possible that an exercise intervention that increases RMR and muscle mass such as resistive training is necessary to increase ZAG14–18. Given that WL can drive a reduction in RMR due to a loss of FFM, the reduction of body weight and loss of FFM with WL may be counterproductive to an increase in ZAG expression19, 20.
There are several limitations to the present study including the small sample size, and representation of only postmenopausal women. Nevertheless, this study gave us new insight that ZAG expression can be upregulated modestly by WL and exercise training.
CONCLUSIONS
Our major novel finding is that ZAG expression is related to markers of abdominal obesity. We have shown for the first time that WL and AEX+WL have only a modest but not significant effect on altering ZAG levels. Future studies could be conducted to understand the role of ZAG expression on fat oxidation and it’s implication in both total and central obesity.
Acknowledgments
We thank the participants and staff for assistance. Support: VA Research Career Scientist Award, VA Merit Award, Baltimore Geriatric Research, Education and Clinical Center, NIH-R01-AG-019310, RO1-AG-20116, M01-RR016500, DK072488, and P30-AG-12583.
Abbreviations
- ZAG
zinc-α2-glycoprotein
- WL
weight loss
- AEX+WL
aerobic exercise+weight loss
- β-AR
β-adrenergic receptors
- RMR
resting metabolic rate
- FFM
fat-freemass
- TLC
therapeutic lifestyle changes
- OGTT
oral glucose tolerance test
- VAT
visceral fat
Footnotes
Publisher's Disclaimer: This is a PDF file of an unedited manuscript that has been accepted for publication. As a service to our customers we are providing this early version of the manuscript. The manuscript will undergo copyediting, typesetting, and review of the resulting proof before it is published in its final citable form. Please note that during the production process errors may be discovered which could affect the content, and all legal disclaimers that apply to the journal pertain.
The authors have no conflict of interest.
Clinical Trials: NCT00882141
Author Contributions:
ASR designed the research; both authors contributed to the analysis, interpretation, drafting, and editing of the manuscript.
References
- 1.Russell ST, Tisdale MJ. Studies on the anti-obesity activity of zinc-alpha2-glycoprotein in the rat. Int J Obes (Lond) 2011;35:658–65. doi: 10.1038/ijo.2010.193. [DOI] [PubMed] [Google Scholar]
- 2.Selva DM, Lecube A, Hernandez C, Baena JA, Fort JM, Simo R. Lower zinc-alpha2-glycoprotein production by adipose tissue and liver in obese patients unrelated to insulin resistance. J Clin Endocrinol Metab. 2009;94:4499–507. doi: 10.1210/jc.2009-0758. [DOI] [PubMed] [Google Scholar]
- 3.Mracek T, Stephens NA, Gao D, et al. Enhanced ZAG production by subcutaneous adipose tissue is linked to weight loss in gastrointestinal cancer patients. Br J Cancer. 2011;104:441–7. doi: 10.1038/sj.bjc.6606083. [DOI] [PMC free article] [PubMed] [Google Scholar]
- 4.Russell ST, Tisdale MJ. Role of beta-adrenergic receptors in the oral activity of zinc-alpha2-glycoprotein (ZAG) Endocrinology. 2012;153:4696–704. doi: 10.1210/en.2012-1260. [DOI] [PubMed] [Google Scholar]
- 5.Tada T, Ohkubo I, Niwa M, Sasaki M, Tateyama H, Eimoto T. Immunohistochemical localization of Zn-alpha 2-glycoprotein in normal human tissues. J Histochem Cytochem. 1991;39:1221–6. doi: 10.1177/39.9.1918940. [DOI] [PubMed] [Google Scholar]
- 6.Russell ST, Tisdale MJ. Antidiabetic properties of zinc-alpha2-glycoprotein in ob/ob mice. Endocrinology. 2010;151:948–57. doi: 10.1210/en.2009-0827. [DOI] [PubMed] [Google Scholar]
- 7.Garrido-Sanchez L, Garcia-Fuentes E, Fernandez-Garcia D, et al. Zinc-alpha 2-glycoprotein gene expression in adipose tissue is related with insulin resistance and lipolytic genes in morbidly obese patients. PLoS One. 2012;7:e33264. doi: 10.1371/journal.pone.0033264. [DOI] [PMC free article] [PubMed] [Google Scholar]
- 8.Eckardt K, Schober A, Platzbecker B, et al. The adipokine zinc-alpha2-glycoprotein activates AMP kinase in human primary skeletal muscle cells. Arch Physiol Biochem. 2011;117:88–93. doi: 10.3109/13813455.2011.560950. [DOI] [PubMed] [Google Scholar]
- 9.Ryan AS, Ortmeyer HK, Sorkin JD. Exercise with calorie restriction improves insulin sensitivity and glycogen synthase activity in obese postmenopausal women with impaired glucose tolerance. Am J Physiol Endocrinol Metab. 2012;302:E145–52. doi: 10.1152/ajpendo.00618.2010. [DOI] [PMC free article] [PubMed] [Google Scholar]
- 10.Lichtenstein AH, Appel LJ, Brands M, et al. Summary of American Heart Association Diet and Lifestyle Recommendations revision 2006. Arterioscler Thromb Vasc Biol. 2006;26:2186–91. doi: 10.1161/01.ATV.0000238352.25222.5e. [DOI] [PubMed] [Google Scholar]
- 11.Ryan AS, Ge SX, Blumenthal JB, Serra MC, Prior SJ, Goldberg AP. Aerobic Exercise and Weight Loss Reduce Vascular Markers of Inflammation and Improve Insulin Sensitivity in Obese Women. Journal of American Geriatrics Society. 2014 doi: 10.1111/jgs.12749. [DOI] [PMC free article] [PubMed] [Google Scholar]
- 12.Gong FY, Zhang SJ, Deng JY, et al. Zinc-alpha2-glycoprotein is involved in regulation of body weight through inhibition of lipogenic enzymes in adipose tissue. Int J Obes (Lond) 2009;33:1023–30. doi: 10.1038/ijo.2009.141. [DOI] [PubMed] [Google Scholar]
- 13.Russell ST, Zimmerman TP, Domin BA, Tisdale MJ. Induction of lipolysis in vitro and loss of body fat in vivo by zinc-alpha2-glycoprotein. Biochim Biophys Acta. 2004;1636:59–68. doi: 10.1016/j.bbalip.2003.12.004. [DOI] [PubMed] [Google Scholar]
- 14.Jennings AE, Alberga A, Sigal RJ, Jay O, Boule NG, Kenny GP. The effect of exercise training on resting metabolic rate in type 2 diabetes mellitus. Med Sci Sports Exerc. 2009;41:1558–65. doi: 10.1249/MSS.0b013e31819d6a6f. [DOI] [PubMed] [Google Scholar]
- 15.Pratley R, Nicklas B, Rubin M, et al. Strength training increases resting metabolic rate and norepinephrine levels in healthy 50- to 65-yr-old men. J Appl Physiol. 1994;76:133–7. doi: 10.1152/jappl.1994.76.1.133. [DOI] [PubMed] [Google Scholar]
- 16.Ryan AS, Pratley RE, Elahi D, Goldberg AP. Resistive training increases fat-free mass and maintains RMR despite weight loss in postmenopausal women. J Appl Physiol. 1995;79:818–23. doi: 10.1152/jappl.1995.79.3.818. [DOI] [PubMed] [Google Scholar]
- 17.Geliebter A, Maher MM, Gerace L, Gutin B, Heymsfield SB, Hashim SA. Effects of strength or aerobic training on body composition, resting metabolic rate, and peak oxygen consumption in obese dieting subjects. Am J Clin Nutr. 1997;66:557–63. doi: 10.1093/ajcn/66.3.557. [DOI] [PubMed] [Google Scholar]
- 18.Lemmer JT, Ivey FM, Ryan AS, et al. Effect of strength training on resting metabolic rate and physical activity: age and gender comparisons. Med Sci Sports Exerc. 2001;33:532–41. doi: 10.1097/00005768-200104000-00005. [DOI] [PubMed] [Google Scholar]
- 19.Johannsen DL, Knuth ND, Huizenga R, Rood JC, Ravussin E, Hall KD. Metabolic slowing with massive weight loss despite preservation of fat-free mass. J Clin Endocrinol Metab. 2012;97:2489–96. doi: 10.1210/jc.2012-1444. [DOI] [PMC free article] [PubMed] [Google Scholar]
- 20.Chaput JP, Drapeau V, Hetherington M, Lemieux S, Provencher V, Tremblay A. Psychobiological effects observed in obese men experiencing body weight loss plateau. Depress Anxiety. 2007;24:518–21. doi: 10.1002/da.20264. [DOI] [PubMed] [Google Scholar]