Abstract
Objective:
Quantitatively evaluate whether screening with compressed spectral arrays (CSAs) is a practical and time-effective protocol for assisting expert review of continuous EEG (cEEG) studies in hospitalized adults.
Methods:
Three neurophysiologists reviewed the reported findings of the first 30 minutes of 118 cEEGs, then used CSA to guide subsequent review (“CSA-guided review” protocol). Reviewers viewed 120 seconds of raw EEG data surrounding suspicious CSA segments. The same neurophysiologists performed independent page-by-page visual interpretation (“conventional review”) of all cEEGs. Independent conventional review by 2 additional, more experienced neurophysiologists served as a gold standard. We compared review times and detection rates for seizures and other pathologic patterns relative to conventional review.
Results:
A total of 2,092 hours of cEEG data were reviewed. Average times to review 24 hours of cEEG data were 8 (±4) minutes for CSA-guided review vs 38 (±17) minutes for conventional review (p < 0.005). Studies containing seizures required longer review: 10 (±4) minutes for CSA-guided review vs 44 (±20) minutes for conventional review (p < 0.005). CSA-guided review was sensitive for seizures (87.3%), periodic epileptiform discharges (100%), rhythmic delta activity (97.1%), focal slowing (98.7%), generalized slowing (100%), and epileptiform discharges (88.5%).
Conclusions:
CSA-guided review reduces cEEG review time by 78% with minimal loss of sensitivity compared with conventional review.
Classification of evidence:
This study provides Class IV evidence that screening of cEEG with CSAs efficiently and accurately identifies seizures and other EEG abnormalities as compared with standard cEEG visual interpretation.
Many studies have shown that nonconvulsive seizures are common in critically ill patients.1–11 Consequently, there has recently been a marked increase in the use of continuous EEG (cEEG) monitoring.12–15 cEEG findings are often dynamic and have immediate management implications, thus requiring frequent review. Quantitative EEG tools are increasingly used to expedite data review, particularly in centers with large monitoring volumes.16,17 In particular, compressed spectral arrays (CSAs, spectrograms) display 2 to 8 hours of cEEG in a single color map, which may allow electroencephalographers (EEGers) to screen long periods quickly to determine which segments require further direct review of the primary EEG data. Furthermore, certain EEG features such as voltage asymmetries, abrupt changes such as movement artifacts and seizures, gradual trends in background activity,18,19 and changes in patterns of recurrent cyclic seizures, may be easily recognized using CSA.20
Despite increasingly widespread clinical adoption, the empirical performance of CSA-based cEEG review has received little rigorous study. We hypothesized that the time required for expert review of selected segments of raw cEEG data when guided by CSA-based screening is less than that required for conventional review of the entire raw cEEG, without meaningfully compromising sensitivity for seizures or other critical findings.
METHODS
Level of evidence.
The aim of this Class IV evidence study was to determine whether screening of cEEG with CSA efficiently and accurately identifies seizures and other EEG abnormalities as compared with conventional unaided visual interpretation.
Study design.
We conducted a retrospective review of critical care cEEGs and medical records at the Massachusetts General Hospital (MGH) between September 2011 and February 2012 (figures e-1 and e-2 on the Neurology® Web site at Neurology.org). All cEEGs were ordered by treating physicians (rather than as part of a protocol), and all cEEGs included were performed for the purpose of seizure surveillance in acutely ill patients.
Patient cohort.
Among 370 consecutive patients monitored between September 2011 and February 2012, 118 patients met the following inclusion criteria: (1) older than 18 years of age, (2) duration ≥8 hours, (3) admitted for an acute illness (rather than electively), and (4) the primary indication for ordering cEEG was a suspicion for seizures. Demographic and other clinical information was obtained from the electronic medical record.
General cEEG data review protocol.
The CSA review group was composed of 3 EEGers at the fellowship stage of clinical EEG subspecialty training (readers A–C), but with at least 6 months of cEEG experience. The same records were also independently reviewed by the same EEGers (readers A–C) and 2 attending clinical neurophysiologists (readers D and E) using conventional page-by-page visual analysis. The findings of the readers at the attending level served as the “gold standard,” while the conventional review by readers A–C allowed for comparison of time to review. All readers used CSA in daily clinical practice and were trained in American Clinical Neurophysiology Society’s intensive care unit cEEG terminology.21 Readers A, B, and C reviewed 44, 37, and 37 cEEGs using the CSA protocol, and 66, 44, and 8 cEEGs using conventional review, respectively. Reviewers D and E reviewed 58 and 60 EEGs, respectively, using conventional review. For cEEGs lasting >24 hours, only the first 24 hours were reviewed.
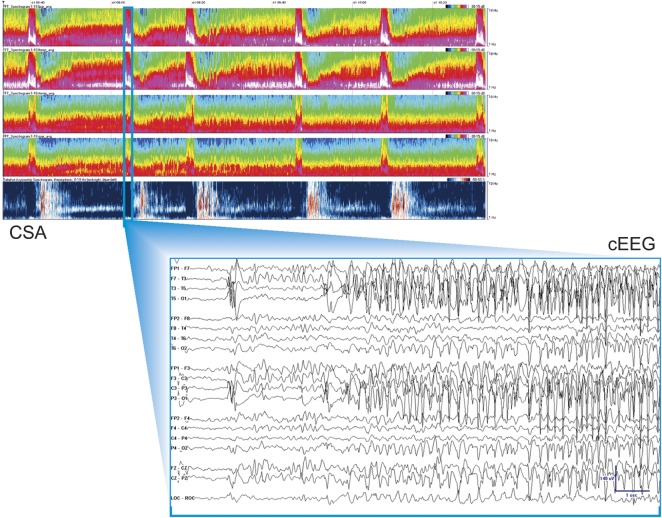
Detailed descriptions of the CSA-guided and conventional visual (gold standard) cEEG review protocols, technical details of cEEG recordings and configuration of CSA displays, and reasons for selecting CSA over alternative quantitative EEG methods are provided in the online supplemental material (sections A and B). An example of the CSA display is provided in figure 1.
Figure 1. CSA display.
Top screen: Two-hour segments of CSA power data were displayed from top to bottom in a spectrogram montage. There are brief periods with increased power in the high-frequency band over the left hemisphere highlighting suspicious regions. Bottom screen: Raw cEEG data. cEEG = continuous EEG; CSA = compressed spectral array.
Statistical analysis for primary aim.
The primary outcome measures of this study were time taken for readers A–C to review each cEEG study using the CSA-guided cEEG review protocol compared with conventional page-by-page EEG review, and detection sensitivity for seizures. The significance of differences in review times between the methods of cEEG review was assessed using a paired t test.
Statistical analysis for secondary aims.
Detection sensitivity for seizures, periodic epileptiform discharges, nonperiodic epileptiform discharges, focal slowing, generalized slowing, and rhythmic delta activity were calculated for reviewers A–C using CSA-guided cEEG review relative to the findings of the gold standard reviewers D and E who relied on conventional page-by-page EEG review. In addition, we analyzed detection sensitivity for electrographic status epilepticus (ESE). For this study, ESE was said to be present when either (1) the maximum seizure duration (max duration) was >5 minutes, or (2) the minimum average interseizure interval within any hour of monitoring was <5 minutes. ESE was said to have been “detected” by CSA-guided review when either all seizures lasting >5 minutes were detected, or when >50% of all seizures were detected (for cases in which all seizures were briefer than 5 minutes); otherwise, ESE was considered to have been “missed.”
The relationship between review time (per 24 hours of cEEG recording) and seizure detection sensitivity using CSA-guided review was assessed using Spearman correlation analysis. Calculations and graphs were generated using Microsoft Excel and Stata. The relation between total seizure burden and percentage of seizures missed was assessed using a Pearson correlation coefficient, and a t test was used to compare the mean percentages of missed seizures (for cases lacking status epilepticus) in cases with seizures with brief vs longer average durations.
Standard protocol approvals, registrations, and patient consents.
This retrospective study was conducted under a protocol approved by the MGH institutional review board. Informed consent was not required.
RESULTS
Demographic and clinical data for the 118 selected patients are summarized in table e-1. The 118 cEEGs included 40 with seizures, and comprised a total of 2,092 hours of cEEG data and 1,192 seizures. Among the 40 cases with seizures, 47.5% (19/40) met study criteria for ESE either by having one or more seizures lasting >5 minutes (74% of cases [14/19]) or by having an average hourly interseizure interval <5 minutes in duration (25% of cases [5/19]) (table 1).
Table 1.
Descriptive statistics for patients with seizures
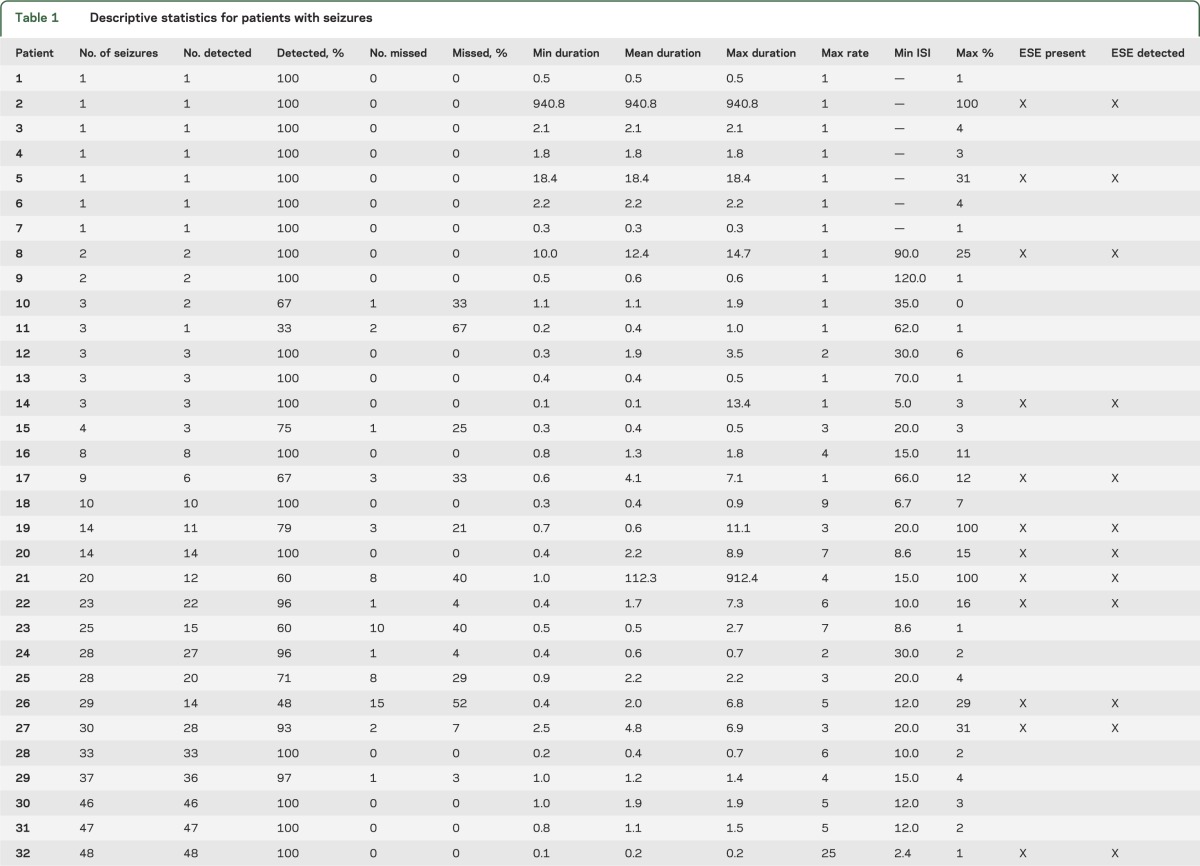

Table e-2 summarizes the time-savings analysis. The time required for review of intermittent raw cEEG guided by CSA was substantially less than for conventional complete review of the entire cEEG without CSA guidance. Average times to review 24 hours of cEEG data were 8 (±4) minutes for CSA-guided review and 38 (±17) minutes for conventional review (p < 0.005). Significant time savings were also found considering only studies containing seizures (adjusted for 24 hours): 10 (±4) minutes for CSA-guided review and 44 (±20) minutes for conventional review (p < 0.005) (figure 2).
Figure 2. Time-savings group analysis.
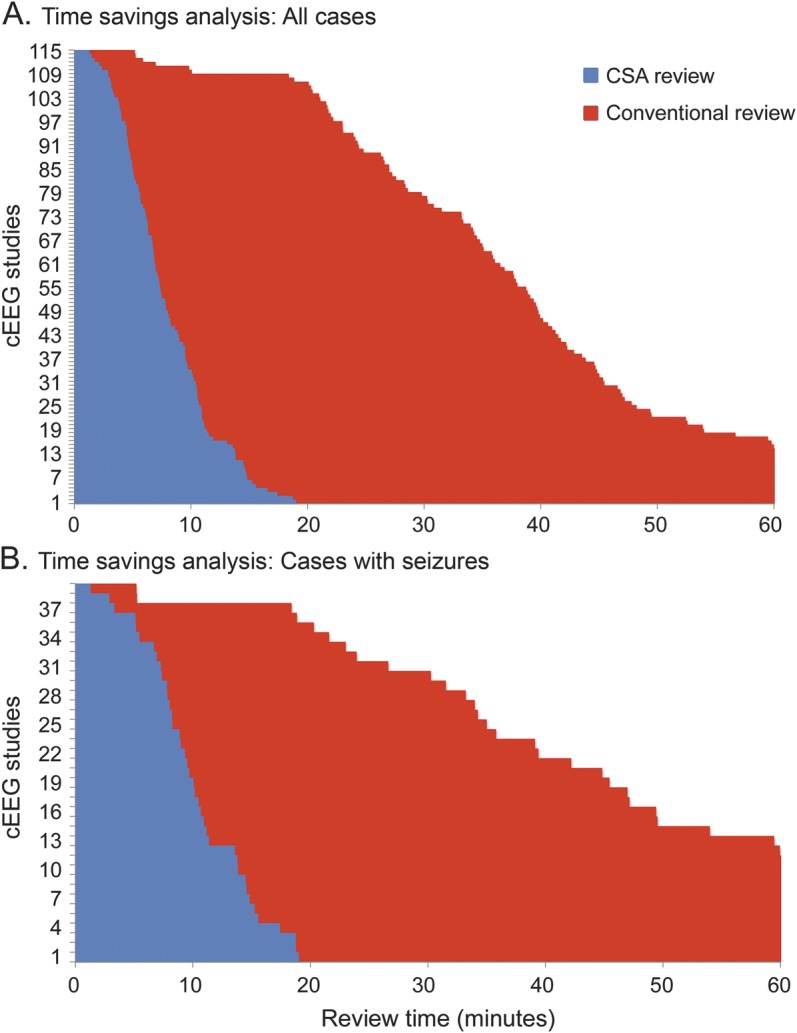
Comparison histograms of the time taken to review a given record with the assistance of CSA (blue bars) and without (red). (A) All studies reviewed by readers A–C using CSA guidance vs conventional review. (B) All studies that contained seizures. Studies were rank ordered from the shortest to longest review time. The average time to review 24 hours of cEEG data when CSA was used was 8 (±4) minutes, whereas conventional review took 38 (±17) minutes on average (A). These were statistically different between the groups (p < 0.005). (B) If seizures were present, time savings was more marked: CSA review 10 (±4) minutes and conventional 44 (±20) minutes (p < 0.005). The figure is truncated at 60 minutes. For 14 studies, reading with conventional review took more than 60 minutes. Times to review for these outliers were 62.2, 62.3, 63.5, 63.6, 63.7, 64.6, 65.2, 66.0, 67.3, 71.6, 72.4, 75.0, 95.8, and 101.6 in chart A, and 95.8, 75.0, 72.4, 71.6, 67.3, 65.2, 64.6, 63.6, 63.5, 62.3, and 62.2 in chart B. Times to review were normalized to a standard duration of 24 hours of cEEG, i.e., all reported times are expressed as time spent per 24 hours of EEG data. cEEG = continuous EEG; CSA = compressed spectral array.
CSA-guided cEEG review identified all patients with seizures, and detected 87.3% of all individual seizures among the cohort. That is, reviewers detected at least one seizure in every record that contained seizures (as determined by gold-standard conventional EEG review by readers D and E); however, in records with multiple electrographic seizures, some seizures were missed by CSA-guided review. The overall sensitivity of CSA-guided review (figure 3) was as follows: seizures 87.3% (1,041/1,192), periodic epileptiform discharges 100% (43/43), rhythmic delta activity 97.1% (34/35), focal slowing 98.7% (76/77), generalized slowing 100% (100/100), and epileptiform discharges 88.5% (61/70). No cases of ESE went undetected by CSA-guided review (table 1): all seizures lasting >5 minutes were detected, and in cases of ESE without any seizures lasting >5 minutes, the lowest seizure detection rate was 86% (95/111).
Figure 3. Sensitivity analysis for seizures and other abnormal patterns.
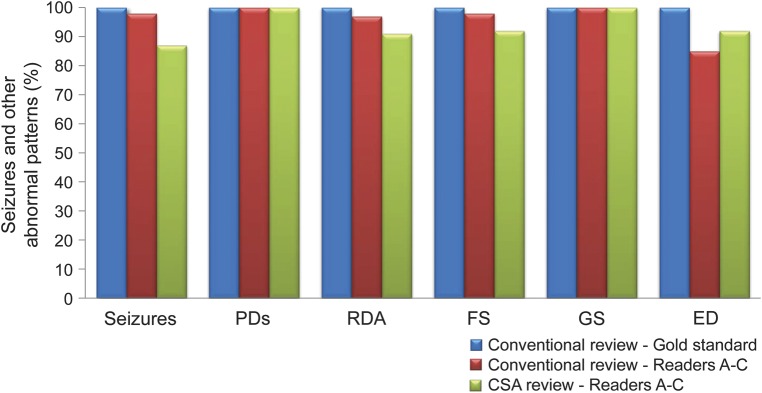
The overall sensitivity of CSA-guided review and conventional review of reviewers A–C is shown, relative to the gold-standard findings of readers D and E: seizures 87.3% (1,041/1,192), PDs 100% (43/43), RDA 97.1% (34/35), FS 98.7% (76/77), GS 100% (100/100), and EDs 88.5% (61/70). By definition, the gold-standard conventional review group detected 100% of all seizures and common abnormal patterns. CSA = compressed spectral array; ED = epileptiform discharge; FS = focal slowing; GS = generalized slowing; PD = periodic epileptiform discharge; RDA = rhythmic delta activity.
Excluding cases with ESE due to prolonged (>5-minute) seizures (of which all were detected; see above), we found an inverse relationship between number of seizures per cEEG and number of missed seizures (more seizures were missed in EEGs with higher total seizure counts; Pearson correlation coefficient 0.73, p = 0.0001). In addition, dividing the 21 cases without ESE into cases with brief (average duration <1 minute) vs longer seizures, we found that the mean percentage of missed seizures was twice as high in the group with brief seizures: 13% (SD 22) vs 6.5% (SD 12), respectively (t test; p = 0.01).
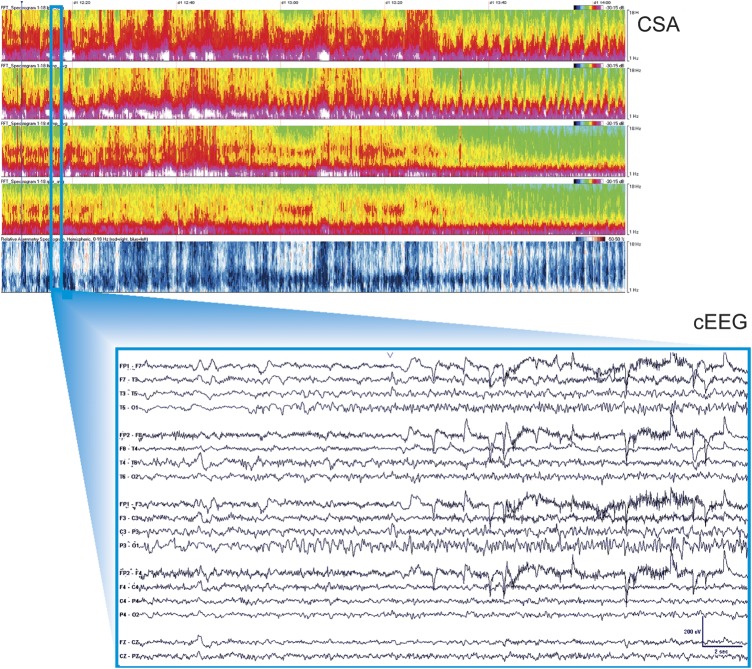
Differences in detection rates for seizures and other patterns between readers in the CSA-guided review group were modest and not clinically significant (table e-3). A detailed discussion of differences between detection performance characteristics among reviewers A, B, and C in the CSA-guided review group is provided in the online supplemental material (section C). An example of the CSA display obscured by artifact is provided in figure 4.
Figure 4. CSA display obscured by artifact.
Top screen: Two-hour segments of CSA display, as described in figure 3. Bottom screen: Raw cEEG data, as described in figure 3. cEEG = continuous EEG; CSA = compressed spectral array.
There was no significant correlation between seizure detection sensitivity (CSA protocol) and time to review 24 hours of cEEG (Spearman ρ R2 [40]: 0.13, p = 0.41), suggesting that CSA-guided reviewers adjusted review time on a case-by-case basis to maintain sensitivity. In addition, linear regression of the time to review each file as a function of the ordering in which cEEG was reviewed by a particular reader revealed no significant trend, suggesting that the time to review a cEEG study was stable for each reader throughout the study.
DISCUSSION
The main finding of this study is that CSA-based screening of cEEG recordings in hospitalized adults can substantially reduce average review time without significantly sacrificing sensitivity for seizures and other critical findings relative to conventional page-by-page review. CSA-guided screening identified 100% of cEEG recordings containing seizures, all cases of ESE, and tended to miss seizures only in records with multiple seizures, attaining an overall detection rate of 87% in 25% of the time required for conventional review. This finding was established in a large collection of unselected recordings from patients with a broad range of neurologic conditions. Moreover, the cEEG review procedure was clinically practical. Our data suggest that CSA-guided review is an acceptable alternative to the current standard practice of page-by-page review of all data for cEEG monitoring in critically ill adults.
In the minority of cases in which CSA-guided review missed seizures, misses tended to represent a small fraction of a high seizure burden. Missed seizures also tended to occur more often in patients with briefer seizures. We speculate that misses can be explained in part by the intrinsic difficulty of drawing a line between patterns on the “ictal-interictal continuum” and “definite seizures.” Efforts to increase interrater agreement on seizure patterns may further improve performance of CSA-guided review.
Our findings in adults are similar to those of smaller studies in pediatric populations.18,20 One study using CSA and amplitude-integrated EEG in 23 pediatric cEEGs (17 with seizures, 10 without) found a sensitivity for seizure detection with CSA of 83.3%.20 Another study in 8 neonates (26–44 weeks) found that envelope trends enabled experienced users to detect 88% of prolonged seizures, while detection rates for brief or slowly evolving neonatal seizures were only 40% and 20%,22 suggesting that compressed EEG may be useful in some but not all neonates. In contrast with the present study, in both of these pediatric studies, reviewers were not permitted to correlate compressed data findings with the primary EEG data. This difference may have contributed to lower detection sensitivities relative to the present study.
The present study investigated sensitivity and efficiency (time savings) of CSA as to guide cEEG review, placing minimal emphasis on specificity (low false-positive detection rates). This choice treats CSA as a screening tool, which cannot be performed without simultaneous review of raw cEEG data, rather than as a primary modality for cEEG interpretation. Suspicious CSA patterns must be frequently correlated with raw EEG data to distinguish seizures from state changes, periodic patterns, and artifacts. This back-and-forth dynamic allows cEEG review to be adaptive, such that after an initial careful correlation of raw cEEG with CSA patterns (including a careful visual analysis of the cEEG background) during the initial 30-minute period, reviewers are able to rapidly distinguish artifacts from true physiologic changes. This initial review enables subsequent review to proceed more quickly.
In keeping with a prior study by our group,23 CSA-guided review had excellent sensitivity for the presence of other common critical “interictal” findings including focal (98.7%) and generalized (100%) slowing, periodic discharges (100%), and rhythmic delta activity (97.1%) compared with conventional page-by-page EEG review. Similarly, sensitivity for the presence of sporadic epileptiform discharges was reasonably high (88.5%). The high sensitivity for nonseizure findings is not necessarily because these patterns produce distinct CSA signatures. For example, epileptiform discharges, being brief, typically show no obvious footprint in the 2-hour CSA display used in our protocol. Rather, these patterns are abundant enough to be detected even by very limited review of the primary EEG data that occurs during CSA-guided review.
The early stage of cEEG training of the CSA review group merits comment. This selection of readers was intended to reflect the practice at many tertiary care centers of relying on clinical fellows for most first-line cEEG interpretation. The use of trainees might produce conservative estimates of sensitivity, as sensitivity should improve with experience. By contrast, our gold-standard EEG reviewers were experienced attending-level clinical EEGers to ensure validity of the gold standard.
Our protocol relied on 2-hour CSA windows. We chose to display 5 CSA panels (left and right lateral and parasagittal chains, and hemispheric asymmetry spectrogram). Including additional CSA panels, higher time resolution (e.g., 30-minute windows), and possibly other compressed-data formats (e.g., amplitude integrated EEG, rhythmicity measures) might have produced higher seizure detection rates. However, increasing data volume might compromise efficiency by producing cognitive overload. Further research is necessary to determine which quantitative EEG instruments, alone and in combination, present the best cognitive match for human EEG reviewers.
Some have suggested that nurses, EEG technologists, and residents can be trained to review CSA data to flag regions for direct review by physician experts.20,21 These efforts are important because cEEG patterns in the acutely ill are dynamic and require prompt action. However, nonexpert CSA-based screening (without immediate visual confirmation) may yield more false alarms, which might place additional burdens on neurophysiologists charged with following up on such alerts. In the current study, constant correlation of CSA patterns with the underlying EEG was critical in achieving high sensitivity and efficiency, and direct visual confirmation by a trained expert remains an essential step to determining which cEEG patterns are significant rather than artifactual or incidental.
Our results are subject to several limitations. First, our study is a single-center, retrospective review, and a larger multi-institutional prospective trial is needed to establish the validity and generalizability of our findings. Second, CSA cannot escape the inherent limitations of scalp EEG, including the fact that not all seizures may be detectable on scalp EEG. For example, exquisitely focal seizures may be detectable only with invasive monitoring, and seizure activity of low amplitude, frequency, or duration, or seizures in the presence of “malignant”-appearing background activity, may be difficult to discern even on careful inspection of the raw cEEG. Third, while our results suggest that patterns meeting the strict definition of definite electrographic seizures24 can be identified readily, borderzone rhythmic and periodic EEG patterns failing to qualify as definite electrographic seizures may nevertheless be symptomatic and require treatment in some cases. Determination of the clinical significance of such cases is possible only by clinical correlation, e.g., to determine whether the pattern in question reliably correlates with signs/symptoms and whether the patient improves with treatment. In such cases, CSA-guided review may not significantly reduce the total time required for interpretation. Fourth, it should be emphasized that our estimate of approximately 75% time savings applies only to the part of EEG review after careful direct conventional visual analysis of the initial 30 minutes of data. As stated above, there are reasons to believe that the familiarity with the cEEG provided by this initial review is critical to both time savings and sensitivity of subsequent CSA-guided screening. Fifth, not all centers have access to software or reading stations such as those used to view CSA in this study. However, such centers may be less likely to perform large-scale cEEG and may thus be better able to review their studies without relying on CSA-based screening. Sixth, some centers employ dedicated technicians to monitor and screen for seizures, allowing physicians to focus only on suspicious segments, perhaps obviating the advantage (for physicians) of CSA-guided review. Seventh, some centers employ screening of CSA (and/or other measures) by nurses and electroneurodiagnostic technologists, followed by page-by-page EEG review by a physician in fellowship training or another electroneurodiagnostic technician, followed by complete or targeted review by an attending-level neurophysiologist. This approach of triple EEG review, while time-consuming and resource-intensive, is arguably the least likely to miss any significant findings. Further outcome-oriented research is needed to determine the optimal approach among these alternatives. Eighth, it must be emphasized that the CSA-guided review protocol proposed here is not intended as a substitute for visual review by trained expert clinicians, and indeed, expert visual review of primary cEEG data is an indispensable component of the present CSA-guided protocol. Lastly, the results of the present study apply only in the critical care setting. They have no obvious direct relevance to diagnostic long-term video EEG monitoring for assessment of chronic epilepsy, particularly for the presurgical workup. In such patients, interictal spikes may be infrequent but very clinically important, necessitating careful, time-consuming visual search, and patients may undergo days of cEEG recording to detect even a small number of seizures on which neurosurgical decisions are based. In this setting, missing one seizure can have significant clinical consequences.
Finally, it remains to be determined whether the time savings achievable by CSA-guided review is meaningful in either clinical or cost-effectiveness terms. In many cases, initial identification of EEG events represents only one part of providing critical care cEEG services. Other responsibilities, which may be even more time-consuming, include clinical correlation of EEG findings including bedside examination as needed to determine their significance; evaluation of changes in medications; frequent communication with clinical teams to report findings and to make EEG-related management recommendations; and writing EEG reports. Nevertheless, if validated, our results may justify replacing at least the front-line conventional page-by-page EEG review, arguably the most time-sensitive stage of EEG analysis, by the more efficient CSA-based screening procedure presented herein.
Our results suggest that CSA-guided cEEG review can enable significantly faster interpretation without substantial loss of sensitivity for critical findings in the vast majority of cases. While intensive care unit outcome measures were not explored in this study, the demonstration that CSA-guided review enables rapid and accurate evaluation of critical EEG findings (such as the presence of seizures or nonconvulsive status epilepticus) suggests that this protocol may positively affect patient care by allowing more timely management decisions in response to critical cEEG events.
Supplementary Material
GLOSSARY
- cEEG
continuous EEG
- CSA
compressed spectral array
- ESE
electrographic status epilepticus
- MGH
Massachusetts General Hospital
Footnotes
Supplemental data at Neurology.org
AUTHOR CONTRIBUTIONS
L.M.V.R.M., M.M.S., and M.B.W. conceptualized and designed the study. L.M.V.R.M. (MGH clinical neurophysiology fellow) and M.B.W. (faculty with the MGH Epilepsy Service) completed the statistical analysis. L.M.V.R.M., M.M.S., and M.B.W. drafted the original manuscript. L.M.V.R.M., S.P., and M.N. contributed to the data production and collection. S.S.C., A.J.C., D.B.H., M.M.S., E.S.R., and M.B.W. reviewed and revised the manuscript.
STUDY FUNDING
No targeted funding reported.
DISCLOSURE
L. Moura reports no disclosures relevant to the manuscript. M. Shafi received support from Harvard Catalyst KL2 MeRIT program. M. Ng and S. Pati report no disclosures relevant to the manuscript. S. Cash, A. Cole, and D. Hoch received support from NIH/Neurological Disorders and Stroke NS062092. E. Rosenthal reports no disclosures relevant to the manuscript. M. Westover received support from the American Brain Foundation. Go to Neurology.org for full disclosures.
REFERENCES
- 1.Vespa PM, Nuwer MR, Juhász C, et al. Early detection of vasospasm after acute subarachnoid hemorrhage using continuous EEG ICU monitoring. Electroencephalogr Clin Neurophysiol 1997;103:607–615 [DOI] [PubMed] [Google Scholar]
- 2.Schreiber JM, Zelleke T, Gaillard WD, et al. Continuous video EEG for patients with acute encephalopathy in a pediatric intensive care unit. Neurocrit Care 2012;17:31–38 [DOI] [PubMed] [Google Scholar]
- 3.Pandian JD, Cascino GD, So EL, et al. Digital video-electroencephalographic monitoring in the neurological-neurosurgical intensive care unit. Arch Neurol 2004;61:1090–1094 [DOI] [PubMed] [Google Scholar]
- 4.Cloostermans MC, Van Meulen FB, Eertman CJ, et al. Continuous electroencephalography monitoring for early prediction of neurological outcome in postanoxic patients after cardiac arrest: a prospective cohort study. Crit Care Med 2012;40:2867–2875 [DOI] [PubMed] [Google Scholar]
- 5.Rudin D, Grize L, Schindler C, et al. High prevalence of nonconvulsive and subtle status epilepticus in an ICU of a tertiary care center: a three-year observational cohort study. Epilepsy Res 2011;96:140–150 [DOI] [PubMed] [Google Scholar]
- 6.Young GB, Doig GS. Continuous EEG monitoring in comatose intensive care patients: epileptiform activity in etiologically distinct groups. Neurocrit Care 2005;2:5–10 [DOI] [PubMed] [Google Scholar]
- 7.Young GB. Continuous EEG monitoring in the ICU. Acta Neurol Scand 2006;114:67–68 [DOI] [PubMed] [Google Scholar]
- 8.Claassen J, Mayer SA, Kowalski RG, et al. Detection of electrographic seizures with continuous EEG monitoring in critically ill patients. Neurology 2004;62:1743–1748 [DOI] [PubMed] [Google Scholar]
- 9.Vespa PM, Nuwer MR, Nenov V, et al. Increased incidence and impact of nonconvulsive and convulsive seizures after traumatic brain injury as detected by continuous electroencephalographic monitoring. J Neurosurg 1999;91:750–760 [DOI] [PMC free article] [PubMed] [Google Scholar]
- 10.Towne AR, Waterhouse EJ, Boggs JG, et al. Prevalence of nonconvulsive status epilepticus in comatose patients. Neurology 2000;54:340–345 [DOI] [PubMed] [Google Scholar]
- 11.Talwar D, Torres F. Continuous electrophysiologic monitoring of cerebral function in the pediatric intensive care unit. Pediatr Neurol 1988;4:137–147 [DOI] [PubMed] [Google Scholar]
- 12.Claassen J, Hirsch LJ, Kreiter KT, et al. Quantitative continuous EEG for detecting delayed cerebral ischemia in patients with poor-grade subarachnoid hemorrhage. Clin Neurophysiol 2004;115:2699–2710 [DOI] [PubMed] [Google Scholar]
- 13.Carrera E, Claassen J, Oddo M, et al. Continuous electroencephalographic monitoring in critically ill patients with central nervous system infections. Arch Neurol 2008;65:1612–1618 [DOI] [PubMed] [Google Scholar]
- 14.Sutter R, Fuhr P, Grize L, et al. Continuous video-EEG monitoring increases detection rate of nonconvulsive status epilepticus in the ICU. Epilepsia 2011;52:453–457 [DOI] [PubMed] [Google Scholar]
- 15.Claassen J, Hirsch LJ, Frontera JA, et al. Prognostic significance of continuous EEG monitoring in patients with poor-grade subarachnoid hemorrhage. Neurocrit Care 2006;4:103–112 [DOI] [PubMed] [Google Scholar]
- 16.Nuwer MR. Quantitative EEG analysis in clinical settings. Brain Topogr 1996;8:201–208 [DOI] [PubMed] [Google Scholar]
- 17.Nuwer M. Assessment of digital EEG, quantitative EEG, and EEG brain mapping: report of the American Academy of Neurology and the American Clinical Neurophysiology Society. Neurology 1997;49:277–292 [DOI] [PubMed] [Google Scholar]
- 18.Shah AK, Agarwal R, Carhuapoma JR, Loeb JA. Compressed EEG pattern analysis for critically ill neurological-neurosurgical patients. Neurocrit Care 2006;5:124–133 [DOI] [PubMed] [Google Scholar]
- 19.Bricolo A, Turazzi S, Faccioli F, et al. Clinical application of compressed spectral array in long-term EEG monitoring of comatose patients. Electroencephalogr Clin Neurophysiol 1978;45:211–225 [DOI] [PubMed] [Google Scholar]
- 20.Stewart CP, Otsubo H, Ochi A, et al. Seizure identification in the ICU using quantitative EEG displays. Neurology 2010;75:1501–1508 [DOI] [PMC free article] [PubMed] [Google Scholar]
- 21.Hirsch LJ, LaRoche SM, Gaspard N, et al. American Clinical Neurophysiology Society's Standardized Critical Care EEG Terminology: 2012 version. J Clin Neurophysiol 2013;30:1–27 [DOI] [PubMed] [Google Scholar]
- 22.Abend NS, Dlugos D, Herman S. Neonatal seizure detection using multichannel display of envelope trend. Epilepsia 2008;49:349–352 [DOI] [PubMed] [Google Scholar]
- 23.Williamson CA, Wahlster S, Shafi MM, Westover MB. Sensitivity of compressed spectral arrays for detecting seizures in acutely ill adults. Neurocrit Care 2014;20:32–39 [DOI] [PMC free article] [PubMed] [Google Scholar]
- 24.Young GB, Jordan KG, Doig GS. An assessment of nonconvulsive seizures in the intensive care unit using continuous EEG monitoring: an investigation of variables associated with mortality. Neurology 1996;47:83–89 [DOI] [PubMed] [Google Scholar]
Associated Data
This section collects any data citations, data availability statements, or supplementary materials included in this article.


