

Two antagonistic hormonal pathways merge at the promoter of a crucial activator of one of the pathways.
Abstract
Salicylic acid (SA), a hormone essential for defense against biotrophic pathogens, triggers increased susceptibility of plants against necrotrophic attackers by suppressing the jasmonic acid-ethylene (ET) defense response. Here, we show that this disease-promoting SA effect is abolished in plants lacking the three related TGACG sequence-specific binding proteins TGA2, TGA5, and TGA6 (class II TGAs). After treatment of plants with the ET precursor 1-aminocyclopropane-1-carboxylic acid (ACC), activation of all those genes that are suppressed by SA depended on class II TGAs. Rather than TGA binding sites, GCC-box motifs were significantly enriched in the corresponding promoters. GCC-box motifs are recognized by members of the superfamily of APETALA2/ETHYLENE RESPONSE FACTORs (ERFs). Of 11 activating ACC-induced APETALA2/ERFs, only ORA59 (for OCTADECANOID-RESPONSIVE ARABIDOPSIS APETALA2/ETHYLENE RESPONSE FACTOR domain protein59) and ERF96 were strongly suppressed by SA. ORA59 is the master regulator of the jasmonic acid-ET-induced defense program. ORA59 transcript levels do not reach maximal levels in the tga2 tga5 tga6 triple mutant, and this residual activity cannot be suppressed by SA. The ORA59 promoter contains an essential TGA binding site and is a direct target of class II TGAs as revealed by chromatin immunoprecipitation experiments. We suggest that class II TGAs at the ORA59 promoter constitute an important regulatory hub for the activation and SA suppression of ACC-induced genes.
Plants live in challenging environments in which they have to combat a broad range of different microbial pathogens. This selective pressure led to the evolution of a sophisticated immune system, part of which is activated after recognition of the pathogen or pathogen-induced damage (Jones and Dangl, 2006). Many responses are under hormonal control, with phytohormones salicylic acid (SA), jasmonic acid (JA), and ethylene (ET) being of major importance. SA-activated responses are effective against biotrophic pathogens, which retrieve nutrients from living plant cells. In contrast, JA and ET elicit responses that combat necrotrophic microbes, which kill plant cells and feed on the remains (Glazebrook, 2005). Both pathways are mutually antagonistic, so that plants can mount the appropriate immune response when attacked by a pathogen that stimulates biosynthesis of all three hormones (Spoel et al., 2003; De Vos et al., 2005). The antagonism might also serve to prioritize one pathway over the other when plants are simultaneously or sequentially infected by microbes with different colonization strategies (Spoel et al., 2007; Spoel and Dong, 2008).
Whereas activation of the JA pathway suppresses SA biosynthesis (Zheng et al., 2012), activation of the SA pathway interferes with JA-ET signaling by blocking an unknown process downstream of the jasmonoyl-Ile receptor CORONATINE INSENSITIVE1 (COI1; Leon-Reyes et al., 2010b; Van der Does et al., 2013). Apart from COI1 and the COI1-interacting jasmonate-ZIM domain (JAZ) corepressors, components of the ET signaling pathway are required for activation of the JA-ET pathway (Penninckx et al., 1998). The molecular basis of JA-ET signaling interdependency can be explained by the interaction between the key transcriptional activators of ET signaling, ETHYLENE INSENSITIVE3 (EIN3) and EIN3-LIKE1 (EIL1), and the JAZ repressor protein, JAZ1 (Zhu et al., 2011). If the pathway is triggered by ET, stability of EIN3/EIL1 is enhanced (An et al., 2010). If the pathway is triggered by JA, COI1-dependent degradation of the inhibitory JAZ protein leads to derepression of the activation capacity of EIN3/EIL1 (Zhu et al., 2011). Activation of EIN3/EIL1 by either of these mechanisms leads to enhanced expression of genes encoding secondary transcription factors, including members of the APETALA2/ETHYLENE RESPONSE FACTOR (AP2/ERF) transcription factor superfamily (McGrath et al., 2005; Nakano et al., 2006a, 2006b; Chang et al., 2013).
Because of the expansion of the AP2/ERF family (Nakano et al., 2006a), many AP2/ERFs have been postulated to act in a redundant manner, and constitutive expression of several members is sufficient to activate JA-ET-regulated genes (Lorenzo et al., 2003; Oñate-Sánchez et al., 2007; Pré et al., 2008). Despite this assumed redundancy, loss of function of the AP2/ERF transcription factor OCTADECANOID-RESPONSIVE ARABIDOPSIS APETALA2/ETHYLENE RESPONSE FACTOR domain protein59 (ORA59) renders plants more susceptible to necrotrophic pathogens and compromises expression of JA-ET-induced marker genes, like PLANT DEFENSIN1.2 (PDF1.2; Pré et al., 2008). Transcription of ORA59 can be induced by either JA or ET. It is not yet known whether the ORA59 promoter is a direct target of the EIN3/EIL1-JAZ1 complex.
Apart from COI1, JAZ1, and EIN3/EIL1, the three related TGACG sequence-specific binding proteins, TGA2, TGA5, and TGA6 (class II TGAs), play important roles in the activation of defense responses against necrotrophic pathogens (Zander et al., 2010). Although class II TGAs are not necessary for PDF1.2 induction after JA treatment, they are required for PDF1.2 induction after treatment of plants with the necrotrophic pathogen Botrytis cinerea or the ET precursor 1-aminocyclopropane-1-carboxylic acid (ACC). This is noteworthy, because class II TGAs are also essential for SA-activated defense responses (Zhang et al., 2003). In this context, they interact with the transcriptional coactivator NONEXPRESSOR OF PATHOGENESIS-RELATED GENES1 (NPR1; Zhang et al., 1999), which translocates into the nucleus when SA levels increase (Mou et al., 2003). Apparently, class II TGAs are essential activators of two different defense pathways.
SA can interfere with activation of PDF1.2 (Spoel et al., 2003). This negative effect is mediated through different mechanisms, depending on whether PDF1.2 induction is triggered by JA or ACC. If PDF1.2 expression is induced by JA, the SA antagonism depends on class II TGAs and NPR1 (Spoel et al., 2003; Ndamukong et al., 2007). The molecular mechanism of this cross talk has not yet been elucidated, but it occurs downstream of COI1 and JAZ protein degradation and might involve regulation of ORA59 protein levels (Van der Does et al., 2013). When ACC is used as the inducing hormone, class II TGAs become important for the activation of PDF1.2 expression (Zander et al., 2010). The residual PDF1.2 activity in the tga256 mutant is not suppressed by SA, indicating that the tga256 mutant mimics a permanent SA-ET cross talk. Moreover, the negative effect of SA is independent from NPR1 (Leon-Reyes et al., 2009).
Here, we investigated the global role of class II TGAs within the ET pathway and identified the promoter of the key regulatory gene ORA59 as their direct target site in the cascade. We show that ORA59 promoter activity is reduced in the presence of SA. This observation explains our finding that TGA factors are required for the induction of nearly all ACC-induced genes that are subject to the negative regulation by SA. Because the promoter of the key regulatory gene ORA59 contains an essential TGACGT motif and because TGA factors bind to this promoter in vivo, we propose that repression of TGA factor activity at the ORA59 promoter constitutes a major mechanism of the SA-ET cross talk.
RESULTS
The tga256 Mutant Mimics SA-Induced Susceptibility to B. cinerea
To examine the contribution of class II TGAs (TGA2, TGA5, and TGA6) to SA-induced susceptibility of Arabidopsis (Arabidopsis thaliana) to necrotrophic pathogens, we treated wild-type plants and the tga2 tga5 tga6 (tga256) triple mutant (Zhang et al., 2003) for 24 h with 1 mm SA before drop infection with B. cinerea. Quantification of lesion sizes confirmed that SA pretreatment increased susceptibility of Arabidopsis to B. cinerea (Fig. 1). The tga256 mutant plants were more susceptible than the SA-treated wild type, and their susceptibility was not further aggravated by SA.
Figure 1.
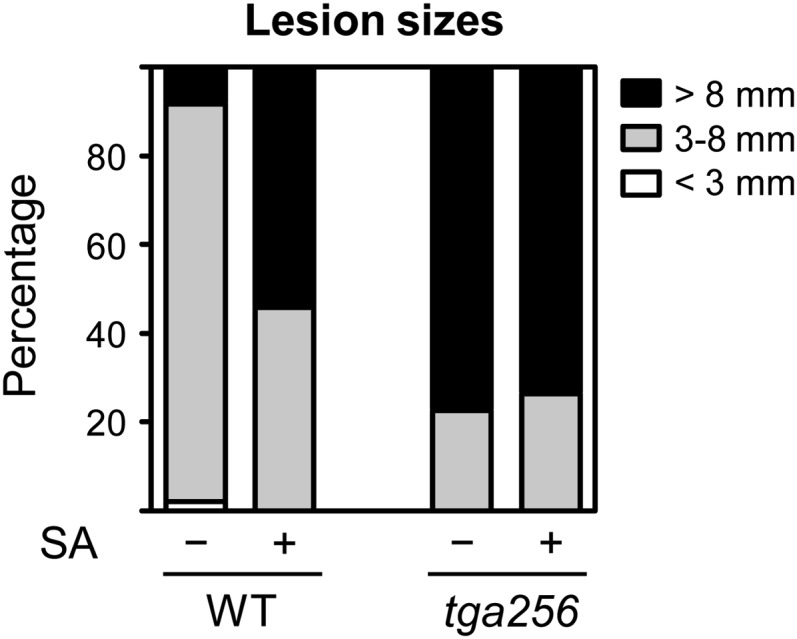
Effect of SA pretreatment on the size of B. cinerea-induced lesions after infection of wild-type and tga256 mutant plants. Four-week-old soil-grown wild-type (WT) and tga256 plants were pretreated with 1 mm SA for 24 h and then drop inoculated with a B. cinerea spore suspension (5 × 10⁴ spores mL−1) or one-quarter-strength potato dextrose broth as the mock control. The diameters of at least 35 lesions per genotype and treatment were measured and grouped into the indicated different size classes.
Class II TGA Factors Are Important for Activating All ACC-Induced Genes That Are Suppressed by SA
Class II TGAs are important for ACC-induced expression of the marker gene PDF1.2 and efficient induction of defense responses against B. cinerea (Fig. 1; Zander et al., 2010). To address the question on the global importance of these TGA factors for the activation of genes by ACC, we performed microarray analyses. To this end, wild-type and tga256 plants were treated with the ET precursor ACC. In addition, ACC and SA were applied simultaneously to correlate the requirement for TGA factors with the negative influence of SA. The experimental design included four pharmacological treatments (water, ACC, SA, and ACC-SA) of eight 4-week-old wild-type and eight tga256 plants. This setup was repeated three times with independently grown plants. The tissue was harvested after 12 h. Of more than 22,000 Arabidopsis genes on the Affymetrix ATH1 gene chip, 374 genes were more than 2-fold (P < 0.05) up-regulated in wild-type plants after ACC treatment (Supplemental Data Set S1). They include known genes of the JA-ET pathway (e.g. PDF1.2, GCN5-RELATED N-ACETYLTRANSFERASE family protein, DARK-INDUCIBLE11, and WRKY40), which are also inducible by JA (Van der Does et al., 2013).
As displayed in Figure 2A, 136 of 374 ACC-induced genes were significantly less expressed (less than 2-fold; P < 0.05) in the tga256 mutant (Supplemental Data Set S2). This group can be further divided into those that are negatively affected by SA (63 genes; Supplemental Data Set S3) and those that are not negatively affected by SA (73 genes; Supplemental Data Set S4). From 238 genes that were expressed in a TGA-independent manner (Supplemental Data Set S5), only 11 genes were negatively regulated by SA (Supplemental Data Set S6).
Figure 2.

Microarray analysis of ACC and ACC-SA-treated wild-type and tga256 plants and in silico promoter analysis. A, Classification of ACC-induced genes with respect to their expression pattern after additional SA treatment of wild-type and tga256 mutant plants. In total, 374 ACC-induced genes (2-fold difference in expression levels; P < 0.05 compared with the water-treated wild type) were classified with respect to their expression in the tga256 mutant and the combined SA-ACC treatment: (1) 136 genes less expressed in the tga256 mutant after ACC treatment called TGA2/5/6-dependent genes, (2) 238 genes expressed to similar levels in wild-type and tga256 mutant plants after ACC treatment called TGA2/5/6-independent genes, (3) 73 genes less expressed in the tga256 mutant after ACC treatment and not negatively affected on additional SA treatment in wild-type plants, and (4) 74 genes less expressed in ACC-SA-treated plants than in ACC-treated plants. From these, 63 genes were TGA dependent, and 11 genes were TGA independent. B, Promoter elements enriched in different subgroups of ACC-induced genes as defined in A. The occurrence of enriched motifs was determined in the 1-kb sequences upstream of the 5′-untranslated regions. Numbers before the slash represent the total number of occurrences of the given motif within the indicated set. Numbers after the slash represent the expected number of occurrences in a set of randomly chosen promoters from either the whole genome (top) or the set of 374 ACC-induced genes (bottom). The corresponding enrichment P values are color coded. Gray, Not significant; green, significantly depleted; red, significantly enriched. The transcription factors binding to the motifs are displayed. The question mark in the last column indicates that binding of AP2/ERF transcription factors to the GCTGCT sequence has not yet been shown.
Because 63 of 74 SA-suppressed genes (Supplemental Data Set S7) were TGA dependent, we had a closer look at those 11 genes (Supplemental Data Set S6) that were subject to the SA antagonism but seemed to be independent of class II TGAs. When applying slightly less strong classification criteria (1.5-fold higher expressed in ACC-treated wild-type than ACC-treated tga256 plants; P < 0.05), seven genes turned out to be TGA dependent. From the remaining four genes, one gene (At4g35720) is significantly higher expressed in the ACC- and ACC-SA-treated tga256 mutant compared with the wild type, one gene (At4g29700) is significantly higher expressed in the water-, SA-, and ACC-SA-treated tga256 mutant than in the wild type, and one gene (At5g63580) is significantly higher expressed in the tga256 mutant after SA and ACC-SA treatments. These data reveal that the SA-ET antagonism targets TGA-controlled genes with one exception only (At4g23600).
TGA Binding Sites Are Not Enriched in Promoters of ACC-Induced Genes That Are Suppressed by SA
To identify transcription factor binding motifs in the promoters of the different gene clusters as defined in Figure 2A, we scanned 1-kb sequences upstream of the predicted transcriptional start sites using the Motif Mapper cis-element analysis tool (Fig. 2B; Berendzen et al., 2012). The program finds the average number of specific binding sites in a given group of genes that was randomly chosen (1,000 times) from the whole genome (Fig. 2B, top) and compares this number with the actual number of binding sites within a specific group of genes. As expected, the program identified the binding site of AP2/ERF transcription factors (GCCGCC) as being 2-fold more frequent in the group of 374 ACC-induced genes than in 374 randomly chosen genes from the genome. The CACGTG motif, which is a binding site for basic helix-loop-helix transcription factor MYC2 (Godoy et al., 2011) and G-box binding factors (Izawa et al., 1993), occurs 1.6-fold more than predicted, whereas the WRKY binding site TTGAC(C/T) and the TGA binding site TGACGT (Izawa et al., 1993) were 1.3-fold enriched. WRKY boxes and TGACGT motifs were found more frequently than predicted in SA-induced promoters (Supplemental Data Set S8 shows SA-induced genes).
Next, we asked the question of how these motifs were distributed among the following four subgroups within the set of 374 ACC-induced genes: (1) TGA dependent, (2) TGA independent, (3) TGA dependent not suppressed by SA, and (4) suppressed by SA. Whereas the GCCGCC element was enriched in all four subgroups (Fig. 2B, top), it was relatively more enriched in TGA-dependent promoters than in TGA-independent promoters (Fig. 2B, bottom). The related GCTGCT motif was especially overrepresented in promoters of the SA-suppressed ACC-induced genes. In contrast, the TGA binding motif was not enriched in this subgroup. These data suggest that TGA factors might regulate expression of one or more central regulators that recognize GCCGCC and GCTGCT elements.
Transcript Levels of ACC-Induced Genes Are Similar in Wild-Type and tga256 Mutant Plants after ACC-SA Treatment
To visualize and cluster the relative transcript levels of all ACC-induced genes in the two ACC-treated genotypes with and without SA, we applied the MarVis software (Fig. 3; Kaever et al., 2009). This program clusters genes with similar relative expression levels into prototypes (Supplemental Data Set S9) and color codes the relative expression levels in the four treatments. In contrast to the Euler diagram (Fig. 2A), where genes with similar expression patterns can fall into different groups, even if they just miss the threshold that determines their classification, the MarVis representation reflects that the relative influence of the SA treatment and the tga256 alleles covers a continuum from stronger to weaker effects. Still, it becomes obvious that nearly all those genes that are suppressed by SA are expressed to lower levels in the tga256 mutant and that a set of SA-unaffected genes depends at least partially on TGA factors. Whereas Figure 2A classifies only 36% of the genes as being TGA dependent, the MarVis representation (blue for low expression) suggests that roughly 75% of the genes are less expressed in the tga256 mutant. Because the MarVis program does not take P values into account, some of the color-coded fluctuations could be caused by variations according to the Gaussian distribution. However, in this case, a set of genes should be expressed to higher levels in the tga256 mutant than in the wild type. Because only a very small fraction of genes is hyperinduced in the tga256 mutant, we conclude that expression of roughly 75% of the genes is at least partially influenced by TGA factors.
Figure 3.

Clustering of 374 ACC-induced genes according to their expression levels in ACC-treated wild-type (WT) and tga256 mutant plants with and without additional SA treatment. Genes were clustered into 50 prototypes according to their normalized expression pattern using the MarVis software (top). The width of each prototype column is proportional to the number of genes assigned to this prototype. Bottom, The normalized expression profiles of the individual transcripts. The program color codes the relative expression of a given prototype (top) or transcript (bottom) in the four treatments. Red depicts the highest relative expression, and blue depicts the lowest relative expression (see color scale). The positions of selected transcription factors and PDF1.2 in this analysis are shown below.
Remarkably, the diagram visualizes that the transcriptomes of ACC-induced wild-type and tga256 plants differ to a considerable extent. In contrast, after ACC-SA treatment, differences are much less pronounced. This finding can be explained by assuming that SA treatment and interference with TGA function by genetic means target similar mechanisms.
Because the binding motifs for AP2/ERF transcription factors are overrepresented in those genes that are subject to the SA antagonism, we analyzed which of the ACC-induced AP2/ERF transcription factor genes are regulated in the same manner. According to our microarray analysis, transcription of ORA59, ERF96, ERF1, and ERF15 is subject to the SA antagonism. Figure 3 illustrates their position on the MarVis map. We also included transcription factor MYB113 in our analysis, because it falls into the same cluster as ORA59. Moreover, we show the relative position of ERF9, which is a representative gene from the group of TGA-independent genes that are not subject to the SA antagonism, and the relative position of abscisic acid-responsive (A) transcription factor NAC032 (ANAC032), which is a representative gene from the group of TGA-dependent genes that are not subject to the SA antagonism. PDF1.2 falls into the first cluster, which is very stringently affected by SA and strongly depends on TGA factors.
Genes Regulated by ORA59 Require TGA Factors for Maximal Expression and Are Suppressed by SA
Based on the observations that ERF recognition motifs are overrepresented in ACC-induced genes subject to the SA antagonism and that transcription of several ERFs was induced by ACC and repressed by SA, we aimed to analyze which of these ERFs might be direct targets of the SA antagonism. Because ORA59 has been described before as being crucial for the defense against necrotrophic pathogens (Pré et al., 2008), we considered it to be a promising candidate target. Therefore, we monitored ERF gene expression in the ora59 mutant (GABI-Kat line GK-061A12 containing a transfer DNA insertion in the single ORA59 exon) at 24 h after treatment with either ACC or ACC and SA (Fig. 4). Wild-type plants and the tga256 mutant were analyzed side by side. As already detected by microarray analysis at 12 h, TGA-dependent ACC induction and SA suppression were again observed for the ORA59 transcript (Fig. 4). Consistent with the low ORA59 transcript levels in the ora59 mutant, PDF1.2 expression was low, confirming the line GK-061A12 as a functional knockout. From all analyzed ERF genes, ACC-induced ERF96 showed the strongest SA suppression and the strongest requirement of TGA factors. Expression depended, to a large extent, on ORA59, supporting the idea that the antagonism targets ORA59.
Figure 4.

Expression analysis of selected transcription factors in wild-type, tga256, and ora59 plants. Four-week-old soil-grown wild-type (WT), tga256, and ora59 plants were sprayed with 1 mm ACC or 1 mm ACC and 1 mm SA and harvested after 24 h. The control values are from plants sprayed for 24 h with water. The relative transcript levels of the indicated transcription factors were determined by quantitative RT-PCR analysis. The relative expression (Rel. expression) values in wild-type plants after 24 h after ACC treatment were set to 100%. The mean values (± se) of four to five biological replicates are shown.
ERF1 transcript levels were less stringently affected by SA and TGA factors. Still, transcript levels partially depended on ORA59. A similar pattern was observed for ERF14, which is not represented by the ATH1 array but was previously described as being important for ET-induced PDF1.2 expression (Oñate-Sánchez et al., 2007). The correlation between the influence of the ora59 allele and the influence of the tga256 alleles and SA suggests that the TGA-mediated SA antagonism regulating expression of ORA59 determines the expression of its downstream genes. ACC induction of ERF15 was less pronounced than expected from our microarray analysis, and its expression was more stringently affected by TGA factors than by SA and ORA59.
ET leads to not only the induction of activating ERFs but also, the induction of repressive ERFs (McGrath et al., 2005). In our experiments, repressive ERFs ERF8, ERF9, and ERF11, were induced by ACC. These genes belong to the group of TGA-independent genes (Supplemental Data Set S5). This result was reproduced for ERF9 by quantitative reverse transcription (RT)-PCR. However, a slight influence of the ora59 allele and a slight influence of SA in all three genotypes were detected. Thus, subtle negative effects of SA seem to occur, even in the tga256 mutant.
According to our microarray analysis, MYB113 is coregulated with ORA59 and therefore, a candidate for regulating genes subject to the SA-ET antagonism. In this independent experiment, MYB113 expression was again similar to ORA59 expression. Like ERF96, it is regulated by ORA59, which supports the notion that only ORA59 is the direct target for the positive effect of TGA factors and the negative effect of SA.
Last, we analyzed ANAC032 transcript levels. ANAC032 is a representative of the TGA-dependent genes that are not suppressed by SA (Supplemental Data Set S4). This expression pattern was also observed in the independent quantitative RT-PCR experiment. Induction by ACC was weak, but this induction depended at least partially on ORA59.
Class II TGA Factors Bind to the ORA59 Promoter in Vivo
Quantitative RT-PCR analysis from RNA of the ora59 mutant had suggested that ORA59 is the master regulator of those genes that are influenced by SA and tga256 alleles. Therefore, we hypothesized that the ORA59 promoter is a direct target of class II TGAs. An inverted TGACGT motif at base pair position −314 relative to the predicted transcriptional start might serve as a TGA binding site (Fig. 5A). To test for in vivo binding of class II TGAs to the ORA59 promoter, chromatin immunoprecipitation (ChIP) analyses were performed using an antiserum against TGA2 and TGA5 (Ndamukong et al., 2007). Chromatin was prepared from water- and ACC-treated wild-type and tga256 plants. In water-treated wild-type plants, a 3-fold enrichment of the TGACGT containing the ORA59 promoter fragment (amplified between base pair positions −393 and −292) compared with tga256 mutant plants was detected (Fig. 5B). The enhancing effect of ACC was somewhat diminished on SA treatment (Supplemental Fig. S1). These data indicate that class II TGAs bind to the ORA59 promoter in vivo. In contrast, we did not detect TGA binding to the ERF96 promoter. Apparently, the TGACG motif in this promoter is not sufficient to recruit class II TGA factors.
Figure 5.

Analysis of TGA binding to the ORA59 promoter and functional analysis of the inverted TGACGT motif. A, Schematic diagram of the ORA59 and the ERF96 promoters highlighting the sequence around the putative TGA binding sites (bold and underlined) and the GCCGCC box in the ORA59 promoter (bold). Arrows denote the position of the primers used for amplification of promoter fragments after ChIP. The transcriptional start site of ORA59 is marked by a bent arrow (position +1). The indicated ORA59 fragment was cloned upstream of the GUS gene with either the intact ACGTCA motif or the indicated point mutations (small letters). B, ChIP analysis. Four-week-old soil-grown wild-type and tga256 mutant plants were treated with 1 mm ACC or water for 24 h. Ten plants were combined per treatment and per experiment. Chromatin samples were subjected to immunoprecipitation using the aTGA2,5 antiserum. The coimmunoprecipitated DNA was recovered and analyzed with quantitative PCR using the primer pairs as indicated above. A genomic fragment of ACTIN8 was used as a reference. The average values (± se) from two experiments with independently grown plants are shown. C, GUS activities of transgenic plants carrying the wild type and the mutated ORA59pro:GUS constructs as depicted in A. Values represent the average relative GUS (Rel. GUS) activities (± se) from 22 independent F2 lines per construct. The average GUS activity yielded by the ACC-induced ORA59 promoter was set to 100%. Plants were treated with either water, 1 mm ACC, or 1 mm ACC and 1 mm SA and harvested after 24 h. The values of the individual lines are shown in Supplemental Figure S2. WT, Wild type.
To determine whether the TGACGT motif is crucial for the activation of the ORA59 promoter, we generated transgenic lines carrying either the wild-type promoter (from +45 to −933) or a TGACGT-deficient promoter fused to the GUS gene. Analysis of 22 independent transgenic lines of each construct showed that the wild-type ORA59pro:GUS construct was inducible by a factor of 6 after ACC treatment, whereas no induction of the ORA59pro:GUS gene with the mutated TGA binding site was observed (Fig. 5C; Supplemental Fig. S2). Collectively, these data indicate that the ORA59 promoter is a direct target of class II TGAs.
Class II TGA Factors Are Not Required for the ET-Induced Triple Response
According to our microarray analysis, 36% of the ET-induced genes require class II TGAs for maximal expression. The decreased expression of TGA-dependent genes is very likely responsible for the increased susceptibility of the tga256 mutant to B. cinerea (Fig. 1). To analyze whether TGA factors are also involved in ET-dependent developmental responses, we grew wild-type and tga256 mutant seedlings on ACC, which leads to reduced growth and exaggerated hypocotyl hook curvature as part of the so-called triple response. In this assay, the tga256 mutant responded to ACC in a similar manner as wild-type plants, although reduction of hypocotyl length was slightly less pronounced (Fig. 6A). Thus, TGA factors are not involved in the ET-induced triple response. This result is supported by the phenotype of the constitutive triple response1 (ctr1) tga256 quadruple mutant, which like ctr1, shows severe growth defects caused by a constitutively active ET signaling cascade (Fig. 6B; Alonso et al., 2003). Although growth in ctr1 was not affected by the three tga alleles, the elevated PDF1.2 transcript levels observed in ctr1 are reverted back to wild-type levels (Fig. 6C). This result underpins the importance of class II TGAs for induction of PDF1.2 and shows that they act downstream of the EIN2-inhibiting Ser/Thr kinase CTR1.
Figure 6.

Influence of tga256 alleles on the triple response andPDF1.2 expression. A, Triple response phenotype of 3-d-old etiolated wild-type and tga256 seedlings. Quantification of the triple response of 3-d-old etiolated wild-type and tga256 seedlings grown on MS plates with or without 10 µm ACC. Bars represent the average hypocotyl length of 20 seedlings (± se). B, Phenotype of 4-week-old soil-grown wild-type, ctr1, tga256, and ctr1/tga256 plants. C, Quantitative RT-PCR analysis of PDF1.2 transcript levels in untreated 4-week-old soil-grown wild-type, ctr1, tga256, and ctr1/tga256 mutant plants. The average of the relative PDF1.2 transcript levels (Rel. expression) in eight ctr1 plants was set to 100%. The mean values (± se) from eight individual wild-type, ctr1, tga256, and ctr1/tga256 plants are shown. WT, Wild type. [See online article for color version of this figure.]
DISCUSSION
ET is a key regulatory signaling molecule in plant development and plant defense. The latter function is interconnected with the JA signaling pathway and controlled by the AP2/ERF transcription factor ORA59. In this study, we investigated the role of class II TGA transcription factors in ACC-induced transcriptional reprogramming. We found that at least 36% of ACC-induced genes require TGA factors for maximal expression and that 20% of the ACC-induced genes are down-regulated by SA. Remarkably, ACC-induced expression of all SA-suppressed genes depends on TGA factors, with one exception only. We identified the ORA59 promoter as a direct target of the activating TGA function in the JA-ET pathway. SA-sensitive TGA-dependent regulation of ORA59 transcription might, therefore, explain the SA-ET antagonism. In Figure 7, we present a schematic model on the integration of TGA factors and SA into the ET pathway.
Figure 7.

Model of the role of class II TGA factors as mediators of the SA-ET cross talk. According to the established model of ET signaling, stabilized EIN3 activates transcription of AP2/ERF transcription factors like, for example, ERF1 and probably, ORA59. TGA factors bind to an inverted TGACGT motif in the ORA59 promoter, thus promoting transcription. The GCCGCC element adjacent to the TGACGT motif might be bound by either ORA59 or other ERFs. ORA59 subsequently activates downstream genes like ERF96, MYB113, and PDF1.2 and influences expression of other genes like, for example, ERF1 and ANAC032. In the presence of SA, TGA-interacting GRX480/ROXY19 is induced. GRX480/ROXY19 is recruited to the TGA factors at the ORA59 promoter to repress transcription through an unknown mechanism. The TGA-dependent ACC activation and the negative effect of SA is, thus, transmitted to all those genes that depend either strongly or weakly on ORA59. ANAC032 belongs to the class of genes that is TGA dependent but not suppressed by SA. The negative effect of SA, which leads to decreased ORA59 levels and thus, decreased ANAC032 transcript levels, is compensated for by the stimulatory action of SA through the activating SCL14/TGA protein complex at this promoter. Because ERF96, MYB113, and PDF1.2 are more affected by TGA factors and SA than ORA59 (Supplemental Fig. S3), we postulate an additional mode of SA-sensitive TGA function downstream of ORA59 transcription. The scheme is based on both ChIP experiments and still hypothetical binding of regulatory proteins to the indicated promoters. Binding of EIN3 to several ERF promoters has been shown by ChIP (Chang et al., 2013). Although binding to the ORA59 promoter was not detected in ET-treated dark-grown seedlings, direct activation of this promoter by EIN3 is inferred from transient assays (Zander et al., 2012). TGA factors have been shown to bind to the ORA59 promoter (this study), and ORA59 binds to the PDF1.2 promoter in vivo (Zarei et al., 2011). The remaining association of these proteins and others with promoter sequences is hypothesized because of the presence of known cis-elements in these promoters combined with expression data in mutants (ora59, tga256, and scl14) and transgenic plants (35Spro:GRX480 and 35Spro:SCL14). The color code was chosen as in Figure 2: TGA-independent genes are highlighted in yellow, TGA-dependent genes that are suppressed by SA are in red, and TGA-dependent genes that are not suppressed by SA are shown in blue.
Class II TGA Factors Activate the SA-Sensitive Branch of the ET-Induced Defense Program
Microarray analysis of ACC-treated wild-type and tga256 mutant plants revealed that more than one-third of all ACC-induced genes require TGA factors for maximal expression (Fig. 2A). On average, they are more strongly induced (5.0-fold) than those genes that are expressed in a TGA-independent manner (2.7-fold). Many of the TGA-dependent genes encode proteins involved in defense reactions, like cell wall biosynthesis, secondary metabolism, and genes known to respond to biotic stress. Consistently, the tga256 mutant develops larger lesions after B. cinerea infections (Fig. 1). All those genes that can be suppressed by SA fall into the group of TGA-controlled genes, with one exception only. Because SA-suppressible genes are not induced by ACC in the tga256 mutant, the expression pattern of ACC-induced genes is similar in ACC-SA-treated wild-type and ACC-SA-treated tga256 mutant plants (Fig. 3). This profile is consistent with the effect of SA and tga256 alleles on the defense against B. cinerea: SA treatment of wild-type plants leads to bigger lesions, whereas the already elevated susceptibility of the tga256 mutant is not aggravated (Fig. 1).
Class II TGA Factors Are Activators of ET-Induced ORA59 Transcription
After having identified that class II TGAs play a major role in the transcriptional activation of ET-induced defense genes, we aimed to identify their target site in the pathway. A generally accepted concept explaining gene regulatory networks is that master regulators control a set of coregulated genes. In the case of ET signaling, transcription factor EIN3 is stabilized and controls the expression of secondary transcription factors, including members of the AP2/ERF family (Chang et al., 2013). An important AP2/ERF transcription factor required for resistance against necrotrophic fungi is ORA59 (Pré et al., 2008). As reported previously (Leon-Reyes et al., 2010a), our microarray analysis revealed that ORA59 expression is induced by ACC and suppressed by SA. Moreover, its expression is lower in the tga256 mutant, and this low expression is not affected by SA (Fig. 4). In accordance with previous data obtained with ORA59 RNA interference lines (Pré et al., 2008), analysis of an ora59 insertion line revealed the importance of ORA59 for PDF1.2 expression. Genes encoding transcription factors, like ERF96 and MYB113, are less expressed in the ora59 background, supporting the idea that ORA59 is a master regulator that influences a large set of genes either directly or indirectly through tertiary transcription factors (Fig. 7). Along these lines, the influence of TGA factors on the whole pathway might be mediated through direct regulation of ORA59 transcription.
Class II TGAs influence gene expression by binding to their target sequences in promoter regions. The optimal binding site for TGA transcription factors is the palindromic sequence TGACGTCA (Qin et al., 1994). Two TGA binding motifs (called activation sequence-1 [as-1]) were originally identified in the Cauliflower Mosaic Virus [CaMV]) 35S promoter (TGACGTaA and TGACG_CA; Lam et al., 1989). These binding sites can be relaxed, especially when two motifs are arranged in tandem at a distance of 12 bp between the palindromic centers (Krawczyk et al., 2002). This is the case in the as-1-like sequence of the octopine synthase promoter (aaACGTaA and TtACGTac; Singh et al., 1990). In vitro, TGA factors can recognize a single TGACG motif, which is found at base pair positions −397 to −393 relative to the transcriptional start site (+1) in the PDF1.2 promoter (Spoel et al., 2003). However, this motif is not necessary for PDF1.2 promoter activity in JA-ACC-treated plants, although TGA factors are required for its activation (Zander et al., 2010). Therefore, it seems that TGAs contribute indirectly to the activation of PDF1.2. Single functional TGA binding motifs with distinct functions have been identified in the PATHOGENESIS-RELATED1 promoter (Lebel et al., 1998; Pape et al., 2010). Here, the binding sequence is a hexamer (ACGTCA). The ORA59 promoter contains a functionally important ACGTCA sequence next to a GCCGCC element (Fig. 5A). ChIP experiments detected TGA proteins at the ORA59 but not at the ERF96 promoter, which contains the pentameric CGTCA motif. We, therefore, conclude that expression of ORA59 is directly controlled by TGA factors and that the ORA59-dependent ERF96 gene is an indirect target of TGA factors.
Because the ORA59 promoter might be connected to the ET-signaling cascade through EIN3 (Pré et al., 2008), we envision that an EIN3-activated process depends on class II TGAs at the ORA59 promoter. Examples for a supporting role of TGA factors in promoters responding to different stimuli have been reported before. The as-1 element is required to mediate light-responsive gene expression from a chimeric promoter consisting of four light-responsive cis-elements fused to the CaMV core promoter (Lam and Chua, 1990). Likewise, JA-activated transcriptional activator MYC2 cannot activate its target CYP81D11 in tga256 plants (Köster et al., 2012). It can be envisioned that TGA factors are necessary components of protein complexes (also called enhanceosomes) that have to assemble to initiate transcription at the corresponding promoters.
The identification of TGA factors at the ORA59 promoter and the insensitivity of the tga256 mutant to the negative SA effect on defense responses against B. cinerea (Fig. 1) give rise to the speculation that TGAs perceive the negative SA signal directly at the ORA59 promoter. Consistently, preliminary ChIP experiments revealed that SA lowers the amount of ORA59 promoter fragments that can be immunoprecipitated with the α-TGA2,5 antiserum (Supplemental Fig. S1). Whether this effect results from reduced DNA binding of TGA factors or compromised recognition by the antiserum because of the recruitment of repressive proteins cannot be resolved. We have shown before that ectopic expression of the TGA-interacting GLUTAREDOXIN480 (GRX480)/ROXY19 interferes with ACC-induced ORA59 transcription (Zander et al., 2012). Therefore, we propose the following scenario (Fig. 7): GRX480/ROXY19, which is induced by SA, is recruited to class II TGAs at the ORA59 promoter, where it represses transcription. Whatever the repressive mechanism, our model has to be reconciled with the well-established role of these TGA factors as positive regulators of gene expression after SA treatment (Zhang et al., 2003). In this case, class II TGAs recruit either the SA-regulated transcriptional coactivator NPR1 (Rochon et al., 2006) or the xenobiotic-activated regulatory protein SCL14 (Fode et al., 2008) to a distinct set of target promoters. In conclusion, it has to be assumed that the recruitment of different TGA-interacting proteins depends on the promoter context.
ORA59 But Not ERF1 Affects Expression of Downstream Genes Subject to the SA-ET Antagonism
In accordance with the concept that AP2/ERF transcription factors are activators of ET-induced genes, their binding motif (GCCGCC) is significantly enriched in the promoters of 374 ACC-induced genes. The relative abundance of these binding sites in the different subgroups of these genes correlates with the average induction levels, which are high in the group of SA-suppressed genes (6.4-fold), intermediate in the group of TGA-dependent genes that are not suppressed by SA (3.6-fold), and low for the TGA-independent genes (2.7-fold). It is conspicuous that the GCCGCC motif is even more enriched in the group of TGA-dependent genes that are suppressed by SA (Fig. 2B). Moreover, the GCTGCT sequence is found more frequently than expected in these promoters. Whether this motif is recognized by ORA59, other ERFs, or other transcription factors is not known.
When ectopically expressed, ERF1 and ERF14 constitutively activate PDF1.2 (Berrocal-Lobo et al., 2002; Oñate-Sánchez et al., 2007). In our experimental setup, ERF1 and ERF14 transcript levels are elevated, even under conditions where PDF1.2 transcript levels have remained low (in the presence of SA, in the tga256 mutant, or in the ora59 mutant; Fig. 4). This suggests that ORA59 is the most important regulator of PDF1.2 and that endogenous levels of ERF1 and ERF14 are not high enough to activate PDF1.2 expression. ERF1 and ERF14 expression partially depends on ORA59, which correlates with a weak influence of SA and tga256 alleles. Direct binding of EIN3 to the ERF1 promoter (Chang et al., 2013) might explain why part of its activation is ORA59 and TGA independent.
The TGA-Dependent SA-ET Antagonism May Target Processes Independent from ORA59 Transcription
ACC-induced ORA59 transcription is negatively regulated by SA, but it is not as stringently affected as transcription of downstream genes like, for example, MYB113, ERF96, and PDF1.2 (Fig. 4). Moreover, the extent of the SA effect on ORA59 transcription varies between experiments, whereas the stringency on PDF1.2 expression is very robust (Supplemental Fig. S3). In addition, our microarray analysis has revealed 22 ACC-induced genes that show a more pronounced down-regulation by SA than ORA59 (Supplemental Data Set S3). Based on the fact that a TGACGT motif is found only in two of these genes, it is unlikely that they are controlled by the same TGA-dependent mechanism as ORA59.
One possible explanation for an enhancement of the SA-ET antagonism at promoters regulated by ORA59 would be that the ratio between ORA59 and the repressive ERF-associated amphiphilic repression (EAR) domain containing AP2/ERF transcription factors changes after SA treatment. Figure 4 shows that ERF9 transcript levels are only slightly negatively affected by SA. Likewise, the repressive ERFs ERF8 and ERF11 belong to the group of ACC-induced genes that are not suppressed by SA (Supplemental Dataset S5). As soon as ORA59 protein levels would drop beneath a certain threshold, EAR-ERFs, which are only slightly affected by SA, might compete efficiently with ORA59 at GCCGCC elements and would, thus, lower transcription of ACC-induced ORA59 target genes. This notion is consistent with a recent report that documents a repressive function of ERF9 at the GCCGCC element of the PDF1.2 promoter (Maruyama et al., 2013). Although such a contribution of repressive ERFs to the SA-ET antagonism is conceivable, it does not explain that the SA-ET antagonism is stronger at promoters downstream of ORA59 than on the ORA59 promoter itself.
Another scenario would be that ORA59 protein levels or ORA59 protein activity are regulated. Because activation of the ORA59 target genes is strictly TGA dependent, we would postulate that TGA factors exert either directly or indirectly a positive effect on ORA59 protein activity. This activity would be counteracted by SA (Fig. 7). Recently, a negative effect of SA on ORA59 protein levels was shown in plants that constitutively express ORA59 (Van der Does et al., 2013). Therefore, SA-TGA-dependent modulation of ORA59 protein levels might also play a role in the SA-ET antagonism. Although the negative effect of SA on PDF1.2 transcript levels is very robust, the negative effect of SA on ORA59 protein levels in SA-JA-treated plants was not consistently observed (Van der Does et al., 2013). Thus, the relative contribution of transcriptional and posttranscriptional regulation of ORA59 might change depending on the prevailing environmental conditions. Because the SA antagonism involves different genetic components depending on whether the pathway is induced by JA or ET (Leon-Reyes et al., 2009, 2010a), fluctuating endogenous levels of these hormones might influence the mode of SA antagonism.
ORA59 and TGA Factors Control Expression of ACC-Induced ANAC032 That Is Not Suppressed by SA
Although our study focused on those ACC-induced genes that are suppressed by SA, we have to discuss our observation that TGA transcription factors contribute to expression of 73 ACC-induced genes that are not subject to the SA-ET cross talk (Fig. 3). If TGA factors would only target the ORA59 promoter, all of the TGA-dependent genes would be downstream of ORA59 and should be suppressed by SA (Fig. 7). Therefore, we have to postulate that TGA factors regulate other promoters in a way that is not subject to the inhibition by SA. It is known that TGA factors can recruit different interacting proteins, like NPR1 and SCL14, to different SA-inducible promoters (Rochon et al., 2006; Fode et al., 2008). Conspicuously, the group of TGA-dependent genes that were not suppressed by SA contains transcription factor ANAC032 (Supplemental Data Set S4). In the absence of ACC, this gene can be induced by SA and requires class II TGAs and their coactivator SCL14 for maximal expression (Fode et al., 2008). The ANAC032 promoter encodes three TGACGT motifs and is most likely a direct target of the TGA-SCL14 complex. Moreover, it contains a GCCGCC box, which might serve as a binding site for ORA59. Therefore, it can be envisioned that adding SA to the ACC-treated plants leads to a lower activation of the promoter by ORA59, which is compensated for by the activating effect of SA through the TGA-SCL14 complex (Fig. 7).
Class II TGA Factors Are Not Required for Expression of a Group of ACC-Induced Genes That Are Not Subject to the SA Antagonism
From 228 genes that were expressed independently of TGA factors, only 1 gene was suppressed by SA. This supports the notion that class II TGAs are the main mediators of the SA-ET antagonism. Although gene ontology term analysis did not indicate that TGA-regulated genes encode more proteins involved in defense than TGA-independent genes, we noticed that genes related to general processes, like ET synthesis (1-AMINOCYCLOPROPANE-1-CARBOXYLIC ACID OXIDASE2 [ACO2] and ACO3) and signaling (CONSTITUTIVE TRIPLE RESPONSE1 [CTR1] and ETHYLENE RECEPTOR2) are expressed in a TGA-independent manner. Only the stress-responsive 1-AMINOCYCLOPROPANE-1-CARBOXYLIC ACID SYNTHASE6 is expressed to lower levels in the tga256 mutant. Thus, general ET responses might not be under the control of TGA factors. This fits to the observation that TGA factors are only marginally contributing to the ACC-induced growth defects at the seedling stage and that they do not influence the strong ctr1 phenotype (Fig. 6).
The antagonism between the SA-dependent and the JA-ET-dependent signaling pathways has been observed in many species, including members of monocots and dicots (Thaler et al., 2012), suggesting that it is under strong positive selection. Class II TGAs at the ORA59 promoter play an important role in this process, at least in Arabidopsis. Additional studies will have to unravel how this SA-mediated repression is executed by either ROXY-type glutaredoxins or other regulatory mechanisms. Moreover, processes occurring downstream of ORA59 transcription have to be elucidated.
MATERIALS AND METHODS
Plant Material and Growth Conditions
Arabidopsis (Arabidopsis thaliana) accession Columbia (Col-0) was used as the wild type, and all mutants and transgenic plants were in the Col-0 background. The tga6-1 tga2-1 tga5-1 (tga256) triple mutant (Zhang et al., 2003) was obtained from Yuelin Zhang (University of British Columbia, Vancouver, Canada), and the ctr1-1 (ctr1) mutant (Kieber et al., 1993; Nottingham Arabidopsis Stock Centre [NASC] stock N8057) and the ora59 mutant (GABI-Kat line GK-061A12) were from NASC. Genotyping of ora59, which contains a transfer DNA insertion at position amino acid 151 within the 244-amino acid open reading frame, was performed with primers P1/P2 (Supplemental Table S1). The progeny of the ctr1 tga256 cross was genotyped using primers P3 to P8. Except for the triple response assay, where seedlings were grown on agar plates containing Murashige and Skoog (MS) medium in the dark, plants were grown for 4 weeks on steamed soil (Archut, Fruhstorfer Erde, T25, Str1fein) in growth chambers with light intensity at 80 to 100 µmol photons m−2 s−1 and 60% humidity. For Botrytis cinerea infections, plants were grown at a 12-h light/12-h dark regime at 22°C to 24°C/18°C to 20°C; for RNA, ChIP, and GUS analyses, plants were grown in a 16-h light/8-h dark cycle (22°C/18°C). In general, cultivation was done at one plant per pot, except for GUS assays, where 25 plants were grown in one pot.
Chemical Treatment and Pathogen Infection
For ET induction, plants were sprayed with 1 mm ET precursor ACC (Sigma-Aldrich; Pieterse et al., 1998). For the SA-ACC treatment, 1 mm sodium salicylate (Merck) was applied either alone or together with ACC. Water spraying served as the control treatment. Plants were harvested at the time points indicated. Drop infection with B. cinerea and quantification of lesion sizes were done as described before (Zander et al., 2010). For the triple response assay, surface-sterilized wild-type and tga256 mutant seeds were sown on agar plates containing MS medium supplemented with or without 10 µm ACC. After 4 d at 4°C in the dark, the seedlings were transferred for 2 h to the light and then again, 2 d in the dark at 22°C.
Quantitative RT-PCR Analysis
RNA extraction and quantitative RT-PCR analyses were performed as described (Fode et al., 2008). Calculations were done according to the 2−ΔCT method (Livak and Schmittgen, 2001) using the UBIQUITIN5 (At3g62250) gene as a reference (Kesarwani et al., 2007). Primers serving to amplify and quantify transcript levels are indicated in Supplemental Table S2.
Construction of Recombinant Plasmids and Stable Plant Transformation
Gateway technology (Invitrogen) was used to generate binary vectors for analysis of the ORA59 promoter. The promoter region from base pair position −933 to +45 relative to the predicted transcriptional start site (+1) of the ORA59 (At1g06160) gene was amplified using primers P9 and P10 (primer sequences are shown in Supplemental Table S1), which add GATEWAY recombination sites to the promoter fragment. Genomic DNA extracted from Col-0 plants using the DNeasy Plant Mini Kit (Qiagen) served as the template. The fragment was inserted into pDONR223 (Invitrogen), resulting in pDONR223/ORA59Pro. Mutation of the TGACG(T) motif at base pair position −314 to -319 to five As was achieved by PCR using primer pairs P11-P12 and P13-P14 and pDONR223/ORA59Pro as a template, resulting in two fragments that subsequently served as templates for overlapping PCR with primers P11 and P14. Promoter fragments were recombined upstream of the GUS gene in the binary vector pBGWFS7 (http://www.psb.ugent.be/gateway/). Sequencing confirmed that promoter sequences were identical to the published sequences (TAIR) and that the mutations had been introduced as indicated in Figure 5. For generation of transgenic plants, binary plasmids were electroporated into Agrobacterium tumefaciens strain GV3101 (pMP90). The resulting agrobacteria were used to transform Col-0 plants using the floral dipping method (Clough and Bent, 1998). The combined material of 20 to 30 individuals of the F2 progeny of 22 independent lines of each construct was analyzed.
GUS Assays
Quantitative GUS assays were performed using 4-methyl-umbelliferyl-β-d-glucuronide (Sigma-Aldrich) as a substrate (Jefferson, 1989). The released fluorescence was measured with a Synergy HT plate reader (BioTek). The total amount of protein was determined using the Bradford assay solution.
Microarray Analyses
Four-week-old soil-grown wild-type and tga256 mutant plants were treated for 12 h with 1 mm ACC, 1 mm SA, or a combined treatment with 1 mm ACC and 1 mm SA or water. The experiment was repeated three times. In each experiment, the aerial parts of eight plants per treatment and genotype were combined, resulting in three independent samples per treatment and genotype. RNA extraction was carried out using the RNeasy Plant Mini Kit (Qiagen). Microarray analysis was performed with Arabidopsis ATH1 arrays by the NASC’s International Affymetrix Service. Robust multiarray average-normalized data, fold change values, and P values derived from moderated t statistics were obtained from the Affymetrix CEL files using the Robin version 1.1.2 software (Lohse et al., 2010). To cluster and visualize relative expression data by one-dimensional self-organizing maps, robust multiarray average-normalized expression values (linear scale) were imported into the MarVis version 1.0 program (Kaever et al., 2009). Aggregation of repeated measurements for each condition was performed using the corresponding mean values. The resulting intensity vectors were normalized using the Euclidean norm before clustering. Supplemental Data Set S9 gives the expression values of the genes as sorted by the MarVis cluster analysis. For cis-element enrichment analyses, the algorithm Cluster Analysis Real Randomization incorporated into Motif Mapper version 5.2.4.01 (Berendzen et al., 2012) was deployed to define significant distribution alterations compared with 1,000 randomly composed, equally sized reference promoter datasets; 1,000-bp upstream regions of 33,602 Arabidopsis genes were downloaded from TAIR (ftp://ftp.arabidopsis.org/Sequences/blast_datasets/TAIR10_blastsets/upstream_sequences/TAIR10_upstream_1000_20101104), and promoter regions were analyzed with a motif list containing 1,418 promoter elements from the JASPAR (Sandelin et al., 2004), PLACE (Higo et al., 1999), TRANSFAC (Matys et al., 2006), and PlantCARE (Lescot et al., 2002) databases. After determination of motif (Watson or Crick orientation) abundance, enrichment or depletion in the experimental dataset compared with the randomized background was calculated using a standard Z score.
ChIP Analyses
Four-week-old soil-grown wild-type and tga256 mutant plants were treated for 24 h with 1 mm ACC or water. Leaf material from 10 plants per treatment and genotype was combined and cross linked. Cross linking and chromatin isolation were performed as described in Fode et al., 2008. The immunoprecipitation was carried out as previously described (Saleh et al., 2008) using a TGA2,5 antiserum (Ndamukong et al., 2007). For preclearing, the chromatins were incubated with preimmune serum for 2 h at 4°C and subsequently incubated with Protein A Dynabeads (Invitrogen) for another 2 h at 4°C. The chromatins were incubated overnight with 5 µL of TGA2,5 antiserum and afterward, for 2 h at 4°C with Protein A Dynabeads (Invitrogen). After washing, elution, and precipitation, the DNA was subjected to quantitative PCR analyses. Calculations were done according to the 2−ΔCT method (Livak and Schmittgen, 2001). An amplified genomic fragment of ACTIN8 was used for normalization. Primers are depicted in Supplemental Table S1 (ACTIN8 P15-P16, ORA59 P17-P18, and ERF96 P19-P20).
Arabidopsis Genome Initiative numbers for genes described in this article are listed in Supplemental Table S3. Microarray data have been deposited in the NASC’s microarray database under reference number NASCARRAYS-569 (ftp://ftp.arabidopsis.info/NASCarrays/By_Experiment_ID/Exp569/).
Supplemental Data
The following materials are available in the online version of this article.
Supplemental Figure S1. ChIP analysis of TGA binding to the ORA59 promoter.
Supplemental Figure S2. GUS activities of independent transformants encoding the wild type and the mutated ORA59 promoter upstream of the GUS reporter gene.
Supplemental Figure S3. Time-dependent expression analysis of selected transcription factors and PDF1.2 in ACC-treated and ACC-SA-treated wild-type and tga256 plants.
Supplemental Table S1. Primers for genotyping, cloning, and ChIP analyses.
Supplemental Table S2. Primers for quantitative RT-PCR analyses.
Supplemental Table S3. Accession numbers.
Supplemental Data Set S1. Expression data of 374 ACC-induced genes.
Supplemental Data Set S2. Expression data of 136 TGA-dependent ACC-induced genes.
Supplemental Data Set S3. Expression data of 63 TGA-dependent ACC-induced genes suppressed by SA.
Supplemental Data Set S4. Expression data of 73 TGA-dependent ACC-induced genes not suppressed by SA.
Supplemental Data Set S5. Expression data of 238 TGA-independent ACC-induced genes.
Supplemental Data Set S6. Expression data of 11 TGA-independent ACC-induced genes suppressed by SA.
Supplemental Data Set S7. Expression data of 74 ACC-induced genes suppressed by SA.
Supplemental Data Set S8. Expression data of 356 SA-induced genes.
Supplemental Data Set S9. Expression data of 374 ACC-induced genes as sorted by MarVis cluster analysis.
Supplementary Material
Acknowledgments
We thank Anna Hermann, Larissa Kunze, and Ronald Scholz for excellent technical assistance.
Glossary
- ACC
1-aminocyclopropane-1-carboxylic acid
- ChIP
chromatin immunoprecipitation
- Col-0
Arabidopsis (Arabidopsis thaliana) accession Columbia
- ET
ethylene
- JA
jasmonic acid
- MS
Murashige and Skoog
- NASC
Nottingham Arabidopsis Stock Centre
- RT
reverse transcription
- SA
salicylic acid
Footnotes
This work was supported by the Alfried Krupp von Bohlen und Halbach Foundation and the German Science Foundation (grant no. GA330/21–1 to C.G.).
Some figures in this article are displayed in color online but in black and white in the print edition.
The online version of this article contains Web-only data.
References
- Alonso JM, Stepanova AN, Solano R, Wisman E, Ferrari S, Ausubel FM, Ecker JR. (2003) Five components of the ethylene-response pathway identified in a screen for weak ethylene-insensitive mutants in Arabidopsis. Proc Natl Acad Sci USA 100: 2992–2997 [DOI] [PMC free article] [PubMed] [Google Scholar]
- An F, Zhao Q, Ji Y, Li W, Jiang Z, Yu X, Zhang C, Han Y, He W, Liu Y, et al. (2010) Ethylene-induced stabilization of ETHYLENE INSENSITIVE3 and EIN3-LIKE1 is mediated by proteasomal degradation of EIN3 binding F-box 1 and 2 that requires EIN2 in Arabidopsis. Plant Cell 22: 2384–2401 [DOI] [PMC free article] [PubMed] [Google Scholar]
- Berendzen KW, Weiste C, Wanke D, Kilian J, Harter K, Dröge-Laser W. (2012) Bioinformatic cis-element analyses performed in Arabidopsis and rice disclose bZIP- and MYB-related binding sites as potential AuxRE-coupling elements in auxin-mediated transcription. BMC Plant Biol 12: 125. [DOI] [PMC free article] [PubMed] [Google Scholar]
- Berrocal-Lobo M, Molina A, Solano R. (2002) Constitutive expression of ETHYLENE-RESPONSE-FACTOR1 in Arabidopsis confers resistance to several necrotrophic fungi. Plant J 29: 23–32 [DOI] [PubMed] [Google Scholar]
- Chang KN, Zhong S, Weirauch MT, Hon G, Pelizzola M, Li H, Huang SS, Schmitz RJ, Urich MA, Kuo D, et al. (2013) Temporal transcriptional response to ethylene gas drives growth hormone cross-regulation in Arabidopsis. eLife 2: e00675. [DOI] [PMC free article] [PubMed] [Google Scholar]
- Clough SJ, Bent AF. (1998) Floral dip: a simplified method for Agrobacterium-mediated transformation of Arabidopsis thaliana. Plant J 16: 735–743 [DOI] [PubMed] [Google Scholar]
- De Vos M, Van Oosten VR, Van Poecke RM, Van Pelt JA, Pozo MJ, Mueller MJ, Buchala AJ, Métraux JP, Van Loon LC, Dicke M, et al. (2005) Signal signature and transcriptome changes of Arabidopsis during pathogen and insect attack. Mol Plant Microbe Interact 18: 923–937 [DOI] [PubMed] [Google Scholar]
- Fode B, Siemsen T, Thurow C, Weigel R, Gatz C. (2008) The Arabidopsis GRAS protein SCL14 interacts with class II TGA transcription factors and is essential for the activation of stress-inducible promoters. Plant Cell 20: 3122–3135 [DOI] [PMC free article] [PubMed] [Google Scholar]
- Glazebrook J. (2005) Contrasting mechanisms of defense against biotrophic and necrotrophic pathogens. Annu Rev Phytopathol 43: 205–227 [DOI] [PubMed] [Google Scholar]
- Godoy M, Franco-Zorrilla JM, Pérez-Pérez J, Oliveros JC, Lorenzo O, Solano R. (2011) Improved protein-binding microarrays for the identification of DNA-binding specificities of transcription factors. Plant J 66: 700–711 [DOI] [PubMed] [Google Scholar]
- Higo K, Ugawa Y, Iwamoto M, Korenaga T. (1999) Plant cis-acting regulatory DNA elements (PLACE) database: 1999. Nucleic Acids Res 27: 297–300 [DOI] [PMC free article] [PubMed] [Google Scholar]
- Izawa T, Foster R, Chua NH. (1993) Plant bZIP protein DNA binding specificity. J Mol Biol 230: 1131–1144 [DOI] [PubMed] [Google Scholar]
- Jefferson RA. (1989) The GUS reporter gene system. Nature 342: 837–838 [DOI] [PubMed] [Google Scholar]
- Jones JD, Dangl JL. (2006) The plant immune system. Nature 444: 323–329 [DOI] [PubMed] [Google Scholar]
- Kaever A, Lingner T, Feussner K, Göbel C, Feussner I, Meinicke P. (2009) MarVis: a tool for clustering and visualization of metabolic biomarkers. BMC Bioinformatics 10: 92. [DOI] [PMC free article] [PubMed] [Google Scholar]
- Kesarwani M, Yoo J, Dong X. (2007) Genetic interactions of TGA transcription factors in the regulation of pathogenesis-related genes and disease resistance in Arabidopsis. Plant Physiol 144: 336–346 [DOI] [PMC free article] [PubMed] [Google Scholar]
- Kieber JJ, Rothenberg M, Roman G, Feldmann KA, Ecker JR. (1993) CTR1, a negative regulator of the ethylene response pathway in Arabidopsis, encodes a member of the raf family of protein kinases. Cell 72: 427–441 [DOI] [PubMed] [Google Scholar]
- Köster J, Thurow C, Kruse K, Meier A, Iven T, Feussner I, Gatz C. (2012) Xenobiotic- and jasmonic acid-inducible signal transduction pathways have become interdependent at the Arabidopsis CYP81D11 promoter. Plant Physiol 159: 391–402 [DOI] [PMC free article] [PubMed] [Google Scholar]
- Krawczyk S, Thurow C, Niggeweg R, Gatz C. (2002) Analysis of the spacing between the two palindromes of activation sequence-1 with respect to binding to different TGA factors and transcriptional activation potential. Nucleic Acids Res 30: 775–781 [DOI] [PMC free article] [PubMed] [Google Scholar]
- Lam E, Benfey PN, Gilmartin PM, Fang RX, Chua NH. (1989) Site-specific mutations alter in vitro factor binding and change promoter expression pattern in transgenic plants. Proc Natl Acad Sci USA 86: 7890–7894 [DOI] [PMC free article] [PubMed] [Google Scholar]
- Lam E, Chua NH. (1990) GT-1 binding site confers light responsive expression in transgenic tobacco. Science 248: 471–474 [DOI] [PubMed] [Google Scholar]
- Lebel E, Heifetz P, Thorne L, Uknes S, Ryals J, Ward E. (1998) Functional analysis of regulatory sequences controlling PR-1 gene expression in Arabidopsis. Plant J 16: 223–233 [DOI] [PubMed] [Google Scholar]
- Leon-Reyes A, Du Y, Koornneef A, Proietti S, Körbes AP, Memelink J, Pieterse CM, Ritsema T. (2010a) Ethylene signaling renders the jasmonate response of Arabidopsis insensitive to future suppression by salicylic Acid. Mol Plant Microbe Interact 23: 187–197 [DOI] [PubMed] [Google Scholar]
- Leon-Reyes A, Spoel SH, De Lange ES, Abe H, Kobayashi M, Tsuda S, Millenaar FF, Welschen RA, Ritsema T, Pieterse CM. (2009) Ethylene modulates the role of NONEXPRESSOR OF PATHOGENESIS-RELATED GENES1 in cross talk between salicylate and jasmonate signaling. Plant Physiol 149: 1797–1809 [DOI] [PMC free article] [PubMed] [Google Scholar]
- Leon-Reyes A, Van der Does D, De Lange ES, Delker C, Wasternack C, Van Wees SC, Ritsema T, Pieterse CM. (2010b) Salicylate-mediated suppression of jasmonate-responsive gene expression in Arabidopsis is targeted downstream of the jasmonate biosynthesis pathway. Planta 232: 1423–1432 [DOI] [PMC free article] [PubMed] [Google Scholar]
- Lescot M, Déhais P, Thijs G, Marchal K, Moreau Y, Van de Peer Y, Rouzé P, Rombauts S. (2002) PlantCARE, a database of plant cis-acting regulatory elements and a portal to tools for in silico analysis of promoter sequences. Nucleic Acids Res 30: 325–327 [DOI] [PMC free article] [PubMed] [Google Scholar]
- Livak KJ, Schmittgen TD. (2001) Analysis of relative gene expression data using real-time quantitative PCR and the 2(-Delta C(T)) method. Methods 25: 402–408 [DOI] [PubMed] [Google Scholar]
- Lohse M, Nunes-Nesi A, Krüger P, Nagel A, Hannemann J, Giorgi FM, Childs L, Osorio S, Walther D, Selbig J, et al. (2010) Robin: an intuitive wizard application for R-based expression microarray quality assessment and analysis. Plant Physiol 153: 642–651 [DOI] [PMC free article] [PubMed] [Google Scholar]
- Lorenzo O, Piqueras R, Sánchez-Serrano JJ, Solano R. (2003) ETHYLENE RESPONSE FACTOR1 integrates signals from ethylene and jasmonate pathways in plant defense. Plant Cell 15: 165–178 [DOI] [PMC free article] [PubMed] [Google Scholar]
- Maruyama Y, Yamoto N, Suzuki Y, Chiba Y, Yamazaki K, Sato T, Yamaguchi J. (2013) The Arabidopsis transcriptional repressor ERF9 participates in resistance against necrotrophic fungi. Plant Sci 213: 79–87 [DOI] [PubMed] [Google Scholar]
- Matys V, Kel-Margoulis OV, Fricke E, Liebich I, Land S, Barre-Dirrie A, Reuter I, Chekmenev D, Krull M, Hornischer K, et al. (2006) TRANSFAC and its module TRANSCompel: transcriptional gene regulation in eukaryotes. Nucleic Acids Res 34: D108–D110 [DOI] [PMC free article] [PubMed] [Google Scholar]
- McGrath KC, Dombrecht B, Manners JM, Schenk PM, Edgar CI, Maclean DJ, Scheible WR, Udvardi MK, Kazan K. (2005) Repressor- and activator-type ethylene response factors functioning in jasmonate signaling and disease resistance identified via a genome-wide screen of Arabidopsis transcription factor gene expression. Plant Physiol 139: 949–959 [DOI] [PMC free article] [PubMed] [Google Scholar]
- Mou Z, Fan W, Dong X. (2003) Inducers of plant systemic acquired resistance regulate NPR1 function through redox changes. Cell 113: 935–944 [DOI] [PubMed] [Google Scholar]
- Nakano T, Suzuki K, Fujimura T, Shinshi H. (2006a) Genome-wide analysis of the ERF gene family in Arabidopsis and rice. Plant Physiol 140: 411–432 [DOI] [PMC free article] [PubMed] [Google Scholar]
- Nakano T, Suzuki K, Ohtsuki N, Tsujimoto Y, Fujimura T, Shinshi H. (2006b) Identification of genes of the plant-specific transcription-factor families cooperatively regulated by ethylene and jasmonate in Arabidopsis thaliana. J Plant Res 119: 407–413 [DOI] [PubMed] [Google Scholar]
- Ndamukong I, Abdallat AA, Thurow C, Fode B, Zander M, Weigel R, Gatz C. (2007) SA-inducible Arabidopsis glutaredoxin interacts with TGA factors and suppresses JA-responsive PDF1.2 transcription. Plant J 50: 128–139 [DOI] [PubMed] [Google Scholar]
- Oñate-Sánchez L, Anderson JP, Young J, Singh KB. (2007) AtERF14, a member of the ERF family of transcription factors, plays a nonredundant role in plant defense. Plant Physiol 143: 400–409 [DOI] [PMC free article] [PubMed] [Google Scholar]
- Pape S, Thurow C, Gatz C. (2010) The Arabidopsis thaliana PR-1 promoter contains multiple integration sites for the coactivator NPR1 and the repressor SNI1. Plant Physiol 154: 1805–1818 [DOI] [PMC free article] [PubMed] [Google Scholar]
- Penninckx IA, Thomma BP, Buchala A, Métraux JP, Broekaert WF. (1998) Concomitant activation of jasmonate and ethylene response pathways is required for induction of a plant defensin gene in Arabidopsis. Plant Cell 10: 2103–2113 [DOI] [PMC free article] [PubMed] [Google Scholar]
- Pieterse CM, van Wees SC, van Pelt JA, Knoester M, Laan R, Gerrits H, Weisbeek PJ, van Loon LC. (1998) A novel signaling pathway controlling induced systemic resistance in Arabidopsis. Plant Cell 10: 1571–1580 [DOI] [PMC free article] [PubMed] [Google Scholar]
- Pré M, Atallah M, Champion A, De Vos M, Pieterse CM, Memelink J. (2008) The AP2/ERF domain transcription factor ORA59 integrates jasmonic acid and ethylene signals in plant defense. Plant Physiol 147: 1347–1357 [DOI] [PMC free article] [PubMed] [Google Scholar]
- Qin XF, Holuigue L, Horvath DM, Chua NH. (1994) Immediate early transcription activation by salicylic acid via the cauliflower mosaic virus as-1 element. Plant Cell 6: 863–874 [DOI] [PMC free article] [PubMed] [Google Scholar]
- Rochon A, Boyle P, Wignes T, Fobert PR, Després C. (2006) The coactivator function of Arabidopsis NPR1 requires the core of its BTB/POZ domain and the oxidation of C-terminal cysteines. Plant Cell 18: 3670–3685 [DOI] [PMC free article] [PubMed] [Google Scholar]
- Saleh A, Alvarez-Venegas R, Avramova Z. (2008) An efficient chromatin immunoprecipitation (ChIP) protocol for studying histone modifications in Arabidopsis plants. Nat Protoc 3: 1018–1025 [DOI] [PubMed] [Google Scholar]
- Sandelin A, Alkema W, Engström P, Wasserman WW, Lenhard B. (2004) JASPAR: an open-access database for eukaryotic transcription factor binding profiles. Nucleic Acids Res 32: D91–D94 [DOI] [PMC free article] [PubMed] [Google Scholar]
- Singh K, Dennis ES, Ellis JG, Llewellyn DJ, Tokuhisa JG, Wahleithner JA, Peacock WJ. (1990) OCSBF-1, a maize ocs enhancer binding factor: isolation and expression during development. Plant Cell 2: 891–903 [DOI] [PMC free article] [PubMed] [Google Scholar]
- Spoel SH, Dong X. (2008) Making sense of hormone crosstalk during plant immune responses. Cell Host Microbe 3: 348–351 [DOI] [PubMed] [Google Scholar]
- Spoel SH, Johnson JS, Dong X. (2007) Regulation of tradeoffs between plant defenses against pathogens with different lifestyles. Proc Natl Acad Sci USA 104: 18842–18847 [DOI] [PMC free article] [PubMed] [Google Scholar]
- Spoel SH, Koornneef A, Claessens SM, Korzelius JP, Van Pelt JA, Mueller MJ, Buchala AJ, Métraux JP, Brown R, Kazan K, et al. (2003) NPR1 modulates cross-talk between salicylate- and jasmonate-dependent defense pathways through a novel function in the cytosol. Plant Cell 15: 760–77012615947 [Google Scholar]
- Thaler JS, Humphrey PT, Whiteman NK. (2012) Evolution of jasmonate and salicylate signal crosstalk. Trends Plant Sci 17: 260–270 [DOI] [PubMed] [Google Scholar]
- Van der Does D, Leon-Reyes A, Koornneef A, Van Verk MC, Rodenburg N, Pauwels L, Goossens A, Körbes AP, Memelink J, Ritsema T, et al. (2013) Salicylic acid suppresses jasmonic acid signaling downstream of SCFCOI1-JAZ by targeting GCC promoter motifs via transcription factor ORA59. Plant Cell 25: 744–761 [DOI] [PMC free article] [PubMed] [Google Scholar]
- Zander M, Chen S, Imkampe J, Thurow C, Gatz C. (2012) Repression of the Arabidopsis thaliana jasmonic acid/ethylene-induced defense pathway by TGA-interacting glutaredoxins depends on their C-terminal ALWL motif. Mol Plant 5: 831–840 [DOI] [PubMed] [Google Scholar]
- Zander M, La Camera S, Lamotte O, Métraux JP, Gatz C. (2010) Arabidopsis thaliana class-II TGA transcription factors are essential activators of jasmonic acid/ethylene-induced defense responses. Plant J 61: 200–210 [DOI] [PubMed] [Google Scholar]
- Zarei A, Körbes AP, Younessi P, Montiel G, Champion A, Memelink J. (2011) Two GCC boxes and AP2/ERF-domain transcription factor ORA59 in jasmonate/ethylene-mediated activation of the PDF1.2 promoter in Arabidopsis. Plant Mol Biol 75: 321–331 [DOI] [PMC free article] [PubMed] [Google Scholar]
- Zhang Y, Fan W, Kinkema M, Li X, Dong X. (1999) Interaction of NPR1 with basic leucine zipper protein transcription factors that bind sequences required for salicylic acid induction of the PR-1 gene. Proc Natl Acad Sci USA 96: 6523–6528 [DOI] [PMC free article] [PubMed] [Google Scholar]
- Zhang Y, Tessaro MJ, Lassner M, Li X. (2003) Knockout analysis of Arabidopsis transcription factors TGA2, TGA5, and TGA6 reveals their redundant and essential roles in systemic acquired resistance. Plant Cell 15: 2647–2653 [DOI] [PMC free article] [PubMed] [Google Scholar]
- Zheng XY, Spivey NW, Zeng W, Liu PP, Fu ZQ, Klessig DF, He SY, Dong X. (2012) Coronatine promotes Pseudomonas syringae virulence in plants by activating a signaling cascade that inhibits salicylic acid accumulation. Cell Host Microbe 11: 587–596 [DOI] [PMC free article] [PubMed] [Google Scholar]
- Zhu Z, An F, Feng Y, Li P, Xue L, A M, Jiang Z, Kim JM, To TK, Li W, et al. (2011) Derepression of ethylene-stabilized transcription factors (EIN3/EIL1) mediates jasmonate and ethylene signaling synergy in Arabidopsis. Proc Natl Acad Sci USA 108: 12539–12544 [DOI] [PMC free article] [PubMed] [Google Scholar]
Associated Data
This section collects any data citations, data availability statements, or supplementary materials included in this article.