

Abstract
Direct mTORC1 inhibition by short-term low-dose rapamycin treatment has recently been shown to improve CD8 T cell immunological memory. While these studies focused on memory development, the impact of low-dose rapamycin on the primary immune response, particularly as it relates to functional effector immunity, is far less clear. We investigated the impact of acute rapamycin treatment on immune effector cell function during the primary immune response to several acute infections. We found that functional CD8 T cell and macrophage responses to both viral and intracellular bacterial pathogens were depressed in mice in vivo and in humans to phorbol ester and calcium ionophore stimulation in vitro in the face of low-dose rapamycin treatment. Mechanistically, the CD8 defect was linked to impaired glycolytic switch in stimulated naïve cells and the reduced formation of short-lived effector cells (SLEC). Therefore, more than one cell type required for a protective effector immune response are impaired by rapamycin in both mice and humans, at the dose shown to improve immune memory and extend lifespan. This urges caution with regard to the relative therapeutic costs and benefits of rapamycin treatment as means to improve immune memory.
Introduction
Rapamycin (rapa) is a specific inhibitor of the mTORC1 signaling complex, the central regulator of cell nutrient sensing and energy metabolism (1). Applied in high doses (typical suppressive dose – 750 μg/kg), rapa is a well-known immune suppressant, used to prevent organ rejection (2). However, recent seminal studies highlighted the importance of nutrient sensing pathways during an immune response by showing that short-term mTORC1 inhibition using low-dose rapa (75μg/kg) enhanced the development of antigen-specific memory CD8 T cells during acute infection (3, 4). Subsequent studies suggested that the low-dose rapa used in the above studies did not adversely affect primary immune responses (5). Of note, these conclusions were based on limited data examining the presence, but not the function, of antigen-specific CD8 T cells. Recently, mTORC1 signaling has been shown to be required for Th1 differentiation (6, 7) likely by inducing Tbet expression (8). We therefore sought to reexamine whether mTORC1 inhibition by low-dose rapa treatment during CD8 T cell priming may have deleterious consequences to the functional CD8 T cell immune response during acute infection.
Here we report that low-dose rapa treatment inhibits CD8 T cell effector (CD8eff) accumulation and function during infections with both viral (lymphocytic choriomeningitis virus - LCMV) and bacterial (Listeria monocytogenes expressing the ovalbumin protein - Lm-OVA) microbial pathogens. This was likely due to a rapa-induced block in metabolic switch to glycolysis in stimulated CD8eff cells, which exhibited curtailed differentiation into short-lived effector cells (SLEC); by contrast, memory-precursor effector cells (MPEC) were unaffected or increased in the course of rapa treatment. Moreover, the same dose of rapa led to poor viral control in the brain and higher mortality of the West Nile Virus (WNV)-infected mice. Finally, the same dose of rapa inhibited human CD8 T cell cytokine secretion in vitro, and reduced intracellular acidification of vesicles following the uptake of Lm-OVA in both human and mouse macrophages. Our data shows that acute low-dose rapa treatment is deleterious to both innate and adaptive acute immunity against primary infection. Because the favorable effect on memory formation by rapa treatment likely comes at the expense of developing a robust primary effector response, rapa treatment/ mTORC1 modulation strategies to improve vaccine-mediated immune memory formation should consider the downside of increasing susceptibility to acute infections, which could be of particular importance in partially immunosuppressed and/or vulnerable individuals.
Materials and Methods
Mice
C57BL/6J (8-12 weeks old) were purchased from Jackson Labs (Bar Harbor, ME). Mice were housed under specific pathogen-free conditions at the University of Arizona. All experimental procedures were conducted with approval from the University of Arizona Institutional Animal Care and Use Committee.
Human subjects sample collection and PBMC isolation
Written informed consent was obtained and whole venous blood was collected into heparinized tubes from healthy volunteers. Subject inclusion criteria were limited to males, aged 20-30 years old at time of blood draw, who tested negative for both cytomegalovirus and flaviviruses. Exclusion criteria included any immune-compromising disease, heart disease, organ transplant, cancer, or stroke. Study was approved by the University of Arizona Institutional Review Board. PBMCs were isolated using Histopaque (Sigma-Aldrich, St. Louis, MO) and cryopreserved in DMSO/FBS (10%/90%) until use.
Rapamycin treatment
Rapamycin (Calbiochem, Darmstadt, Germany) was administered by daily i.p. injection beginning 2 days prior to infection and lasting through day 7 post-infection. Rapa was administered at a dose of 75μg/kg in 200μL of PBS. Control groups were given PBS + 1%DMSO (vehicle) injections. For in vitro assays, rapa was added at indicated concentrations to the cells at the outset of the assay and kept present throughout. For in vivo experiments rapa was quantified in whole blood as described previously (9), at the University of Arizona and the Texas Biomedical Research Institute (San Antonio, TX), with highly concordant results.
Infections
LCMV-Armstrong strain (simply referred to as LCMV) was generously provided by Dr Jeffrey Frelinger (University of Arizona) (10). Mice were infected with 104 pfu LCMV i.p. Lm-gp33 was generously provided by Dr. Susan Kaech (Yale University) (11). Mice were infected with 1-5×10⁵ cfu Lm-gp33 i.v. Lm-OVA (12) was generously provided by Dr Hao Shen (University of Pennsylvania). Mice were infected systemically i.v. with 1-5×10³ colony-forming units (cfu) of Lm-OVA. WNV strain 385-99, generously provided by Dr Robert Tesh (Univ. of Texas Medical Branch, Galveston), was used to infect mice at 103 pfu s.c. as described (13-15).
In vitro acidification assay
Mouse bone marrow macrophages were derived as previously described (16). Human monocytes were enriched using a CD14 positive-selection kit (Miltenyi Biotech, Auburn, CA). Culture media was replaced with antibiotic-free medium the night before the assay. Rapa groups were pre-treated with rapamycin at indicated concentrations for 2hr prior to infection. Chloroquine (Sigma) was used at 20μM as a positive control. Lm was stained with pH-insensitive e670 dye (eBioscience, San Diego, CA) to identify infected cells. Cells were infected (MOI=5-10) for 5 min, treated with gentamycin, then washed twice before staining with lysotracker (Molecular Probes, Eugene, OR). Infected cells were identified as e670+ and then the ratio of the geometric mean fluorescence intensity of acidic to neutral was calculated to determine relative lysosomal acidification.
In vivo CTL assay
In vivo CTL assay was performed as described previously (17). Briefly, splenocytes from uninfected mice were stained with DiI Vybrant (Molecular Probes) and then stained with increasing CFSE concentrations (1nm, 1uM, 10uM) that corresponded with increasing SIINFEKL peptide pulsing concentrations (no peptide, 100nM, 10μM). Populations were pooled and 15×106 total target cells were injected i.v. into Lm-OVA-primed mice on day 8 postinfection. Uninfected recipient mice were included as controls. Recipient spleens were analyzed 4hr later for target cell clearance. Percent target cell clearance was calculated by: %killing = 100-((pulsed targets of infected recipient/unpulsed targets of infected recipient)/(pulsed targets of naïve recipient/unpulsed targets of naïve recipient))x100.
Tetramer staining, in vitro stimulation, ICCS and flow cytometry reagents
Tetramer, ex vivo peptide stimulation for intracellular cytokine staining, and flow cytometry were performed as described previously (13, 18). PMA + ionomycin (eBioscience) stimulation was performed in the presence of rapamycin (concentrations as indicated) for 5hr at 37C. Brefeldin A was added for the last 3 hours of stimulation. Samples were fixed and permeabilized using the Foxp3 buffer kit (eBioscience) followed by intracellular staining. Polyfunctional analysis was performed by first gating on IFNγ+ CD8 T cells and then furtherer separating TNFα+ and Granzyme B+ subsets. Samples were collected on an LSR Fortessa flow cytometer (BD Biosciences San Jose, CA) and analyzed using FlowJo software (Tree Star, Ashland, OR). All antibodies were purchased from eBioscience, BD, and Invitrogen. Kb-OVA and Db-NS4b tetramer were provided by the NIH Tetramer Core Facility (Emory University of Georgia, Atlanta, Georgia). Db-gp33 was generously provided by Dr. Jeffrey Frelinger.
Bacterial Burden and Viral Titer Measurements
Bacterial burden in spleen and liver were determined by plating serial dilutions of tissue homogenate on BHI agar plates, as described previously (13). WNV viral titer was measured by plaque assay in the brain, harvested after mice were perfused with 30mL PBS (14).
Metabolism Assays
Naïve CD8 T cells were enriched from spleen and superficial lymph nodes using a CD8 negative selection kit (Miltenyi) to which we added CD44-biotin to further deplete CD44hi cells (95-99% purity). Cells were stimulated for 96hr with beads coated with anti-CD3 and anti-CD28 (Miltenyi) in RPMI media supplemented with FCS (10%), L-glut, β-mercaptoethanol, and pen/strep, and ± rapa (17ng/ml) as indicated. On the day of the assay, cells were harvested and separated from dead cells by percoll gradient centrifugation and stimulation beads, washed, counted, and plated in equal numbers on Seahorse plates (Seahorse Bioscience, Massachusettes, USA) according to manufacturers protocols. Glycolysis stress test assay was run according to manufacturers protocol using glucose (10mM), oligomycin (1.5μM), and 2-DG (100mM). Mitochondrial stress test was performed using oligomycin (1.5μM), FCCP (0.75μM), Rotenone (1μM), and Antimycin A (1μM) according to manufacturers protocol.
Data Analysis
Statistical analyses were performed using GraphPad Prism software (GraphPad, La Jolla, CA), as indicated in the text and legends. p<0.05 was considered significant for all analyses. * p<0.05; ** p<0.01; *** p<0.001; **** p<0.0001.
Results
Previous studies showed equal expansion of CD8 T cells in the course of an acute response to infection during low-dose rapa treatment (3). However, because there are no definitive data on whether that expansion is absolute, rather than simply relative, and because the presence of Ag-specific CD8 T cells does not necessarily equate to equal function of the responding cells, we re-addressed the impact of low-dose rapa treatment on antigen-specific CD8 T cell function in vivo during LCMV infection, used in the seminal work by Araki and colleagues (3). Rapa treatment was performed beginning 2 days prior to infection (designated day 0; see Materials and Methods). On day 8 post-infection, we found the number of splenic CD8 T cells that produced IFNγ in response to ex vivo gp33 peptide stimulation to be significantly (2.5-fold) decreased compared to vehicle-treated mice (Figure 1A). Furthermore, we found that these mice exhibited a specific decline in the most polyfunctional Ag-specific CD8 T cell subset, able to produce all three of the effector molecules measured: IFNγ, TNFα, and Granzyme B (Figure 1B). Importantly, the decrease in polyfunctional Ag-specific CD8 T cells was due to decreased proportion of these cells in rapa-treated mice compared to controls (Supplemental Figure 1), indicating loss of the polyfunctional population is not solely due to decreased overall numbers/survival of these cells. We conclude that even low-dose rapa has immunosuppressive properties that depress proliferation and function of Ag-specific effector CD8 T cells during LCMV infection.
Figure 1. Low dose rapamycin induces functional CD8 T cell cytokine defects during LCMV infection.
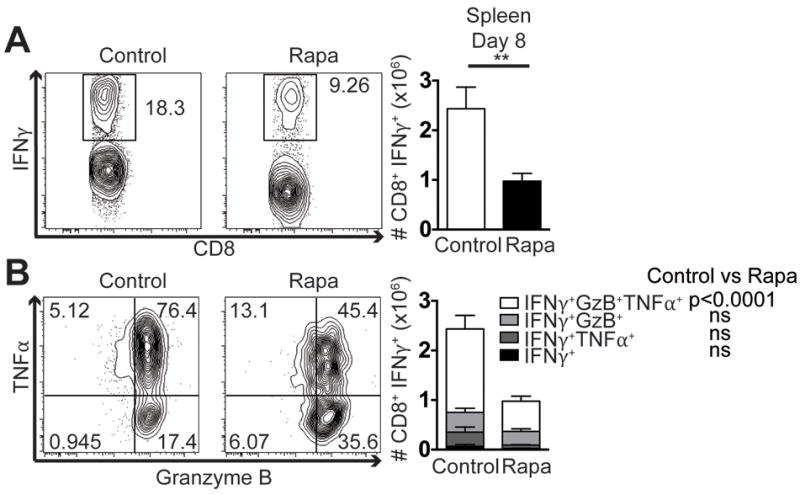
Mice were infected with 104 pfu LCMV i.p. On day 8 post-infection splenocytes were stimulated ex vivo with gp33 peptide. (A) CD8 T cells were first gated through IFNγ+ as shown in representative flow plots and quantified. (B) IFNγ+ cells were then further divided by TNFα and Granzyme B production as depicted and quantified. Representative of 2 independent repeats, each with n=8 mice/group. Unpaired two-tailed student’s t-test (A), or 2-way ANOVA (B) were used to determine statistical significance. In (A) and (C) control group is represented by open bars; rapa group is represented by filled bars. In (B) white part of the bar graph denotes the number of IFNγ+TNFα+Granzyme B+ CD8 T cells in the spleen; light grey is the number of IFNγ+Granzyme B+; dark grey is IFNγ+TNFα+; and black shows cells that are only IFNγ+.
To properly interpret our data, it was important to confirm that in our hands low-dose rapa improves CD8 T cell Ag-specific memory, as previously published by Araki and Ahmed (3). To test this, we used the same rapa treatment regimen during LCMV infection. At day 45 post-infection we measured significant increases in both frequency (Supplemental Figure 2A) and number (Supplemental Figure 2B) of gp33-specific CD8 T cells in the blood, exactly as described in the original work(3). In response to Lm-gp33 challenge, we confirmed that the memory response generated following rapa treatment conferred better protection, as mice that had been treated with rapa during their primary LCMV infection had improved bacterial clearance in the spleen on day 3 post-challenge (Supplemental Figure 2C). We further confirmed that at this dosing regimen, our mice experienced similar rapa exposure based on blood drug concentrations, which ranged from 8-15ng/ml (9), well within the range of 5-20ng/ml reported by Araki et al. (3). We conclude that our experimental conditions were similar to those previously reported and that depressed CD8 T cell effector function during the primary infection is indeed a consequence of the rapa treatment.
To assess whether these functional defects were pathogen-specific, we performed similar experiments using the bacterial pathogen Lm-OVA. First we compared early bacterial burden in the spleens and livers of mice in rapa or control groups at early time points after infection. Mice treated with rapa had significantly higher bacterial burden in both tissues compared to controls (Figure 2A). Because the burdens were increased early after infection, prior to the expansion of CD8 T cells required for clearance, this suggested that rapa may be inhibiting the function of other cell types, presumably neutrophils, macrophages, and/or granulocytes, which are responsible for early control of Lm infection.
Figure 2. Rapamycin delays bacterial clearance and CD8 T cell function killing during Lm- OVA infection.
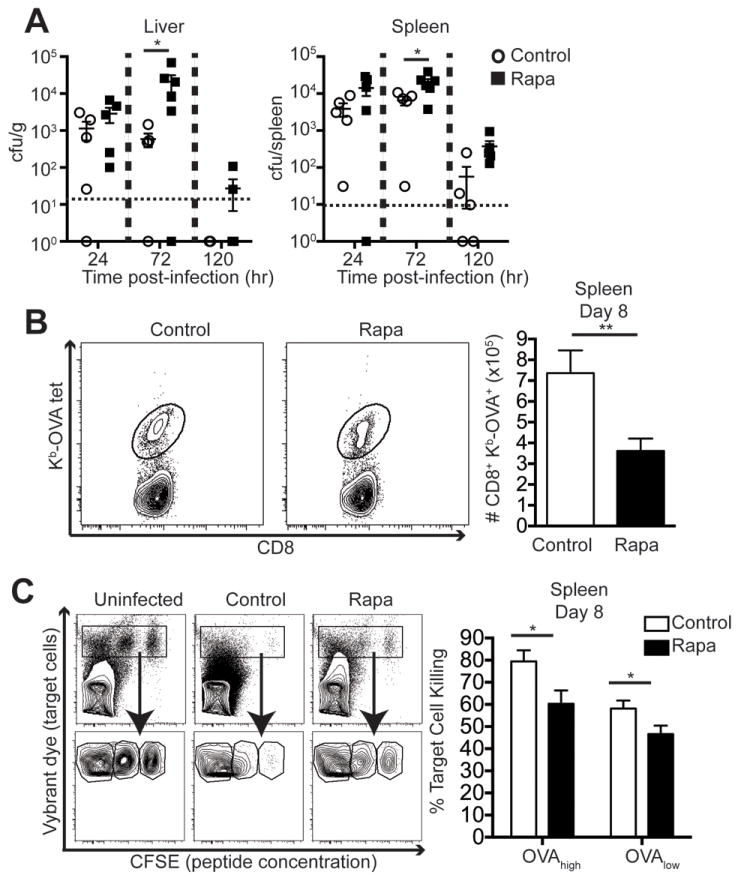
Mice were infected with 1-5×10³ cfu Lm-OVA i.v. (A) Livers (left panel) and spleens (right panel) were harvested at the indicated time points post-infection to measure bacterial burden. N=4-8 mice/group and is representative of 3 independent experiments. 2-way ANOVA was used to determine statistical significance. (B) On day 8 post-infection, spleens were analyzed for OVA-tetramer staining on CD8 T cells. Representative gating and group quantification are shown. Results are representative of at least 3 independent experiments and analyzed by unpaired student’s t-test, n=8 mice/group. (C) In vivo killing assay was performed on day 8 post-infection and is representative of 2 independent experiments. Left panel shows representative flow plots of uninfected, control, and rapa target cell recipients. Unpaired two-tailed student’s t-test was used to determine statistical significance, n=8 mice/group. For all panels, control groups are indicated in open circles and rapa groups are represented with filled squares respectively.
We also found that there were significantly lower numbers of OVA-specific CD8 T cells in the spleens of mice in the rapa group compared to controls (Figure 2B). To further test the functional ability of CD8 T cells primed during rapa treatment, we performed an in vivo killing assay. Target cells were pulsed with a high and a low concentration of SIINFEKL peptide to model low- or high-epitope density target cell, respectively. Mice treated with rapa during Lm-OVA infection had significantly reduced target cell killing regardless of the peptide epitope density on target cells, compared to controls (Figure 2C). Therefore, in addition to decreased polyfunction (Figure 1B), we also show that low-dose rapa decreases the number of Ag-specific CD8 T cells in some infections, resulting in decreased target cell killing in vivo. Additional experiments will be needed to formally establish whether there are additional cytotoxicity function defects induced by rapa on a per-cell basis. The fact that we did not observe an absolute reduction in granzyme B in the rapa-treated group relative to controls (Fig. 1 and data not shown) would suggest that there may be no additional per-cell defects. These results demonstrate that low-dose rapa treatment adversely affects multiple intracellular CD8 T cell functions and that it likely impairs both innate and adaptive immune cells.
As it is known that many cell types are required for protection against WNV infection (19), we tested the impact of low-dose rapa treatment on WNV survival. We found that mice treated with rapa exhibited higher viral titer in the brain compared to controls (Figure 3A), which we have shown to be a strong predictor of mortality in mice (14). Indeed, these higher viral titers correlated with increased mortality in the treated group (Figure 3B). Therefore, low-dose rapa treatment impaired responses to, and immune protection against, a broad range of pathogens by inhibiting the effector function of multiple cell types at several levels.
Figure 3. Rapamycin impairs effective control of WNV, resulting in increased mortality.
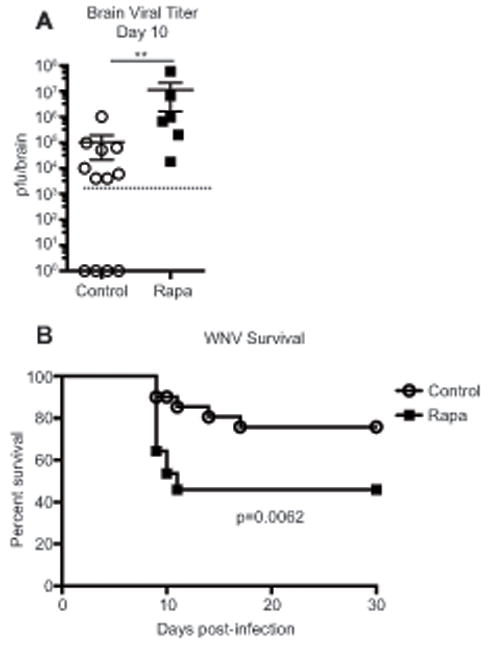
Mice were infected with 103 pfu WNV s.c. (A) On day 10 post-infection brains were harvested and viral titer was determined by plaque assay. n=6-12 mice/group, representative of 2 independent experiments. Unpaired Mann-Whitney nonparametric test was used to determine statistical significance. (B) Mice were tracked for survival for 30 days after infection, with n=20-22 mice/group, representative of 2 independent experiments. Statistical significance was determined by Log-rank test. (A and B) Control groups are represented by open circles, rapa groups are represented with filled squares.
We next addressed the mechanistic nature of the observed defects in CD8eff and innate immunity. To test if rapa treatment induced defects in innate cells, we measured lysosome acidification in macrophages during Lm infection. Macrophages are critical in the early control of Lm and their ability to properly dispose of ingested Listeria is key to that process (20). Mouse bone marrow-derived macrophages were infected with dye-labeled Lm (to identify infected cells) in the presence of rapa. Cells were treated with gentamycin to kill all extracellular bacteria, and lysosome acidification was measured in infected cells by a dye that accumulates in the lysosome and changes fluorescence in the low pH environment. Of interest, we observed decreased acidification in both mouse (Fig. 4A) and human (Fig. 4B) macrophages treated with rapamycin during infection, and that effect was seen at 10-1-3 μg/ml, being lost at lower doses in a dose-dependent manner. Because macrophages are critical for early control of Lm, this provides one explanation for impaired early control of Lm in vivo in mice treated with rapa (Figure 2A).
Figure 4. Rapamycin induces cell intrinsic defects in both innate and adaptive immune cells.
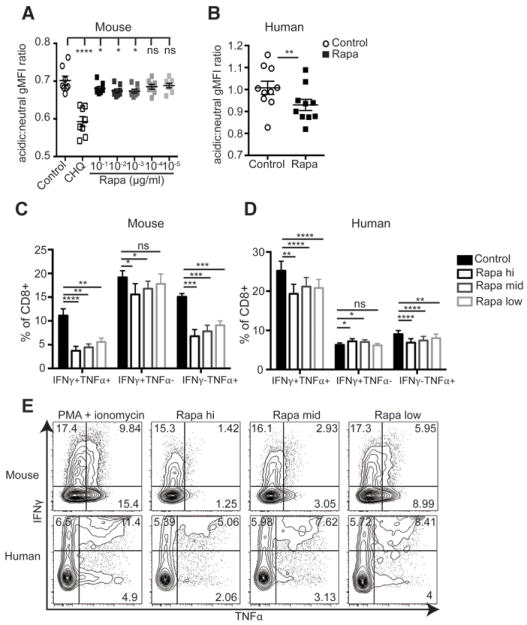
(A) Murine bone marrow macrophages or (B) human CD14+ monocytes were infected with stained Lm in the presence (open circles) or absence (closed squares) of rapa. (A) Cells were treated with decreasing doses of rapa (a 4-log titration). Chloroquine (CHQ) was used as a positive control known to block lysosomal acidification. (B) Monocytes were treated with 17ng/ml rapa. gMFI ratio of acidic to neutral fluorescence was calculated to determine phagosome acidification. (A) Representative of two independent experiments, each containing n=4-5 samples. (B) Data shown are the combination of 2 independent experiments. (A,B) Paired two-tailed student’s t-test was used to determine statistical significance. (C) Murine splenocytes or (D) human PBMCs were subjected to PMA + ionomycin stimulation, in the presence of the indicated concentration of rapa and CD8 T cells were gated based on IFNγ and TNFα staining. (C) Representative of 2 independent repeats, n=4-8 mice/experiment. (D) Combined results of 2 independent experiments, n=4-10 subjects per experiment. (E) Representative gating for both mouse and human CD8 T cells during rapa treatment. Data in panels C and D were analyzed by paired 1-way ANOVA with Bonferroni post-tests to determine statistical significance compared to control stimulation in the absence of rapa. Control samples in C&D are represented by the filled bars; stimulation + rapamycin at concentrations of 500ng/ml, 100ng/ml, and 17ng/ml, are represented by black, dark grey, and light grey unfilled bars, respectively.
We also further examined the nature of a putative CD8 T cell-intrinsic rapa-induced defect by measuring cytokine production in respose to PMA+ionomycin in the presence of decreasing doses of rapa. Rapa significantly decreased the ability of both mouse and human CD8 T cells to produce cytokines IFNγ and TNFα compared to paired samples stimulated in the absence of rapa (Figure 4C,D). Decreased polyfunction was due to decreased production of both IFNγ and TNFα for both mouse and human, as single cytokine-producing cells were also reduced during rapa treatment (Figure 4C,D). Representative flow cytometry data is shown in Figure 4E to further illustrate this point. This data shows that rapa, even at these low doses, inhibits the cell-intrinsic ability of CD8 T cells to produce effector cytokines in response to a polyclonal stimulus. We conclude that deleterious effects of rapa are broad and impact multiple cell types across different species.
In addition to the above cytokine secretion defect, we found other signs of incomplete CD8eff differentiation. Specifically, on day 8 post-infection, tetramer+ CD8 T cells were analyzed for KLRG1 and CD127 expression to identify short-lived effector cells (SLEC) and memory precursor cells (MPEC). Representative gating for each infection is shown in Figure 5A. Similar to previous reports (3), we measured increased MPEC and decreased SLEC frequencies within the tetramer+ populations specific for LCMV, Lm-OVA, and WNV (Figure 5B). In absolute terms, we found that anti-LCMV and anti-Lm-OVA blood populations showed significantly decreased SLEC and increased MPEC cell numbers, whereas the WNV-specific responses showed similar trends, but did not reach statistical significance (Figure 5C).
Figure 5. Rapamycin enhances memory CD8 T cell differentiation at the cost of effector differentiation.

Mice were infected with LCMV, Lm-OVA, or WNV. Blood and spleens were harvested 8 days post-infection and MPEC and SLEC ratios within tetramer+ cells were measured. (A) Representative flow cytometry gating strategy for each infection in control and rapa-treated mice. (B) Frequencies of SLECs and MPECs within the tetramer-positive CD8 T cells for each infection. (C) Absolute counts of SLEC and MPEC tetramer-positive populations for each infection. Representative of 2 independent experiments per infection, each with n=8 mice/group. Unpaired student’s t-test was used to determine statistical differences. Control groups are represented by open bars; rapa groups are represented by filled bars.
The above decrease in SLEC numbers could be due to a cell-intrinsic effect of rapa on CD8 T cells. Alternatively, rapa might induce changes in innate cell types during CD8 T cell priming, thus altering the differentiation programming of the Ag-specific (21) CD8 T cells. To distinguish between these possibilities, we have examined the ability of rapa to affect the CD8 T cell metabolic switch to glycolysis in the course of activation, a switch known to be mediated via mTORC1 and required for robust effector function (22). Naïve control and rapa-treated CD8 T cells were stimulated via TCR and subjected to a glycolysis stress test to determine their glycolytic capacity. Cells were plated at equal density and metabolic glycolysis rates were measured in real time. Extracellular acidification rate (ECAR) was measured as an indication of cellular glycolysis. Basal ECAR, measured in the absence of glucose, was already significantly reduced in the presence of rapa (Figure 6A). When glucose was injected into the media to measure cell glycolysis in the presence of saturating substrate concentration, cells stimulated in the presence of rapa increased ECAR only marginally compared to control-stimulated cells, which showed robust increase in ECAR (Figure 6 A,B). This finding is consistent with previous reports that mTORC1 regulates the T cell glucose transporter GLUT1 (23). Moreover, oligomycin, an ATPase inhibitor that blocks oxidative phosphorylation and forces the cells to switch any remaining metabolic capacity towards glycolysis, also failed to significantly increase glycolysis in rapa-treated cells. Therefore, under any conditions, control samples exhibited significantly higher maximum glycolytic capacity compared to rapa samples (Figure 6A). To verify that changes in ECAR were due to changes in cellular glycolysis, we injected 2-DG, a glycolysis inhibitor, at which point control samples (and, marginally, rapa-treated samples) reverted to or below baseline glycolysis. To further explore metabolic alterations induced by rapa, we also measured oxygen consumption rates (OCR) in stimulated CD8 T cells as an indicator of oxidative phosphorylation (OXPHOS) (Figure 6C). We first observed that control samples had higher OCR than samples that had been stimulated in the presence of rapa. When we injected oligomycin to block oxidative phosphorylation, both groups lost all OCR ability, as expected. We next injected FCCP to uncouple OXPHOS from ATPase activity and observed that rapa samples reached a higher peak OCR than control samples (Figure 6C). Rotenone and antimycin A are electron transport chain inhibitors and were injected to confirm that OCR changes were due to OXPHOS metabolism. We also calculated the spare respiratory capacity (SRC) and found that CD8 T cells stimulated in the presence of rapa had significantly higher SRC than control-stimulated cells (Figure 6D). Importantly, increased SRC is a hallmark of memory CD8 T cell metabolic signature (24), consistent with a shift from effector to memory differentiation fate. We conclude that impaired glycolysis activation and diminished glycolytic capactiy provide a mechanism that likely explains the in vivo defects in CD8 T cell effector function during infection.
Figure 6. Rapamycin decreases CD8 T cell effector differentiation by blocking glycolytic metabolism.
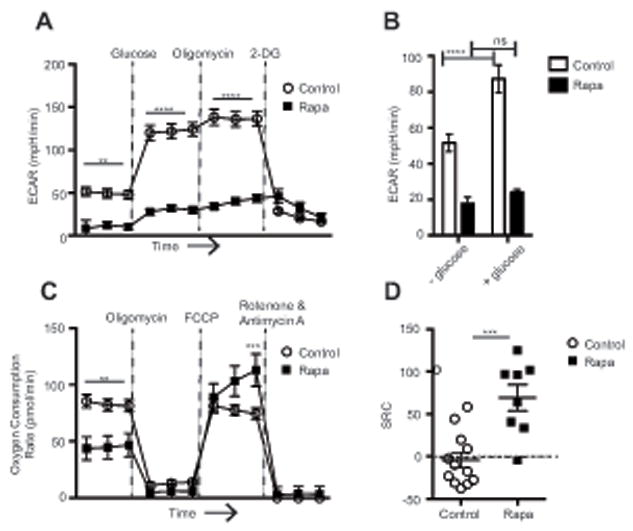
Naïve CD8 T cells enriched from spleen and superficial lymph nodes were stimulated in vitro for 96hr ± rapa. (A) Cells were subjected to a glycolysis stress test to determine glycolytic capacity. (B) Basal glycolysis rates were measured in the presence or absence of glucose. (C) Cells were subjected to a mitochondrial stress test to determine respiratory capacity. (D) Spare respiratory capacity was calculated by subtracting the basal OCR from the maximal OCR after FCCP injection. Representative of 2 independent experiments, each with n=4-6 mice/group. Control samples are represented by open circles or open bars; samples treated with rapa are represented with filled squares or filled bars. (A-C) Statistical differences were determined using 2-way ANOVA or (D) unpaired student’s t-test.
Discussion
The importance of nutrient sensing pathways in T cell function and survival is clearly borne by several studies [(25-28) and references therein] and the possibility of improving vaccine efficacy by manipulating these pathways is particularly attractive (29, 30). However, our data clearly indicate that mTORC1 inhibition, even with low-dose rapa, has detrimental consequences to immune function during the primary immune response, even increasing susceptibility to infection. Based on our similar observations in multiple and distinct infection models, we believe the negative consequences of low-dose rapa are broad and pathogenindependent.
Furthermore, our data suggests that the function of more than one cell type is negatively impacted by low-dose rapa. We show that cells in both the adaptive and innate immune compartments exhibit deficient effector function during low-dose rapa treatment. For CD8 T cells, this includes loss of polyfunctional cytokine production and decreased cytotoxic killing in vivo, both considered critical components of CD8 T cell function during infection (31). For innate immune cells, we show that mouse macrophages and human CD14+ monocytes have decreased phagosome acidification after Lm infection. Phagosome acidification is a critical process for early control of infections (20). This also provides at least one explanation for the impaired early control of Lm in vivo (Figure 2A). Importantly, we show these defects in both mouse and human cells, supporting our hypothesis that the deleterious effects of even low doses of rapa are broad and impact many cell types.
We further tested the mechanistic nature of low-dose rapa immune suppression by measuring the glycolytic and respiratory capacity of stimulated CD8 T cells. We found that cells stimulated in the presence of rapa were essentially glucose-insensitive (Figure 6B) and were unable to switch towards glycolytic metabolism, even when treated with oligomycin to block oxidative phosphorylation (Figure 6A), showing extremely minimal glycolytic metabolism. This observation is supported by previous observations that rapa can decrease GLUT1 expression (23). These cells also had decreased oxygen consumption rates, indicating overall decreased metabolic activity during stimulation in the presence of rapa and this has been shown in other cell types (32, 33). Interestingly, cells stimulated in the presence of rapa exhibited increased spare respiratory capacity and this has recently been shown to be critical for memory CD8 T cell development (24). The metabolic switch to glycolysis is essential for robust T cell effector function (22, 34-37). Low dose rapa (3) or glycolysis inhibition (38) may promote CD8 T cell memory formation, but this appears to come at the cost of effector differentiation, causing potentially lethal consequences in at least some infections.
This becomes especially important in the context of aging. Rapa has recently been used to extend lifespan in mice (39). Only a limited number of studies have begun to address how rapa might impact multiple organ systems (40, 41). A recently reported mTOR hypomorphic mouse model also exhibited lifespan extension but interestingly had increased frequency of random skin infection (42). Importantly, these studies were all performed in specific pathogen-free facilities and did not include infectious exposure of treated mice to study immune function. It has long been known that immune responses to infection drastically decline with age [reviewed in (15, 43-45) and that this correlates with increased susceptibility to infection. Given these results and the findings of this study, it is essential to evaluate the impact of rapa on immune function during aging. By extension, any intervention that decreases mTORC1 signaling to extend lifespan and/or manipulate immunity should be evaluated for its impact on immune function during aging, to prevent possible adverse effects upon infectious disease susceptibility.
Supplementary Material
Acknowledgments
We wish to thank all the members of the Nikolich Lab for support and discussion.
Supported in part by the National Institute of Allergy and Infectious Diseases Contract HHSN272201100017C (NIH/NIAID N01-AI-00017) to JN-Z, and the funds from the Vice-President of Research to the Biology of Aging Program of the Arizona Center on Aging.
Abbreviations
- ECAR
Extracellular acidification rate, a measure of glycolysis in the cell
- Lm-OVA
Listeria monocytogenes expressing recombinant ovalbumin fragment containing the H-2Kb-restricted CD8 epitope SIINFEKL
- low-dose rapa
rapamycin administered at 75μg/kg
- MPEC
memory-precursor effector cells
- Rapa
rapamycin
- SLEC
short-lived effector cells
References
- 1.Zoncu R, Efeyan A, Sabatini DM. mTOR: from growth signal integration to cancer, diabetes and ageing. Nat Rev Mol Cell Biol. 2011;12:21–35. doi: 10.1038/nrm3025. [DOI] [PMC free article] [PubMed] [Google Scholar]
- 2.Lee RA, Gabardi S. Current trends in immunosuppressive therapies for renal transplant recipients. Am J Health Syst Pharm. 2012;69:1961–1975. doi: 10.2146/ajhp110624. [DOI] [PubMed] [Google Scholar]
- 3.Araki K, Turner AP, Shaffer VO, Gangappa S, Keller SA, Bachmann MF, Larsen CP, Ahmed R. mTOR regulates memory CD8 T-cell differentiation. Nature. 2009;460:108–112. doi: 10.1038/nature08155. [DOI] [PMC free article] [PubMed] [Google Scholar]
- 4.Pearce EL, Walsh MC, Cejas PJ, Harms GM, Shen H, Wang LS, Jones RG, Choi Y. Enhancing CD8 T-cell memory by modulating fatty acid metabolism. Nature. 2009;460:103–107. doi: 10.1038/nature08097. [DOI] [PMC free article] [PubMed] [Google Scholar]
- 5.Ferrer IR, Wagener ME, Robertson JM, Turner AP, Araki K, Ahmed R, Kirk AD, Larsen CP, Ford ML. Cutting edge: Rapamycin augments pathogenspecific but not graft-reactive CD8+ T. J Immunol. 2010 Aug 15;185(4):2004–8. doi: 10.4049/jimmunol.1001176. Epub 2010. [DOI] [PMC free article] [PubMed] [Google Scholar]
- 6.Delgoffe GM, Pollizzi KN, Waickman AT, Heikamp E, Meyers DJ, Horton MR, Xiao B, Worley PF, Powell JD. The kinase mTOR regulates the differentiation of helper T cells through the selective activation of signaling by mTORC1 and mTORC2. Nat Immunol. 2011;12:295–303. doi: 10.1038/ni.2005. [DOI] [PMC free article] [PubMed] [Google Scholar]
- 7.Delgoffe GM, Kole TP, Zheng Y, Zarek PE, Matthews KL, Xiao B, Worley PF, Kozma SC, Powell JD. The mTOR kinase differentially regulates effector and regulatory T cell lineage commitment. Immunity. 2009;30:832–844. doi: 10.1016/j.immuni.2009.04.014. [DOI] [PMC free article] [PubMed] [Google Scholar]
- 8.Rao RR, Li Q, Odunsi K, Shrikant PA. The mTOR kinase determines effector versus memory CD8+ T cell fate by regulating the expression of transcription factors T-bet and Eomesodermin. Immunity. 2010;32:67–78. doi: 10.1016/j.immuni.2009.10.010. [DOI] [PMC free article] [PubMed] [Google Scholar]
- 9.Kusne Y, Goldberg EL, Parker SS, Hapak SM, Maskaykina IY, Chew WM, Limesand KH, Brooks HL, Price TJ, Sanai N, Nikolich-Zugich J, Ghosh S. Contrasting effects of chronic, systemic treatment with mTOR inhibitors rapamycin. Age (Dordr) 2013 Aug 16; doi: 10.1007/s11357-013-9572-5. [DOI] [PMC free article] [PubMed] [Google Scholar]
- 10.Bunztman A, Vincent BG, Krovi H, Steele S, Frelinger JA. The LCMV gp33-specific memory T cell repertoire narrows with age. Immun Ageing. 2012 Aug 15;9(1):17. doi: 10.1186/1742-4933-9-17. [DOI] [PMC free article] [PubMed] [Google Scholar]
- 11.Hand TW, Cui W, Jung YW, Sefik E, Joshi NS, Chandele A, Liu Y, Kaech SM. Differential effects of STAT5 and PI3K/AKT signaling on effector and memory CD8 T-cell survival. Proceedings of the National Academy of Sciences of the United States of America. 2010;107:16601–16606. doi: 10.1073/pnas.1003457107. [DOI] [PMC free article] [PubMed] [Google Scholar]
- 12.Pope C, Kim SK, Marzo A, Masopust D, Williams K, Jiang J, Shen H, Lefrancois L. Organ-specific regulation of the CD8 T cell response to Listeria monocytogenes infection. J Immunol. 2001;166:3402–3409. doi: 10.4049/jimmunol.166.5.3402. [DOI] [PubMed] [Google Scholar]
- 13.Smithey MJ, Renkema KR, Rudd BD, Nikolich-Zugich J. Increased apoptosis, curtailed expansion and incomplete differentiation of CD8+ T cells combine to decrease clearance of L. monocytogenes in old mice. Eur J Immunol. 2011;41:1352–1364. doi: 10.1002/eji.201041141. [DOI] [PMC free article] [PubMed] [Google Scholar]
- 14.Brien JD, Uhrlaub JL, Hirsch A, Wiley CA, Nikolich-Zugich J. Key role of T cell defects in age-related vulnerability to West Nile virus. J Exp Med. 2009;206:2735–2745. doi: 10.1084/jem.20090222. [DOI] [PMC free article] [PubMed] [Google Scholar]
- 15.Solana R, Tarazona R, Gayoso I, Lesur O, Dupuis G, Fulop T. Innate immunosenescence: Effect of aging on cells and receptors of the innate immune system in humans. Seminars in Immunology. 2012;24:341. doi: 10.1016/j.smim.2012.04.008. [DOI] [PubMed] [Google Scholar]
- 16.Barrigan LM, Tuladhar S, Brunton JC, Woolard MD, Chen CJ, Saini D, Frothingham R, Sempowski GD, Kawula TH, Frelinger JA. Infection with Francisella tularensis LVS clpB leads to an altered yet protective immune response. Infection and immunity. 2013;81:2028–2042. doi: 10.1128/IAI.00207-13. [DOI] [PMC free article] [PubMed] [Google Scholar]
- 17.Barber DL, Wherry EJ, Ahmed R. Cutting edge: rapid in vivo killing by memory CD8 T cells. J Immunol. 2003;171:27–31. doi: 10.4049/jimmunol.171.1.27. [DOI] [PubMed] [Google Scholar]
- 18.Brien JD, Uhrlaub JL, Nikolich-Zugich J. Protective capacity and epitope specificity of CD8(+) T cells responding to. Eur J Immunol. 2007 Jul;37(7):1855–63. doi: 10.1002/eji.200737196. [DOI] [PubMed] [Google Scholar]
- 19.Suthar MS, Diamond MS, Gale MJ. West Nile virus infection and immunity. Nat Rev Microbiol. 2013 Feb;11(2):115–28. doi: 10.1038/nrmicro2950. [DOI] [PubMed] [Google Scholar]
- 20.Serbina NV, Jia T, Hohl TM, Pamer EG. Monocyte-mediated defense against microbial pathogens. Annual review of immunology. 2008;26:421–452. doi: 10.1146/annurev.immunol.26.021607.090326. [DOI] [PMC free article] [PubMed] [Google Scholar]
- 21.Joshi NS, Cui W, Chandele A, Lee HK, Urso DR, Hagman J, Gapin L, Kaech SM. Inflammation directs memory precursor and short-lived effector CD8(+) T cell fates via the graded expression of T-bet transcription factor. Immunity. 2007;27:281–295. doi: 10.1016/j.immuni.2007.07.010. [DOI] [PMC free article] [PubMed] [Google Scholar]
- 22.Chang CH, Curtis JD, Maggi LB, Jr, Faubert B, Villarino AV, O’Sullivan D, Huang SC, van der Windt GJ, Blagih J, Qiu J, Weber JD, Pearce EJ, Jones RG, Pearce EL. Posttranscriptional control of T cell effector function by aerobic glycolysis. Cell. 2013;153:1239–1251. doi: 10.1016/j.cell.2013.05.016. [DOI] [PMC free article] [PubMed] [Google Scholar]
- 23.Finlay DK, Rosenzweig E, Sinclair LV, Feijoo-Carnero C, Hukelmann JL, Rolf J, Panteleyev AA, Okkenhaug K, Cantrell DA. PDK1 regulation of mTOR and hypoxia-inducible factor 1 integrate metabolism and migration of CD8+ T cells. J Exp Med. 2012;209:2441–2453. doi: 10.1084/jem.20112607. [DOI] [PMC free article] [PubMed] [Google Scholar]
- 24.van der Windt GJ, Everts B, Chang CH, Curtis JD, Freitas TC, Amiel E, Pearce EJ, Pearce EL. Mitochondrial respiratory capacity is a critical regulator of CD8(+) T cell memory development. Immunity. 2012;36:68–78. doi: 10.1016/j.immuni.2011.12.007. [DOI] [PMC free article] [PubMed] [Google Scholar]
- 25.Powell JD, Delgoffe GM. The mammalian target of rapamycin: linking T cell differentiation, function, and metabolism. Immunity. 2010;33:301–311. doi: 10.1016/j.immuni.2010.09.002. [DOI] [PMC free article] [PubMed] [Google Scholar]
- 26.Rao RR, Li Q, Shrikant PA. Fine-tuning CD8(+) T cell functional responses: mTOR acts as a rheostat for regulating CD8(+) T cell proliferation, survival and differentiation? Cell Cycle. 2010;9:2996–3001. doi: 10.4161/cc.9.15.12359. [DOI] [PubMed] [Google Scholar]
- 27.Finlay D, Cantrell DA. Metabolism, migration and memory in cytotoxic T cells. Nat Rev Immunol. 2011;11:109–117. doi: 10.1038/nri2888. [DOI] [PMC free article] [PubMed] [Google Scholar]
- 28.Gerriets VA, Rathmell JC. Metabolic pathways in T cell fate and function. Trends in immunology. 2012;33:168–173. doi: 10.1016/j.it.2012.01.010. [DOI] [PMC free article] [PubMed] [Google Scholar]
- 29.Li Q, Rao R, Vazzana J, Goedegebuure P, Odunsi K, Gillanders W, Shrikant PA. Regulating mammalian target of rapamycin to tune vaccination-induced CD8(+) T cell responses for tumor immunity. J Immunol. 2012;188:3080–3087. doi: 10.4049/jimmunol.1103365. [DOI] [PMC free article] [PubMed] [Google Scholar]
- 30.Keating R, Hertz T, Wehenkel M, Harris TL, Edwards BA, McClaren JL, Brown SA, Surman S, Wilson ZS, Bradley P, Hurwitz J, Chi H, Doherty PC, Thomas PG, McGargill MA. The kinase mTOR modulates the antibody response to provide cross-protective immunity to lethal infection with influenza virus. Nature Immunology. 2013 doi: 10.1038/ni.2741. [DOI] [PMC free article] [PubMed] [Google Scholar]
- 31.Zhang N, Bevan MJ. CD8(+) T cells: foot soldiers of the immune system. Immunity. 2011;35:161–168. doi: 10.1016/j.immuni.2011.07.010. [DOI] [PMC free article] [PubMed] [Google Scholar]
- 32.Cunningham JT, Rodgers JT, Arlow DH, Vazquez F, Mootha VK, Puigserver P. mTOR controls mitochondrial oxidative function through a YY1-PGC-1alpha transcriptional complex. Nature. 2007;450:736–740. doi: 10.1038/nature06322. [DOI] [PubMed] [Google Scholar]
- 33.Schieke SM, Phillips D, McCoy JP, Jr, Aponte AM, Shen RF, Balaban RS, Finkel T. The mammalian target of rapamycin (mTOR) pathway regulates mitochondrial oxygen consumption and oxidative capacity. The Journal of biological chemistry. 2006;281:27643–27652. doi: 10.1074/jbc.M603536200. [DOI] [PubMed] [Google Scholar]
- 34.Prlic M, Bevan MJ. Immunology: A metabolic switch to memory. Nature. 2009;460:41–42. doi: 10.1038/460041a. [DOI] [PubMed] [Google Scholar]
- 35.Yang K, Shrestha S, Zeng H, Karmaus PW, Neale G, Vogel P, Guertin DA, Lamb RF, Chi H. T Cell Exit from Quiescence and Differentiation into Th2 Cells Depend on Raptor-mTORC1-Mediated Metabolic Reprogramming. Immunity. 2013;39:1043–1056. doi: 10.1016/j.immuni.2013.09.015. [DOI] [PMC free article] [PubMed] [Google Scholar]
- 36.Gubser PM, Bantug GR, Razik L, Fischer M, Dimeloe S, Hoenger G, Durovic B, Jauch A, Hess C. Rapid effector function of memory CD8+ T cells requires an immediate-early glycolytic switch. Nat Immunol. 2013;14:1064–1072. doi: 10.1038/ni.2687. [DOI] [PubMed] [Google Scholar]
- 37.Michalek RD, Gerriets VA, Jacobs SR, Macintyre AN, MacIver NJ, Mason EF, Sullivan SA, Nichols AG, Rathmell JC. Cutting edge: distinct glycolytic and lipid oxidative metabolic programs are essential for effector and regulatory CD4+ T cell subsets. J Immunol. 2011;186:3299–3303. doi: 10.4049/jimmunol.1003613. [DOI] [PMC free article] [PubMed] [Google Scholar]
- 38.Sukumar M, Liu J, Ji Y, Subramanian M, Crompton JG, Yu Z, Roychoudhuri R, Palmer DC, Muranski P, Karoly ED, Mohney RP, Klebanoff CA, Lal A, Finkel T, Restifo NP, Gattinoni L. Inhibiting glycolytic metabolism enhances CD8+ T cell memory and antitumor function. The Journal of clinical investigation. 2013;123:4479–4488. doi: 10.1172/JCI69589. [DOI] [PMC free article] [PubMed] [Google Scholar]
- 39.Harrison DE, Strong R, Sharp ZD, Nelson JF, Astle CM, Flurkey K, Nadon NL, Wilkinson JE, Frenkel K, Carter CS, Pahor M, Javors MA, Fernandez E, Miller RA. Rapamycin fed late in life extends lifespan in genetically heterogeneous mice. Nature. 2009;460:392–395. doi: 10.1038/nature08221. [DOI] [PMC free article] [PubMed] [Google Scholar]
- 40.Neff F, Flores-Dominguez D, Ryan DP, Horsch M, Schroder S, Adler T, Afonso LC, Aguilar-Pimentel JA, Becker L, Garrett L, Hans W, Hettich MM, Holtmeier R, Holter SM, Moreth K, Prehn C, Puk O, Racz I, Rathkolb B, Rozman J, Naton B, Ordemann R, Adamski J, Beckers J, Bekeredjian R, Busch DH, Ehninger G, Graw J, Hofler H, Klingenspor M, Klopstock T, Ollert M, Stypmann J, Wolf E, Wurst W, Zimmer A, Fuchs H, Gailus-Durner V, Hrabe de Angelis M, Ehninger D. Rapamycin extends murine lifespan but has limited effects on aging. J Clin Invest. 2013;123:3272–3291. doi: 10.1172/JCI67674. [DOI] [PMC free article] [PubMed] [Google Scholar]
- 41.Wilkinson JE, Burmeister L, Brooks SV, Chan CC, Friedline S, Harrison DE, Hejtmancik JF, Nadon N, Strong R, Wood LK, Woodward MA, Miller RA. Rapamycin slows aging in mice. Aging cell. 2012;11:675–682. doi: 10.1111/j.1474-9726.2012.00832.x. [DOI] [PMC free article] [PubMed] [Google Scholar]
- 42.Wu JJ, Liu J, Chen EB, Wang JJ, Cao L, Narayan N, Fergusson MM, Rovira II, Allen M, Springer DA, Lago CU, Zhang S, Dubois W, Ward TM, Decabo R, Gavrilova O, Mock B, Finkel T. Increased Mammalian Lifespan and a Segmental and Tissue-Specific Slowing of Aging. Cell Rep. 2013 Aug;28 doi: 10.1016/j.celrep.2013.07.030. [DOI] [PMC free article] [PubMed] [Google Scholar]
- 43.Kogut I, Scholz JL, Cancro MP, Cambier JC. B cell maintenance and function in aging. Seminars in Immunology. 2012;24:349. doi: 10.1016/j.smim.2012.04.004. [DOI] [PubMed] [Google Scholar]
- 44.Nikolich-Žugich J, Li G, Uhrlaub JL, Renkema KR, Smithey MJ. Agerelated changes in CD8 T cell homeostasis and immunity to infection. Seminars in Immunology. 2012;24:364. doi: 10.1016/j.smim.2012.04.009. [DOI] [PMC free article] [PubMed] [Google Scholar]
- 45.Gardner P, Pabbatireddy S. Vaccines for women age 50 and older. Emerg Infect Dis. 2004;10:1990–1995. doi: 10.3201/eid1011.040469. [DOI] [PMC free article] [PubMed] [Google Scholar]
Associated Data
This section collects any data citations, data availability statements, or supplementary materials included in this article.