

Abstract
The MCF10A human breast epithelial cell lineage includes the benign MCF10A cells, premalignant cells (MCF10AT, MCF10ATG3B) and malignant MCF10CA1a tumor cells. The premalignant and tumor cells recapitulate the progressive alterations associated with the temporal development of PBD and carcinoma. Ras protein levels were elevated 6.9-, 22.4- and 32.2-fold in 10AT, 10ATG3B and 10CA1a cells respectively, relative to 10A cells. K-Ras was not detected, N-Ras levels were unchanged; Rac and Rho levels increased in 10CA1a tumor cells. Phospho-phosphatidylinositol 3-kinase, phosphoinositide-dependent protein kinase 1 (PDK1), phospho-PDK1, phospho-eukaryotic translation initiation factor 4E (eIF4E) and phospho-eukaryotic initiation factor 4E binding protein 1 (4E-BP1) levels progressively increased in the cell lineage, with the greatest increase monitored in 10CA1a tumor cells. Phospho Ser 473 and Thr 408 Akt levels increased 10.2- and 136-fold in 10CA1a cells, respectively, relative to 10A cells. Phospho- p70S6 kinase (p70S6K) increased > 2-fold in 10CA1a cells, relative to 10A cells. Immunohistochemistry confirmed Ras, phospho-Akt and phospho-p70S6K (Thr 421/Ser 424) expression in lesions arising from premalignant and tumor cells. FOXO 1, phospho-FOXO 1 and phospho-FOXO 4 were significantly elevated in 10ATG3B premalignant and 10CA1a tumor cells. Phospho-FOXO 3a was progressively elevated, with the greatest levels detected in 10CA1a tumor cells. Immunohistochemistry revealed that phospho-FOXO 1, 3a and 4 staining was less in benign lesions, but elevated in advanced 10ATG3B and malignant 10CA1a lesions, showing a correspondence between the cells and lesions. Hence, phospho-Akt and phospho-FOXO 1, 3a and 4 merit consideration as biomarkers of tumorigenic risk from hyperplastic breast tissue.
Keywords: breast cancer, Ras, PI 3-kinase, Akt, p70S6K, FOXO 1, FOXO 3a and FOXO 4, immunohistochemistry
Category: Cancer Cell Biology, Carcinogenesis, Early Detection, Diagnosis
Introduction
Breast cancer is the second leading cause of mortality among women in the United States. The risk of American women developing breast cancer is estimated to be one in seven.1 The pathology of breast cancer progression appears to initially involve the development of hyperplasia, with subsequent progression through ductal carcinoma in situ, malignant carcinoma and fully malignant invasive metastatic carcinoma. Human proliferative breast disease (PBD) refers to a sequence of progressive morphologic changes, which include hyperplasia, with or without atypia, that occur in breast tissue prior to breast cancer development, and are associated with a four- to five-fold increase in risk for developing breast cancer.2 Proteins which regulate cell growth, cell proliferation and apoptosis are altered during early events in breast cancer progression. Several of these proteins serve as indicators of overall prognosis and constitute therapeutic targets. Among these proteins, Ras3,4 phosphatidylinositol 3-kinase (PI 3-kinase), Akt5,6 and p70S6K have been detected in breast tumor tissue, and associated with disease progression.
In many types of cells, it has been demonstrated that the PI 3-kinase, Akt, mTOR signaling pathway is a cell survival pathway through its ability to activate Akt.7 Akt, which plays a critical role in controlling the balance between survival and apoptosis, is activated in response to insulin, IGF1 and various growth and survival factors, and is a downstream target of PI 3-kinase.8 Akt is activated by phospholipid binding and activation loop phosphorylation at Thr308 by phosphoinositide-dependent protein kinase 1 (PDK1)9 and by PTEN (phosphatase and tensin homologue) phosphorylation within the carboxyterminus at Ser473.10 Akt promotes cell survival by inhibiting apoptosis through its ability to phosphorylate and inactivate several targets, including Bad, Forkhead Transcription Factors Other (FOXO)11 and caspase-9.12 In addition to its role in survival, Akt is involved in cell cycle regulation by regulating cyclin D1 levels13 and by negatively regulating the cyclin-dependent kinase inhibitors p27KIP,14 and p21WAF1.15
Akt regulates the activity of the FOXO 1 (FKHR), FOXO 3a (FKHRL1) and FOXO 4 (AFX) transcription factors.16 In the absence of insulin, growth or survival signal stimulation, Akt exhibits minimal basal activity in quiescent cells. As a result, FOXO transcription factors translocate into the nucleus and thereby upregulate the expression of target genes that control cell cycle progression or induce cellular apoptosis.17 In transformed or tumor cells, the ability of FOXO transcription factors to regulate the expression of genes involved in maintaining homeostatic cell function may be disrupted by aberrant PI 3-kinase, Akt, and mTOR signaling. Phosphorylation of FOXO transcription factors by Akt results in nuclear exclusion and proteosomal degradation and hence, inhibition of FOXO-mediated gene expression11,18 with corresponding effects on genes that regulate cell function and survival.11,19 As FOXO transcription factors play a pivotal role in cellular responses, it is possible that the progressive inactivation of these factors ultimately leads to tumorigenesis.
The MCF10A series of cells includes the benign MCF10A (10A), which is a spontaneously immortalized non-transformed and non-tumorigenic human mammary epithelial cell line,20 the premalignant MCF10AT (10AT) and MCF10ATG3B (10ATG3B) cell lines, which exhibit progressively increasing tumorigenic risk, and the fully malignant MCF10CA1a (10CA1a) tumor cell line. The premalignant MCF10AT, and MCF10ATG3B cells, when implanted subcutaneously (s.c.) in nude/beige mice, progress through the various pathologic stages of breast cancer development, including PBD, CIS, DCIS and proceeding through fully malignant invasive metastatic carcinoma in approximately 25% of the cases.21 In contrast, MCF10CA1a tumor cells form rapidly growing malignant tumors with100% efficacy. These epithelial cell lines, derived from the same patient with benign fibrocystic disease, thus represent a unique system for examining the progressive alterations in signaling proteins that occur in cells ranging from benign cells (10A), to transformed cells that form non-proliferative xenograft lesions that appear benign, but sporadically progress to tumors (10AT), to transformed cells that form high risk hyperplastic lesions that sporadically progress to tumors (10ATG3B), to fully malignant invasive tumor cells (10CA1a). Of the many advantages associated with MCF10A cell system, the most prominent is that it is the only human breast epithelial cell model, which has common genetic characteristics, available for research on the development of PBD, a breast cancer risk, and tumorigenesis and progresses through all stages of tumorigenesis when implanted in the nude mouse.
Since the development of breast cancer requires years, if not decades to materialize, the hypothesis of this research that progressive changes in crucial signaling proteins occurs throughout the process and confers increased risk of transformation and tumorigenesis. Thus, the MCF10 cell lines effectively represent a time-dependent (i.e. decade long) process which culminates in a tumor cell phenotype. The results of this research show that the levels of critical signaling proteins and phosphoproteins progressively increase with the increasing risk of tumorigenicity. These data suggest that Akt is a viable target in the treatment of breast cancer and that phospho-Akt, and phospho-FOXO 1, 3a and 4 may serve as biomarkers of progressive tumorigenic risk, recurrence, and therapeutic response.
Materials and Methods
Human Breast Epithelial Cell Lines
MCF10A, 10AT, 10ATG3B and 10CA1a cell lines were derived at the Karmanos Cancer Institute (Detroit, MI). MCF10A cells are spontaneously immortalized breast epithelial cells obtained from a woman with fibrocystic breast disease.20 10A cells were transfected with a constitutively active Ha-ras gene to generate 10AT cells.21,22,23 Unlike 10A cells, 10AT cells form simple ducts that persist as xenografts in nude/beige mice and develop into carcinomas in about 25% of the animals.24 A family of 10AT cell lines was generated by re-establishing epithelial cells isolated from the carcinomas in culture and subsequently re-injecting these cells into nude/beige mice.21 With each subsequent generation, the onset of PBD and the development of invasive cancer appeared more quickly after implantation. The 10ATG3B cell line was generated from cells that have been through this process of transplantation in nude/beige mice and re-established in culture three times. These cells form focal cribiforming ducts within one month, frequently progress to atypical hyperplasia and ductal carcinoma in situ at a frequency of 25–30%, and progress to invasive carcinoma when implanted in nude/beige mice.21 The MCF10CA1a tumor cell line was generated from a xenograft as described previously.21 One carcinoma developing from a 10AT lesion was selected for sequential passage by trocar separation and passaged through two additional generations before cells were established in culture.25 MCF10CA1a cells give rise to form rapidly growing tumors with 100% efficacy and form rapidly growing lung metastases following intravenous injection.
Cell Culture
The cells were cultured in Dulbecco’s modified Eagle medium/F-12 medium (Invitrogen, Carlsbad, CA) supplemented with 10 μg/ml of human insulin (Invitrogen), 20 ng/ml of epidermal growth factor (Invitrogen), 0.5 μg/ml of hydrocortisone (Sigma, St. Louis, MO), 5% horse serum (Invitrogen), 100 units/ml of penicillin (Invitrogen), and 100 μg/ml of streptomycin (Invitrogen). The cells were maintained in a humidified environment of 5% CO2/95% air at 37°C as described previously.25,26,27 The cell lines were cultured in 60 cm2 tissue culture dishes and were 80% confluent at time of treatment.
Cell Treatment with Inhibitors
10A, 10AT, 10ATG3B and 10CA1a cells were treated with 500 nM of PI 3-kinase inhibitor, wortmannin (Calbiochem, San Diego, CA) dissolved in dimethyl sulfoxide (DMSO, 99.5%). Akt inhibitor V, inhibitor VIII and A-443654, a new Akt inhibitor, obtained from Dr. Giranda (Abbott Laboratories, Abbott Park, IL), were dissolved in DMSO. The cells were treated with the respective inhibitor at the concentrations and for the times indicated (e.g. 5 μM for 2 h), and incubated at 37°C. Control cells were treated with a corresponding concentration of DMSO (99.5%). Following the incubation period, the protein and phosphoprotein levels were determined by immunoblot analysis. Cell viability was assessed using trypan blue exclusion. For cells treated with A-443654 for 4, 8 and 12 h, attached cell viability ranged from ~99% to 84% at 8 h for the MCF10A series and from ~99 to 68% at 12 h, with the lowest percentage of viable cells associated with the 10CA1a cells. Treatment of the MCF10A series with A-443654 for 12 h resulted in significant numbers of floating cells for the 10A, 10 AT, and 10CA1a cells with ~30%, ~51% and ~29% of the 10A, 10AT and 10CA1a floating cells being viable, based on trypan blue exclusion, respectively. Very few floating cells were detected for the A-443654-treated 10ATG3B cells, which appeared to be the most resistant.
Immunoblot Analysis
Antibodies against Ras and Rac were purchased from BD Transduction Laboratories (San Diego, CA), Rho and PI 3-kinase p85, and anti-Fas were purchased from Upstate Biotechnology (Lake Placid, NY). Phospho-PI 3-kinase p85 (Tyr508) and tuberous sclerosis complex 2 (TSC2) antibodies were obtained from Santa Cruz Biotechnology (Santa Cruz, CA). Akt, phospho-Akt (Thr308), phospho-Akt (Ser473), ribosomal p70 S6 kinase (p70S6K), phospho-p70S6K (Thr389), phospho-p70S6K (Thr421/Ser424), eukaryotic translation initiation factors 4E (eIF4E), phospho-eIF4E (Ser209), phospho-eIF4E binding protein 1 (4E-BP1) (Thr37/46), PDK1, phospho-PDK1 (Ser241), mammalian target of rapamycin (mTOR), phospho-mTOR (Ser2448), PTEN, phospho-PTEN (Ser380), FOXO 1, FOXO 3a, FOXO 4, phospho-FOXO 1 (Ser256), phospho-FOXO 3a (Ser253) and phospho-FOXO 4 (Ser193) and PARP antibodies were purchased from Cell Signaling Technology (Beverly, MA). Anti-glyceradehyde-3-phosphate dehydrogenase (GAPDH, Calbiochem) was used as an internal standard for normalization of protein loading in immunoblot analysis.
For immunoblot analysis, cells were lysed in buffer consisting of 50 mM HEPES (pH 7.2), 150 mM NaCl, 1.5 mM MgCl2, 1 mM EGTA, 10% glycerol, 1% Triton X-100, 10 mM sodium pyrophosphate, 1 mM sodium orthovanadate, 1 mM MnCl2, 10 μg/ml leupeptin, 2 mM phenylmethylsulfonyl fluoride, and 200 units aprotinin for 30 min at 4°C. Cell lysates were transferred into eppendorf tubes and passed through a 25 gauge needle. Samples were incubated on ice for 30 min, the lysates subsequently clarified by centrifugation at 16,000 × g for 20 min at 4°C and the supernatant was collected. Protein concentrations were determined using BCA protein assay (Sigma).
Protein samples (20–40 μg of protein per lane) from cells were resolved by sodium dodecyl sulfate-polyacrylamide gel electrophoresis (SDS-PAGE) on a gradient gel (5–15%), transferred to nitrocellulose (Pall Corporation, Ann Arbor, MI), and blocked for 2 h in a solution containing Tris-buffered saline (TBS) (i.e., 20 mM Tris-HCl and 500 mM NaCl [pH 7.5]), 5% milk powder and 0.1% Tween 20. For immunodetection, blots were incubated with the appropriate diluted primary antibody in 5% bovine serum albumin (BSA), TBS and 0.1% Tween 20 at 4°C with gentle shaking, overnight, followed by incubation with a secondary antibody conjugated to horseradish peroxidase (diluted 1:10,000 in TBS containing 5% milk powder and 0.1% Tween 20) for 2 h at room temperature.
Protein expression was detected by enhanced chemiluminescence (Amersham Life Science Inc., Piscataway, NJ) on Kodak X-OMAT film (Sigma). Exposed films were scanned and the bands were quantified using KODAK 1D Image Analysis (Eastman Kodak Company, Rochester, NY) equipped with analysis software program. Arbitrary units in the figures represent the ratio between the band density of the specific protein studies and the band density of GAPDH.
Cell Morphology
Following treatment with the most efficacious pan Akt inhibitor, A-443654, or DMSO (controls), the cells were washed twice with PBS, and visualized and photographed with an Olympus PD70 imaging system (Olympus America Inc.). Phase contrast images were taken at 200× magnification.
Flow Cytometry Analysis
Cells were treated with 5 μM A443654 for 4, 8 and 12 h and harvested in 0.25% trypsin/0.1% EDTA. The cells were centrifuged for 5 min at 500 xg at 4°C, washed and fixed overnight with 75% ethanol. The cells were resuspended in 1ml of propidium iodine staining solution for 1 h at room temperature. Cell cycle distribution was determined by analyzing 10,000 to 20,000 cells using a FACSCalibur flow cytometer and Cell Quest software (Becton Dickinson, San Jose, CA). The cell cycle experiments were performed in triplicate.
Statistical Analysis
Statistically significant differences (p < 0.05) between groups were determined by analysis of variance, followed by a Tukey-Kramer multiple comparison analysis.
Immunohistochemical Analysis
10AT and 10ATG3B cells were suspended in Matrigel (BD Bioscience, Bedford, MA) and ten million cells were injected into the subcutis of nude mice. These cells form persistent benign lesions which generally weigh less than 30 mg unless progression to carcinoma occurs (~25% incidence) during the lifespan of the mouse. 10AT and 10ATG3B lesions were removed and placed into buffered formalin immediately. For this study, both an early 10ATG3B (39 days in mouse) lesion displaying only benign hyperplasic pathology and a late lesion (520 days in mouse), in which invasive cancer was evident as well, were used. 10CA1a cells were suspended in Matrigel and one million cells were injected into the subcutis of nude mice. These malignant tumors were removed upon reaching a size of 10–15 mm diameter. Thin slices of tumor, approximating the size of the benign lesions, were removed from an anesthetized mouse and placed immediately into buffered formalin. By immediately placing thin slices into formalin, the phosphorylated status of proteins can be preserved (quick-fix). After 16–24 h, the tissue was processed using standard techniques and embedded in paraffin. Thin sections (5 μm) were cut, mounted on superfrost plus microscope slides (Fisher Scientific, Chicago, IL), deparaffinized and rehydrated. Antigen retrieval was performed by boiling in 0.01 M sodium citrate buffer (pH 6.0) for 10 min in a microwave. Following washing in phosphate-buffered saline (PBS), immunostaining was accomplished with the Elite ABC method of Vector Laboratories (Vector Laboratories, Inc., Burlingame, CA). Ras expression was detected with a pan-Ras antibody (Calbiochem) and phospho-Akt (Ser473), phospho-Akt (Thr308), phospho-p70S6K (Thr421/Ser424), phospho-p70S6K (Thr389), phospho-FOXO 1 (Ser256), phospho-FOXO 3a (Ser253) and phospho-FOXO 4 (Ser193) proteins were detected with antibodies from Cell Signaling Technology, respectively. Immunohistochemical scoring was based on a semi-quantitative method which adds estimates of proportion of cells positive (1–5) and intensity of staining per cell (1–3) with a maximum possible score of 8 if over 2/3 of the cells stain with strong intensity.28
Results and Discussion
A simplified diagrammatic representation of the signaling pathway, components and downstream targets that will be interrogated in this investigation is provided in Fig. 1. We examined whether the MCF10A cell lineage exhibited progressive changes in Ras, and Ras family members, as well as the PI 3-kinase, Akt signaling pathway, reflective of an irrevocable commitment to transformation and tumorigenesis. While Ras mutations are rare in breast cancer, approximately 60–70% of primary human breast carcinomas express higher levels of Ras than normal breast tissue.3,29 Activated Ras utilizes several downstream pathways, including the mitogen-activated protein kinase (MAPK) kinase pathway, the small GTP-binding protein Rac and Rho subfamily and PI 3-kinase/Akt pathway, to promote cell proliferation and to inhibit apoptosis.30 Interestingly, the three Ras isoforms differentially activate effector molecules. K-Ras activates Raf-1 more effectively than H-Ras and N-Ras31,32 and activates Rac more efficiently than H-Ras,33 whereas, H-Ras is a more potent activator of PI 3-kinase than K-Ras32 and more active in cell transformation than either N- or K-Ras in murine fibroblasts.34 Total Ras protein levels were 6.9-, 22.4- and 32.2-fold higher in 10AT, 10ATG3B and 10CA1a cells relative to 10A cells, with the differences being statistically significant (Fig. 2A, C). Individual members of the Ras family include H-Ras, N-Ras and K-Ras. The levels of H-Ras were elevated 3.9-, 10.4- and 46.2-fold in 10AT, 10ATG3B and 10CA1a cells relative to 10A cells. In contrast, K-Ras was undetectable and N-Ras levels were unchanged (Fig. 2B). Ras functions through numerous downstream effector proteins including Raf, MEK, ERK, Rac, Rho and PI 3-kinase. The transformation of cells by Ras not only involves the proliferation of cells, but also cytoskeletal rearrangements. Rac signaling regulates membrane ruffling through reorganization of the actin-cytoskeleton,35 whereas Rho leads to the formation of actin stress fibers and focal adhesion.36 Rac protein levels increased slightly in 10AT (1.2-fold), were unchanged in 10ATG3B cells, and increased in 10CA1a (1.5-fold) cells relative to 10A cells (Fig. 2A, C). Rho protein levels tended to increase gradually with the progression of the cell series with a significant increase in 10CA1a tumor cells (1.5-fold) relative to non-tumorigenic 10A cells (Fig. 2A, C).
Figure 1.

Signaling cascade containing components identified as targets in breast cancer.
Figure 2.

Panel A Immunoblot analysis of Ras, Rac and Rho protein levels in the MCF10A (10A), MCF10AT (10AT), MCF10ATG3B (3B) and MCF10CA1a (CA1a) cells; Panel B: Immunoblot analysis of Ras isoforms, N-Ras and H-Ras. Panel C: Graphical analysis of band densities normalized for protein loading with GAPDH. Columns and error bars represent means ± SE of immunoblot band densities of three separate protein preparations.
(*) indicates a significant difference from MCF10A cells;
(#) indicates a significant difference from MCF10AT cells;
(‡) indicates a significant difference from MCF10ATG3B cells.
Significance: *, # : p < 0.05; ## : p < 0.01; ***, ###, ‡‡‡ : p < 0.001.
Transfection of activated Ras into cells stimulates PI 3-kinase activity and it has been reported that PI 3-kinase is a direct target of Ras.37 PI 3-kinase catalyzes the production of phosphatidylinositol-3,4,5-triphosphate (PIP3) by phosphorylating phosphatidylinositol (PI), phosphatidylinositol-4-phosphate (PIP) and phosphatidylinositol-4,5-bisphosphate (PIP2). Growth factors and hormones as well as elevated levels of Ras trigger this phosphorylation, which in turn coordinates cell growth, cell cycle entry, cell proliferation, cell migration and cell survival.38 PI 3-kinase is composed of a catalytic subunit (p110) and a regulatory subunit (p85). Direct binding of p110 to activated Ras protein further stimulates PI 3-kinase.38 Neither the levels of the PI 3-kinase p85 subunit (Fig. 3) nor the p110 subunit (not shown) were changed in the MCF10A cell lineage (data not shown). The levels of phospho-PI 3-kinase p85 increased significantly, however, by ~2 to 2.5 fold in 10AT, 10ATG3B and 10CA1a cells relative to 10A cells (Fig. 3A, B).
Figure 3.

Panel A Immunoblot analysis of PI 3-kinase and phospho-PI 3 kinase protein levels in the MCF10A (10A), MCF10AT (10AT), MCF10ATG3B (3B) and MCF10CA1a (CA1a) cells. Panel B: Graphical analysis of band densities normalized for protein loading with GAPDH. Columns and error bars represent means ± SE of immunoblot band densities of two or three separate protein preparations.
(*) indicates a significant difference from MCF10A cells.
Significance level: * : p < 0.05; ** : p < 0.01.
PTEN phosphatase is a tumor suppressor implicated in a wide variety of human cancers39 and a major negative regulator of the PI 3-kinase/Akt signaling pathway.10,39,40 However, neither the levels of PTEN nor phospho-PTEN (inactivated form of PTEN) were changed in the 10A cell lineage (data not shown). PDK1 plays a central role in many signal transduction pathways,41 activating Akt, downstream mTOR and p70S6K, and is involved in the regulation of gene transcription, mRNA translation, cell proliferation, differentiation and apoptosis. PDK1 is activated by PIP3 produced by PI 3-kinase. The levels of PDK1 protein and phospho-PDK1 increased significantly by ~1.5- and 2.1-fold in the 10CA1a tumor cells as compared with the 10A, 10AT or 10ATG3B cells (Fig. 4A, B).
Figure 4.

Panel A Immunoblot analysis of PDK1 and phospho-PDK1 protein levels in the MCF10A (10A), MCF10AT (10AT), MCF10ATG3B (3B) and MCF10CA1a (CA1a) cells. Panel B: Graphical analysis of band densities normalized for protein loading with GAPDH. Columns and error bars represent means ± SE of immunoblot band densities of three separate protein preparations.
(*) indicates a significant difference from MCF10A cells.
(#) indicates a significant difference from MCF10AT cells.
(‡) indicates a significant difference from MCF10ATG3B cells.
Significance: ***, ###, ‡‡‡ : p < 0.001.
Akt is activated by insulin, IGF-1 and various growth and survival factors, through PI 3-kinase and PDK1, 2 (Fig. 1).8 No significant changes in total Akt protein expression were detected in the MCF10A cell lineage (Fig. 5A). In contrast, phospho-Akt (Ser473) protein levels progressively increased in 10AT, 10ATG3B and 10CA1a cells from 2.7- to 10.2-fold relative to the parent, non-tumorigenic 10A cells (Fig. 5A, B). A progressive increase in phospho-Akt (Thr308) (from 5.7- to 137-fold increase) also occurred, with the most dramatic change occurring in 10CA1a tumor cells (Fig. 5A, B).
Figure 5.

Panel A Immunoblot analysis of Akt, phospho-Akt (Ser473) and phospho-Akt (Thr308) protein levels in the MCF10A, MCF10AT, MCF10ATG3B and MCF10CA1a cells. Panel B: Graphical analysis of band densities normalized for protein loading with GAPDH. Columns and error bars represent means ± SE of immunoblot band densities of three separate protein preparations from each cell.
(*) indicates a significant difference from MCF10A cells.
(#) indicates a significant difference from MCF10AT cells.
(‡) indicates a significant difference from MCF10ATG3B cells.
Significance level: ***, ###, ‡‡‡ : p < 0.001.
Once activated, Akt, through phosphorylation and inactivation of TSC1/2 and Rheb, activates mTOR and its complexes (mTORC1 and mTORC2), and downstream p70S6K (Fig. 1). mTOR phosphorylates and inactivates of 4E-BP1, the inhibitor of eIF4E.42,43, 44, 45 This loss of inhibition results in the initiation of cap-dependent mRNA translation. Neither TSC1,2, which function as a tumor suppressors 46, nor mTOR or phospho-mTOR levels were altered in this cell lineage (data not shown).
The mitogen activated Ser/Thr protein kinase p70S6K is required for cell proliferation and G1 cell cycle progression.47,48 Phosphorylation of Thr229 in the catalytic domain and Thr389 in the linker domain are most critical for kinase function.48 Phosphorylation of Thr389 most closely correlates with p70S6K activity in vivo 49 and is required for the action of PDK1 on Thr229.50 Phosphorylation at Thr421 and Ser424 is thought to activate p70S6K via relief of pseudosubstrate suppression.48,49 Although the levels of p70S6K protein were unchanged in this cell lineage (Fig. 6A, B), phospho-p70S6K (Thr389) protein levels tended to increase in the cell lineage and significantly increased (~2.6 fold) in 10CA1a cells relative to 10A cells (Fig. 6A, B). The levels of phospho-p70S6K (Thr421/Ser424) protein were unchanged in 10A, 10AT and 10ATG3B cells relative to 10A cells, but significantly increased 2.2-fold in 10CA1a cells relative to 10A cells (Fig. 6A, B).
Figure 6.

Panel A Immunoblot analysis of p70S6K, phospho-p70S6K (Thr389) and phospho-p70S6K (Thr421/Ser424) levels in the MCF10A (10A), MCF10AT (10AT), MCF10ATG3B (3B) and MCF10CA1a (CA1a) cells. Panel B: Graphical analysis of band densities normalized for protein loading with GAPDH. Columns and error bars represent means ± SE of immunoblot band densities of three separate protein preparations.
(*) indicates a significant difference from MCF10A cells.
(#) indicates a significant difference from MCF10AT cells.
(‡) indicates a significant difference from MCF10ATG3B cells.
Significance: *, #, ‡ : p < 0.05; ‡‡ : p < 0.01; ***, ### : p < 0.001.
EIF4E is a phosphoprotein that specifically binds to 7-methylguanosine-containing cap of mRNA.51 The eIF4E protein is the rate-limiting component for the initiation of cap-dependent translation by the eIF4E translation initiation complex.51 Activation of PI 3-kinase, Akt and mTOR52 results in an increase in phospho-eIF4E and phospho-4E-BP1 protein levels and activates cap-dependent translation.53 Translational control regulates the expression of cyclin D1, c-myc, FGF and other mediators of cell cycle progression, cell growth and proliferation. Over expression of eIF4E can lead to increased cell proliferation, transformation and tumorigenesis.51 4E-BP1, known as PHAS-1, normally binds eIF4E, inhibiting cap-dependent translation and is phosphorylated in vivo on multiple residues; phosphorylation by mTOR on Thr37 and Thr46 of human 4E-BP1 may be very important for subsequent phosphorylation.54 EIF4E protein levels were unchanged with the progression of cell series (Fig. 7A, B). However, the levels of phospho-eIF4E protein increased significantly in 10AT (1.8-fold), 10ATG3B (1.6-fold) and 10CA1a (3.2-fold) cells relative to 10A cells (Fig. 7A, B). The levels of phospho-4E-BP1 protein increased slightly in 10AT and 10ATG3B cells, and significantly increased 4.6-fold in 10CA1a cells relative to 10A cells (Fig. 7A, B).
Figure 7.

Panel A Immunoblot analysis of eIF4E, phospho-eIF4E and phospho-4E-BP1 protein levels in the MCF10A (10A), MCF10AT (10AT), MCF10ATG3B (3B) and MCF10CA1a (CA1a) cells. Panel B: Graphical analysis of band densities normalized for protein loading with GAPDH. Columns and error bars represent means ± SE of immunoblot band densities of three separate protein preparations.
(*) indicates a significant difference from MCF10A cells.
(#) indicates a significant difference from MCF10AT cells.
(‡) indicates a significant difference from MCF10ATG3B cells.
Significance: *, # : p < 0.05; ** : p < 0.01; ***, ###, ‡‡‡ : p < 0.001.
In order to examine whether the alterations in protein and phosphoprotein levels detected in cells were reflected in tissue lesions, an immunohistochemical analysis of Ras, phospho-Akt, and phospho-p70S6K was accomplished in xenograft lesions from the premalignant 10AT and 10ATG3B cells and the CA1a tumor cells (Fig. 8). Table I summarizes the immunohistochemical findings obtained from tissue xenografts in nude mice. Ras expression was detected in early 10ATG3B benign lesions, and was substantially elevated in the malignant 10CA1a lesions (Table I). Phospho-Akt (Thr308) and phospho-Akt (Ser473) were also strongly expressed in 10CA1a lesions (Table I and Fig. 8). Phospho-p70S6K Thr389 was detected in early benign lesions and was elevated in the 10CA1a malignant lesion (Table 1, Fig. 8). In contrast, phospho-p70S6K (Thr421/Ser424) was detectable only in the ATG3B late (520 days) lesions and 10CA1a malignant lesions, with increasing intensity observed with progression from benign, to late lesion to malignant lesion (Table 1). The 10CA1a cells form rapidly growing cancers which achieve a size of 1 gram within 3 weeks. The invasive component present in the day 520 AT3B xenograft is still quite early, is growing very slowly, and the entire lesion weighs less than 50 mg. The stromal component of the xenografts was consistently negative. The immunohistochemical expression of Ras, phospho-Akt and phospho-p70S6K correlates with the significant changes monitored in Ras, phospho-Akt (Ser 473; Thr 308) and phospho-p70S6K (Thr 389 and Thr 421/Ser 424) to some extent in the 10ATG3B, and most notably in the CA1a cell line (e.g. Figs. 2 and 5) in that clearly detectable elevated levels of these proteins occurred in the late 10ATG3B invasive lesions and in the malignant 10CA1a lesions.
Figure 8.

Panel A Immunohistochemical analysis of phospho-Akt and phospho-p70S6K in in benign MCF10 AT, 10ATG3B late invasive lesions, and 10CA1a malignant lesions. Detection of phosphorylated Akt and p70S6K in MCF10 xenografts by immunohistochemistry showing reactivity with specific antibodies for phosphorylated proteins. First row of lesions was stained with anti-phospho-Akt (Thr308). The second row of lesions was stained with anti-phospho-Akt (Ser473). The third row of lesions was stained with anti-phospho-p70S6K (Thr389). The fourth row of lesions was stained with anti-phospho-p70S6K (Thr421/Ser424). Panel B: Detection of phosphorylated proteins requires quick fix processing. Sections from a 1 cm MCF10CA1a xenograft, which was cut into two, were placed in formalin and stained for phospho-Akt-Thr308 (left panel) or phospho-Akt-Ser473 (right panel). When compared to the comparable MCF10CA1a lesion stained after quick fix processing, as shown in Figure 8, panel A, it is clear that the detection of phospho-Akt is dependent on expeditious fixation.
Table 1.
DETECTION OF PAN-RAS, PHOSPHO-AKT AND PHOSPHO-P70S6K IN MCF10 XENOGRAFTS BY IMMUNOHISTOCHEMISTRY
| Proteins | Early MCF10AT Benign Lesions | Early MCF10AT3B Benign Lesions (39 days) | Late MCF10AT3B Invasive Lesions (520 days) | Malignant MCF10CA1a Lesions (10 days) |
|---|---|---|---|---|
| Pan-Ras | 0 | 4 | 4 | 7 |
| Phospho-Akt (Thr308) | 6 | 3 | 8 | 8 |
| Phospho-Akt (Ser473) | 6 | 2 | 3 | 7 |
| Phospho-p70S6K (Thr389) | 6 | 0 | 2 | 7 |
| Phospho-p70S6K (Thr421/Ser424) | 0 | 0 | 4 | 6 |
The scores are sums of a proportion factor and an intensity score. The proportion factor used was 0 for no positive cells, 1 for less than 1%, 2 for 1–10%, 3 for 10% to less than 1/3, 4 for 1/3 to 2/3, and 5 for over 2/3. The intensity score was 0 for no staining, 1 for weak staining, 2 for moderately intense staining, and 3 for strong staining.
We found that detection of the phosphorylated proteins was very dependent upon sample fixation. In some cases 15 mm diameter 10CA1a tumors were sliced into two, rather than thin slices approximating the size of the benign lesions, and placed in buffered formalin. The strong staining in the thin sliced sections and lack of detection in the halved sections (Fig. 8 A) from 10CA1a xenografts reflects the short half life of the phosphorylated proteins. When compared to the comparable 10CA1a lesion stained after quick fix processing, as shown in Figure 8 B (and inset), it is apparent that phospho-Akt detection is dependent on expeditious fixation. The importance of quick fixation in thin slices confirms a recent report in which biopsy samples were positive but surgical specimens from the same patients were negative when tested for phosphorylated Akt by immunohistochemistry.55
In mammalian cells, hormones and growth factors regulate the activity of FOXO 1, FOXO 3a and FOXO 4 via the PI 3-kinase, Akt, mTOR signaling pathway with Akt phosphorylating these transcription factors.56 To evaluate the relationship between Akt and FOXO transcription factors in the MCF10A cell lineage, we examined FOXO 1, 3a, and 4 protein and phosphoprotein levels in each of the cell lines. FOXO 1 protein levels were elevated 2.04- and 3.92-fold in 10ATG3B and 10CA1a cells, respectively, relative to 10A cells, with no significant difference between 10A and 10AT cells (Fig. 9A, B). However, neither FOXO 3a nor FOXO 4 protein levels were significantly changed in this cell lineage (Fig. 9A, B). In view of the increased phospho-Akt levels, we examined phospho-FOXO 1, 3a and 4 levels. Phospho-FOXO 1 protein levels were greatest in 10CA1a cells (5.6-fold), followed by 10ATG3B cells (3.1-fold) relative to 10A cells, with no significant difference between 10A and 10AT cells (Fig. 9A, C). The levels of phospho-FOXO 3a protein were 1.9-, 2.0- and 5.8-fold higher in 10AT, 10ATG3B and 10CA1a cells respectively, relative to 10A cells (Fig. 9A, C). Phospho-FOXO 4 levels were 4.6- and 17-fold higher in 10ATG3B and 10CA1a cells, but there was no significant difference between 10A and 10AT cells (Fig. 9A, C). The progressive increase in phospho-FOXO transcription factor protein levels, notably phospho-FOXO 1 and phospho-FOXO 3a, generally paralleled the increased level of phospho-Ser/Thr/Akt detected in the MCF10A cell lineage (Fig. 5A, B) and the tumorigenic potential of the cells.
Figure 9.

Panel A Immunoblot analysis of FOXO 1, phospho-FOXO 1 (Ser256), FOXO 3a, phospho-FOXO 3a (Ser253), FOXO 4 and phospho-FOXO 4 (Ser193) protein levels in the MCF10A, MCF10AT, MCF10ATG3B and MCF10CA1a cells. Panel B: Graphical analysis of FOXO 1, 3a and 4 protein band densities normalized for protein loading with GAPDH. Columns and error bars represent means ± SE of immunoblot band densities of three separate protein preparations. Panel C: Graphical analysis of phospho-FOXO 1, 3a and 4 protein band densities normalized for protein loading with GAPDH. Columns and error bars represent means ± SE of immunoblot band densities of three separate protein preparations.
(*) indicates a significant difference from MCF10A cells.
(#) indicates a significant difference from MCF10AT cells.
(‡) indicates a significant difference from MCF10ATG3B cells.
Significance: *, #, ‡ : p < 0.05; **,##,‡‡ : p < 0.01; ***, ###, ‡‡‡ : p < 0.001.
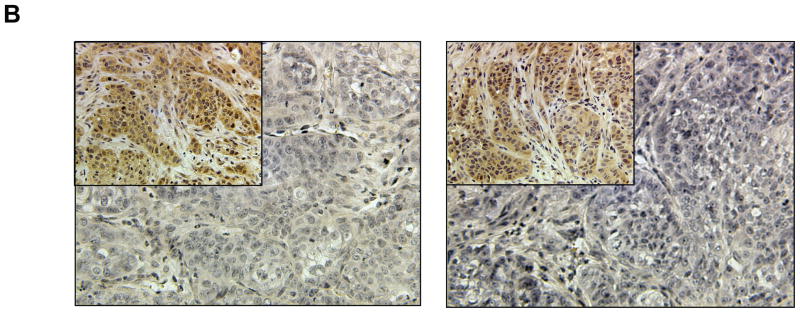
To demonstrate relevance, immunohistochemical examination of tissue xenograft lesions was performed. Immunohistochemical analysis of phospho-FOXO 1, phospho-FOXO 3a and phospho-FOXO 4 in MCF10 xenografts showed that antibody reactivity for each phospho-FOXO progressively increased with the stage of disease (Table 2 and Fig. 10). Staining for all three phosphorylated FOXO transcription factor proteins was weakly positive in both benign 10AT and early hyperplastic 10ATG3B lesions (39 days) (Table 2 and Fig. 10). In contrast, staining was strongly detected in the later invasive 10ATG3B lesion (520 days), as well as in the malignant 10CA1a lesion (10 days) (Table 2 and Fig. 10). The stromal component of the xenografts was consistently negative. Early 10ATG3B lesions express relatively low levels of the phospho-proteins, similar to the cell line itself. However, late 10ATG3B lesions that have progressed to contain invasive components express levels of the phospho-FOXO proteins similar to the malignant 10CA1a lesions. These data suggest that the phospho-FOXO proteins serve as biomarkers which just precede the conversion of high risk lesions to malignant lesions and hence, may serve as clinical biomarkers of tumorigenic risk. The relative changes in the FOXO 1, 3a and 4 levels parallel those monitored for the individual cell lines to the extent that immunoblot data can be compared to immunohistochemical staining.
Table 2.
DETECTION OF PHOSPHORYLATED FOXO OF TRANSCRIPTION FACTORS IN MCF10 XENOGRAFTS BY IMMUNOHISTOCHEMISTRY
| Proteins | Early MCF10AT Benign Lesions | Early MCF10AT3B Benign Lesions (39 days) | Late MCF10AT3B Invasive Lesions (520 days) | Malignant MCF10CA1a Lesions (10 days) |
|---|---|---|---|---|
| Phospho-FOXO1 (Ser256) | 3 | 2 | 8 | 7 |
| Phospho-FOXO3a (Ser253) | 5 | 5 | 8 | 7 |
| Phospho-FOXO4 (Ser193) | 3 | 5 | 8 | 7 |
The scores are sums of a proportion factor and an intensity score. The proportion factor used was 0 for no positive cells, 1 for less than 1%, 2 for 1–10%, 3 for 10% to less than 1/3, 4 for 1/3 to 2/3, and 5 for over 2/3. The intensity score was 0 for no staining, 1 for weak staining, 2 for moderately intense staining, and 3 for strong staining.
Figure 10.

Immunohistochemical analysis of phospho-FOXO 1, 3a and 4 transcription factors in MCF10 AT, 10ATG3B early hyperplastic lesions and late invasive lesions, and 10CA1a malignant lesions. The first row shows staining of the lesions with anti-phospho-FOXO 1 (Ser 256); the second row shows staining with anti-phospho FOXO 3a and the third row shows staining with anti-phospho FOXO 4. These data show strong reactivity with specific antibodies for the phosphorylated FOXO proteins in late invasive and malignant lesions.
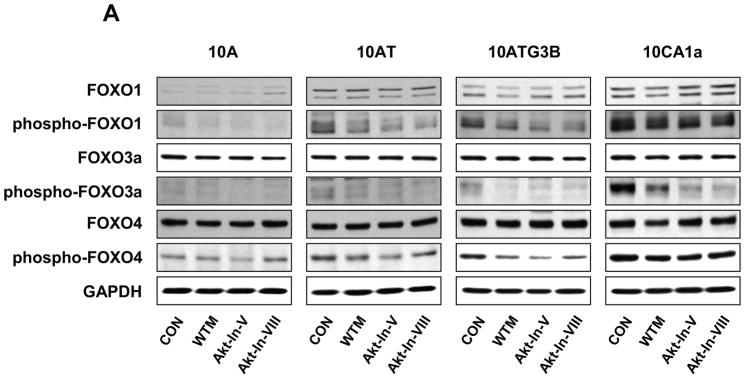
To determine whether Akt activation was associated with FOXO transcription factor phosphorylation in the MCF10A cell series, we examined the effects of the upstream PI 3-kinase inhibitor, wortmannin, as well as chemical inhibitors of Akt. Akt inhibitor V is a tricyclic nucleoside derivative and selectively inhibits the cellular phosphorylation/activation of Akt 1, 2 and 3.57 Akt inhibitor VIII is a quinoxaline compound that potently and selectively inhibits Akt1 and 2 kinase activity, which appears to be pleckstrin homology (PH) domain-dependent.58,59 As shown in Fig. 11 (A), total Akt protein levels remain unchanged in 10A, 10AT, 10ATG3B and 10CA1a cells treated with inhibitors wortmannin, Akt inhibitor V and Akt inhibitor VIII, relative to the respective untreated cells. We confirmed that inhibition of PI 3-kinase by wortmannin decreased Akt phosphorylation at Ser473 (44–84% inhibition) and at Thr 308 (50–82% inhibition) in 10A, 10AT, 10ATG3B and 10CA1a cells. Wortmannin inhibition of Akt-Ser 473 phosphorylation progressively decreased in efficacy in the 10AT, 10ATG3B cells and was the least efficacious in 10CA1a tumor cells (Fig. 11 A). Wortmannin inhibition of Akt Thr 308 phosphorylation was also least efficacious in the 10CA1a tumor cells (Fig. 11).
Figure 11.

Panel A Immunoblot analysis of Akt, phospho-Akt (Ser473) and phospho-Akt (Thr308) protein levels in the MCF10A, MCF10AT, MCF10ATG3B and MCF10CA1a cells. Cells were treated with wortmannin (WTM, 500 nM), Akt inhibitor V (Akt-In-V, 20 μM) or Akt inhibitor VIII (Akt-In-VIII, 5 μM) for 4 h. Control (CON) cells were treated with dimethylsulfoxide for 4 h. Panel B: Immunoblot analysis of Akt, phospho-Akt (Ser473) and phospho-Akt (Thr308) protein levels in the MCF10A, MCF10AT, MCF10ATG3B and MCF10CA1a cells and the corresponding cells treated with 5 μM of the Akt inhibitor A-443654 in dimethylsulfoxide for 2 h. Control (CON) cells were treated with dimethylsulfoxide for 2 h. Akt was effectively inhibited as shown by the elevated levels of phospho-Akt in the presence of A-443654.
Akt inhibitor V and Akt inhibitor VIII strongly inhibited the phosphorylation of Akt at Ser473 (74–96% inhibition) and at Thr308 (53–98% inhibition) in 10A, and 10AT cells with the efficacy of inhibition decreasing in the premalignant 10ATG3B and CA1a tumor cells (Fig. 11A). Akt inhibitor VII and Akt inhibitor VIII were more efficacious in inhibiting Akt Thr 308 phosphorylation.
We examined a novel Akt inhibitor, A-443654, which is an indazole-pyridine derivative that binds to the ATP site of Akt and inhibits Akt-catalyzed phosphorylation activity by competitive and reversible binding to the ATP site of Akt.60 A-443654 is a potent and highly efficacious pan inhibitor of Akt that inhibits communication with downstream targets, including glycogen synthase kinase (GSK) 3α/β, TSC1/2, mTOR, p70 S6 kinase, and the ribosomal S6 kinase.60 A-443654 allows phosphorylation of Akt to proceed, but inhibits phosphorylation of downstream targets.60 Hence, phospho-Akt levels progressively increase.60 Our results show that Akt protein levels decreased (44–55% inhibition) in 10A, 10AT, 10ATG3B and 10CA1a cell treated with 5 μM of A-443654 as compared to respective untreated cells (Fig. 11 B). A-443654 concomitantly increased the levels of phospho-Akt, with phosphorylation of Akt at Ser473 increasing 2.7- to 47.1- fold and phosphorylation of Akt at Thr308 increasing 1.6- to 62-fold in 10A, 10AT, 10ATG3B and 10CA1a cells as compared to each untreated cells, respectively (Fig. 11 B). Thus, A-443654 appears to be equally efficacious in inhibiting Akt in the premalignant 10AT and 10ATG3B cells as well as the CA1a tumor cells, which express very high levels of phospho-Akt. This is likely the result of the Ability of A-443654 to “trap” the phosphorylated Akt family. The functional effect of Akt inhibition by A-443654 on downstream FOXO 1, 3a and 4 was examined.
To evaluate the role of Akt in phosphorylating the downstream FOXO 1, 3a and 4 transcription factor targets, cells were treated with wortmannin, Akt inhibitor V, VIII or A-443654. As shown in Fig. 12 (A), FOXO 1, 3a and 4 protein levels were unchanged in response to wortmannin, Akt inhibitor V or Akt inhibitor VIII in 10A, 10AT, 10ATG3B and 10CA1a cells relative to the respective untreated cells. Wortmannin inhibited the phosphorylation of FOXO 1 with decreasing efficacy (59%–25% inhibition) across the cell lines with the least efficacy monitored for the CA1a tumor cells. Wortmannin inhibition of phospho-FOXO 3a ranged from 82% for the 10A cells to 36% for the CA1A cells. Wortmannin inhibition of phospho-FOXO 4 was relatively weak across the cell lines ranging from 0 to 58%, with the 58% inhibition monitored for the 10ATG3B cells.
Figure 12.

Panel A Immunoblot analysis of FOXO 1, phospho-FOXO 1 (Ser256), FOXO 3a, phospho-FOXO 3a (Ser253), FOXO 4 and phospho-FOXO 4 (Ser193) protein levels in the MCF10A, MCF10AT, MCF10ATG3B and MCF10CA1a cells. Cells were treated with wortmannin (WTM, 500 nM), Akt inhibitor V (Akt-In-V, 20 μM) or Akt inhibitor VIII (Akt-In-VIII, 5 μM) for 4 h. Control (CON) cells were treated with dimethylsulfoxide for 4 h. Panel B: Immunoblot analysis of FOXO 1, phospho-FOXO 1 (Ser256), FOXO 3a, phospho-FOXO 3a (Ser253), FOXO 4 and phospho-FOXO 4 (Ser193) protein levels in the MCF10A, MCF10AT, MCF10ATG3B and MCF10CA1a cells following treatment of the cells with 5 μM of A-443654 for 2 h. Control (CON) cells were treated with dimethylsulfoxide for 2 h. Akt effectively inhibited the phosphorylation of all FOXO family members.
Akt inhibitor V or Akt inhibitor VIII decreased FOXO 1 phosphorylation with decreasing efficacy in the 10A, 10AT, 10ATG3B and 10CA1a cells (Fig. 12 A). Akt inhibitors V and VIII were somewhat more efficacious in inhibiting FOXO 3a phosphorylation in the 10A, 10AT, 10ATG3B and 10CA1a cells. However, the phosphorylation of FOXO 4 was only weakly inhibited by the Akt inhibitors V and VIII inhibitors (Fig. 12 A). These data show that the different mechanisms by which inhibitors of Akt effect inhibition of Akt differentially effects the efficacy and selectivity of inhibiting phosphorylation of FOXO 1, 3a and 4. These data generally show that Akt inhibitors V and VII are not efficacious in achieving the broad spectrum inhibition of FOXO 1, 3a and 4 phosphorylation in either premalignant cells or in tumor cells expressing elevated levels of phospho-Akt.
To further explore the results of Akt inhibition on FOXO 1, 3a and 4phosphorylation, the pan Akt inhibitor A-443654 was employed. FOXO 1, 3a and 4 protein levels were unchanged in response to A-443654 in 10A, 10AT, 10ATG3B and 10CA1a cells relative to the respective untreated cells (Fig. 12 B). In contrast to Akt inhibitor V or VIII, the phosphorylation of FOXO 1 (50–98% inhibition), FOXO 3a (39–99% inhibition) and FOXO 4 (66–87% inhibition) was strongly inhibited by A-443654 in 10A, 10AT, 10ATG3B and 10CA1a cells (Fig. 12 B). Thus, A-443654 specifically and more effectively inhibited FOXO 1, 3a and 4 phosphorylation in the premalignant and tumor cells. Based on the above results, Akt actively phosphorylates all three FOXO transcription factors in MCF10A cell lineage and, of the inhibitors examined, only A-443654 efficaciously inhibits Akt-catalyzed FOXO 1, 3a and 4 phosphorylation. These data illustrate the importance of the efficacy and mechanism by which Akt inhibition is achieved. These data suggest that FOXO transcription factors may play a critical role in the early events and progressive changes which result in cell transformation and oncogenesis. Thus, the MCF10A cell lineage, which exhibits progressively elevated levels of Ras and captures many elements of early etiology and progression, has now been shown to contain elevated levels of phospho-Akt and phospho-FOXO 1, 3a and 4 transcription factors that have been associated with cell proliferation and resistance to apoptosis.
Because of the efficacy in completely inhibiting Akt and downstream targets, the functional effects of A-443654 on cell morphology, cell cycle progression, and apoptosis were examined. A-443654 induced morphological changes in the MCF10, 10AT, 10ATG3B and 10CA1a cells consisted of cell retraction, and blebbing. Morphological changes were noted as early as 2 h post-treatment and significant changes were noted at 4 h following treatment (Fig. 13: A,B,C,D). The severity of the effects of A-443654 on the cells increased at 8 h, with cells detaching from the plate and floating in the medium.
Figure 13.

Akt inhibitor A-443654 effects on cell morphology. A-443654 induces morphological changes in the MCF10A cell lineage. Panels A, B, C and D, respectively, show the morphological changes in the MCF10A, 10AT, 10ATG3B and CA1a cells, treated with 5uM A-443654 in DMSO for 4, 8 and 12 h respectively,, relative to the respective DMSO control. Cell morphology was examined using phase contrast microscopy at 200× magnification. A-443654 induced significant morphological changes in the MCF10A cell lineage which accelerated over time.
Analysis of A-443654 effects on the cell cycle and apoptosis were examined using flow cytometry (Fig. 14). Flow cytometry data showed that A-443654 increased the cells in G2/M in the 10A, 10AT, 10ATG3B and 10CA1a cells, respectively, relative to the DMSO control (Figure 14 B). These data suggest that A443654 exert its effects through G2/M cell cycle arrest.
Figure 14.


FACScan analysis of Akt inhibitor effects on the MCF10A cell lineage. Cells were collected and analyzed for DNA content using flow cytometry. MCF10A, 10AT, 10ATG3B and 10CA1a cells were treated with 5uM A-443654 in DMSO for 4, 8 and 12 h. Control cells were treated with DMSO. A-443654 induced G2/M cell cycle arrest in the MCF10A cell lineage and apoptosis in the 10CA1a tumor cells. Panel A: Representative flow cytometry data showing A-443654 effects on the cell cycle and apoptosis. A-443654 induced G2/M arrest in the MCF10A cell lineage. A large peak reflective of apoptotic cells was detected in the A-443654 treated 10CA1a cells at 12h. Panel B: Changes in the distribution of cells in G1 (□), S (
 ) and G2/M (▨) and undergoing apoptosis (
 ) following treatment with A-443654. Results are expressed as the mean ± S.D. of three replicates of the percentage of cells in the different phases of the cell cycle or undergoing apoptosis. In some cases the error bars fall within the margin of the bar.. Evidence of apoptosis was detected in the 10Ca1a cells.
No evidence of apoptosis was observed in the flow cytometry data of 10A, 10AT, 10ATG3B or 10CA1a cells treated with A-443654 for 4 or 8 h. At 12 h a very small apoptotic peak (~0.14% % of the cells) was detected in the A-443654 treated 10 A cells. In contrast, a substantial apoptotic peak (~23.6 % of the cells) was detected for CA1a cells, as compared to the DMSO control (Fig 14A, B). While some agents which induce G2/M arrest also cause apoptosis, others do not.61 To examine whether A-443654 caused apoptosis, we also examined PARP cleavage, an indicator of cells undergoing apoptosis, using the 10A and 10CA1a cells treated with A-443654 for 12 h. These two cell lines were chosen based on apoptosis detected in the FACScan cell cycle analysis. As shown in Fig 15, PARP cleavage was detected for 10A and 10CA1a cells treated with A-443654. These data suggest that A-443654 induces G2/M arrest and apoptosis in the 10A and CA1a tumor cells.
Figure 15.
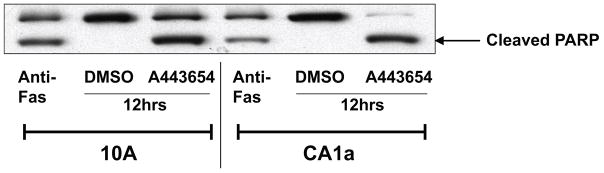
PARP cleavage showing A-443654-induced apoptosis. The 10A and 10CA1a cells were treated with 5uM A443654 for 12 h. Cells treated with DMSO were used as negative controls, while cells treated with anti-Fas (1μg/ml) for 12 h were used as positive controls. Cell lysates were extracted and probed with anti-PARP antibody. Cleaved PARP bands (89kD) indicate the initiation of apoptosis. Cleaved PARP bands were clearly detected in anti-Fas-treated 10A and 10CA1a cells as well as in A-443654-treated 10A and 10CA1a cells. Hence, A-443654 causes apoptosis in the 10A and 10CA1a cells.
Luo et al. examined the ability of A-443654 to inhibit colony formation in soft agar and tumor growth in vivo.60 3T3 murine fibroblasts expressing constitutively active Akt1 exhibited an increased ability to form colonies in soft agar and to produce tumors in scid mice.60 A-443654 treatment inhibited the growth of flank tumors in the SCID mice and increased the number of apoptotic cells in the tumors as reflected by immunohistochemical staining for activated caspase 3.60 Several other models of tumorigenesis were also examined and in all models examined A-4436454 slowed tumor growth. Cessation of A-443654 treatment however, resulted in rapid regrowth of the tumors. Thus, continuous dosing to inhibit Akt, or a combination treatment regimen employing inhibition of Akt and mTOR, may be required to increase efficacy.60
In summary, we have examined protein and phosphoprotein levels of the PI 3-kinase, Akt, mTOR signaling pathway that have been independently correlated with breast cancer risk. In this cell lineage, we show that several biomarkers are elevated with progression of the cells from benign, to premalignant, to tumor cells and from invasive to malignant lesions. The effective therapeutic treatment of breast cancer, given the heterogeneity of the disease, will likely require a multiple-targeting strategy to inhibit or down-regulate simultaneously multiple signaling components which regulate gene transcription, mRNA translation, cell structure, growth, proliferation, and survival. Among these, the progressive elevation of H-Ras, phospho-Akt and phospho-FOXO 1, 3a and 4 appear to be important in the conversion of benign lesions to invasive and malignant lesions and hence, may be useful in assessing the risk for breast cancer development and progression and potentially as predictors of therapeutic response and recurrence.
Novelty and Impact.
This report provides evidence of progressively altered levels of critical signaling proteins and/or phosphoproteins in benign, premalignant and tumor cells and in early and late invasive lesions and malignant lesions. Seminal data are presented on the progressive changes in the expression of FOXO 1, FOXO 3a and FOXO 4 protein and phosphoprotein levels in benign, premalignant and tumor cells in vitro and in xenographs. These studies show that altered expression of proteins and phosphoproteins, including phospho-Akt, and phospho-FOXO 1, and FOXO 3a and FOXO 4 proteins increase in level with progression from benign to premalignant to tumor cells and from early hyperplastic to late invasive and malignant lesions. Inhibitor studies show that a specific, efficacious pan inhibitor of Akt is required to inhibit Akt-mediated phosphorylation of downstream targets. This research provides data on potential biomarkers of risk for progression to carcinoma, for tumor recurrence, and for therapeutic response, and the data suggest that Akt may be a viable therapeutic target for treatment of breast cancer.
Statement.
This work utilizes a unique system of breast epithelial cells derived from a spontaneously immortalized parental non-tumorigenic cell line obtained from a patient with fibrocystic disease. This cell lineage reflects the decade or longer temporal process which results in a tumor cell. Thus, this system permits analysis of early and progressive changes in critical regulatory signaling proteins and phosphoproteins which occur with increased tumorigenic risk of the cell and culminate in the tumor cell. Immunohistochemical staining of lesions for phosphoproteins biomarkers reveals a correspondence between the cells and lesions. Effective inhibition of Akt is required for inhibition of FOXO 1, 3a and 4 phosphorylation, cell cycle arrest and apoptosis and suggests that Akt may be a viable target for breast cancer therapy. These data suggest a collective role for H-Ras, and Akt, FOXO 1, 3a and 4 phosphoproteins as biomarkers for assessing tumorigenic risk, and potentially the risk of recurrence and therapeutic response.
Acknowledgments
This work was supported by NIH grant ES10595 and, in part, by EHS Center grant P30 ES06639, from the National Institute of Environmental Health Sciences through the services of the Molecular Imaging and Cytometry Core and the Cell Culture and Gene Transfer Technology Facility Core. We thank Dr. Alice Hudder for review of the manuscript and Ms. Jennifer Ortwine for technical assistance with the artwork and manuscript preparation.
Abbreviations
- PBD
proliferative breast disease
- MCF10A
10A cells
- MCF10AT
10AT cells
- MCF10ATG3B
10ATG3B cells
- MCF10CA1a
10CA1a cells
- DMEM
Dulbecco’s modified Eagle medium
- PI3K
phosphatidylinositol 3 kinase
- PDK
phosphoinositide-dependent protein kinase
- PTEN
phosphatase and tensin homologue deleted on chromosome ten
- mTOR
mammalian target of rapamycin
- p70S6K
p70 S6 kinase
- eIF4E
eukaryotic initiation factor 4E
- 4E-BP1
eIF4E-binding protein 1
- S6RP
S6 ribosomal protein
- FOXO
Forkhead Transcription Factors Other
- FOXO 1 (FKHR)
FOXO 3a (FKHRL1) and FOXO 4 (AFX)
- GAPDH
glyceraldehyde-3-phosphate dehydrogenase
- PARP
poly(ADP-ribose) polymerase
References
- 1.Jemal A, Tiwari RC, Murray T, Ghafoor A, Samuels A, Ward E, Feuer EJ, Thun MJ. Cancer statistics. CA Cancer J Clin. 2004;54:8–29. doi: 10.3322/canjclin.54.1.8. [DOI] [PubMed] [Google Scholar]
- 2.Dupont WD, Page DL. Risk factors for breast disease in women with proliferative breast disease. N Engl J Med. 1985;312:146–51. doi: 10.1056/NEJM198501173120303. [DOI] [PubMed] [Google Scholar]
- 3.Clair T, Miller FR, Cho-Chung YS. Prognostic significance of the expression of a ras protein with a molecular weight of 21,000 by human breast cancer. Cancer Res. 1987;47:5290–3. [PubMed] [Google Scholar]
- 4.Clark GJ, Der CJ. Aberrant function of the Ras signal transduction pathway in human breast cancer. Breast Cancer Res Treat. 1995;35:133–44. doi: 10.1007/BF00694753. [DOI] [PubMed] [Google Scholar]
- 5.Salh B, Marotta A, Wagey R, Sayed M, Pelech S. Dysregulation of phosphatidylinositol 3-kinase and downstream effectors in human breast cancer. Int J Cancer. 2002;98:148–54. doi: 10.1002/ijc.10147. [DOI] [PubMed] [Google Scholar]
- 6.Sun M, Paciga JE, Feldman RI, Yuan Z, Coppola D, Lu YY, Shelley SA, Nicosia SV, Cheng JQ. Phosphatidylinositol-3-OH Kinase (PI3K)/AKT2, activated in breast cancer, regulates and is induced by estrogen receptor alpha (ERalpha) via interaction between ERalpha and PI3K. Cancer Res. 2001;61:5985–91. [PubMed] [Google Scholar]
- 7.Kennedy SG, Wagner AJ, Conzen SD, Jordan J, Bellacosa A, Tsichlis PN, Hay N. The PI 3-kinase/Akt signaling pathway delivers an anti-apoptotic signal. Genes Dev. 1997;11:701–13. doi: 10.1101/gad.11.6.701. [DOI] [PubMed] [Google Scholar]
- 8.Burgering BM, Coffer PJ. Protein kinase B (c-Akt) in phosphatidylinositol-3-OH kinase signal transduction. Nature. 1995;376:599–602. doi: 10.1038/376599a0. [DOI] [PubMed] [Google Scholar]
- 9.Alessi DR, Andjelkovic M, Caudwell B, Cron P, Morrice N, Cohen P, Hemmings BA. Mechanism of activation of protein kinase B by insulin and IGF-1. EMBO J. 1996;15:6541–51. [PMC free article] [PubMed] [Google Scholar]
- 10.Wan X, Helman LJ. Levels of PTEN protein modulate Akt phosphorylation on serine 473, but not on threonine 308, in IGF-II-overexpressing rhabdomyosarcomas cells. Oncogene. 2003;22:8205. doi: 10.1038/sj.onc.1206878. [DOI] [PubMed] [Google Scholar]
- 11.Brunet A, Bonni A, Zigmond MJ, Lin MZ, Juo P, Hu LS, Anderson MJ, Arden KC, Blenis J, Greenberg ME. Akt promotes cell survival by phosphorylating and inhibiting a Forkhead transcription factor. Cell. 1999;96:857–68. doi: 10.1016/s0092-8674(00)80595-4. [DOI] [PubMed] [Google Scholar]
- 12.Cardone MH, Roy N, Stennicke HR, Salvesen GS, Franke TF, Stanbridge E, Frisch S, Reed JC. Regulation of cell death protease caspase-9 by phosphorylation. Science. 1998;282:1318–21. doi: 10.1126/science.282.5392.1318. [DOI] [PubMed] [Google Scholar]
- 13.Diehl JA, Cheng M, Roussel MF, Sherr CJ. Glycogen synthase kinase-3beta regulates cyclin D1 proteolysis and subcellular localization. Genes Dev. 1998;12:3499–511. doi: 10.1101/gad.12.22.3499. [DOI] [PMC free article] [PubMed] [Google Scholar]
- 14.Gesbert F, Sellers WR, Signoretti S, Loda M, Griffin JD. BCR/ABL regulates expression of the cyclin-dependent kinase inhibitor p27Kip1 through the phosphatidylinositol-3- Kinase/AKT pathway. J Biol Chem. 2000;275:39223–30. doi: 10.1074/jbc.M007291200. [DOI] [PubMed] [Google Scholar]
- 15.Zhou BP, Liao Y, Xia W, Spohn B, Lee MH, Hung MC. Cytoplasmic localization of p21Cip1/WAF1 by Akt-induced phosphorylation in HER-2/neu-overexpressing cells. Nat Cell Biol. 2001;3:245–52. doi: 10.1038/35060032. [DOI] [PubMed] [Google Scholar]
- 16.Burgering BM. A brief introduction to FOXOlogy. Oncogene. 2008;27:2258–62. doi: 10.1038/onc.2008.29. [DOI] [PubMed] [Google Scholar]
- 17.Hu MC, Lee D-F, Xia W, Golfman LS, Qu-Yang F, Yang J-Y, Zou Y, Bao S, Hanada N, Saso H, Kobayashi R, Hung MC. IκB kinase promotes tumorigenesis through inhibition of Forkhead FOXO 3a. Cell. 2004;117:225–37. doi: 10.1016/s0092-8674(04)00302-2. [DOI] [PubMed] [Google Scholar]
- 18.Biggs WH, Meisenhelder J, III, Hunter T, Cavenee WK, Arden KC. Protein kinase B/Akt-mediated phosphorylation promotes nuclear exclusion of the winged helix transcription factor FKHR1. Proc Natl Acad Sci USA. 1999;96:7421–6. doi: 10.1073/pnas.96.13.7421. [DOI] [PMC free article] [PubMed] [Google Scholar]
- 19.Tang ED, Nunñz G, Barr FG, Guan K-L. Negative regulation of the forkhead transcription factor FKHR by Akt. J Biol Chem. 1999;274:16741–6. doi: 10.1074/jbc.274.24.16741. [DOI] [PubMed] [Google Scholar]
- 20.Soule HD, Maloney TM, Wolman SR, Peterson WD, Brenz R, McGrath CM, Russo J, Pauley RJ, Jones RF, Brooks SC. Isolation and characterization of a spontaneously immortalized human breast epithelial cell line, MCF-10. Cancer Res. 1990;50:6075–86. [PubMed] [Google Scholar]
- 21.Dawson PJ, Wolman SR, Tait L, Heppner GH, Miller FR. MCF10AT: a model for the evolution of cancer from proliferative breast disease. Am J Pathol. 1996;148:313–9. [PMC free article] [PubMed] [Google Scholar]
- 24.Miller FR, Soule HD, Tait L, Pauley RJ, Wolman SR, Dawson PJ, Heppner GH. Xenograft model of progressive human proliferative breast disease. J Natl Cancer Inst. 1993;85:1725–32. doi: 10.1093/jnci/85.21.1725. [DOI] [PubMed] [Google Scholar]
- 25.Santner SJ, Dawson PJ, Tait L, Soule HD, Eliason J, Mohamed AN, Wolman SR, Heppner GH, Miller F. Malignant MCF10CA1 cell lines derived from premalignant human brest epithelial MCF10AT cells. Breast Cancer Res Treat. 2001;65:101–10. doi: 10.1023/a:1006461422273. [DOI] [PubMed] [Google Scholar]
- 26.Starcevic SL, Elferink C, Novak RF. Progressive resistance to apoptosis in a cell lineage model of human Proliferative Breast Disease. J Nat Cancer Instit. 2001;93:776–82. doi: 10.1093/jnci/93.10.776. [DOI] [PubMed] [Google Scholar]
- 27.Starcevic SL, Diotte NM, Zukowski KL, Cameron MJ, Novak RF. Oxidative DNA damage and repair in a cell lineage model of human proliferative breast disease (PBD) Toxicol Sci. 2003;75:74–81. doi: 10.1093/toxsci/kfg154. [DOI] [PubMed] [Google Scholar]
- 28.Harvey JM, Clark GM, Osborne K, Allred DC. Estrogen receptor status by immunohistochemistry is superior to the ligand-binding assay for predicting response to adjuvant endocrine therapy in breast cancer. J Clin Oncol. 1999;17:1474–1481. doi: 10.1200/JCO.1999.17.5.1474. [DOI] [PubMed] [Google Scholar]
- 29.DeBiasi F, Del Sal G, Hand PN. Evidence of enhancement of the ras oncogene protein product (p21) in a spectrum of human tumors. Int J Cancer. 1989;43:431–5. doi: 10.1002/ijc.2910430315. [DOI] [PubMed] [Google Scholar]
- 30.Scita G, Tenca P, Frittoli E, Tocchetti A, Innocenti M, Giardina G, Di Fiore PP. Signaling from Ras to Rac and beyond: not just a matter of GEFs. EMBO J. 2000;19:2393–8. doi: 10.1093/emboj/19.11.2393. [DOI] [PMC free article] [PubMed] [Google Scholar]
- 31.Voice JK, Klemke RL, Le A, Jackson JK. Four human Ras homologs differ in their abilities to activate Raf-1, induce transformation, and stimulate cell motility. J Biol Chem. 1999;274:17164–70. doi: 10.1074/jbc.274.24.17164. [DOI] [PubMed] [Google Scholar]
- 32.Yan J, Roy S, Apolloni A, Lane A, Hancock JF. Ras isoforms vary in their ability to activate Raf-1 and phosphoinositide 3-kinase. J Biol Chem. 1998;273:24052–6. doi: 10.1074/jbc.273.37.24052. [DOI] [PubMed] [Google Scholar]
- 33.Walsh AB, Sagi DB. Differential activation of the Rac pathway by Ha-Ras and K-Ras. J Biol Chem. 2001;276:15609–15. doi: 10.1074/jbc.M010573200. [DOI] [PubMed] [Google Scholar]
- 34.Maher J, Baker DA, Manning M, Dibb NJ, Roberts IA. Evidence for cell-specific differences in transformation by N-, H- and K-ras. Oncogene. 1995;11:1639–47. [PubMed] [Google Scholar]
- 35.Ridley AJ, Paterson HF, Johnston CL, Diekmann D, Hall A. The small GTP-binding protein rac regulates growth factor-induced membrane ruffling. Cell. 1992;70:401–10. doi: 10.1016/0092-8674(92)90164-8. [DOI] [PubMed] [Google Scholar]
- 36.Ridley AJ, Hall A. The small GTP-binding protein rho regulates the assembly of focal adhesions and actin stress fibers in response to growth factors. Cell. 1992;70:389–99. doi: 10.1016/0092-8674(92)90163-7. [DOI] [PubMed] [Google Scholar]
- 37.Rodriguez-Viciana P, Warne PH, Dhand R, Vanhaesebroeck B, Gout I, Fry MJ, Waterfield MD, Downward J. Phosphatidylinositol-3-OH kinase as a direct target of Ras. Nature. 1994;370:527–32. doi: 10.1038/370527a0. [DOI] [PubMed] [Google Scholar]
- 38.Cantley LC. The phosphoinositide 3-kinase pathway. Science. 2002;296:1655–7. doi: 10.1126/science.296.5573.1655. [DOI] [PubMed] [Google Scholar]
- 39.Cantley LC, Neel BG. New insights into tumor suppression: PTEN suppresses tumor formation by restraining the phosphoinositide 3-kinase/AKT pathway. Proc Natl Acad Sci USA. 1999;96:4240–5. doi: 10.1073/pnas.96.8.4240. [DOI] [PMC free article] [PubMed] [Google Scholar]
- 40.Wu X, Senechal K, Neshat MS, Whang YE, Sawyers CL. The PTEN/MMAC1 tumor suppressor phosphatase functions as a negative regulator of the phosphoinositide 3-kinase/Akt pathway. Proc Natl Acad Sci USA. 1998;95:15587–91. doi: 10.1073/pnas.95.26.15587. [DOI] [PMC free article] [PubMed] [Google Scholar]
- 41.Toker A, Newton AC. Cellular signaling: pivoting around PDK-1. Cell. 2000;103:185–8. doi: 10.1016/s0092-8674(00)00110-0. [DOI] [PubMed] [Google Scholar]
- 42.Nave BT, Ouwens M, Withers DJ, Alessi DR, Shepherd PR. Mammalian target of rapamycin is a direct target for protein kinase B: identification of a convergence point for opposing effects of insulin and amino-acid deficiency on protein translation. Biochem J. 1999;344(Pt 2):427–31. [PMC free article] [PubMed] [Google Scholar]
- 43.Manning BD, Tee AR, Logsdon MN, Blenis J, Cantley LC. Identification of the tuberous sclerosis complex-2 tumor suppressor gene product tuberin as a target of the phosphoinositide 3-kinase/akt pathway. Mol Cell. 2002;10:151–62. doi: 10.1016/s1097-2765(02)00568-3. [DOI] [PubMed] [Google Scholar]
- 44.Dennis PB, Jaeschke A, Saitoh M, Fowler B, Kozma SC, Thomas G. Mammalian TOR: a homeostatic ATP sensor. Science. 2001;294:1102–5. doi: 10.1126/science.1063518. [DOI] [PubMed] [Google Scholar]
- 45.Inoki K, Li Y, Zhu T, Wu J, Guan KL. TSC2 is phosphorylated and inhibited by Akt and suppresses mTOR signaling. Nat Cell Biol. 2002;4:648–57. doi: 10.1038/ncb839. [DOI] [PubMed] [Google Scholar]
- 46.Soucek T, Yeung RS, Hengstschlager M. Inactivation of the cyclin-dependent kinase inhibitor p27 upon loss of the tuberous sclerosis complex gene-2. Proc Natl Acad Sci USA. 1998;95:5653–58. doi: 10.1073/pnas.95.26.15653. [DOI] [PMC free article] [PubMed] [Google Scholar]
- 47.Dufner A, Thomas G. Ribosomal S6 kinase signaling and the control of translation. Exp Cell Res. 1999;253:100–9. doi: 10.1006/excr.1999.4683. [DOI] [PubMed] [Google Scholar]
- 48.Pullen N, Thomas G. The modular phosphorylation and activation of p70s6k. FEBS Lett. 1997;410:78–82. doi: 10.1016/s0014-5793(97)00323-2. [DOI] [PubMed] [Google Scholar]
- 49.Weng QP, Andrabi K, Klippel A, Kozlowski MT, Williams LT, Avruch J. Phosphatidylinositol 3-kinase signals activation of p70 S6 kinase in situ though site-specific p70 phosphorylation. Proc Natl Acad Sci USA. 1995;92:5744–8. doi: 10.1073/pnas.92.12.5744. [DOI] [PMC free article] [PubMed] [Google Scholar]
- 50.Pullen N, Dennis PB, Andjelkovic M, Dufner A, Kozma SC, Hemmings BA, Thomas G. Phosphorylation and activation of p70s6k by PDK1. Science. 1998;279:707–10. doi: 10.1126/science.279.5351.707. [DOI] [PubMed] [Google Scholar]
- 51.DeBenedetti A, Rhoads RE. Over expression of eukaryotic protein synthesis initiation factor 4E in HeLa cells results in aberrant growth and morphology. Proc Natl Acad Sci USA. 1990;87:8212–6. doi: 10.1073/pnas.87.21.8212. [DOI] [PMC free article] [PubMed] [Google Scholar]
- 52.Gingras AC, Kennedy SG, O’Leary A, Sonenberg N, Hay N. 4E-BP1, a repressor of mRNA translation, is phosphorylated and inactivated by the Akt (PKB) signaling pathway. Genes Dev. 1998;12:502–13. doi: 10.1101/gad.12.4.502. [DOI] [PMC free article] [PubMed] [Google Scholar]
- 53.Pause A, Belsham GJ, Gingras AC, Donze O, Lin TA, Lawrence JC, Jr, Sonenberg N. Insulin-dependent stimulation of protein synthesis by phosphorylation of a regulator of 5′-cap function. Nature. 1994;371:762–7. doi: 10.1038/371762a0. [DOI] [PubMed] [Google Scholar]
- 54.Gingras AC, Gygi SP, Raught B, Polakiewicz RD, Abraham RT, Hoekstra MF, Aebersold R, Sonenberg N. Regulation of 4E-BP1 phosphorylation: a novel two-step mechanism. Genes Dev. 1999;13:1422–37. doi: 10.1101/gad.13.11.1422. [DOI] [PMC free article] [PubMed] [Google Scholar]
- 55.Baker AF, Dragovich T, Ihle NT, Williams R, Fenoglio-Preiser C, Powis G. Stability of phosphoprotein as a biological marker of tumor signaling. Clinical Cancer Research. 2005;11:4338–40. doi: 10.1158/1078-0432.CCR-05-0422. [DOI] [PubMed] [Google Scholar]
- 56.Kops GJ, Burgering BM. Forkhead transcription factors: new insights into protein kinase B (c-akt) signaling. J Mol Med. 1999;77:656–65. doi: 10.1007/s001099900050. [DOI] [PubMed] [Google Scholar]
- 57.Yang L, Dan HC, Sun M, Liu Q, Sun XM, Feldman RL, Hamilton AD, Polokoff M, Nicosia SV, Herlyn M, Sebti SM, Cheng JQ. Akt/protein kinase B signaling inhibitor-2, a selective small molecule inhibitor of Akt signaling with antitumor activity in cancer cells overexpressing Akt. Cancer Res. 2004;64:4394–9. doi: 10.1158/0008-5472.CAN-04-0343. [DOI] [PubMed] [Google Scholar]
- 58.Barnett SF, DeFeo-Jones D, Fu S, Hancock PJ, Haskell KM, Jones RE, Kahana JA, Kral AM, Leander K, Lee LL, Malinowski J, McAvoy EM, Nahas DD, Robinson RG, Huber HE. Identification and characterization of pleckstrin-homology-domain-dependent and isoenzyme-specific Akt inhibitors. Biochem J. 2005;385:399–408. doi: 10.1042/BJ20041140. [DOI] [PMC free article] [PubMed] [Google Scholar]
- 59.DeFeo-Jones D, Barnett SF, Fu S, Hancock PJ, Haskell KM, Leander KR, McAvoy E, Robinson RG, Duggan ME, Lindsley CW, Zhao Z, Huber HE, Jones RE. Tumor cell sensitization to apoptotic stimuli by selective inhibition of specific Akt/PKB family members. Mol Cancer Ther. 2005;4:271–9. [PubMed] [Google Scholar]
- 60.Luo Y, Shoemaker AR, Liu X, Woods KW, Thomas SA, de Jong R, Han EK, Li T, Stoll VS, Powlas JA, Oleksijew A, Mitten MJ, Shi Y, Guan R, McGonigal TP, Klinghofer V, Johnson EF, Leverson JD, Bouska JJ, Mamo M, Smith RA, Gramling-Evans EE, Zinker BA, Mika AK, Nguyen PT, Oltersdorf T, Rosenberg SH, Li Q, Giranda VL. Potent and selective inhibitors of Akt kinases slow the progress of tumors in vivo. Mol Cancer Ther. 2005;4:977–86. doi: 10.1158/1535-7163.MCT-05-0005. [DOI] [PubMed] [Google Scholar]
- 61.DiPaola RS. To arrest or not to G(2)-M Cell-cycle arrest: Commentary re: A. K. Tyagi et al. Silibinin strongly synergizes human prostate carcinoma DU145 cells to doxorubicin-induced growth inhibition, G(2)-M arrest, and apoptosis. Clin Cancer Res. 2002;8:3512–9. [PubMed] [Google Scholar]