

Abstract
Pulmonary surfactant protein A (SP-A), a heterooligomer of SP-A1 and SP-A2, is an important regulator of innate immunity of the lung. Nonsynonymous single nucleotide variants of SP-A have been linked to respiratory diseases, but the expressed repertoire of SP-A protein in human airway has not been investigated. Here, we used parallel trypsin and Glu-C digestion, followed by LC–MS/MS, to obtain sequence coverage of common SP-A variants and isoform-determining peptides. We further developed a SDS-PAGE-based, multiple reaction monitoring (GeLC-MRM) assay for enrichment and targeted quantitation of total SP-A, the SP-A2 isoform, and the Gln223 and Lys223 variants of SP-A, from as little as one milliliter of bronchoalveolar lavage fluid. This assay identified individuals with the three genotypes at the 223 position of SP-A2: homozygous major (Gln223/Gln223), homozygous minor (Lys223/Lys223), or heterozygous (Gln223/Lys223). More generally, our studies demonstrate the challenges inherent in distinguishing highly homologous, copurifying protein isoforms by MS and show the applicability of MRM mass spectrometry for identification and quantitation of nonsynonymous single nucleotide variants and other proteoforms in airway lining fluid.
Keywords: allelic variant, targeted proteomics, surfactant-associated protein, rs1965708, ionKey
Introduction
Pulmonary surfactant is a unique lipid–protein complex that lines the air–liquid interface of the bronchoalveolar compartment of the lungs.1,2 The surfactant complex has a distinctive composition of approximately 80–85% phospholipids, 5–10% neutral lipids (mostly cholesterol), and 5–10% proteins, consisting of surfactant proteins A, B, C, and D (SP-A, SP-B, SP-C, SP-D).3 The arrangement of these components at the air–liquid interface allows complex monolayers of phospholipids to form with polar head groups oriented toward the liquid phase and the hydrophobic fatty acid chains facing the air phase (lumen).3 SP-A molecular species are hetero-oligmers composed of two distinct gene products, SP-A1 and SP-A2, each with multiple allelic variants.
SP-A is an abundant hydrophilic protein constituent of surfactant that belongs to the collagen domain and C-type lectin family. SP-A is characterized by four structural domains consisting of (1) an N-terminal cysteine rich domain; (2) a collagen-like domain; (3) a coiled coil neck domain; and (4) a C-terminal Ca2+- and carbohydrate-binding domain.4 SP-A monomers undergo noncovalent trimerization by interactions of their collagen domains and their coiled-coil domains,5 and the trimers are covalently cross-linked by disulfide bonds at the N-terminal domains.6 SP-A isoforms also contain Cys residues that can cross-link monomers and trimers within the collagen-like domains.7 Upon complete oligomerization, SP-A assembles into a bouquet-like structure of six trimeric subunits (octadecamer).4,8 SP-A contributes to surfactant homeostasis by facilitating the formation of tubular myelin and participating in lipid recycling from the extracellular compartment.9 SP-A is also recognized as an important mediator of pulmonary host defense through direct binding to pathogens, glycolipids, and cell surface receptors via the carbohydrate-binding domain10−13 and collagen-like14−16 domains.
The genetics of SP-A are quite complex and are likely to function in innate immunity.17 The human SP-A1 and SP-2 genes arose from a duplication event and are separated by <40 kb on chromosome 10 and transcribed in opposite directions. The genes are in linkage disequilibrium18 and may also share cis-acting regulatory elements.19 There are also multiple splice forms of SP-A in the 5′ UTR, and additional variability in the 3′ UTR.17 Four of the SP-A1 allelic variants (6A, 6A2, 6A3, 6A4) and six SP-A2 allelic variants (1A, 1A0, 1A1, 1A2, 1A3, and 1A5) are observed with a frequency of greater than 1% in the general population.20 Single nucleotide polymorphisms of SP-A have been implicated in susceptibility to tuberculosis infection, pulmonary fibrosis, lung cancer, and high-altitude pulmonary edema.21−24
The study of SP-A variants has largely been confined to ectopic expression in human adenocarcinoma cell lines25 and transgenic mice.26,27 While many of the variants appear to adopt normal structures, several rare variants (e.g., SP-A2 G231V and F198S) are not properly secreted and undergo degradation in the endoplasmic reticulum.25 Studies of transgenic mice expressing human SP-A have further demonstrated that the 6A4 variant of SP-A1 (with Leu50 and Trp219) and the 1A3 variant of SP-A2 (with Ala91 and Lys223) are detectable in bronchoalveolar lavage fluid by Western blotting.26 Few high resolution mass spectrometry analyses have been performed on native SP-A,28 and there has been little correlation between SP-A variants and their expressed proteoforms in the human lung. Furthermore, the relative quantitation of SP-A1/SP-A2 protein is limited to the use of antibodies specific for SP-A1 versus total SP-A.29 Here, we sought to explore the capability of mass spectrometry for identification and quantitation of SP-A isoforms and common variants, and we developed a targeted mass spectrometry assay to identify individuals expressing the variants of SP-A2 at amino acid 223 (Gln223 and Lys223) in human bronchoalveolar lavage fluid.
Materials and Methods
Bronchoalveolar Lavage
Bronchoalveolar lavage (BAL) was performed using an approved Duke University Institutional Review Board protocol as previously described.30,31
SP-A Purification
SP-A was purified from BAL fluid from normal controls and asthmatic subjects using calcium chloride precipitation and differential centrifugation as previously described.31,32 SP-A from pulmonary alveolar proteinosis patients (APP-SPA) was purified by differential centrifugation and extraction with 1-butanol, followed by affinity chromatography on mannose sepharose as previously described.33,34 Recombinant SP-A was expressed in Freestyle HEK-293 cells. Culture supernatants were concentrated by 75% ammonium sulfate precipitation followed by dialysis. The protein was further purified by affinity chromatography.33
SP-A Genotyping
Genomic DNA was extracted from whole blood using a PAXgene Blood DNA Kit (Qiagen). The region of exon 6 containing nucleotide 3625 of SP-A2 was amplified by PCR and sequenced as previously described.24
LC–MS/MS
Purified proteins and BAL fluids were concentrated using an Amicon Ultra 10K filters. Up to 2 μg of SP-A was separated by 4–12% Bis-Tris NuPAGE (Invitrogen) followed by staining with Colloidal Blue stain (Invitrogen). Bands corresponding to SP-A monomer were excised followed by in-gel digestion with Sequencing grade Modified Trypsin (Promega) as previously described.35 After in-gel digestions, peptides were lyophilized and reconstituted in ∼10 μL of 1% (v/v) trifluoroacetic acid (TFA) and 2% acetonitrile (ACN). For in-solution digestion, SP-A was diluted in 50 mM ammonium bicarbonate, pH 8.0 (AmBic) containing 0.2% Rapigest SF (Waters) and 10 mM DTT and heated at 80 °C for 10 min followed by alkylation with 20 mM iodoacetamide for 30 min at room temp in the dark. Proteins were digested with 1:50 (w/w) trypsin:substrate, or 1:50 (w/w) Sequencing grade Glu-C (Promega):substrate in the presence of 0.5 mM Glu-Glu, at 37 °C overnight. Digestions were followed by addition of 1% TFA and 2% ACN and heating at 60 °C for 2 h to hydrolyze the Rapigest. After centrifugation, digests were transferred to Maximum Recovery LC Vials (Waters).
One-dimensional liquid chromatography tandem mass spectrometry (1D-LC–MS/MS) was performed using a Waters nanoAcquity UPLC and Waters G1 HDMS or G2 HDMS operating in data-dependent acquisition mode as previously described. Fifty nanograms of peptide digests were trapped on a 20 μm × 180 mm Symmetry C18 column (Waters) at 20 μL/min for 2 min in 0.1% aqueous formic acid (FA) followed by separation on a 75 μm × 250 mm column with 1.7 μm C18 bridged ethane-silicone hybrid (BEH) particles (Waters) using a gradient of 5–40% ACN/0.1% FA over 30 min, a flow rate of 0.4 μL/min, and a column temp of 45 °C. Samples were analyzed in data-dependent (DDA) mode using a 0.9 s precursor scan (Synapt G1) or a 0.6 s precursor scan (Synapt G2), followed by MS/MS product ion scans on the top three most intense ions using a dynamic exclusion window of 120 s.
Two-dimensional-LC–MS/MS (2D-LC–MS/MS) utilized a Waters nanoAcquity with 2D Technology UPLC. Five microliters of peptides recovered by in-gel digestion was trapped at 2 μL/min at 97/3 (v/v) water/ACN in 20 mM ammonium formate (pH 10) on a 5 μm XBridge BEH130 C18 300 μm × 50 mm column (Waters). Peptides were eluted from the first dimension with 10.8%, 14.0%, 16.7%, 20.4%, and 50.0% ACN at 2 μL/min, diluted 10-fold online with 99.8/0.1/0.1 (v/v/v) H2O/ACN/FA and trapped on a 5 μm Symmetry C18 180 μm × 20 mm trapping column (Waters). Second dimension separations were performed on a 1.7 μm Acquity BEH130 C18 75 μm × 150 mm column (Waters) using a linear gradient of 7 to 35% ACN with 0.1% FA over 37 min, at a flow rate of 0.5 μL/min and column temperature of 35 °C. MS data collection was performed using a Synapt G2 in DDA mode as described above.
MS/MS data were processed using Mascot Distiller v.2.2 (Matrix Science) and searched using Mascot v.2.2 against a Swiss-Prot database with Homo sapiens taxonomy (downloaded on 10/30/2010; 20,259 entries) with additional SP-A variants 6A, 6A2, 6A4, 1A, 1A0, and 1A1).20 The database also contained an equal number of reversed-sequence “decoy” entries for false discovery rate determination. Database searches used fixed modification on Cys (carbamidomethyl) and variable modifications on Met (oxidation) and Asn/Gln (deamidation) and Pro (hydroxyl). Searches allowed for up to two missed trypsin cleavages and up to five missed cleavages with Glu-C specificity. MS/MS data were visualized using Scaffold (Proteome Software) and annotated at a 1% peptide/protein FDR.
Stable Isotope-Labeled Peptides
SpikeTides TQL peptides, containing 15N- and 13C-labeled Lys or Arg and carbamidomethyl Cys (C*), were purchased from JPT (Berlin, Germany) with the following sequences: HQILQTR, GALSLQGSIMTVGEK, EQC*VEMYTDGQWNDR and C*VEMYTDGQWNDR. One nmole of each peptide was resuspended by heating in 50 μL of 20% (v/v) acetonitrile:AmBic at 50 °C for 45 min. A total of 12.5 μL of each peptide was mixed and diluted to 250 μL with AmBic followed by addition of 200 ng trypsin and was digested overnight at 37 °C to remove the TQL tag. Following digestion, formic acid was added to 1%, and the peptides were stored at −80 °C.
Sample Preparation for GeLC-MRM Analysis
One milliliter of BAL fluid per sample was concentrated as described above followed by Bradford assay. The entirety of each sample (30–50 μg) was separated by SDS-PAGE alongside 2 μg of purified SP-A. After staining, the region corresponding to SP-A monomer was digested as described above. Peptides were resuspended in 10 μL of 1%TFA/2%ACN containing 50 ng/μL of trypsin-digested, immunodepleted human plasma, and 50 fmol/μL of SIL peptides.
Initial MRM Method Generation and Data Analysis Using Skyline
The trypsinized SIL peptide mixture (50 fmol/peptide) was analyzed on a Synapt G1, and the raw data were searched using Mascot, as described above. The resulting MS/MS spectral data (.dat format) were used to build a spectral library in Skyline.36 Default Skyline peptide and transition settings were used except for the following transition setting: monoisotopic mass and the following peptide settings: structural modifications, carbamidomethyl Cys, and isotope modifications, label: 13C615N4–Arg and label: 13C615N2-Lys. The FASTA sequences corresponding to SP-A1(6A) and SP-A2(1A1) were imported, and precursor charge states and transitions were selected based on matches to the spectral library generated from Mascot search results (Table 1). An initial unscheduled method was exported from Skyline using a default Waters collision energy profile. After a peptide retention time was established, a scheduled method was exported with a 4 min retention time window for each peptide.
Table 1. MRM Assays Used in This Studya.
| peptide type | peptide sequence | charge | transitions |
|---|---|---|---|
| Pan-SPA | HQILQTR | 2+ | y4, y5, y6 |
| GALSLQGSIMTVGEK | 2+ | y5, y9 | |
| Q223-specific | EQCVEMYTDGQWNDR | 2+ | y6, y8, y9 |
| K223-specific | CVEMYTDGQWNDR | 2+ | y6, y8, y9 |
| SP-A2-specific | GDPGPPGPMGPPGETPCPPGNNGLPGAPGVPGER | 3+ | y10, y11, y12 |
| GDPGPPGPMGPPGETPCPPGNNGLPGAPGVPGER | 3+ | y10, y11, y12 | |
| GDPGPPGPMGPPGETPCPPGNNGLPGAPGVPGER | 3+ | y10, y11, y12 | |
| GDPGPPGPMGPPGETPCPPGNNGLPGAPGVPGER | 3+ | y10, y11, y12 | |
| GDPGPPGPMGPPGETPCPPGNNGLPGAPGVPGER | 3+ | y10, y11, y12 | |
| GDPGPPGPMGPPGETPCPPGNNGLPGAPGVPGER | 3+ | y10, y11, y12 | |
| GDPGPPGPMGPPGETPCPPGNNGLPGAPGVPGER | 3+ | y10, y11, y12 | |
| GDPGPPGPMGPPGETPCPPGNNGLPGAPGVPGER | 3+ | y10, y11, y12 | |
| GDPGPPGPMGPPGETPCPPGNNGLPGAPGVPGER | 3+ | y10, y11, y12 | |
| GDPGPPGPMGPPGETPCPPGNNGLPGAPGVPGER | 3+ | y10, y11, y12 |
C = carbamidomethylCys; P = hydroxyPro.
Initial MRM Analysis
Initial method development and was performed using a nanoAcquity UPLC coupled via electrospray ionization to a Xevo TQ mass spectrometer (Waters Corporation). Briefly, 1 μL of each sample was injected directly onto a 150 μm × 100 mm 1.7 μm Acquity BEH130 C18 column (Waters) using a 23 min gradient of 3–40% MeCN at a flow rate of 1.8 μL/min with a column temperature of 35 °C. Data were analyzed using Skyline.36
Secondary (Validation) MRM Method Generation and Data Analysis Using Skyline
A modified Skyline file contained the settings as described above with the following modifications to the peptide settings: structural modifications, hydroxyP; and max variable mods, 7. Additional peptides corresponding to the modified forms of the SP-A2-specific peptide, GDPGPPGPMGPPGETPCPPGNNGLPGAPGVPGER, and product ions, were selected as shown in Table 1. Methods were exported with a modified Waters collision energy profile for 3+ charge ions: slope, 0.0359 and y-intercept, −2.042.
Secondary (Validation) MRM Analysis
Analysis of a second cohort of n = 8 was performed using a Waters ionKey/MS system including a NanoAcquity M-Class UPLC and an IonKey source containing a 150 μm × 100 mm, 1.7 μm BEH130 C18, iKey separation device interfaced to a Xevo TQ-S mass spectrometer (Waters Corporation). Briefly, 1 μL of each sample was injected directly onto the iKey and separated using a 23 min gradient of 3–40% MeCN at a flow rate of 3.0 μL/min with a column temperature of 35 °C. Data was analyzed using Skyline.
Results
Bottom-Up Identification of SP-A Isoforms and Amino Acid Variants
To determine whether mass spectrometry could be used for identification and quantitation of common SP-A variants and of the SP-A1 and SP-A2 isoforms (Figure 1A), we first separated several different proteins (SP-A from normal control and alveolar proteinosis patients (APP); and recombinant Lys223 SP-A2) by SDS-PAGE, and the band containing the SP-A monomer was digested with trypsin and analyzed by LC–MS/MS. This GeLC–MS/MS analysis was sufficient to sequence most of the invariant regions of SP-A, and among known variable sites, afforded sequence coverage of the tryptic peptide containing Gln223 (Figure 1A), which is shared between major variants of SP-A1 and SP-A2, as well as the peptide formed by cleavage after Lys223, which is found in the 1A1 and 1A3 variants of SP-A2.20 In native SP-A preparations, we identified the peptide spanning Thr66, Asn73, Val81, and Arg85, which is specific to SP-A2; however, the corresponding SP-A1-specific peptide spanning Met66, Glu73, Ile81, and Cys85 was not identified. Sequence coverage was also lacking for the regions containing positions 50 (Leu or Val), 91 (Ala or Pro), or 219 (Arg or Trp). The predicted tryptic peptides containing positions 50, 91, and 219 of SP-A are small (4–6-mers), which likely explains why they were not identified.
Figure 1.

Summary of LC–MS/MS sequencing of SP-A. (A) A multiple sequence alignment of SP-A1 and SP-A2 isoforms was performed, with common variants (>1% of the population) vertically juxtaposed (see Figure S1 for complete alignment). Sequence coverage of tryptic peptides (no missed cleavages) from GeLC–MS/MS analysis of SP-A are indicated as follows: solid lines indicate peptides that are common to all SP-A isoforms and variants; dashed lines indicate variant- or isoform-determining peptides. (B) Seven additional SP-A preparations, including native APP and SP-A purified from two human asthmatics, and recombinant Leu50/Trp219 SP-A1 and Val50/Arg219 SP-A1, were digested in solution in parallel using either trypsin or Glu-C. Additional variant- or isoform-determining peptides that were identified by this method versus in-gel trypsin digestion in (A) are shown.
We explored whether additional digestion conditions might improve coverage of variable regions. In-gel digestion of SP-A with Glu-C gave poor sequence coverage (data not shown); thus, an additional five native SP-A preparations, as well as two recombinant purified SP-A1 variants, were digested in solution, separately with trypsin or Glu-C, and analyzed by LC–MS/MS (Supporting Information). These 14 analyses gave sequence coverage for all of the major variable sites of SP-A1 and SP-A2, including all possible amino acids at positions 50, 91, 219, and 223, as well as the SP-A1- and SP-A2-specific amino acids at positions 65, 73, 81, and 85 (Figure 1B). However, the peptides containing Pro91, Arg219, or Gln223 could not be assigned to a specific isoform. Except for the Trp219 peptide, all of the variant- or isoform-determining peptides identified solely by in solution digestion contained missed cleavages (Figure 1B). Thus, the identification of these sites may be highly variable based on digestion conditions.
MRM-Based Quantitation of Total SP-A and Identification of 223-Site Variants
We wondered whether targeted, quantative MS could definitively determine SP-A genotype at any of the variable regions, either as a means of de novo “proteotyping” of SP-A variants or to validate the expression of protein-coding variants in genotyped human subjects. None of the variant-determining peptides met ideal criteria for targeted proteomics:37,38 all contained either missed cleavages, oxidizable (Met and Cys) residues or variable prolyl hydroxylation (Supporting Information). Nonetheless, we focused on the 223 position, since these peptides could be readily detected by in-gel or in-solution trypsinization without missed cleavages. Notably, Lys223 (rs1965708) has been shown to predispose individuals to high altitude pulmonary edema,24 respiratory syncytial virus infection,39 meningococcal disease40 and allergic rhinitis.41 This minor variant of SP-A2 is heterozygously expressed in ∼30% of the population, whereas only ∼5% are homozygous for Lys at the 223 position of SP-A2.42,43 Although the tryptic peptides derived from Gln223 and Lys223 variant proteins (222EQCVEMYTDGQWDNR236 and 224CVEMYTDGQWDNR236, respectively) can be distinguished by mass and retention time, they have identical y-series product ions that can be used for quantitation (Figure 2). We developed an MRM assay using stable-isotope labeled forms of these peptides as well as 116HQILQTR122 and 23GALSLQGSIMTVGEK137, which are conserved across all SP-A isoforms and variants (Table 1). During method optimization using SIL peptides, we found that direct injection of the peptides onto the LC column (i.e., bypassing the trapping step) reduced chromatographic peak width, improved peak shape, and greatly improved the sensitivity of the most hydrophilic peptide (HQILQTR). Consequently, the targeted LC–MS/MS method utilized direct injection.
Figure 2.

MS/MS spectra of 223 variant-determining peptides. MS/MS spectra were aligned for the doubly charged tryptic peptides, (A) EQCVEMYTDGQWNDR and (B) CVEMYTDGQWNDR, which are site-determining for SP-A variants with Gln223 and Lys223, respectively. Identified b-series (red) and y-series (blue) ions are labeled.
We first tried to perform the MRM assay on unfractionated BAL fluid, but we were unable to detect the 223 variant peptides (data not shown). Depth of coverage can be improved by immunodepletion of abundant plasma proteins44 but this method is tedious. We hypothesized that an SDS-PAGE separation might yield sufficient enrichment of SP-A from BALF for targeted quantitation. To test this enrichment strategy, 1 mL of BALF each from two different individuals was concentrated by centrifugal filtration, and the entirety of recovered protein (∼50 μg) was separated by SDS-PAGE alongside purified SP-A. The region corresponding to SP-A monomer was excised from the BALF lanes (not shown), and in-gel digests were analyzed by two-dimensional reversed-phase reversed-phase LC–MS/MS (Supplemental Scaffold Data, Supporting Information). Across the two analyses, 76 proteins were identified, with 73 being common to both samples. On the basis of number of identified spectra, SP-A was the second most abundant protein in each of these digests, demonstrating that SP-A can be easily enriched from a small volume of BALF by gel-based separation. To achieve the most quantitative recovery and aid the sample stability of SP-A for analysis, we added 50 ng of digested, immunodepleted human plasma protein during the final reconstitution of the in-gel digests prior to transfer to glass sample vials as a means of reducing peptide loss due to adsorption. We also confirmed that this exogenously added protein digest did not contain any detectable native SP-A peptides by MRM (data not shown).
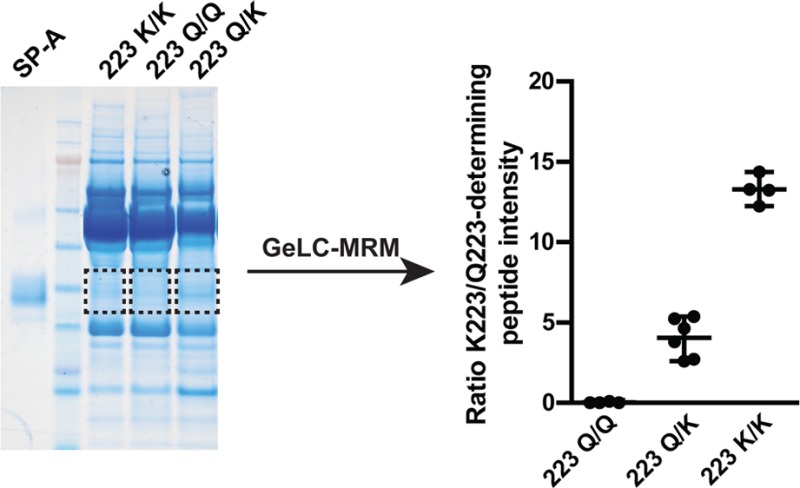
To test this optimized GeLC-MRM assay, we analyzed 1 mL of BALF from seven normal subjects that had been genotyped at the SP-A2 locus (Figure 3A). The cohort was selected to contain samples from three individuals who were homozygous for the major SP-A2 genotype (Gln223/Gln223), three who were homozygous for the minor SP-A2 genotype (Lys223/Lys223), and two who were heterozygous for these two SP-A2 genotypes (Gln223/Lys223). From 1 mL of BALF, between 30 and 50 μg of protein was recovered per sample and separated by SDS-PAGE (Figure 3A). Following in-gel digestion and reconstitution of digests, samples were analyzed in duplicate to assess analytical reproducibility. Because of the high degree of enrichment of SP-A in these samples, the levels of native peptides were as much as 10-fold higher than SIL peptides, which were added at 50 fmol per injection (Supporting Information; Panorama). To evaluate carryover, blank samples were also analyzed immediately following two of the replicate injections. No carryover of native peptides was observed in the blank injections (Supporting Information; Panorama).
Figure 3.

MRM-based quantitation of Gln223 and Lys223 variants of SP-A from human bronchoalveolar lavage fluid. (A) Two micrograms of native purified SP-A and 30–50 μg of human BAL protein (concentrated from 1 mL of BAL fluid) were separated by SDS-PAGE and stained with colloidal Coomassie. The approximate size of gel bands that were excised for quantitation of SP-A from BAL fluid samples is shown by the dashed rectangle. (B) Total SP-A (per injection) was calculated based on light\heavy ratios of the HQILQTR peptide, where the SIL peptide was added at 50 fmol/injection volume (50 fmol/μL). (C) The intensities of native EQCVEMYTDGQWNDR and CVEMYTDGQWNDR peptides (sum of y6, y8, and y9 transitions) in each sample were normalized to total SP-A in (B). (D) Ratio of CVEM/EQCVEM peptide intensities were grouped by 223 genotype. Data in (B) and (C) are mean ± range (n = 2 replicates per sample). Data points in (D) are individual measurements (n = 4–6 per group) and horizontal lines show mean and range of values.
Of the two peptides targeting total SP-A, the HQILQTR peptide had higher technical reproducibility (%CVs of <10% for both SIL and native forms based on n = 4 replicate injections of a single sample) and much lower limit of quantitation than the GALSLQGSIMTVGEK peptide. Therefore, we used the HQILQTR for single-point estimation of total SP-A quantity extracted from the gel bands. When normalized to the SIL peptide standard, total levels of SP-A were very similar across samples, except for one which had roughly twice as much protein (Figure 3B). We used the levels of total protein, as measured by the HQILQTR peptide intensity, to normalize levels of the Gln223- and Lys223-determining peptides quantified from each of the seven subjects. The Lys223-derived peptide was reduced approximately 50% in Lys223/Gln223 versus Lys223/Lys223 subjects and was absent from the Gln223 homozygotes (Figure 3C). Because it is shared with SP-A1, the Gln223-containing peptide was quantified in all samples; however, its levels did appear to be highest in the Gln223 homozygotes (Figure 3C). To try to devise a quantitative method for de novo identification of genotypes, we again compared the ratio of the intensity of Lys223- versus Gln223-derived peptides in these genotyped samples (Figure 3D): Gln223 homozygotes had a ratio of 0, whereas Lys223/Gln223-SPA2 heterozygotes had ratios between 2 and 5, and Lys223/Lys223-SPA2 homozygotes had ratios of >10. Notably, these groups do not overlap, consistent with the binary nature of the three genotypes. In addition, as this measurement is based on a ratio of two peptides, this calculation is independent of absolute protein amount and does not require normalization to the HQILQTR peptide. Collectively, these data suggest that the GeLC-MRM assay can identify the three genotypes of SP-A2 at the 223 position with high sensitivity and specificity.
MRM-Based Quantitation of SP-A2 and Its Use in Identification of SP-A2 223 Genotype
The relative amounts of SP-A1 and SP-A2 levels (versus total SP-A) have been shown to change with age and in disease,29,31 whereas our samples were obtained from normal controls between 18 and 35 years.30 Since the Gln223 peptide is shared with SP-A1, a change in the relative levels of SP-A1 versus SP-A2 might skew our assay when implemented across a heterogeneous cohort. We hypothesized that this variation could be controlled for by ratioing the Lys223-derived peptide to a pan-SPA-2-specific peptide. There is only a single tryptic peptide, 52GDPGPPGPMGPPGETPCPPGNNGLPGAPGVPGER85, that is unique to all variants of SP-A2. In addition to having a carbamidomethylated Cys due to reduction/alkylation, the observed forms of this peptide had ±1 oxidized Met, ± 1 deamidated Asn and up to five hydroxylated Pro residues (Supplemental Scaffold Data, Supporting Information). Without proper site localization for many of the sites of Pro hydroxylation and Asn deamidation, we calculated that there could be >40 possible forms of these modified peptides. On the other hand, we reasoned that the quantitation of these forms could be greatly simplified, since (1) all of the modified forms of the peptides had a similar retention time; (2) the nondeamidated forms and deamidated forms of the triply charged peptide would be indistinguishable at the resolution of the triple quadrupole MS; (3) Met oxidation and Pro hydroxylation give the same mass shift; and (4) three of the most intense y-ions (y10, y11, and y12) exist only in two possible forms, with either two or three hydroxyPro modifications (Table 1). We designed a simplified targeted assay to quantify the y10, y11, and y12 product ions for peptides having either two or three C-terminal hydroxyPro modifications, and up to four additional hydroxylations/oxidations N-terminal to the site of y12 fragmentation (10 precursor masses; Table 1). These targets were appended to our original targeted assay.
To validate this modified MRM assay, we performed an additional analysis using 1 mL of BALF from n = 4 individuals having the Gln223/Lys223 SP-A2 genotype and n = 4 individuals with the Lys223/Lys223 SP-A2 genotype. Only one of the subjects (a Lys223 homozygous) was shared with the previous analysis. Note that we did not include any Gln223/Gln223 homozygotes since these individuals are readily identified by the absence of a Lys223-derived peptide (Figure 3). After SDS-PAGE and in-gel digestion based on the migration of APP SP-A (Figure 4A), we analyzed tryptic digests using a Waters ionKey and a Xevo TQ-S MS. Improvements in chromatographic peak shape and sensitivity were observed (Supporting Information; Panorama). As shown in our earlier study (Figure 3), we found a clear distinction between genotypes based on the ratio of the two peptides covering the 223 variant region (Figure 4B), thus translating the assay between the two instrument platforms. Although the absolute ratios were ∼1/2 of the values that were observed in the initial analysis, this could easily be explained by differences in ion suppression or ionization efficiency between the two LC–MS systems. Importantly, this would be controlled for in any clinical translation of the assay by using protein standards.
Figure 4.

Validation of MRM assay for quantitation of Lys223/Lys223 and Gln223/Lys223 SP-A2 genotypes. (A) 2.5 μg of APP SP-A and 30 μg of concentrated human BAL protein were separated by SDS-PAGE followed by in-gel trypsin digestion as in Figure 3. An example of the excised region of the gel is indicated by the rectangle. (B) The ratio of native CVEMYTDGQWNDR/EQCVEMYTDGQWNDR peptide intensities (sum of y8 and y9 product ions) were plotted as a function of 223 genotype as in panel C. (C) Chromatograms (sum of y10, y11, and y12 transitions) from the quantitation of 10 forms of the GDPGPPGPMGPPGETPCPPGNNGLPGAPGVPGER peptide were overlaid. (D) The GDPGPPGPMGPPGETPCPPGNNGLPGAPGVPGER peptide intensity in each sample was normalized to total SP-A. (E) The intensity of the Lys223-specific peptide (CVEMYTDGQWNDR) was normalized to SP-A2 as determined in (D). Data in (B), (D), and (E) are individual measurements (n = 8 per group). Horizontal lines show mean ± s.e.m.
We next sought to determine whether we could quantify relative levels of SP-A2 using the hydroxylated SP-A2-specific peptides. The multiple forms of the hydroxylated SP-A2 peptide eluted over a distinct ∼3 min window, and the elution profile of most precursors had multiple peaks, consistent with mixture of hydroxylated, Met oxidized, and deamidated forms with the same precursor and product ion masses (Figure 4C). The forms of the peptide with two or three C-terminal hydroxylations, and with one N-terminal hydroxylation/oxidation eluted as doublets, suggesting that these peptides had two major chromatographically distinguishable forms (Figure 4C). The number of peaks increased with the number of variable hydroxylations/oxidations on the N-terminal segment of the peptide, consistent with the existence of multiple forms of the peptide containing the same number of isobaric modifications. However, when we summed the product ion areas from all of these species and normalized to total levels of SP-A (via peptide HQILQTR), there was no significant difference in the relative expression of SP-A2 between the Gln223/Lys223 and Lys223/Lys223 genotypes (Figure 4D). Triplicate analysis of a QC pool, performed at the beginning, middle, and end of the study, showed a mean %CV of <2% for quantitation of the hydroxylated SP-A2 peptide. Finally, we normalized the intensities of the Lys223-dervied peptide to the SP-A2 specific peptide and found that the homozygous minor and heterozygous genotypes were nonoverlapping (Figure 4E). Importantly, this provides an additional method for identifying SP-A2 223 genotypes which does not utilize the pan-SP-A Gln223 peptide.
Discussion
While a number of SP-A variants have been expressed in vitro, until now, the quantitation of nonsynonymous variants of SP-A in vivo has only been possible at the mRNA level. Here, we established, for the first time, a facile assay for targeted quantitation of allelic variants at position 223 of SP-A, as well as relative levels of SP-A2 versus total SP-A, using as little as 1 mL of bronchoalveolar lavage fluid. While there was no significant difference in relative SP-A2 as a function of 223 genotype, there was a slight trend toward lower SP-A2 levels versus total SP-A in the Lys223/Lys223 versus Gln223/Lys223 genotype. An analysis of a much larger cohort will be necessary to determine whether SP-A2 variants at the 223 position are expressed at significantly different levels in airway lining fluid. However, it should further be noted that the Lys223 variant is shared between two alleles of SP-A2, 1A1, and 1A3, that are found in >1% of the population. The proteins encoded by these genes differ only at amino acid position 9,45 which is in the signal sequence and was not observed in any of our analyses of purified SP-A. Thus, additional genotyping at this SNP (rs1059046) would be required to fully correlate SP-A2 and Lys223 variant levels with a specific allelic variant.
Large-scale MRM assays employing proteoypic and “best flier” peptides have now been implemented in numerous biological systems.38,46,47 In the present study, the SP-A variant peptides had peak areas that are 100–1000-fold less abundant than the HQILQTR peptide used to quantify total SP-A. Thus, while MRM assays targeting best fliers may have the requisite sensitivity for targeted protein quantitation across a large dynamic range in unfractionated biofluids, targeted quantitation of variant peptides may require additional fractionation, such as the GeLC-MRM approach, to achieve adequate sensitivity. With the challenges inherent in online separation of biofluid proteomes, which can be comprised of 50–90% (w/w) albumin, GeLC-MRM presents a solution for improving depth of coverage.48 The technique has also been successfully employed for targeted quantitation of oncogenic K-Ras mutants in cancer cells and in tumor-derived fluids.49 GeLC-MRM might not be feasible for quantitation of a target biofluid protein that has similar molecular weight as albumin, or for targeted quantitation of proteins across a broad MW range; in those cases, immunodepletion of abundant plasma proteins may be a viable alternative.50 On the basis of our experience, gel-based fractionation can have a lower per-sample cost than immunodepletion and provides equal or better scalability. This exclusion of high abundances proteins by gel-based fractionation minimizes potential interfering ions and/or ion suppression, therefore increasing the robustness of the assay. Selection of the appropriate gel migration location only requires a suitable protein standard or sufficient knowledge of the electrophoretic mobility of the target protein.
MRM has been applied to quantitation of coding variants of only a handful of proteins (K-Ras, apoliprotein E, SP-A), but the potential complexity of such analyses is already apparent. For example, although targeted proteomics can be used to quantify apolipoprotein E2 (ApoE2) and E4 (ApoE4) on the basis of single variant peptides (containing Cys158 and Arg112, respectively),51,52 the variant sites that are found in ApoE3 (Cys112 and Arg158) are shared with ApoE2 and ApoE4, respectively, making the specific quantitation of ApoE3 a technical challenge. Here, the quantitation of allelic variants of SP-A is further complicated by the presence of up to four copies of each peptide (two each from SP-A1 and SP-A2). In the case of SP-A, we can easily identify the Gln223/Gln223 homozygote based on the absence of the native Lys223 peptide, but the interference from two copies of the copurifying SP-A1-derived Gln223 peptide presents a unique problem for distinguishing the Gln223/Lys223 and Gln223/Gln223 alleles of SP-A2. In a relatively homogeneous population, the ratio of the Lys223-derived:Gln223-derived peptide intensities are likely to suffice as a means of identifying the three SP-A2 genotypes, although a set of well-genotyped standards will be essential to transferring the method across instrument platforms and/or laboratories. The additional quantitation of a peptide specific to all common variants of SP-A2 enables relative quantitation of this isoform for the first time, as well as normalization of the Lys223-dervied peptide to total SP-A2. This avoids any potential pitfall in the assay resulting from large variation in total SP-A1:SP-A2 protein ratios that could skew stratification of SP-A2 223 genotype based on the ratio of Lys223- and Gln223-derived peptides.
In addition to SP-A, amino acid variants of other airway lining fluid-expressed proteins, including SP-D53,54 and IL-13,55,56 have been implicated in pulmonary disease. The need to understand the implications of protein-coding, nonsynonymous single nucleotide variants (nsSNVs), in the lung and elsewhere, will only grow with the increasing application of large-scale and deep coverage genomic approaches (e.g., SNP genotyping, exome sequencing, RNA-seq). Consequences of nsSNVs could include improper protein translation or processing, decreased stability or increased degradation; the presence of multiple copies of each protein necessitates the quantitation of these variants in a sequence-specific manner. Until now, mass spectrometry-based studies of nsSNVs have mostly focused on the searching of shotgun proteomic data using variant-containing databases.57−60 As this and a handful of other studies have shown,49,52,61 MRM is poised to become the preferred method for high confidence identification and quantitation of the expressed forms of proteins harboring nsSNVs.
Acknowledgments
This work was supported by grants from the National Institutes of Health (AI081672 to M.K. and W.M.F., and HL111151 to J.G.L.).
Supporting Information Available
Figure S1. Multiple sequence of alignment of SP-A isoforms used in database searching. This material is available free of charge via the Internet at http://pubs.acs.org. Electronic Files: Scaffold files containing all acquired MS/MS spectra from qualitative LC–MS/MS analyses (SPA_MSMS.sf3) and the 2D-LC analysis of the SP-A-containing gel band (SPA_Gel_2DLC.sf3) can be downloaded at https://discovery.genome.duke.edu/express/resources/2402/SPA_MSMS.sf3 and https://discovery.genome.duke.edu/express/resources/2402/SPA_Gel_2DLC.sf3 and can be viewed using the free Scaffold viewer (Proteome Software). An Excel file including but not limited to protein ID, protein MW, number of peptides, number of spectra, sequence coverage, peptide name and peptide mascot score information can be downloaded at https://discovery.genome.duke.edu/express/resources/2402/SPA_MSMS_Peptide_Report.xlsx. Skyline files and results have been made public as part of the Panorama Targeted Proteomics data repository. Data from experiments 1 and 2 can be viewed at http://goo.gl/LJEvsA and http://goo.gl/6TWTKP, respectively, or downloaded at http://goo.gl/CrtSW7 and http://goo.gl/keDndf, respectively.
The authors declare no competing financial interest.
Funding Statement
National Institutes of Health, United States
Supplementary Material
References
- Clements J. A. Surface tension of lung extracts. Proc. Soc. Exp. Biol. Med. 1957, 951170–172. [DOI] [PubMed] [Google Scholar]
- Pattle R. E. Properties, function and origin of the alveolar lining layer. Nature 1955, 17544691125–1126. [DOI] [PubMed] [Google Scholar]
- Goerke J. Pulmonary surfactant: functions and molecular composition. Biochim. Biophys. Acta 1998, 14082–379–89. [DOI] [PubMed] [Google Scholar]
- McCormack F. X. Structure, processing and properties of surfactant protein A. Biochim. Biophys. Acta 1998, 14082–3109–131. [DOI] [PubMed] [Google Scholar]
- McCormack F. X.; Damodarasamy M.; Elhalwagi B. M. Deletion mapping of N-terminal domains of surfactant protein A. The N-terminal segment is required for phospholipid aggregation and specific inhibition of surfactant secretion. J. Biol. Chem. 1999, 27453173–3181. [DOI] [PubMed] [Google Scholar]
- McCormack F. X.; Pattanajitvilai S.; Stewart J.; Possmayer F.; Inchley K.; Voelker D. R. The Cys6 intermolecular disulfide bond and the collagen-like region of rat SP-A play critical roles in interactions with alveolar type II cells and surfactant lipids. J. Biol. Chem. 1997, 2724427971–27979. [DOI] [PubMed] [Google Scholar]
- Haagsman H. P.; White R. T.; Schilling J.; Lau K.; Benson B. J.; Golden J.; Hawgood S.; Clements J. A. Studies of the structure of lung surfactant protein SP-A. Am. J. Physiol. 1989, 2576 Pt 1L421–L429. [DOI] [PubMed] [Google Scholar]
- Kishore U.; Greenhough T. J.; Waters P.; Shrive A. K.; Ghai R.; Kamran M. F.; Bernal A. L.; Reid K. B.; Madan T.; Chakraborty T. Surfactant proteins SP-A and SP-D: structure, function and receptors. Mol. Immunol. 2006, 4391293–1315. [DOI] [PubMed] [Google Scholar]
- Mason R. J.; Voelker D. R. Regulatory mechanisms of surfactant secretion. Biochim. Biophys. Acta 1998, 14082–3226–240. [DOI] [PubMed] [Google Scholar]
- Shepherd V. L. Distinct roles for lung collectins in pulmonary host defense. Am. J. Respir. Cell Mol. Biol. 2002, 263257–260. [DOI] [PubMed] [Google Scholar]
- Malhotra R.; Lu J.; Holmskov U.; Sim R. B. Collectins, collectin receptors and the lectin pathway of complement activation. Clin. Exp. Immunol. 1994, 97Suppl 24–9. [DOI] [PMC free article] [PubMed] [Google Scholar]
- Wright J. R. Immunoregulatory functions of surfactant proteins. Nat. Rev. Immunol 2005, 5158–68. [DOI] [PubMed] [Google Scholar]
- Veldhuizen E. J.; van Eijk M.; Haagsman H. P. The carbohydrate recognition domain of collectins. FEBS J. 2011, 278203930–3941. [DOI] [PubMed] [Google Scholar]
- Borron P.; McCormack F. X.; Elhalwagi B. M.; Chroneos Z. C.; Lewis J. F.; Zhu S.; Wright J. R.; Shepherd V. L.; Possmayer F.; Inchley K.; Fraher L. J. Surfactant protein A inhibits T cell proliferation via its collagen-like tail and a 210-kDa receptor. Am. J. Physiol. 1998, 2754 Pt 1L679–L686. [DOI] [PubMed] [Google Scholar]
- Beharka A. A.; Gaynor C. D.; Kang B. K.; Voelker D. R.; McCormack F. X.; Schlesinger L. S. Pulmonary surfactant protein A up-regulates activity of the mannose receptor, a pattern recognition receptor expressed on human macrophages. J. Immunol. 2002, 16973565–3573. [DOI] [PubMed] [Google Scholar]
- Ketko A. K.; Lin C.; Moore B. B.; LeVine A. M. Surfactant protein A binds flagellin enhancing phagocytosis and IL-1beta production. PLoS One 2013, 812e82680. [DOI] [PMC free article] [PubMed] [Google Scholar]
- Silveyra P.; Floros J. Genetic complexity of the human surfactant-associated proteins SP-A1 and SP-A2. Gene 2013, 5312126–132. [DOI] [PMC free article] [PubMed] [Google Scholar]
- Floros J.; DiAngelo S.; Koptides M.; Karinch A. M.; Rogan P. K.; Nielsen H.; Spragg R. G.; Watterberg K.; Deiter G. Human SP-A locus: allele frequencies and linkage disequilibrium between the two surfactant protein A genes. Am. J. Respir. Cell Mol. Biol. 1996, 154489–498. [DOI] [PubMed] [Google Scholar]
- Floros J.; Hoover R. R. Genetics of the hydrophilic surfactant proteins A and D. Biochim. Biophys. Acta 1998, 14082–3312–322. [DOI] [PubMed] [Google Scholar]
- Floros J.; Fan R.; Matthews A.; DiAngelo S.; Luo J.; Nielsen H.; Dunn M.; Gewolb I. H.; Koppe J.; van Sonderen L.; Farri-Kostopoulos L.; Tzaki M.; Ramet M.; Merrill J. Family-based transmission disequilibrium test (TDT) and case-control association studies reveal surfactant protein A (SP-A) susceptibility alleles for respiratory distress syndrome (RDS) and possible race differences. Clin. Genet. 2001, 603178–187. [DOI] [PubMed] [Google Scholar]
- Floros J.; Lin H. M.; Garcia A.; Salazar M. A.; Guo X.; DiAngelo S.; Montano M.; Luo J.; Pardo A.; Selman M. Surfactant protein genetic marker alleles identify a subgroup of tuberculosis in a Mexican population. J. Infect. Dis. 2000, 18251473–1478. [DOI] [PubMed] [Google Scholar]
- Selman M.; Lin H. M.; Montano M.; Jenkins A. L.; Estrada A.; Lin Z.; Wang G.; DiAngelo S. L.; Guo X.; Umstead T. M.; Lang C. M.; Pardo A.; Phelps D. S.; Floros J. Surfactant protein A and B genetic variants predispose to idiopathic pulmonary fibrosis. Hum. Genet. 2003, 1136542–50. [DOI] [PubMed] [Google Scholar]
- Seifart C.; Lin H. M.; Seifart U.; Plagens A.; DiAngelo S.; von Wichert P.; Floros J. Rare SP-A alleles and the SP-A1–6A(4) allele associate with risk for lung carcinoma. Clin. Genet. 2005, 682128–136. [DOI] [PubMed] [Google Scholar]
- Saxena S.; Kumar R.; Madan T.; Gupta V.; Muralidhar K.; Sarma P. U. Association of polymorphisms in pulmonary surfactant protein A1 and A2 genes with high-altitude pulmonary edema. Chest 2005, 12831611–1619. [DOI] [PubMed] [Google Scholar]
- Maitra M.; Wang Y.; Gerard R. D.; Mendelson C. R.; Garcia C. K. Surfactant protein A2 mutations associated with pulmonary fibrosis lead to protein instability and endoplasmic reticulum stress. J. Biol. Chem. 2010, 2852922103–22113. [DOI] [PMC free article] [PubMed] [Google Scholar]
- Wang G.; Guo X.; Diangelo S.; Thomas N. J.; Floros J. Humanized SFTPA1 and SFTPA2 transgenic mice reveal functional divergence of SP-A1 and SP-A2: formation of tubular myelin in vivo requires both gene products. J. Biol. Chem. 2010, 2851611998–12010. [DOI] [PMC free article] [PubMed] [Google Scholar]
- Phelps D. S.; Umstead T. M.; Silveyra P.; Hu S.; Wang G.; Floros J. Differences in the alveolar macrophage proteome in transgenic mice expressing human SP-A1 and SP-A2. J. Proteom Genom Res. 2013, 122–26. [DOI] [PMC free article] [PubMed] [Google Scholar]
- Bai Y.; Galetskiy D.; Damoc E.; Paschen C.; Liu Z.; Griese M.; Liu S.; Przybylski M. High resolution mass spectrometric alveolar proteomics: identification of surfactant protein SP-A and SP-D modifications in proteinosis and cystic fibrosis patients. Proteomics 2004, 482300–2309. [DOI] [PubMed] [Google Scholar]
- Tagaram H. R.; Wang G.; Umstead T. M.; Mikerov A. N.; Thomas N. J.; Graff G. R.; Hess J. C.; Thomassen M. J.; Kavuru M. S.; Phelps D. S.; Floros J. Characterization of a human surfactant protein A1 (SP-A1) gene-specific antibody; SP-A1 content variation among individuals of varying age and pulmonary health. Am. J. Physiol. Lung Cell Mol. Physiol. 2007, 2925L1052–L1063. [DOI] [PubMed] [Google Scholar]
- Que L. G.; Stiles J. V.; Sundy J. S.; Foster W. M. Pulmonary function, bronchial reactivity, and epithelial permeability are response phenotypes to ozone and develop differentially in healthy humans. J. Appl. Physiol. 2011, 1113679–687. [DOI] [PMC free article] [PubMed] [Google Scholar]
- Wang Y.; Voelker D. R.; Lugogo N. L.; Wang G.; Floros J.; Ingram J. L.; Chu H. W.; Church T. D.; Kandasamy P.; Fertel D.; Wright J. R.; Kraft M. Surfactant protein A is defective in abrogating inflammation in asthma. Am. J. Physiol. Lung Cell Mol. Physiol. 2011, 3014L598–L606. [DOI] [PMC free article] [PubMed] [Google Scholar]
- Suwabe A.; Mason R. J.; Voelker D. R. Calcium dependent association of surfactant protein A with pulmonary surfactant: application to simple surfactant protein A purification. Arch. Biochem. Biophys. 1996, 3272285–291. [DOI] [PubMed] [Google Scholar]
- Kuroki Y.; Akino T. Pulmonary Surfactant Protein-a (Sp-a) Specifically Binds Dipalmitoylphosphatidylcholine. J. Biol. Chem. 1991, 26653068–3073. [PubMed] [Google Scholar]
- Wright J. R.; Wager R. E.; Hawgood S.; Dobbs L.; Clements J. A. Surfactant apoprotein Mr = 26,000–36,000 enhances uptake of liposomes by type II cells. J. Biol. Chem. 1987, 26262888–2894. [PubMed] [Google Scholar]
- Wilm M.; Shevchenko A.; Houthaeve T.; Breit S.; Schweigerer L.; Fotsis T.; Mann M. Femtomole sequencing of proteins from polyacrylamide gels by nano-electrospray mass spectrometry. Nature 1996, 3796564466–469. [DOI] [PubMed] [Google Scholar]
- MacLean B.; Tomazela D. M.; Shulman N.; Chambers M.; Finney G. L.; Frewen B.; Kern R.; Tabb D. L.; Liebler D. C.; MacCoss M. J. Skyline: an open source document editor for creating and analyzing targeted proteomics experiments. Bioinformatics 2010, 267966–968. [DOI] [PMC free article] [PubMed] [Google Scholar]
- Mallick P.; Schirle M.; Chen S. S.; Flory M. R.; Lee H.; Martin D.; Ranish J.; Raught B.; Schmitt R.; Werner T.; Kuster B.; Aebersold R. Computational prediction of proteotypic peptides for quantitative proteomics. Nat. Biotechnol. 2007, 251125–131. [DOI] [PubMed] [Google Scholar]
- Carr S. A.; Abbatiello S. E.; Ackermann B. L.; Borchers C.; Domon B.; Deutsch E. W.; Grant R. P.; Hoofnagle A. N.; Huttenhain R.; Koomen J. M.; Liebler D. C.; Liu T.; Maclean B.; Mani D. R.; Mansfield E.; Neubert H.; Paulovich A. G.; Reiter L.; Vitek O.; Aebersold R.; Anderson L.; Bethem R.; Blonder J.; Boja E.; Botelho J.; Boyne M.; Bradshaw R. A.; Burlingame A. L.; Chan D.; Keshishian H.; Kuhn E.; Kinsinger C.; Lee J. S.; Lee S. W.; Moritz R.; Oses-Prieto J.; Rifai N.; Ritchie J.; Rodriguez H.; Srinivas P. R.; Townsend R. R.; Van Eyk J.; Whiteley G.; Wiita A.; Weintraub S. Targeted Peptide Measurements in Biology and Medicine: Best Practices for Mass Spectrometry-based Assay Development Using a Fit-for-Purpose Approach. Mol. Cell Proteomics 2014, 13, 907–917. [DOI] [PMC free article] [PubMed] [Google Scholar]
- Lofgren J.; Ramet M.; Renko M.; Marttila R.; Hallman M. Association between surfactant protein A gene locus and severe respiratory syncytial virus infection in infants. J. Infect. Dis. 2002, 1853283–289. [DOI] [PubMed] [Google Scholar]
- Jack D. L.; Cole J.; Naylor S. C.; Borrow R.; Kaczmarski E. B.; Klein N. J.; Read R. C. Genetic polymorphism of the binding domain of surfactant protein-A2 increases susceptibility to meningococcal disease. Clin. Infect. Dis. 2006, 43111426–1433. [DOI] [PubMed] [Google Scholar]
- Deng Y.; Chen S.; Chen J.; Tao Z.; Kong Y.; Xu Y.; Xiao B.; He Q. Relationship between surfactant protein A polymorphisms and allergic rhinitis in a Chinese Han population. Mol. Biol. Rep. 2011, 3831475–1482. [DOI] [PubMed] [Google Scholar]
- Garcia-Laorden M. I.; Rodriguez de Castro F.; Sole-Violan J.; Rajas O.; Blanquer J.; Borderias L.; Aspa J.; Briones M. L.; Saavedra P.; Marcos-Ramos J. A.; Gonzalez-Quevedo N.; Sologuren I.; Herrera-Ramos E.; Ferrer J. M.; Rello J.; Rodriguez-Gallego C. Influence of genetic variability at the surfactant proteins A and D in community-acquired pneumonia: a prospective, observational, genetic study. Crit. Care 2011, 151R57. [DOI] [PMC free article] [PubMed] [Google Scholar]
- Pettigrew M. M.; Gent J. F.; Zhu Y.; Triche E. W.; Belanger K. D.; Holford T. R.; Bracken M. B.; Leaderer B. P. Respiratory symptoms among infants at risk for asthma: association with surfactant protein A haplotypes. BMC Med. Genet. 2007, 8, 15. [DOI] [PMC free article] [PubMed] [Google Scholar]
- Foster M. W.; Thompson J. W.; Que L. G.; Yang I. V.; Schwartz D. A.; Moseley M. A.; Marshall H. E. Proteomic analysis of human bronchoalveolar lavage fluid after subsgemental exposure. J. Proteome Res. 2013, 1252194–205. [DOI] [PMC free article] [PubMed] [Google Scholar]
- Floros J. Human surfactant protein A (SP-A) variants: why so many, why such a complexity?. Swiss Med. Wkly. 2001, 1317–887–90. [DOI] [PubMed] [Google Scholar]
- Picotti P.; Bodenmiller B.; Mueller L. N.; Domon B.; Aebersold R. Full dynamic range proteome analysis of S. cerevisiae by targeted proteomics. Cell 2009, 1384795–806. [DOI] [PMC free article] [PubMed] [Google Scholar]
- Ludwig C.; Claassen M.; Schmidt A.; Aebersold R. Estimation of absolute protein quantities of unlabeled samples by selected reaction monitoring mass spectrometry. Mol. Cell Proteomics 2012, 113M111 013987. [DOI] [PMC free article] [PubMed] [Google Scholar]
- Tang H. Y.; Beer L. A.; Barnhart K. T.; Speicher D. W. Rapid verification of candidate serological biomarkers using gel-based, label-free multiple reaction monitoring. J. Proteome Res. 2011, 1094005–17. [DOI] [PMC free article] [PubMed] [Google Scholar]
- Halvey P. J.; Ferrone C. R.; Liebler D. C. GeLC-MRM quantitation of mutant KRAS oncoprotein in complex biological samples. J. Proteome Res. 2012, 1173908–13. [DOI] [PMC free article] [PubMed] [Google Scholar]
- Smith M. P.; Wood S. L.; Zougman A.; Ho J. T.; Peng J.; Jackson D.; Cairns D. A.; Lewington A. J.; Selby P. J.; Banks R. E. A systematic analysis of the effects of increasing degrees of serum immunodepletion in terms of depth of coverage and other key aspects in top-down and bottom-up proteomic analyses. Proteomics 2011, 11112222–2235. [DOI] [PMC free article] [PubMed] [Google Scholar]
- Simon R.; Girod M.; Fonbonne C.; Salvador A.; Clement Y.; Lanteri P.; Amouyel P.; Lambert J. C.; Lemoine J. Total ApoE and ApoE4 isoform assays in an Alzheimer’s disease case-control study by targeted mass spectrometry (n=669): a pilot assay for methionine-containing proteotypic peptides. Mol. Cell Proteomics 2012, 11111389–403. [DOI] [PMC free article] [PubMed] [Google Scholar]
- Martinez-Morillo E.; Nielsen H. M.; Batruch I.; Drabovich A. P.; Begcevic I.; Lopez M. F.; Minthon L.; Bu G.; Mattsson N.; Portelius E.; Hansson O.; Diamandis E. P. Assessment of Peptide chemical modifications on the development of an accurate and precise multiplex selected reaction monitoring assay for apolipoprotein e isoforms. J. Proteome Res. 2014, 1321077–87. [DOI] [PubMed] [Google Scholar]
- Aramini B.; Kim C.; Diangelo S.; Petersen E.; Lederer D. J.; Shah L.; Robbins H.; Floros J.; Arcasoy S. M.; Sonett J. R.; D’Ovidio F. Donor surfactant protein D (SP-D) polymorphisms are associated with lung transplant outcome. Am. J. Transplant. 2013, 1382130–2136. [DOI] [PMC free article] [PubMed] [Google Scholar]
- Ampuero S.; Luchsinger V.; Tapia L.; Palomino M. A.; Larranaga C. E. SP-A1, SP-A2 and SP-D gene polymorphisms in severe acute respiratory syncytial infection in Chilean infants. Infect. Genet. Evol. 2011, 1161368–77. [DOI] [PubMed] [Google Scholar]
- He Y. F.; Hua L.; Bao Y. X.; Liu Q. H.; Chu Y.; Fang D. Z. IL-13 R110Q, a Naturally Occurring IL-13 Polymorphism, Confers Enhanced Functional Activity in Cultured Human Bronchial Smooth Muscle Cells. Allergy Asthma Immunol. Res. 2013, 56377–382. [DOI] [PMC free article] [PubMed] [Google Scholar]
- Utsumi Y.; Sasaki N.; Nagashima H.; Suzuki N.; Nakamura Y.; Yamashita M.; Kobayashi H.; Yamauchi K. Association of IL-13 gene polymorphisms with airway hyperresponsiveness in a Japanese adult asthmatic population. Respir. Investig. 2013, 513147–152. [DOI] [PubMed] [Google Scholar]
- Song C.; Wang F.; Cheng K.; Wei X.; Bian Y.; Wang K.; Tan Y.; Wang H.; Ye M.; Zou H. Large-Scale Quantification of Single Amino-Acid Variations by a Variation-Associated Database Search Strategy. J. Proteome Res. 2014, 13, 241–248. [DOI] [PubMed] [Google Scholar]
- Nijveen H.; Kester M. G.; Hassan C.; Viars A.; de Ru A. H.; de Jager M.; Falkenburg J. H.; Leunissen J. A.; van Veelen P. A. HSPVdb--the Human Short Peptide Variation Database for improved mass spectrometry-based detection of polymorphic HLA-ligands. Immunogenetics 2011, 633143–53. [DOI] [PMC free article] [PubMed] [Google Scholar]
- Ahn J. M.; Kim M. S.; Kim Y. I.; Jeong S. K.; Lee H. J.; Lee S. H.; Paik Y. K.; Pandey A.; Cho J. Y. Proteogenomic Analysis of Human Chromosome 9-Encoded Genes from Human Samples and Lung Cancer Tissues. J. Proteome Res. 2013, 13, 137–146. [DOI] [PMC free article] [PubMed] [Google Scholar]
- Sheynkman G. M.; Shortreed M. R.; Frey B. L.; Scalf M.; Smith L. M. Large-Scale Mass Spectrometric Detection of Variant Peptides Resulting from Nonsynonymous Nucleotide Differences. J. Proteome Res. 2013, 13, 228–240. [DOI] [PMC free article] [PubMed] [Google Scholar]
- Han S. H.; Kim J. S.; Lee Y.; Choi H.; Kim J. W.; Na D. L.; Yang E. G.; Yu M. H.; Hwang D.; Lee C.; Mook-Jung I. Both targeted mass spectrometry and flow sorting analysis methods detected the decreased serum apolipoprotein E level in Alzheimer’s disease patients. Mol. Cell Proteomics 2014, 132407–419. [DOI] [PMC free article] [PubMed] [Google Scholar]
Associated Data
This section collects any data citations, data availability statements, or supplementary materials included in this article.