

Abstract
Synchrony of phase (phase locking) of event-related oscillations (EROs) within and between different brain areas has been suggested to reflect communication exchange between neural networks and as such may be a sensitive and translational measure of changes in brain remodeling that occurs during adolescence. This study sought to investigate developmental changes in EROs using a similar auditory event-related potential (ERP) paradigm in both rats and humans. Energy and phase variability of EROs collected from 38 young adult men (age 18-25 yrs), 33 periadolescent boys (age 10-14 yrs), 15 male periadolescent rats (@ Post Natal Day (PD) 36) and 19 male adult rats (@ PD 103) were investigated. Three channels of ERP data (Frontal Cortex, FZ; Central Cortex, CZ; Parietal Cortex, PZ) were collected from the humans using an oddball plus “noise” paradigm that was presented under passive (no behavioral response required) conditions in the periadolescents and under active conditions (where each subject was instructed to depress a counter each time he detected an infrequent (target) tone) in adults and adolescents. ERPs were recorded in rats using only the passive paradigm. In order to compare the tasks used in rats to those used in humans we first studied whether three ERO measures (energy, phase locking index (within an electrode site, PLI), phase difference locking index (between different electrode sites, PDLI)) differentiated the “active” from “passive” ERP tasks. Secondly we explored our main question of whether the three ERO measures, differentiated adults from periadolescents in a similar manner in both humans and rats. No significant changes were found in measures of ERO energy between the active and passive tasks in the periadolescent human participants. There was a smaller but significant increase in PLI but not PDLI as a function of “active” task requirements. Developmental differences were found in energy, PLI and PDLI values between the periadolescents and adults in both the rats and the human participants. Neuronal synchrony as indexed by PLI and PDLI was significantly higher to the infrequent (target) tone as compared to the frequent (non-target) tone in all brain sites in all of the regions of interest (ROI) time frequency intervals. Significantly higher ERO energy and significantly lower synchrony was seen in the periadolescent humans and rats as compared to their adult counterparts. Taken together these findings are consistent with the hypothesis that adolescent remodeling of the brain includes decreases in energy and increases in synchrony over a wide frequency range both within and between neuronal networks and that these effects are conserved over evolution.
Keywords: EEG, ERO, ERP, phase locking index, adolescence, time series analysis
Introduction
Adolescence is a critical time period when physical, sexual, cognitive, emotional, and social maturation occur (see [1]). While there has been a tendency to define adolescence by endocrine events such as puberty, it actually involves changes in the brain that may occur in a separate time frame from the endocrine events associated with puberty [2]. During adolescence, there are major changes that occur in brain morphology including the selective removal of 40-50% of the synapses (i.e. synaptic pruning) in cortical and subcortical brain regions [3-6], continued myelination of cortical regions [7-9] and dramatic changes in neurotransmitter levels [10-15] as well as receptor levels and their sensitivity [4, 12].
The alterations in neurobiological organization and behavior seen during adolescence appear to have been notably conserved during evolution with a number of similarities seen across mammalian species (see [16]). It has been suggested to encompass the entire second decade of life (10-20 yrs) in humans [16]. In the rat it has been suggested that the periadolescent period may, as a conservative estimate, span postnatal days 28-42 [17-19].
The global behavioral changes seen during adolescent development most likely require the integration of a number of functional neuronal areas distributed over the brain that are in constant interaction with each other. It has been suggested that such large scale integration and communication within the brain could be mediated by groups of neurons that oscillate within a specific frequency range and enter into precise phase-locking, or synchrony, over a limited period of time [20-22]. Measures of neuronal phase synchrony may therefore be a sensitive way to measure the effects of developmental changes on local and global neural networks in humans and rats.
Event-related potentials (ERPs) are a series of negative and positive voltage deflections of the electroencephalogram (EEG) that are time locked typically to either sensory or cognitive events and can be recorded in both humans and animals. It has been suggested that the stimuli that evoke ERP components influence oscillatory changes within the dynamics of ongoing EEG rhythms [23-30]. This synchronization or enhancement of ongoing EEG oscillations by a time locked cognitive and/or sensory process is termed an event-related oscillation (ERO) [31-33]. EROs are thought to arise by a “phase re-ordering”, or realignment, of the background EEG in several frequency bands [34-35]. Phase locking of EROs can be measured in both humans [22, 33] and more recently in rodent models [36-39], allowing for translational studies to be conducted.
The present study was conducted to further explore whether differences exist in ERO energy (the square of the output magnitude of the time frequency transform of the EEG) and phase synchrony (phase locking) between periadolescents and adults in rats and to directly compare those findings to human data. We predicted that over periadolescent development, the remodeling of neuronal circuits produced by pruning and increased myelination, could theoretically result in an increase in the synchrony or phase locking of neurons both within a neuronal population and between neuronal populations. Evidence for this hypothesis has been demonstrated previously in human studies [40]. Our study is unique in that we used a similar auditory event-related potential paradigm in male rats and male humans in order to explore effects of development during the periadolescent-adult period on energy and phase locking of EROs in specific frequency bands. The advantage of this type of “translational” research is that it allows for the use of electrophysiological measures, which have known clinical correlates in humans, to be used in rodent species where the mechanisms underlying the generation of those measures can be more readily explored using techniques such as genetic modification, molecular biology and behavioral investigations.
In our study two auditory oddball plus noise paradigms were used to generate EROs. One that required responding to the infrequently presented tone (active task, used in periadolescent and adult humans) and one that did not require any responses to the tones (passive task, used in rats and periadolescent humans). The use of passive tasks are important because they can be used in human participants who may be too young or have cognitive/behavioral challenges that preclude them from being able to adequately respond to the task requirements [41]. Secondly, passive tasks are important in animal research in circumstances where it is not possible to present the stimuli, and train the animal to respond to the stimuli, in a similar manner to humans without using food restriction/food rewards which presumably have different motivational concomitants.
The first question, of the present investigation, was to determine if ERO measures differentiated active from passive ERP tasks in humans. This question was explored in order to better interpret data in humans and rats since the rats were assessed using a “passive” paradigm. Secondly we assessed whether ERO measures of energy and synchrony differentiated adults from periadolescents in both the rats and in the humans.
Experimental procedures
Human participants
Young Adult participants
Males between the ages of 18 and 25 years were recruited using a combination of venue-based method and a respondent-driven procedure that has been described elsewhere [42]. Telephone screening with research staff was used to complete a questionnaire [43-44] which was used to select individuals who met eligibility for the study. All participants signed informed consent, and the study was approved by The Scripps Research Institute Internal Review Board. Participants were excluded from further evaluation if they met diagnostic criteria for alcohol or other substance dependence, or other major Axis I psychiatric disorders according to criteria outlined in the Third Diagnostic and Statistical Manual Disorders (DSM-III-R) [45]. Participants were also excluded from this study if they were taking prescribed medication, had any major medical condition as described previously [42, 46-47]. Participants were instructed not to use alcohol or any other drugs for 3 days prior to testing. Records from 38 of the participants were still available on readable media and were used in the present analyses. EEG/ERP and ERO responses to alcohol challenge in these participants have been reported previously [42, 46-47]. Data in the present report included only ERO responses to placebo, for comparison to the periadolescent sample.
Periadolescent participants
Two groups of periadolescent children (age 10-14 yrs) were recruited as described previously [48-52]. Both groups were recruited from the community and individual informed consent was obtained from one biological parent or legal guardian. Participants were excluded if they were taking any prescribed medication or had any major medical or psychiatric/developmental disorder. Records from 31 of the participants were still available on readable media and were used in the present analyses. Baseline EEG and ERP responses to auditory stimuli in these individuals have been reported previously [48-49]. Data in the present report included only ERO responses, for comparison to the young adult participants.
ERP collection and analyses in human subjects
Young Adult participants
Seven channels of ERP data (FZ, CZ, PZ, F3, F4, F7, F8 and referenced to linked ear lobes with a forehead ground, international 10–20 system) were obtained by using gold-plated electrodes with impedance held below 5K ohms. An electrode placed left lateral infraorbitally and referenced to the left earlobe was used to monitor both horizontal and vertical eye movement. ERP signals were recorded on a Nihon-Kohden polygraph (sensitivity 7 microvolts/mm, time constant 0.1 s, 35 Hz low pass). Signals were transferred to a computer and digitized at a rate of 256 Hz. The EEG amplifier input range corresponded to the full range of the 12-bit analog-to-digital converter was about ± 250 microvolts. Periodic calibration results were used to scale the digitized EEG to microvolts. Auditory stimuli and ERPs were elicited using an oddball plus “noise” paradigm. The acoustic parameters were three square wave tones (rise/fall times,1 ms): a frequent tone (50 ms, 2 KHz, 70 dB SPL) presented on 83% of the trials (n=200), an infrequent tone (50 ms, 2 KHz, 80 dB SPL) presented on 10.4% of the trials (n=25), and a noise burst (50 ms, noise, 80 dB SPL) presented on 6.3% of the trials (n=15). Each subject was hearing tested prior to the recording to ensure that he had no trouble easily identifying the three different tones. Infrequent tones were interspersed with frequent tones so that no two rare tones occurred consecutively. A noise burst was substituted for an infrequent tone every 12 trials to avoid habituation to the infrequent tone. The digitizing epoch was 1 s and a 0.5- to 1.0-s inter-trial interval was used. The ERP trials were digitized at a rate of 256 Hz. The total number of trials in each recording session was 240. These stimulus characteristics have been used extensively in our laboratory and have been described previously (see [42, 46, 53]). Each subject was instructed to depress a counter each time he detected an infrequent (target) tone. Individual trials containing excessive eye movement artifact as well as trials where the EEG exceeded 250 microvolts (<5% of the trials) were eliminated.
Periadolescent participant
In the first set of periadolescent participants (n=19) [49] seven channels of ERP data (FZ, CZ, PZ, F3, F4, F7, F8 and referenced to linked ear lobes with a forehead ground, international 10-20 system) were obtained by using gold-plated electrodes with impedance held below 5k ohms. An electrode placed left lateral infraorbitally and referenced to the left earlobe was used to monitor both horizontal and vertical eye movement. ERP recording signals were amplified (time constant 0.1 s, 35 Hz low-pass filter) using a Nihon Kohden EEG machine and transferred to a computer for digitization. Auditory stimuli and ERPs were elicited using an oddball plus “noise” paradigm identical to that used in the adults and described previously [49]. In the second set of periadolescent participants (n=12), recordings were obtained using an electrode cap. Unipolar recordings from FZ, CZ, and PZ were referenced to linked earlobes. The auditory stimuli and ERPs were elicited using a “passive” oddball plus “noise” paradigm identical to the one used for the first set of periadolescent participants however, the noise tone was 20 dB louder and the participants were not asked to respond to any of the stimuli.
Animal subjects
The experimental subjects were 15 male periadolescent (Post Natal Day (PD) 23) on arrival, weighing 58-79 grams) and 19 male adult (PD90 on arrival, weighing 351-387 grams) Wistar rats. At least 1 week prior to the electrophysiological recordings rats were surgically prepared with screw electrodes placed in the skull overlying the frontal (Adults: AP +1.5, ML ± 3.0; Periadolescents: AP +1.5, ML ± 2.0), parietal lobe (Adults: AP -4.5, ML ± 4.5; Periadolescents: AP -4.0, ML ± 3.5) and an electrode placed over the cerebellum was used as ground. Two electromyography (EMG) wire electrodes were also inserted into the rat's neck muscles on the right and left. The rats were anesthetized with isoflurane and atropine (0.03mL for periadolescents and 0.06mL for adults; subcutaneously) was co-administered to minimize respiratory suppression during the surgical procedures. EMG and EEG electrode connections were made to either an Amphenol 5-pin connector (adult rats) or were assembled into a custom 5-pin cap (for the periadolescent rats), and the assembly was anchored to the skull with dental acrylic and anchor screws. All the animals were pair-housed in standard plastic cages on a 12-h light/dark cycle (lights on at 8am) and food and water were provided ad libitum. All experimental protocols were approved by the Institutional Animal Care and Use Committee at the Scripps Research Institute and were consistent with the guidelines of the NIH Guide for the Care and Use of Laboratory Animals.
ERP collection and analyses in animal subjects
ERPs were elicited by auditory stimuli that were presented through a small speaker centered approximately 70 cm above the rat's head. Electrophysiological recordings were made in the periadolescent rats at PD33-39, the adult rats were recorded on PD100-106. ERPs were elicited by an acoustic “oddball” plus noise paradigm identical to the “passive” paradigm described above for the periadolescent human participants. Signals were transferred to a PC and digitized at a rate of 256 Hz. The EEG amplifier input range corresponding to the full range of the 12-bit analog-to-digital converter was about ± 250 microvolts. Periodic calibration results were used to scale the digitized EEG to microvolts.
ERO, PLI, and PDLI analyses
ERO energy (peak magnitude of the S transform output, squared, in a time frequency region of interest), PLI (phase lock index) and PDLI (phase difference lock index) analyses were accomplished from the same datasets that were used to generate ERP data reported in four previous publications in humans [42, 48, 49, 54] and unpublished data in the rats. Methods for these analyses have been described in detail elsewhere [39, 47].
The ERO trials were digitized at a rate of 256 Hz. Trials containing excessive artifact were eliminated prior to averaging (<5% of the trials). An artifact rejection program was utilized to eliminate individual trials in which the EEG exceeded ± 400 μV. Data from single trials generated by the stimuli were entered into the time frequency analyses algorithm. The S-transform (ST), a generalization of the Gabor transform [55], was used (see[56]).
The S transform mathematically resembles the continuous wavelet transform but it uses Gaussian windows which do not meet a requirement of wavelet analysis, and it includes a “phase correction” that is not part of wavelet analysis. The actual use of the S-transform was simplified by performing first a forward Fourier transform of the time series. Then, for each frequency of the Fourier transform, summing the results of multiplication by a set of Fourier transforms of Gaussian windows of varying width. Finally, for each of these sums, taking the inverse Fourier transform. The equation for calculation of the S-transform of discrete time series h(kT) at time jT and frequency n/NT is where T is the sample period of the discrete time series, j is the sample index, N is the number of samples in the time series, n is the frequency index, and H[ ] is the Fourier spectrum of the discrete time series. The S-transform results in a time-frequency representation of the data. The exact code we used is a C language, S-transform subroutine available from the NIMH MEG Core Facility web site (http://kurage.nimh.nih.gov/meglab/). This code is specifically for use with real time series, so it sets the input imaginary values, required by the S-transform, to zero, and it always uses the Hilbert transform so that each of the complex output time series is an analytic signal.
To reduce anomalies in the S-transform output at the beginning and the end of the output time series, we used a Hanning window over the initial and final 100 msec of the input time series. The output of the transform for each stimuli and electrode site was calculated by averaging the individual trials containing the time-frequency energy distributions. To quantify S-transform magnitudes, a region of interest (ROI) was identified by specifying the band of frequencies and the time interval contained in the rectangular ROI. The time-frequency points saved from each S transformation are from 100 ms before to 900 ms after the onset of the stimulus, and from 1 Hz through 50 Hz at intervals of 0.5 Hz. Energy is the square of the magnitude of the S-transform output in a time frequency region of interest. The S-transform output for a time/frequency ROI, for a specific EEG lead, is proportional to the input voltage of the lead over the time/frequency interval. The S-transform magnitude squared for a time/frequency interval is therefore proportional to volts squared. These analyses are similar to what has been previously described [57].
An S transformation at time t and frequency f has real and imaginary parts
where i is the square root of minus 1. The cosine and sine of the phase angle at this time-frequency point are
where the vertical bar pair indicates magnitude, here and below. The cosine and sine of phase angle are calculated from the S transformation without having to calculate the phase angle.
PLI is a measure of synchrony of phase angle over trials, as a function of frequency and of time relative to the start of the stimulus for each trial. The range of PLI is from zero to 1.0, with high values at a time and frequency indicating little variation, among trials, of phase angle at that time and frequency. PLI is defined as:
where the angle bracket pair indicates mean value over eligible trials, here and below. Eligibility depends on the stimulus type and absence of significant artifact. This definition is based on cosine and sine of phase angles that are calculated from S transformations without calculating phase angles. This definition is mathematically equivalent to the definition in Schack and Klimesch [58].
PDLI is a measure of constancy over trials of the difference in phase angle between two channels, as a function of frequency and of time relative to the start of the stimulus for each trial. The range of PDLI is from zero to 1.0, with high values at a time and frequency indicating little variation, among trials, of phase angle difference between channels of the pair, at that time and frequency. PDLI is defined for frequency f at time t as:
where ϕA and ϕB are phase angles of channels A and B, respectively. This definition of PDLI is equivalent to a definition of PLV, phase lock value, in Brunner and colleagues [59]. By means of some standard trigonometric identities the equation above is equivalent to the following, which, as for PLI, does not require that the phase angles be calculated:
Rectangular regions of interest (ROIs) were defined within the time-frequency analysis plane by specifying, for each ROI, a band of frequencies and a time interval relative to the stimulus onset time. Time 0 in these definitions is the onset of the stimulus. The ROI frequencies in both human and animal studies were: delta (1-4 Hz), theta (4-7 Hz), alpha (7-13 Hz), and beta (13-30 Hz). The ROI time intervals were delta (200-500 ms), theta (10-400 ms), alpha (0-300 ms) and beta (0-300 ms). ROI time intervals were selected based on ERO energy in specific ERP component locations (N1, P3) in previous ERP studies [42]. Using mean values over trials, the maximum values were calculated for each ROI, for each electrode location or, for PDLI, for a pair of electrode locations (FZ-PZ) for energy (E), PLI amplitude, and PDLI amplitude.
Statistical analyses
The first set of analyses (IBM SPSS statistics 20.0. Armonk, NY: IBM Corp) were aimed at determining whether the amount of: (1) energy, (2) degree of phase locking within (PLI)electrodes locations and (3) degree of phase locking between electrode locations (PDLI) was different between the “active” and “passive” ERP paradigms used in the two sets of periadolescent human participants. Three Multivariate Analysis of Variances (MANOVAs) were used to test between subject effects for energy, PLI, PDLI. Variables entered into the MANOVAs included: (1) group (active vs passive task), (2) electrode location (FZ, CZ, PZ) for energy and PLI and FZ-PZ for PDLI, (3) tone (frequent and infrequent tones) and (4) the 4 time frequency regions of interest (ROIs) (delta, theta, alpha, beta). If significant main effects were found, repeated measures and interactions were explored using post hoc ANOVAs. To determine if the age of the participants in the active task differed from those in the passive task a one-way ANOVA that compared the two groups was conducted. The second question focused on whether periadolescent active task participants differed from adult participants on energy, PDLI and PLI values. Three Multivariate Analysis of Variances (MANOVAs) were used to test between subject age effects for energy, PLI, PDLI separately for the rats and the human participants. Variables entered into the MANOVAs included: (1) group (periadolescent vs. adult), (2) electrode location (FZ, CZ, PZ) for energy and PLI and FZ-PZ for PDLI, (3) tone (frequent and infrequent tones) and (4) the 4 time frequency regions of interest (ROIs) (delta, theta, alpha, beta). If significant main effects were found, repeated measures and interactions were explored using post hoc ANOVAs. To determine if the number of behavioral responses of the adults and periadolescent participants in the active task differed, a one-way ANOVA that compared the two groups was conducted. To reduce type 1 error, significance was set at p<0.01.
Results
Thirty-eight (38) adult and 31 periadolescent human participants (all males) had valid electrophysiological data available for the current analyses. The adults had a mean ± SD age of 20.53 ± 2.08 yrs (range=18-25 yrs), and 11.89 ± 1.09 yrs of education. The periadolescents had a mean ± SD age of 12.0 ± 1.5 yrs (range=10-14 yrs), and 6.4 ± 1.72 yrs of education. Thirty-four (34) rats completed the protocol and had data available for analyses, though two rats had only one channel of electrophysiology data. The periadolescent rats were between PD33 and PD39 days old and had a mean ± SE body weight of 142 ± 5.9 g. The adult rats were between PD99 and PD117 days old and had a mean ± SE body weight of 382 ± 3.6 g.
ERO responses to frequent and infrequent tones in the “active” and “passive” tasks in periadolescent humans
One-way ANOVA revealed that there were no significant age differences between the periadolescent participants in the active task and those in the passive task. To address the first major research question, Multivariate Analysis of Variance with repeated measures (MANOVA) was used to determine if, the values for energy (E), phase locking index (PLI) or phase difference locking index (PDLI) for the three electrode locations (Frontal Cortex (FZ), Central Cortex (CZ), Parietal Cortex (PZ)), differed between the infrequent and frequent tones, or differed between the active and passive task in the periadolescent humans. In the active task MANOVA revealed that no significant overall differences were found in measures of ERO energy for the effect of tone (frequent vs. infrequent tone) or for group (active vs. passive task). However, there were significant overall effects of electrode location (F=6.7, df=2,174, p<0.002) (grand means: FZ=54.4 ± 6.8, CZ=64.1 ± 6.8, PZ=88.4 ± 6.8), with the Parietal cortex having higher energy than the Central or Frontal cortices, as seen in Table 1. Evaluation of PLI values using MANOVA with repeated measures revealed a significant main effect of electrode location with higher PLI values in Central cortex than Parietal (F=12.2, df=2, 174, p<0.001) (grand means: FZ=0.44 ± 0.01, CZ=0.46 ± 0.01, PZ=0.39 ± 0.01). A significant main effect of tone was also found with increases in the PLI values obtained following the infrequent (target) tone as compared to the frequent (non-target) tone (F=208.6, df=1,174, p<0.001) as seen in Table 2. Significant main effects of group (active vs. passive task) were also seen (F=7.4, df=1,174, p<0.007), these results are presented in Figure 1B. The infrequent (target) tones had the same amplitude in the active vs. the passive task but the frequent tone had lower PLI values in the active task.
Table 1. Grand means for periadolescent humans by electrode recording locations.
| Grand Mean | SE | F Stat | df | p-value | ||
|---|---|---|---|---|---|---|
| FZ | 54.43 | 6.77 | ||||
| Energy | CZ | 64.09 | 6.77 | 6.67 | 2, 174 | 0.002 |
| PZ | 88.35 | 6.77 | ||||
|
| ||||||
| FZ | 0.44 | 0.01 | ||||
| PLI | CZ | 0.46 | 0.01 | 12.23 | 2, 174 | < 0.001 |
| PZ | 0.39 | 0.01 | ||||
Table 2.
Means for frequent and infrequent tone of the active and passive task in periadolescent humans, with MANOVA.
| Tone | Passive | Active | MANOVA | F Stat | df | p-value | |||
|---|---|---|---|---|---|---|---|---|---|
|
|
|
||||||||
| Mean | SE | Mean | SE | ||||||
| Energy | Frequent | 69.05 | 8.65 | 61.01 | 6.88 | Task | 0.03 | 1, 174 | 0.862 |
| Infrequent | 70.22 | 8.65 | 75.54 | 6.88 | Tone | 1.01 | 1, 174 | 0.317 | |
|
| |||||||||
| PLI | Frequent | 0.38 | 0.01 | 0.32 | 0.01 | Task | 7.44 | 1, 174 | 0.007 |
| Infrequent | 0.51 | 0.01 | 0.51 | 0.01 | Tone | 208.56 | 1, 174 | < 0.001 | |
|
| |||||||||
| PDLI | Frequent | 0.54 | 0.02 | 0.51 | 0.02 | Task | 0.34 | 1, 58 | 0.560 |
| Infrequent | 0.66 | 0.02 | 0.67 | 0.02 | Tone | 56.70 | 1, 58 | < 0.001 | |
Figure 1.
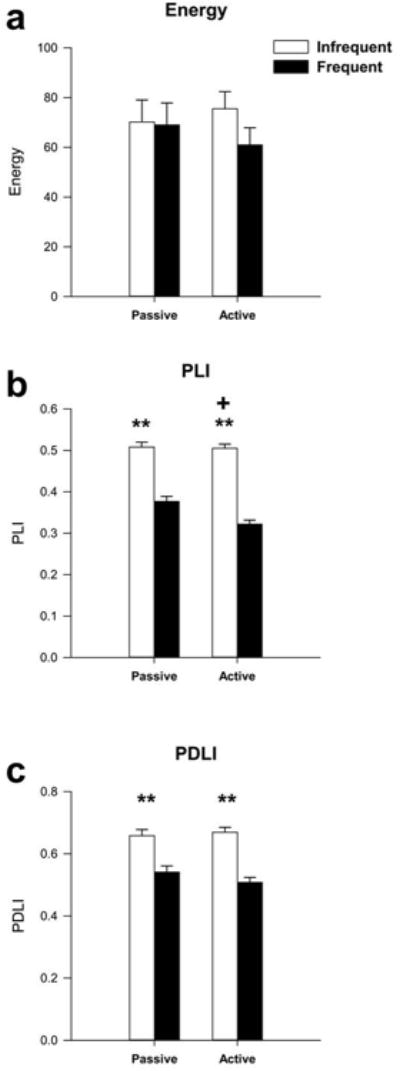
Grand mean values for energy, phase locking index (PLI) and phase difference lock index (PDLI) of event-related oscillations for the passive and active task in periadolescents. (a) MANOVA revealed that the infrequent (target) tone (white bars), as compared to the frequent (non-target) tone (black bars), produced no significant differences in energy by tone or between passive and active task. (b) PLI was significantly increased following the infrequent tone compared to the frequent tone [** indicates p<0.001] and was decreased in the active task [+ indicates p<0.007]. (c) PDLI was also significantly increased following the infrequent tone but not different between the tasks. Error Bars = S.E.M
A highly significant main effect of tone was found in phase difference lock index (PDLI) between FZ and PZ (F=56.7, df=1,58, p<0.001), as also seen in Figure 1C. PDLI was found to be significantly higher following the infrequent (target) tone as compared to the frequent (non-target) tone. There were no significant main effects of PDLI as a function of group (active vs. passive task).
Developmental differences in EROs in humans
The second major research question concerned whether adults differed from periadolescents in ERO responses to auditory stimuli with an active taskA comparison of the number of behavioral responses given in the active task revealed that there were no significant differences between adults and periadolescents. The mean number of responses for the adults was 25.3 ± 0.2 and for the periadolescents was 26.5 ± 0.6 out of a total possible 25 responses. An evaluation of energy values in the human participants using MANOVA revealed a main effect of group (periadolescents vs. adults: F=89.6, df=1,330, p<0.001), and a main effect of tone (frequent vs. infrequent (target): F=7.32, df=1,330, p<0.007). The infrequent (target) tone had a significantly higher overall energy (54.89 ±2.8) than the frequent tone (44.19 ±2.8). Grand means revealed that periadolescents had significantly higher energy (68.28 ± 3.2) than adults (30.8 ± 2.3). ANOVA identified that for the frequently presented tone that periadolescents had significantly higher energy than adults in all electrode locations, for all time frequency ROIs except for theta activity in FZ. (F values range= 7.6-74.7).
As seen in Figure 2a, in the ANOVA revealed that periadolescents also had significantly higher energy values than adults to the infrequent (target) tone in the delta (F=43.1, df=1,56, p<0.001), theta (F=8.4, df=1,56, p=0.005), alpha (F=18.3, df=1,56, p<0.001), and beta (F= 17.7, df=1,56, p<0.001) frequency ranges in frontal cortex (FZ) and in the delta (F=23.4, df=1,56, p<0.001), theta (F=14.6, df=1,56, p<0.001), alpha (F=13.9, df=1,56, p<0.001), and beta (F=9.7, df=1,56, p=0.003) frequencies in the central cortex (CZ). Significant reductions in energy were also seen in the adults as compared to the periadolescents to the infrequent (target) tone at parietal sites (PZ) in the delta (F=30.5, df=1,56, p<0.001), theta (F=23.5, df=1,56, p<0.001), alpha (F=8.6, df=1,56, p=0.005) and beta (F=7.6, df=1,56, p=0.008) frequency ranges, as seen in Table 3. Grand averages of the energy values for the entire group of participants (n=57) given the active task, to the infrequent (target) tone for the periadolescents and adults, are presented in Figure 3.
Figure 2.
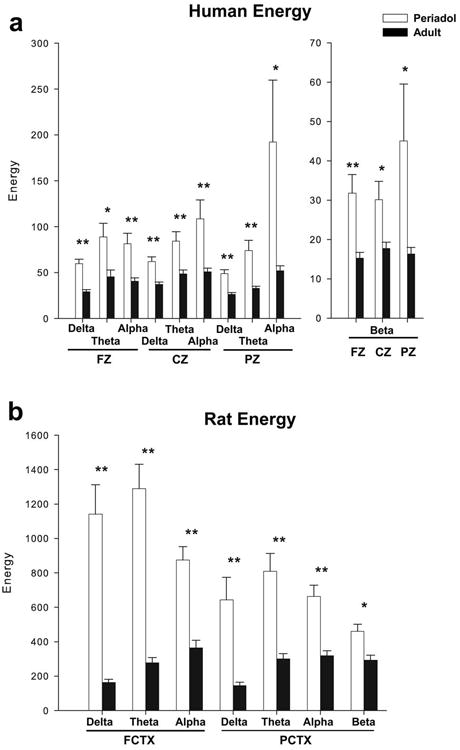
Significant mean values for energy of event-related oscillations (EROs) following the infrequent (target) tone for periadolescents (white bars) and adults (black bars) in the delta (1-4 Hz, 200-500 ms), theta (4-7 Hz 10-400 ms), alpha (7-13 Hz, 0-300 ms), and beta (13-30 Hz, 0-300 ms) time-frequency ranges for the three electrode locations in the humans (a) (periadolescent n=19, adult n=38) (FZ=midline frontal cortex, CZ=midline central cortex, PZ=midline parietal cortex) and in the rats (b) (periadolescent n=15, adult n=19) (FCTX= frontal cortex, PCTX= parietal cortex). Energy in periadolescents, as compared to adults, is significantly higher across most frequency bands and electrode sites in humans and in rats. * indicates p<0.01, ** p<0.001. Error Bars = S.E.M
Table 3.
Energy results for the infrequent tone by age in both human (active task) and rat.
| Humans | Adults | Periadolescents | F Stat | df | p-value | |||||
|---|---|---|---|---|---|---|---|---|---|---|
|
|
|
|||||||||
| N | Mean | SE | N | Mean | SE | |||||
| FZ | Delta | 38 | 29.01 | 2.27 | 19 | 59.61 | 4.80 | 43.07 | 1, 56 | < 0.001 |
| Theta | 38 | 45.23 | 7.53 | 19 | 88.75 | 15.00 | 8.43 | 1, 56 | 0.005 | |
| Alpha | 38 | 40.42 | 3.77 | 19 | 81.36 | 11.34 | 18.26 | 1, 56 | < 0.001 | |
| Beta | 38 | 15.23 | 1.50 | 19 | 31.77 | 4.71 | 17.73 | 1, 56 | < 0.001 | |
|
| ||||||||||
| CZ | Delta | 38 | 37.00 | 2.59 | 19 | 62.01 | 5.19 | 23.38 | 1, 56 | < 0.001 |
| Theta | 38 | 48.39 | 4.26 | 19 | 84.30 | 10.25 | 14.64 | 1, 56 | < 0.001 | |
| Alpha | 38 | 50.67 | 4.06 | 19 | 108.50 | 20.52 | 13.94 | 1, 56 | < 0.001 | |
| Beta | 38 | 17.67 | 1.62 | 19 | 30.13 | 4.67 | 9.68 | 1, 56 | 0.003 | |
|
| ||||||||||
| PZ | Delta | 38 | 26.34 | 2.04 | 19 | 48.83 | 4.10 | 30.46 | 1, 56 | < 0.001 |
| Theta | 38 | 32.67 | 2.41 | 19 | 73.98 | 11.13 | 23.53 | 1, 56 | < 0.001 | |
| Alpha | 38 | 52.02 | 5.29 | 19 | 192.21 | 67.31 | 8.62 | 1, 56 | 0.005 | |
| Beta | 38 | 16.33 | 1.62 | 19 | 45.04 | 14.49 | 7.61 | 1, 56 | 0.008 | |
|
| ||||||||||
| Rats | Adults | Periadolescents | F Stat | df | p-value | |||||
|
|
|
|||||||||
| N | Mean | SE | N | Mean | SE | |||||
|
| ||||||||||
| FCTX | Delta | 19 | 163.39 | 18.01 | 14 | 1141.14 | 170.46 | 44.24 | 1, 32 | < 0.001 |
| Theta | 19 | 276.73 | 31.54 | 14 | 1289.59 | 140.81 | 64.92 | 1, 32 | < 0.001 | |
| Alpha | 19 | 363.79 | 45.35 | 14 | 875.34 | 77.35 | 36.49 | 1, 32 | < 0.001 | |
| Beta | 19 | 408.99 | 50.62 | 14 | 593.89 | 63.04 | 5.34 | 1, 32 | 0.028 | |
|
| ||||||||||
| PCTX | Delta | 18 | 144.15 | 19.96 | 15 | 642.80 | 131.31 | 16.85 | 1, 32 | < 0.001 |
| Theta | 18 | 299.55 | 31.59 | 15 | 809.12 | 103.86 | 25.62 | 1, 32 | < 0.001 | |
| Alpha | 18 | 319.02 | 28.63 | 15 | 663.10 | 65.33 | 26.18 | 1, 32 | < 0.001 | |
| Beta | 18 | 292.85 | 28.02 | 15 | 459.83 | 40.98 | 11.93 | 1, 32 | 0.002 | |
Figure 3.
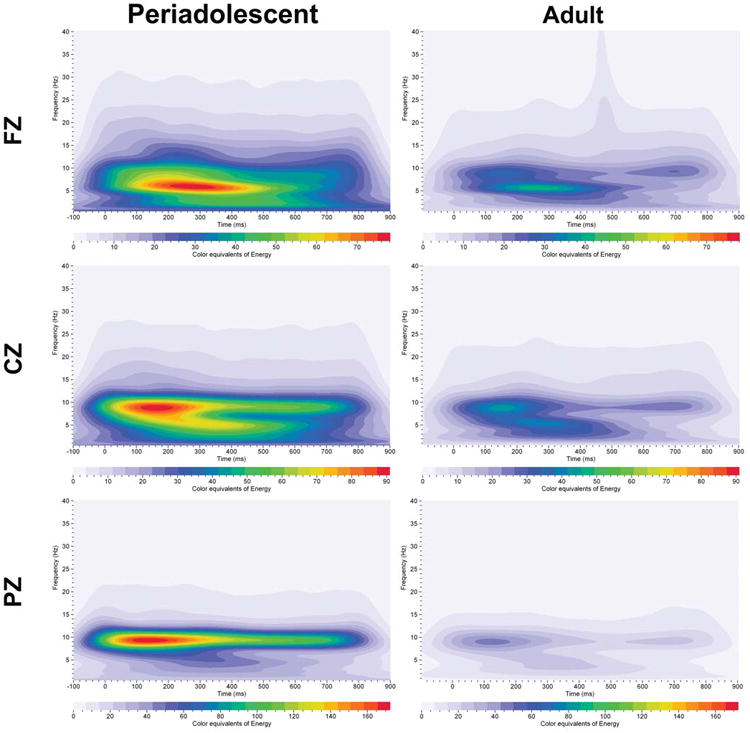
Grand averages of energy for event–related oscillations (EROs) in humans given the active task (periadolescent n=19, adult n=38). Each graph depicts a time-frequency representation of energy values in periadolescents and adults following the infrequent (target) tone in the three electrode locations (FZ=midline frontal cortex, CZ=midline central cortex, PZ=midline parietal cortex). In each graph, frequency (Hz) is presented on the Y-axis, time regions of interest on the X-axis (msec). Energy is presented as color equivalents as indicated on the bar at the bottom of each graph. Periadolescents compared to adults show overall higher energy across the time-frequencies and in all electrode sites compared to adults.
An evaluation of PLI values in the human participants using MANOVA revealed a main effect of group (periadolescents vs. adults: F=88.1, df=1,330, p<0.001), and a main effect of tone (frequent vs. infrequent (target): F=364.6, df=1,330, p<0.001) and of electrode location (10.6, df=2,330, p<0.001). The infrequent (target) tone had a significantly higher grand mean PLI value (0.55 ± .007) than the frequent tone (0.37 ± .007). Grand means also revealed that periadolescents had significantly lower PLI values (0.41) than adults (0.5). ANOVA identified that for the frequently presented tone that periadolescents had significantly lower PLI than adults for delta and theta activity for all electrode locations (F values range= 8.6-42.8).
Figure 4a gives the mean (± SE) values for the PLI for each frequency range for the three electrode locations for the periadolescents and adults, for the infrequent (target) tone in the human participants. Repeated measures ANOVA revealed that adults had significantly higher PLI levels than periadolescents to the infrequent (target) tone in the delta (F=6.7, df=1,56, p= 0.01) and theta (F=8.4, df=1,56, p=0.005) frequencies in frontal cortex (FZ) and in the delta (F=18.9, df=1,56, p=0.001), and theta (F=8.1, df=1,56, p<0.006) frequency ranges in central cortex (CZ) as seen in Table 4. Significant increases in PLI were also seen in the adults as compared to the periadolescents at parietal sites (PZ) in the delta (F=22.2, df=1,56, p<0.001) and theta (F=9.2, df=1,56, p<0.004) frequency ranges for the infrequent (target) tone. Grand averages of PLI values for the infrequent (target) tone for periadolescents and adults in the active task are seen in Figure 5.
Figure 4.
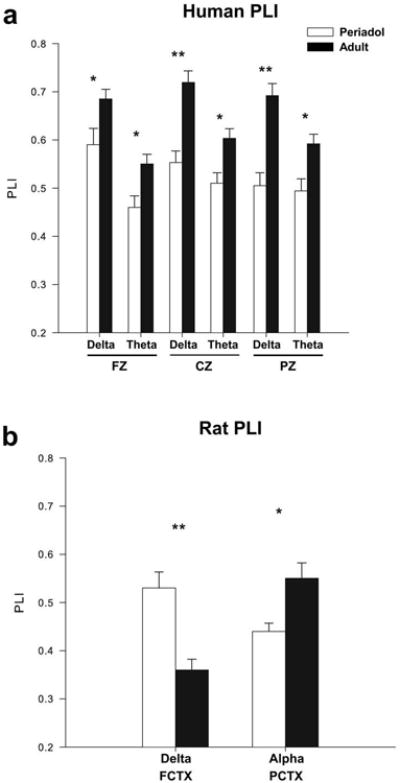
Significant mean values for the phase lock index (PLI) of event-related oscillations (EROs) following the infrequent (target) tone for periadolescents (white bars) and adults (black bars) for delta (1-4 Hz, 200-500 ms), theta (4-7 Hz 10-400 ms) and alpha (7-13 Hz, 0-300 ms) time-frequency ranges. (a) Human adults (periadolescents n=19, adults n=38) showed significantly higher phase lock index in the delta and theta time-frequencies across all three electrode locations compared to periadolescents. (b) Adult rats (periadolescent n=15, adult n=19) showed a significant decrease in the delta time-frequency in the frontal cortex and an increase in alpha time-frequencies at parietal cortex when compared to periadolescents. * indicates p<0.01, ** p<0.001. Error Bars = S.E.M.
Table 4.
PLI results for the infrequent tone by age in both human (active task) and rat.
| Humans | Adults | Periadolescents | F Stat | df | p-value | |||||
|---|---|---|---|---|---|---|---|---|---|---|
|
|
|
|||||||||
| N | Mean | SE | N | Mean | SE | |||||
| FZ | Delta | 38 | 0.68 | 0.02 | 19 | 0.59 | 0.03 | 6.72 | 1, 56 | 0.012 |
| Theta | 38 | 0.55 | 0.02 | 19 | 0.46 | 0.02 | 8.44 | 1, 56 | 0.005 | |
| Alpha | 38 | 0.54 | 0.02 | 19 | 0.49 | 0.03 | 3.03 | 1, 56 | 0.087 | |
| Beta | 38 | 0.55 | 0.02 | 19 | 0.53 | 0.02 | 1.19 | 1, 56 | 0.281 | |
|
| ||||||||||
| CZ | Delta | 38 | 0.72 | 0.02 | 19 | 0.55 | 0.02 | 18.86 | 1, 56 | < 0.001 |
| Theta | 38 | 0.60 | 0.02 | 19 | 0.51 | 0.02 | 8.06 | 1, 56 | 0.006 | |
| Alpha | 38 | 0.59 | 0.02 | 19 | 0.53 | 0.02 | 3.14 | 1, 56 | 0.082 | |
| Beta | 38 | 0.55 | 0.02 | 19 | 0.49 | 0.03 | 3.28 | 1, 56 | 0.076 | |
|
| ||||||||||
| PZ | Delta | 38 | 0.69 | 0.02 | 19 | 0.50 | 0.03 | 22.18 | 1, 56 | < 0.001 |
| Theta | 38 | 0.59 | 0.02 | 19 | 0.49 | 0.03 | 9.18 | 1, 56 | 0.004 | |
| Alpha | 38 | 0.53 | 0.02 | 19 | 0.45 | 0.03 | 4.07 | 1, 56 | 0.048 | |
| Beta | 38 | 0.49 | 0.02 | 19 | 0.47 | 0.02 | 0.89 | 1, 56 | 0.349 | |
|
| ||||||||||
| Rats | Adults | Periadolescents | F Stat | df | p-value | |||||
|
|
|
|||||||||
| N | Mean | SE | N | Mean | SE | |||||
|
| ||||||||||
| FCTX | Delta | 19 | 0.36 | 0.02 | 14 | 0.53 | 0.03 | 19.27 | 1, 32 | < 0.001 |
| Theta | 19 | 0.49 | 0.03 | 14 | 0.56 | 0.04 | 1.85 | 1, 32 | 0.183 | |
| Alpha | 19 | 0.68 | 0.03 | 14 | 0.61 | 0.03 | 2.21 | 1, 32 | 0.147 | |
| Beta | 19 | 0.76 | 0.03 | 14 | 0.68 | 0.03 | 4.26 | 1, 32 | 0.048 | |
|
| ||||||||||
| PCTX | Delta | 18 | 0.41 | 0.02 | 15 | 0.43 | 0.02 | 0.74 | 1, 32 | 0.397 |
| Theta | 18 | 0.43 | 0.02 | 15 | 0.39 | 0.02 | 2.19 | 1, 32 | 0.149 | |
| Alpha | 18 | 0.55 | 0.03 | 15 | 0.44 | 0.02 | 8.67 | 1, 32 | 0.006 | |
| Beta | 18 | 0.67 | 0.03 | 15 | 0.63 | 0.03 | 0.61 | 1, 32 | 0.443 | |
Figure 5.
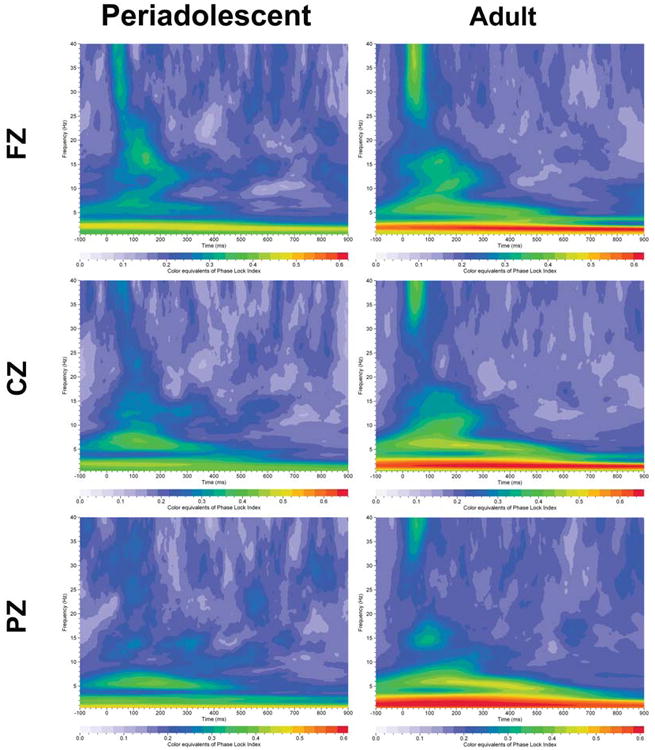
Grand averages of PLI (phase lock index) for event–related oscillations (EROs) in humans given the active task (periadolescent n=19, adult n=38). Each graph depicts a time-frequency representation of phase angle synchrony values in periadolescents and adults following the infrequent (target) tone in the three electrode locations (FZ=midline frontal cortex, CZ=midline central cortex, PZ=midline parietal cortex). In each graph frequency (Hz) is presented on the Y-axis, time regions of interest on the X-axis (msec). PLI is presented as color equivalents as indicated on the bar at the bottom of each graph.
An evaluation of PDLI values in the human participants for the electrode pair FZ and PZ using MANOVA revealed a main effect of group (periadolescents vs. adults: F=72.6, df=1,110, p<0.001), and a main effect of tone (frequent vs. infrequent (target): F=132.3, df=1,110, p<0.001). The infrequent (target) tone had a significantly higher grand mean PDLI value (0.73 ± 0.01) than the frequent tone (0.57 ± 0.01). Grand means also revealed that periadolescents had significantly lower PDLI values (0.59) than adults (0.71). ANOVA identified that for the frequently presented tone that periadolescents had significantly lower PDLI than adults for all time frequency regions of interest (F values range= 7.3-43.0).
The phase difference lock index (PDLI) for the electrode pair FZ and PZ, for the infrequent (target) tone for human adults and periadolescents is shown in Figure 6a. Repeated measures ANOVA revealed that periadolescents had significantly lower PDLI levels than adults to the infrequent (target) tone in the delta (F=26.4, df=1,56, p<0.001), theta (F=41.2, df=1,56, p<0.001) alpha (F=13.3, df=1,56, p=0.001) and beta (F=9.4, df=1,56, p=0.003) frequency ranges, as seen in Table 5.
Figure 6.
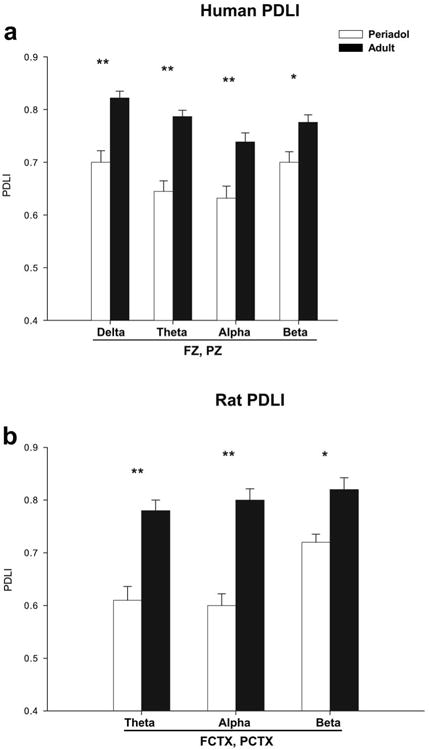
Significant mean values for the phase difference lock index (PDLI) of event-related oscillations (EROs) following the infrequent (target) tone for periadolescent (white bars) and adults (black bars) in the delta (1-4 Hz, 200-500 ms), theta (4-7 Hz 10-400 ms), alpha (7-13 Hz, 0-300 ms), and beta (13-30 Hz, 0-300 ms) time-frequency ranges. Phase differences were calculated between midline frontal cortex (FZ) and midline parietal cortex (PZ) for the human study and between frontal cortex (FCTX) and parietal cortex (PCTX) in the rats. (a) Human adults showed significantly increased PDLI across all frequency bands when compared to periadolescents. (b) Adult rats (periadolescent n=14, adult n=18) also had significant increases in PDLI in the theta, alpha and beta time-frequencies. * indicates p<0.01, ** p<0.001. Error Bars = S.E.M.
Table 5.
PDLI results for the infrequent tone by age in both human (active task, FZ-PZ) and rat (FCTX-PCTX).
| Humans | Adults | Periadolescents | F Stat | df | p-value | ||||
|---|---|---|---|---|---|---|---|---|---|
|
|
|
||||||||
| N | Mean | SE | N | Mean | SE | ||||
| Delta | 38 | 0.82 | 0.01 | 19 | 0.70 | 0.02 | 26.42 | 1, 56 | < 0.001 |
| Theta | 38 | 0.79 | 0.01 | 19 | 0.64 | 0.02 | 41.15 | 1, 56 | < 0.001 |
| Alpha | 38 | 0.74 | 0.02 | 19 | 0.63 | 0.02 | 13.31 | 1, 56 | 0.001 |
| Beta | 38 | 0.78 | 0.01 | 19 | 0.70 | 0.02 | 9.42 | 1, 56 | 0.003 |
|
| |||||||||
| Rats | Adults | Periadolescents | F Stat | df | p-value | ||||
|
|
|
||||||||
| N | Mean | SE | N | Mean | SE | ||||
|
| |||||||||
| Delta | 18 | 0.70 | 0.02 | 14 | 0.63 | 0.02 | 5.34 | 1, 31 | 0.028 |
| Theta | 18 | 0.78 | 0.02 | 14 | 0.61 | 0.03 | 28.94 | 1, 31 | < 0.001 |
| Alpha | 18 | 0.80 | 0.02 | 14 | 0.60 | 0.02 | 45.35 | 1, 31 | < 0.001 |
| Beta | 18 | 0.82 | 0.02 | 14 | 0.72 | 0.02 | 11.08 | 1, 31 | 0.002 |
Developmental differences in EROs in rats
The second major research question also concerned whether adults differed from periadolescents in ERO responses to auditory stimuli in rats. An evaluation of energy values in the rats using MANOVA revealed a main effect of group (periadolescents vs. adults: F=152.1, df=1,124, p<0.001), and a main effect of tone (frequent vs. infrequent: F=8.7, df=1,124, p=0.004) and a main effect of electrode location (F=12.4, df=1,124, p=0.001). The infrequent tone had a significantly higher overall energy (546.5 ±27.4) than the frequent tone (431.9 ±27.4). Grand means revealed that periadolescents had significantly higher energy (728.1 ± 29.0) than adults (250.2 ± 25.7). ANOVA identified that for the frequently presented tone that periadolescents had significantly higher energy than adults in all electrode locations for all time frequency ROIs (F values range= 10.2-57.1).
Age produced similar results on energy values collected following the infrequent tone in the rats. Grand averages of the energy values for the group of rats with complete data (n=31) for the periadolescent and the adult rats for the infrequent tone are presented in Figure 7. In the rats, repeated measures ANOVA revealed that periadolescents had significantly higher energy values than adults to the infrequent (target) tone in the delta (F=44.2, df=1,32, p<0.001), theta (F=64.9, df=1,32, p<0.001), and alpha (F=36.5, df=1,32, p<0.001) frequency ranges in frontal cortex (FCTX), and in parietal cortex (PCTX) in the delta (F=16.9, df=1,32, p< 0.001), theta (F=25.6, df=1,32, p<0.001), alpha (F=26.2, df=1,32, p<0.001), and beta (F= 11.9, df=1,32, p=0.002) frequencies as seen in Figure 2b and Table 3.
Figure 7.
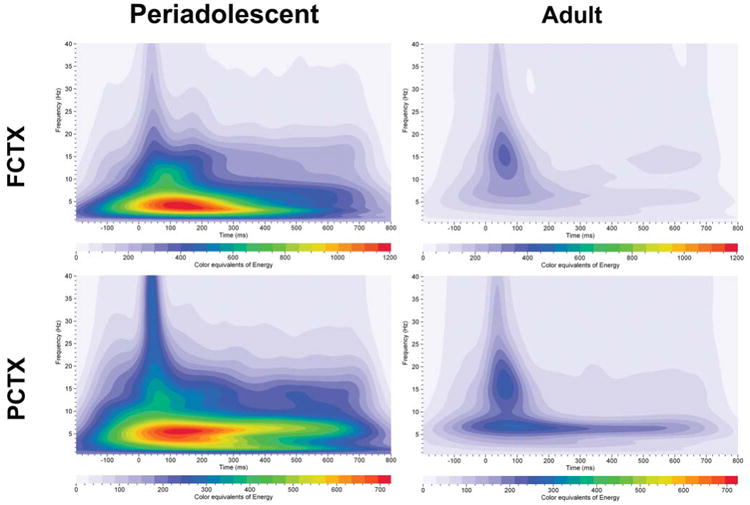
Grand averages of energy for event–related oscillations (EROs) in rats (periadolescents n=13, adults n=18). Each graph depicts a time-frequency representation of energy values in periadolescent and adult rats following the infrequent (target) tone in two electrode locations (FCTX=frontal cortex, PCTX=parietal cortex). In each graph frequency (Hz) is presented on the Y-axis, time regions of interest on the X-axis (msec) and energy is presented as color equivalents as indicated on the bar at the bottom of each graph. Periadolescent rats show greater energy across the time-frequencies and in both electrode sites when compared to adult rats.
An evaluation of PLI values in the rats using MANOVA revealed a main effect of tone (frequent vs. infrequent: F=160.7, df=1,124, p<0.001) and a main effect of electrode location (F=25.9, df=1,124, p<0.001). The infrequent tone had a significantly higher PLI value (0.54 ± 0.01) than the frequent tone (0.34 ± 0.01). Grand means revealed that frontal cortex had significantly higher PLI values (0.48 ± 0.01) than parietal cortex (0.4 ± 0.01). Exploratory repeated measures ANOVA revealed that periadolescent rats had significantly higher PLI levels than adult rats to the infrequent tone in the delta (F=19.3, df=1,32, p<0.001) frequencies in FCTX and lower PLI values in the alpha (F=8.7, df=1,32, p= 0.006) frequencies in PCTX, data presented in Figure 4b and Table 4. Grand averages of the PLI values for periadolescent and adult rats are presented in Figure 8.
Figure 8.
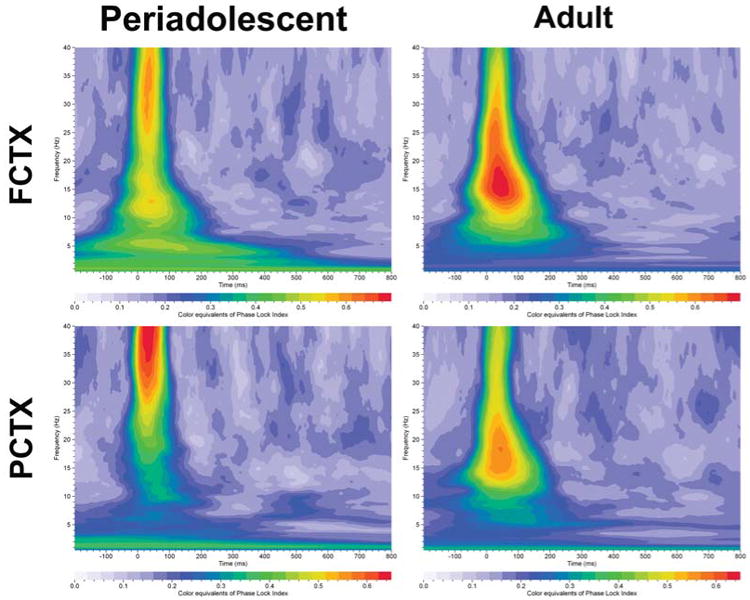
Grand averages of PLI (phase lock index) for event–related oscillations (EROs) in rats (periadolescents n=13, adults n=18). Each graph depicts a time-frequency representation of phase angle synchrony in adolescent and adult rats following the infrequent (target) tone in two electrode locations (FCTX=frontal cortex, PCTX=parietal cortex). In each graph frequency (Hz) is presented on the Y-axis, time regions of interest on the X-axis (msec) and PLI is presented as color equivalents as indicated on the bar at the bottom of each graph.
An evaluation of PDLI values in the rats for the electrode pair FCTX and PCTX using MANOVA revealed a main effect of group (periadolescents vs. adults: F=75.1, df=1,60, p<0.001), and a main effect of tone (frequent vs. infrequent: F=65.4, df=1,60, p<0.001). The infrequent tone had a significantly higher grand mean PDLI value (0.71 ± 0.01) than the frequent tone (0.58 ± 0.01). Grand means also revealed that periadolescents had significantly lower PDLI values (0.57) than adults (0.71). ANOVA identified that for the frequently presented tone that periadolescents had significantly lower PDLI than adults for all time frequency regions of interest except delta (F values range= 18.8-52.4). The phase difference lock index (PDLI) for the electrode pair FCTX and PCTX, for the infrequent tone in adult and periadolescent rats is shown in Figure 6b and Table 5. Repeated measures ANOVA revealed that periadolescent rats had significantly lower PDLI levels than adults to the infrequent tone in the theta (F=28.9, df=1,31, p<0.001), alpha (F=45.3, df=1,31, p<0.001) and beta (F=11.1, df=1,31, p=0.002) frequency ranges.
Discussion
Brain histochemical studies have shown that during early and mid-childhood that there is a proliferation of synapses, particularly in cortical areas [60-62]. This process of synaptognesis, depending on the species, may last for months or years and is then followed by a period of selective elimination (“pruning”), during adolescence, which is partly experience-dependent (see [63-66]). During this same period a chronologic sequence of myelination of axons occurs with the prefrontal and association cortices being the last to develop [62]. It has been suggested that subcortical circuitry involving such structures as the ventral striatum, insula, and extended amygdala, that are involved in motivation and reward, may develop early in adolescence relative to frontal cortical circuits that sub-serve executive cognitive control functions, thus leading to the predisposition to behavioral disinhibition and risk-taking often seen in adolescence (see [67-68] for review).
Imaging techniques, in particular MRI and fMRI have allowed for large quantitative cross sectional and longitudinal studies of the trajectory of brain development over adolescence to be mapped (see [69-70] for review). These studies have added temporal detail to the histochemical studies and have demonstrated that cortical volume decreases across adolescence while white matter volume increases, particularly in the prefrontal cortex [71]. A different approach has been accomplished by studies utilizing Graph Theory analyses to evaluate patterns of low frequency temporal correlations in fMRI signal to determine how network characteristics of brain-wide patterns may change from childhood to adulthood. These studies suggest that in childhood brain networks are more localized with the functional connectivity being more short range, whereas in adults the networks are spread out over larger areas with more long-range connections [72-75]. While these structural studies provide important information on the trajectory of brain development they shed less light on how changes in cognitive functions are related to brain activity in specific neuronal networks, in real time, and how those functions might change over the lifespan [76].
Macroelectrophysiological recordings reflect the activity of large-scale neuronal assemblies and have the potential to index information processing changes during development. A body of knowledge is beginning to emerge that suggests that the phase locking of frequency specific, neuro-oscillatory activity within and between neural assemblies may underlie the processes whereby the brain organizes and communicates information [22, 33, 77-79]. Phase locking of event-related oscillations (EROs) represents a methodology whereby neuronal synchrony can be quantified and compared among experimental conditions in both humans and animals providing thereby a translatable measure with which to explore the neural basis of the behavioral changes associated with development.
Event-related oscillations over the spectral range of the EEG (generally between 1-50 Hz, although responses at lower and higher frequencies have also been reported [80-82], have been suggested to underlie a number of different cognitive processes. For instance, event-related alpha oscillations have been attributed to attentional resources, semantic memory, and stimulus processing [83-88], whereas, beta and gamma oscillations have been suggested to be involved with sensory integrative processes [89-91]. Oscillations in the delta and theta frequency ranges have been associated with signal detection, decision-making, conscious awareness, recognition memory and episodic retrieval [29, 79, 84, 92-96]. It has been suggested that high frequency oscillations (above 30 Hz) reflect synchronization of neuronal ensembles that are interacting over short distances in response to primarily sensory processes [97-98], whereas, lower frequency oscillations (1-4 Hz) are generated by synchronization of ensembles interacting at longer distances during higher cognitive processing [99-100].
Infrequent tones produce higher phase locking than frequently presented tones independent of task
In our study, the presentation of an auditory infrequently presented (rare/target) stimulus produced a robust and highly significant increase in phase locking of EROs, as compared to the frequently presented stimulus, both within and between brain areas in all frequency bands. Higher phase-locking to target vs. non target tones in a number of ERO frequency ranges has been reported previously in human subjects [101-104]. In most cases the authors ascribed the differences in phase locking to the response requirements, and or salience of the stimulus. In the present study we compared responses to infrequent tones that required response (active task) to those that did not (passive task). We found that the effect of the tone characteristics (amplitude, frequency) produced more significant and robust differences in EROs than the effect of the task. We suggest that in this simple sensory paradigm the most likely explanation of this finding is that the results observed represent a change in neural state associated with attending to a more novel, possibly environmentally relevant noise rather than to any task requirements or salience. These findings are consistent with a previous study that evaluated phase locking of EROs using a complex motor-learning task [105]. In that task, long-range theta phase coherence was stronger in the novel condition compared to learned sequences, independent of task-difficulty. The authors interpreted those findings as a reflection of an increase in the amount of sensory information necessary to integrate novel sequences as compared to learned sequences. Our studies demonstrate that changes in the stimulus characteristics in simple auditory tasks can also produce widespread changes in phase locking over a number of brain areas in the full range of the EEG frequencies (1-50 Hz). It has been suggested that the processing of sensory information, such as those used in our simple auditory task, is primarily guided by automatic “bottom up” processes that do not require as much mental processing [106]. Such effects may be mediated by mesencephalic reticular activation of cortical activity [107].
Developmental findings in ERO energy and phase locking in humans and rats
The main goal of the present study was to investigate the effects of periadolescent to young adult development on energy and phase locking of EROs within and between brain areas in order to identify electrophysiological indices of brain development that occur in both rats and humans. Although a number of studies have presented data suggesting that phase locking of EROs is correlated with various cognitive functions, fewer studies have applied this methodology in translational studies in rodents. In the present study developmental differences consisting of significantly higher ERO energy in all frequency ranges (delta, theta, alpha, and beta) in all three electrode sites (FZ, CZ, PZ) for both the frequently presented tone and the infrequently (target) tone were found in the periadolescent humans as compared to the adults. Similar developmental differences were found in periadolescent rats as compared to adult rats in all frequency ranges and both electrode sites (FCTX, PCTX) except for beta frequencies in the frontal cortex. It has long been known that EEG recordings from children are dominated by high amplitude slower rhythms that diminish in amplitude and increase in frequency over the course of adolescence (see [108-112]) and that deviations from normal patterns have been associated with abnormal or delayed brain maturation [113]. It has also been suggested that gray matter loss or synaptic pruning may underlie these developmental changes seen in EEG amplitude over adolescent development [114]. However, it is still less clear how such changes in EEG spectral amplitude are related to cognitive changes also occurring during this time period. EEG spectral power reflects changes in both the size and strength of the neuronal assemblies engaged in stimulus processing and also to what extent the neural ensembles are in phase-synchronization [21, 115]. Our data suggest that both the size of the neural assemblies and their degree of phase locking are changed over adolescent development.
In the present study periadolescent humans were found to have significantly lower synchrony than adults as indexed by PLI levels in a range of frequencies over all electrode sites. Periadolescent humans also had significantly lower PDLI levels (FZ-PZ) than adults in all frequency ranges. Previous studies have evaluated PLI values over development in human participants. Lower evoked gamma power and PLI in children as compared to adults, has been previously reported using a simple visual choice-reaction task [116]. Additionally, Yordanova and colleagues [104] found that in 13-16 yr olds that gamma band response in parietal but not frontal areas were enhanced by active attending to the side of a motor target more than in 9-12 yr olds. These data suggest that gamma band responses may mature over the course of early adolescence. Changes in alpha responses over development have also been reported previously. In one study, young adults were found to have significantly lower amplitude and stronger phase-locking than children in the 6-11 yr age range [101]. More recently Muller and colleagues [40] have demonstrated that age differences in phase locking in the delta and theta frequency bands was higher for under attended than unattended conditions using a simple auditory oddball task. And, additionally, Sander and colleagues [117] have reported that older adults show higher inter-trial phase stability shortly after stimulus onset as compared to children and younger adults using a working memory task. Early phase stability has been related to working memory performance in younger adults and high-functioning older adults [118]. Taken together these studies suggest that phase synchronization increases over development in human subjects over a range of frequencies and task requirements.
Our studies are unique in that we were able to compare measures of phase locking over a wide range of frequency bands during periadolescent to adult development in rats and compare their responses using a similar task to humans. In our studies both periadolescent rats and humans were found to have higher energy, and lower PDLI values than the adults of their species over a wide range of frequency bands. We found that although rats had similar findings to humans on measures of PLI, the results were not as robust and only occurred in the infrequently presented tone in one frequency band. One explanation of these findings is that the rats were only evaluated in a passive task. When we compared the results of our active and passive ERP tasks, in human subjects, we found that ERO energy and PDLI did not differ between tasks. However, PLI values were found to differ between the active and passive tasks with the frequently presented tone being less attended to in the active task. Taken together these data suggest that PLI values are sensitive to task requirements and thus may have less comparative value between humans and rodents that are not performing the same task.
Reductions in phase locking and/or measures of coherence between brain areas in children as compared to adults have been reported previously in human subjects [40]. It has been suggested that phase locking of EROs within a brain area (PLI) may differ from phase locking of EROs between brain areas (PDLI) in terms of both the cognitive and neuroanatomical substrates of the effects. Local phase synchronization most likely reflects maturation in inhibitory-excitatory dynamics within local circuits that may be influenced by such processes as synaptic pruning and local structural reorganization [5, 11]. Synchronization between brain areas may rely on communication between brain areas that are influenced by such factors as maturation of white matter during development [15]. Vakorin et al. [119] and others (see [120-121]) have suggested that increased integration between distributed neuronal populations is the key factor contributing to the “increased complexity” of brain signals that occurs during development. They have further suggested that over development less information is processed locally and more information is processed over distributed circuits in the brain [119]. Our study suggests that the increase in synchrony between brain areas increases over development not only in human subjects but also in rodents.
One limitation of our study is the question of whether the functions of the brain areas recorded from in rodents can be compared to humans. There has been much debate on the larger question of whether brain areas can be compared between species, especially whether non primate species have a prefrontal cortex that is homologous to humans (see [122] for review). In fact, it has been suggested that prefrontal cortex is present in rodents, carnivores and other orders of Class Mammalia and that mammals possess a “class common” pattern of frontal lobe organization [123]. However, it has been also suggested that specific areas of frontal cortex, such as the dorsolateral prefrontal cortex, does not have a homologue in the rat similar to what is seen in primates [122]. Another limitation of our study was that brain size differences between periadolescents and adults and between species may limit interpretation of the data even though the electrode locations were corrected for size differences. In humans it has been suggested that differences in EEG amplitude between children and adults may be due to skull thickness [124]. However, this cannot be the case in the present study in the rats as all recordings were made with implanted electrodes, which eliminates the issue of skull thickness. Another limitation was that ERO comparisons between species were restricted to the use of a simple passive task and/or comparisons of non-attended tones. This may restrict the usefulness of these electrophysiological indices of development with respect to their relationship to cognitive development and/or task requirements. However, recent studies using measures of multivariate pattern classification analysis to examine maturation in task-induced brain activation and in functional connectivity during adolescence have found that functional brain maturation in adolescence is driven by a common process across cognitive tasks as opposed to being task specific [125]. The authors further proposed that brain connectivity changes over the course of adolescence affect brain functionality at a basic level that is common in the simplest go-no-go task and in a complex gambling task [125]. We have concluded that it is likely that recordings from simple auditory tasks can be reasonably compared between rodents and humans, but that more complex tasks may not be comparable. However, fundamental differences that occur in brain synchrony over development may be conserved independent of task difficulty.
Conclusion
Using a similar auditory event-related potential paradigm in both rats and humans we investigated the energy and phase variability of EROs. No significant changes were found in measures of ERO energy between the frequent and infrequent tones or between the active and passive tasks in periadolescent humans. Neuronal synchrony as indexed by PLI and PDLI was significantly higher to the infrequent (target) tone as compared to the frequent (non-target) tone in all brain sites in all of the ROI time frequency intervals. There was a smaller but significant increase in PLI but not PDLI as a function of “active” task requirements in periadolescent humans. Developmental differences consisting of significantly higher ERO energy in all frequency ranges (delta, theta, alpha, beta) in all three electrode sites (FZ, CZ, PZ), in the periadolescent humans as compared to the adults and in periadolescent rats in all frequencies in PCTX and all but beta in FCTX as compared to adult rats. Periadolescent humans were found to have significantly lower synchrony than adults as indexed by lower PLI levels in the delta and theta frequency ranges in all three electrode sites (FZ, CZ, PZ). Periadolescent humans had significantly lower PDLI levels (FZ-PZ) than adults in all frequency ranges. Periadolescent rats also had lower PLI values than adults in the alpha frequencies in PCTX, and lower PDLI levels than adults in the theta, alpha, and beta frequency ranges. Taken together these findings are consistent with the hypothesis that adolescent remodeling of the brain includes decreases in energy and increases in synchrony over a wide frequency range both within and between neuronal networks and that these effects are conserved over evolution.
Acknowledgments
The authors thank Shirley Sanchez and Susan Lopez for assistance in editing the manuscript.
Funding: This study was supported in part by the National Institutes of Health (NIH), National Institute on Alcoholism and Alcohol Abuse grants, AA006059, AA019969 and AA010201 awarded to CLE.
References
- 1.Spear LP. Adolescent neurobehavioral characteristics, alcohol sensitivities, and intake: Setting the stage for alcohol use disorders? Child Dev Perspect. 2011;5:231–238. doi: 10.1111/j.1750-8606.2011.00182.x. [DOI] [PMC free article] [PubMed] [Google Scholar]
- 2.Spear LP, Varlinskaya EI. Sensitivity to ethanol and other hedonic stimuli in an animal model of adolescence: implications for prevention science? Dev Psychobiol. 2010;52:236–243. doi: 10.1002/dev.20457. [DOI] [PMC free article] [PubMed] [Google Scholar]
- 3.Johnston MV. Neurotransmitters and vulnerability of the developing brain. Brain Dev. 1995;17:301–306. doi: 10.1016/0387-7604(95)00079-q. [DOI] [PubMed] [Google Scholar]
- 4.Lidow MS, Goldman-Rakic PS, Rakic P. Synchronized overproduction of neurotransmitter receptors in diverse regions of the primate cerebral cortex. Proc Natl Acad Sci U S A. 1991;88:10218–10221. doi: 10.1073/pnas.88.22.10218. [DOI] [PMC free article] [PubMed] [Google Scholar]
- 5.Seeman P. Images in neuroscience. Brain development, X: pruning during development. Am J Psychiatry. 1999;156:168. doi: 10.1176/ajp.156.2.168. [DOI] [PubMed] [Google Scholar]
- 6.van Eden CG. The development of the rat prefrontal cortex: its size and development of connections with thalamus, spinal cord and other cortical areas. In: Uylings HBM, van Eden CG, DeBruin JPC, Corner MA, Feenstra MGP, editors. Progress in brain research. Amsterdam: Elsevier Science; 1990. pp. 169–183. [DOI] [PubMed] [Google Scholar]
- 7.Giedd JN, Rumsey JM, Castellanos FX, Rajapakse JC, Kaysen D, Vaituzis AC, Vauss YC, Hamburger SD, Rapoport JL. A quantitative MRI study of the corpus callosum in children and adolescents. Brain Res Dev Brain Res. 1996;91:274–280. doi: 10.1016/0165-3806(95)00193-x. [DOI] [PubMed] [Google Scholar]
- 8.Sowell ER, Thompson PM, Holmes CJ, Batth R, Jernigan TL, Toga AW. Localizing age-related changes in brain structure between childhood and adolescence using statistical parametric mapping. Neuroimage. 1999;9:587–597. doi: 10.1006/nimg.1999.0436. [DOI] [PubMed] [Google Scholar]
- 9.Sowell ER, Thompson PM, Holmes CJ, Jernigan TL, Toga AW. In vivo evidence for post-adolescent brain maturation in frontal and striatal regions. Nat Neurosci. 1999;2:859–861. doi: 10.1038/13154. [DOI] [PubMed] [Google Scholar]
- 10.Kalsbeek A, Voorn P, Buijs RM, Pool CW, Uylings HB. Development of the dopaminergic innervation in the prefrontal cortex of the rat. J Comp Neurol. 1988;269:58–72. doi: 10.1002/cne.902690105. [DOI] [PubMed] [Google Scholar]
- 11.Kostovic I. Structural and histochemical reorganization of the human prefrontal cortex during perinatal and postnatal life. Prog Brain Res. 1990;85:223–239. doi: 10.1016/s0079-6123(08)62682-5. [DOI] [PubMed] [Google Scholar]
- 12.Gould E, Woolf NJ, Butcher LL. Postnatal development of cholinergic neurons in the rat: I. Forebrain. Brain Res Bull. 1991;27:767–789. doi: 10.1016/0361-9230(91)90209-3. [DOI] [PubMed] [Google Scholar]
- 13.Rosenberg DR, Lewis DA. Changes in the dopaminergic innervation of monkey prefrontal cortex during late postnatal development: a tyrosine hydroxylase immunohistochemical study. Biol Psychiatry. 1994;36:272–277. doi: 10.1016/0006-3223(94)90610-6. [DOI] [PubMed] [Google Scholar]
- 14.Giedd JN. Structural magnetic resonance imaging of the adolescent brain. Ann N Y Acad Sci. 2004;1021:77–85. doi: 10.1196/annals.1308.009. [DOI] [PubMed] [Google Scholar]
- 15.Giedd JN, Lenroot RK, Shaw P, Lalonde F, Celano M, White S, Tossell J, Addington A, Gogtay N. Trajectories of anatomic brain development as a phenotype. Novartis Found Symp. 2008;289:101–112. doi: 10.1002/9780470751251.ch9. [DOI] [PMC free article] [PubMed] [Google Scholar]
- 16.Spear LP. The adolescent brain and age-related behavioral manifestations. Neurosci Biobehav Rev. 2000;24:417–463. doi: 10.1016/s0149-7634(00)00014-2. [DOI] [PubMed] [Google Scholar]
- 17.Spear LP, Brake SC. Periadolescence: age-dependent behavior and psychopharmacological responsivity in rats. Dev Psychobiol. 1983;16:83–109. doi: 10.1002/dev.420160203. [DOI] [PubMed] [Google Scholar]
- 18.Varlinskaya EI, Spear LP, Spear NE. Social behavior and social motivation in adolescent rats: role of housing conditions and partner's activity. Physiol Behav. 1999;67:475–482. doi: 10.1016/s0031-9384(98)00285-6. [DOI] [PubMed] [Google Scholar]
- 19.Ojeda SR, Skinner MK. Puberty in the rat. In: Knobil E, Neill JD, editors. Knobil and Neill's physiology of reproduction. Amsterdam: Elsevier; 2006. pp. 2061–2126. [Google Scholar]
- 20.Hipp JF, Engel AK, Siegel M. Oscillatory synchronization in large-scale cortical networks predicts perception. Neuron. 2011;69:387–396. doi: 10.1016/j.neuron.2010.12.027. [DOI] [PubMed] [Google Scholar]
- 21.Lachaux JP, Rodriguez E, Martinerie J, Varela FJ. Measuring phase synchrony in brain signals. Hum Brain Mapp. 1999;8:194–208. doi: 10.1002/(SICI)1097-0193(1999)8:4<194::AID-HBM4>3.0.CO;2-C. [DOI] [PMC free article] [PubMed] [Google Scholar]
- 22.Sauseng P, Klimesch W. What does phase information of oscillatory brain activity tell us about cognitive processes? Neurosci Biobehav Rev. 2008;32:1001–1013. doi: 10.1016/j.neubiorev.2008.03.014. [DOI] [PubMed] [Google Scholar]
- 23.Basar-Eroglu C, Basar E. A compound P300-40 Hz response of the cat hippocampus. Int J Neurosci. 1991;60:227–237. doi: 10.3109/00207459109167035. [DOI] [PubMed] [Google Scholar]
- 24.Demiralp T, Ademoglu A, Istefanopulos Y, Basar-Eroglu C, Basar E. Wavelet analysis of oddball P300. Int J Psychophysiol. 2001;39:221–227. doi: 10.1016/s0167-8760(00)00143-4. [DOI] [PubMed] [Google Scholar]
- 25.Demiralp T, Ademoglu A, Comerchero M, Polich J. Wavelet analysis of P3a and P3b. Brain Topogr. 2001;13:251–267. doi: 10.1023/a:1011102628306. [DOI] [PubMed] [Google Scholar]
- 26.Karakas S, Erzengin OU, Basar E. The genesis of human event-related responses explained through the theory of oscillatory neural assemblies. Neurosci Lett. 2000;285:45–48. doi: 10.1016/s0304-3940(00)01022-3. [DOI] [PubMed] [Google Scholar]
- 27.Karakas S, Erzengin OU, Basar E. A new strategy involving multiple cognitive paradigms demonstrates that ERP components are determined by the superposition of oscillatory responses. Clin Neuropathol. 2000;111:1719–1732. doi: 10.1016/s1388-2457(00)00418-1. [DOI] [PubMed] [Google Scholar]
- 28.Schurmann M, Basar-Eroglu C, Kolev V, Basar E. A new metric for analyzing single-trial event-related potentials (ERPs): application to human visual P300 delta response. Neurosci Lett. 1995;197:167–170. doi: 10.1016/0304-3940(95)11912-g. [DOI] [PubMed] [Google Scholar]
- 29.Schurmann M, Basar-Eroglu C, Kolev V, Basar E. Delta responses and cognitive processing: single-trial evaluations of human visual P300. Int J Psychophysiol. 2001;39:229–239. doi: 10.1016/s0167-8760(00)00144-6. [DOI] [PubMed] [Google Scholar]
- 30.Yordanova J, Kolev V. Brain theta response predicts P300 latency in children. Neuroreport. 1996;8:277–280. doi: 10.1097/00001756-199612200-00055. [DOI] [PubMed] [Google Scholar]
- 31.Basar E, Basar-Eroglu C, Karakas S, Schurmann M. Brain oscillations in perception and memory. Int J Psychophysiol. 2000;35:95–124. doi: 10.1016/s0167-8760(99)00047-1. [DOI] [PubMed] [Google Scholar]
- 32.Begleiter H, Porjesz B. Genetics of human brain oscillations. Int J Psychophysiol. 2006;60:162–171. doi: 10.1016/j.ijpsycho.2005.12.013. [DOI] [PubMed] [Google Scholar]
- 33.Roach BJ, Mathalon DH. Event-related EEG time-frequency analysis: an overview of measures and an analysis of early gamma band phase locking in schizophrenia. Schizophr Bull. 2008;34:907–926. doi: 10.1093/schbul/sbn093. [DOI] [PMC free article] [PubMed] [Google Scholar]
- 34.Basar E. EEG-brain dynamics- Relation between EEG and Brain evoked potentials. Amsterdam: Elsevier/North-Holland Biomedical Press; 1980. [Google Scholar]
- 35.Makeig S, Westerfield M, Jung TP, Enghoff S, Townsend J, Courchesne E, Sejnowski TJ. Dynamic brain sources of visual evoked responses. Science. 2002;295:690–694. doi: 10.1126/science.1066168. [DOI] [PubMed] [Google Scholar]
- 36.Criado JR, Ehlers CL. Event-related oscillations as risk markers in genetic mouse models of high alcohol preference. Neuroscience. 2009;163:506–523. doi: 10.1016/j.neuroscience.2009.06.039. [DOI] [PMC free article] [PubMed] [Google Scholar]
- 37.Criado JR, Ehlers CL. Event-related oscillations in the parietal cortex of adult alcohol-preferring (P) and alcohol-nonpreferring rats (NP) Alcohol. 2010;44:335–342. doi: 10.1016/j.alcohol.2010.02.004. [DOI] [PMC free article] [PubMed] [Google Scholar]
- 38.Criado JR, Ehlers CL. Effects of adolescent ethanol exposure on event-related oscillations (EROs) in the hippocampus of adult rats. Behav Brain Res. 2010;210:164–170. doi: 10.1016/j.bbr.2010.02.021. [DOI] [PMC free article] [PubMed] [Google Scholar]
- 39.Ehlers CL, Criado JR. Event-related oscillations in mice: effects of stimulus characteristics. J Neurosci Methods. 2009;181:52–57. doi: 10.1016/j.jneumeth.2009.04.015. [DOI] [PMC free article] [PubMed] [Google Scholar]
- 40.Muller V, Gruber W, Klimesch W, Lindenberger U. Lifespan differences in cortical dynamics of auditory perception. Dev Sci. 2009;12:839–853. doi: 10.1111/j.1467-7687.2009.00834.x. [DOI] [PubMed] [Google Scholar]
- 41.Brinkman MJ, Stauder JE. The development of passive auditory novelty processing. Int J Psychophysiol. 2008;70:33–39. doi: 10.1016/j.ijpsycho.2008.04.005. [DOI] [PubMed] [Google Scholar]
- 42.Ehlers CL, Garcia-Andrade C, Wall TL, Sobel DF, Phillips E. Determinants of P3 amplitude and response to alcohol in Native American Mission Indians. Neuropsychopharmacology. 1998;18:282–292. doi: 10.1016/S0893-133X(97)00160-7. [DOI] [PubMed] [Google Scholar]
- 43.Schuckit MA. Subjective responses to alcohol in sons of alcoholics and control subjects. Arch Gen Psychiatry. 1984;41:879–884. doi: 10.1001/archpsyc.1984.01790200061008. [DOI] [PubMed] [Google Scholar]
- 44.Schuckit MA, Gold EO. A simultaneous evaluation of multiple markers of ethanol/placebo challenges in sons of alcoholics and controls. Arch Gen Psychiatry. 1988;45:211–216. doi: 10.1001/archpsyc.1988.01800270019002. [DOI] [PubMed] [Google Scholar]
- 45.American Psychiatric Association. Diagnosis and statistical manual of mental disorders (DSM-III) Washington, DC: American Psychiatric Association; 1980. [Google Scholar]
- 46.Ehlers CL, Phillips E, Parry BL. Electrophysiological findings during the menstrual cycle in women with and without late luteal phase dysphoric disorder: relationship to risk for alcoholism? Biol Psychiatry. 1996;39:720–732. doi: 10.1016/0006-3223(95)00183-2. [DOI] [PubMed] [Google Scholar]
- 47.Ehlers CL, Wills DN, Havstad J. Ethanol reduces the phase locking of neural activity in human and rodent brain. Brain Res. 2012;1450:67–79. doi: 10.1016/j.brainres.2012.02.039. [DOI] [PMC free article] [PubMed] [Google Scholar]
- 48.Kaneko WM, Ehlers CL, Philips EL, Riley EP. Auditory event-related potentials in fetal alcohol syndrome and Down's syndrome children. Alcohol Clin Exp Res. 1996;20:35–42. doi: 10.1111/j.1530-0277.1996.tb01040.x. [DOI] [PubMed] [Google Scholar]
- 49.Ehlers CL, Wall TL, Garcia-Andrade C, Phillips E. Auditory P3 findings in mission Indian youth. J Stud Alcohol. 2001;62:562–570. doi: 10.15288/jsa.2001.62.562. [DOI] [PubMed] [Google Scholar]
- 50.Ehlers CL, Wall TL, Garcia-Andrade C, Phillips E. Effects of age and parental history of alcoholism on EEG findings in mission Indian children and adolescents. Alcohol Clin Exp Res. 2001;25:672–679. [PubMed] [Google Scholar]
- 51.Ehlers CL, Wall TL, Garcia-Andrade C, Phillips E. EEG asymmetry: relationship to mood and risk for alcoholism in Mission Indian youth. Biol Psychiatry. 2001;50:129–136. doi: 10.1016/s0006-3223(01)01132-5. [DOI] [PubMed] [Google Scholar]
- 52.Ehlers CL, Wall TL, Garcia-Andrade C, Phillips E. Visual P3 findings in Mission Indian youth: relationship to family history of alcohol dependence and behavioral problems. Psychiatry Res. 2001;105:67–78. doi: 10.1016/s0165-1781(01)00313-4. [DOI] [PubMed] [Google Scholar]
- 53.Wall TL, Ehlers CL. Acute effects of alcohol on P300 in Asians with different ALDH2 genotypes. Alcohol Clin Exp Res. 1995;19:617–622. doi: 10.1111/j.1530-0277.1995.tb01557.x. [DOI] [PubMed] [Google Scholar]
- 54.Ehlers CL, Havstad J, Prichard D, Theiler J. Low doses of ethanol reduce evidence for nonlinear structure in brain activity. J Neurosci. 1998;18:7474–7486. doi: 10.1523/JNEUROSCI.18-18-07474.1998. [DOI] [PMC free article] [PubMed] [Google Scholar]
- 55.Gabor D. Theory of Communication. J Inst Elec Eng. 1946;93:429–457. [Google Scholar]
- 56.Stockwell RG, Mansinha L, Lowe RP. Localization of the complex spectrum: The S Transform. IEEE Trans on Signal Processing. 1996;44:998–1001. [Google Scholar]
- 57.Jones KA, Porjesz B, Almasy L, Bierut L, Goate A, Wang JC, Dick DM, Hinrichs A, Kwon J, Rice JP, Rohrbaugh J, Stock H, Wu W, Bauer LO, Chorlian DB, Crowe RR, Edenberg HJ, Foroud T, Hesselbrock V, Kuperman S, Nurnberger J, Jr, O'Connor SJ, Schuckit MA, Stimus AT, Tischfield JA, Reich T, Begleiter H. Linkage and linkage disequilibrium of evoked EEG oscillations with CHRM2 receptor gene polymorphisms: implications for human brain dynamics and cognition. Int J Psychophysiol. 2004;53:75–90. doi: 10.1016/j.ijpsycho.2004.02.004. [DOI] [PubMed] [Google Scholar]
- 58.Schack B, Klimesch W. Frequency characteristics of evoked and oscillatory electroencephalic activity in a human memory scanning task. Neurosci Lett. 2002;331:107–110. doi: 10.1016/s0304-3940(02)00846-7. [DOI] [PubMed] [Google Scholar]
- 59.Brunner C, Graimann B, Huggins JE, Levine SP, Pfurtscheller G. Phase relationships between different subdural electrode recordings in man. Neurosci Lett. 2005;375:69–74. doi: 10.1016/j.neulet.2004.11.052. [DOI] [PubMed] [Google Scholar]
- 60.Huttenlocher PR. Synaptic density in human frontal cortex - developmental changes and effects of aging. Brain Res. 1979;163:195–205. doi: 10.1016/0006-8993(79)90349-4. [DOI] [PubMed] [Google Scholar]
- 61.Huttenlocher PR, de Court, Garey LJ, Van der LH. Synaptic development in human cerebral cortex. Int J Neurol. 1982;16-17:144–154. [PubMed] [Google Scholar]
- 62.Yakovlev P, Lecours A. The myelogenetic cycles of regional maturation of the brain. In: Minkowski A, Council for International Organizations of Medical Science; Délégation g, editors. Regional development of the brain in early life:a symposium organized by the Council for International Organizations of Medical Sciences (established under the joint auspices of UNESCO & WHO) and by the Délégation à la recherche scientifique et technique. Oxford: Blackwell; 1967. pp. 3–70. [Google Scholar]
- 63.Cragg BG. The density of synapses and neurons in normal, mentally defective ageing human brains. Brain. 1975;98:81–90. doi: 10.1093/brain/98.1.81. [DOI] [PubMed] [Google Scholar]
- 64.Changeux JP, Danchin A. Selective stabilisation of developing synapses as a mechanism for the specification of neuronal networks. Nature. 1976;264:705–712. doi: 10.1038/264705a0. [DOI] [PubMed] [Google Scholar]
- 65.Low LK, Cheng HJ. Axon pruning: an essential step underlying the developmental plasticity of neuronal connections. Philos Trans R Soc Lond B Biol Sci. 2006;361:1531–1544. doi: 10.1098/rstb.2006.1883. [DOI] [PMC free article] [PubMed] [Google Scholar]
- 66.Petanjek Z, Judas M, Simic G, Rasin MR, Uylings HB, Rakic P, Kostovic I. Extraordinary neoteny of synaptic spines in the human prefrontal cortex. Proc Natl Acad Sci U S A. 2011;108:13281–13286. doi: 10.1073/pnas.1105108108. [DOI] [PMC free article] [PubMed] [Google Scholar]
- 67.Somerville LH, Casey BJ. Developmental neurobiology of cognitive control and motivational systems. Curr Opin Neurobiol. 2010;20:236–241. doi: 10.1016/j.conb.2010.01.006. [DOI] [PMC free article] [PubMed] [Google Scholar]
- 68.Wetherill R, Tapert SF. Adolescent Brain Development, Substance Use, and Psychotherapeutic Change. Psychol Addict Behav. 2012;27:393–402. doi: 10.1037/a0029111. [DOI] [PMC free article] [PubMed] [Google Scholar]
- 69.Paus T. Growth of white matter in the adolescent brain: myelin or axon? Brain Cogn. 2010;72:26–35. doi: 10.1016/j.bandc.2009.06.002. [DOI] [PubMed] [Google Scholar]
- 70.Blakemore SJ. Imaging brain development: the adolescent brain. Neuroimage. 2012;61:397–406. doi: 10.1016/j.neuroimage.2011.11.080. [DOI] [PubMed] [Google Scholar]
- 71.Giedd JN. The teen brain: insights from neuroimaging. J Adolesc Health. 2008;42:335–343. doi: 10.1016/j.jadohealth.2008.01.007. [DOI] [PubMed] [Google Scholar]
- 72.Fair DA, Cohen AL, Power JD, Dosenbach NU, Church JA, Miezin FM, Schlaggar BL, Petersen SE. Functional brain networks develop from a “local to distributed” organization. PLoS Comput Biol. 2009;5:e1000381. doi: 10.1371/journal.pcbi.1000381. [DOI] [PMC free article] [PubMed] [Google Scholar]
- 73.Kelly AM, Di MA, Uddin LQ, Shehzad Z, Gee DG, Reiss PT, Margulies DS, Castellanos FX, Milham MP. Development of anterior cingulate functional connectivity from late childhood to early adulthood. Cereb Cortex. 2009;19:640–657. doi: 10.1093/cercor/bhn117. [DOI] [PubMed] [Google Scholar]
- 74.Power JD, Fair DA, Schlaggar BL, Petersen SE. The development of human functional brain networks. Neuron. 2010;67:735–748. doi: 10.1016/j.neuron.2010.08.017. [DOI] [PMC free article] [PubMed] [Google Scholar]
- 75.Vogel AC, Power JD, Petersen SE, Schlaggar BL. Development of the brain's functional network architecture. Neuropsychol Rev. 2010;20:362–375. doi: 10.1007/s11065-010-9145-7. [DOI] [PMC free article] [PubMed] [Google Scholar]
- 76.Lindenberger U, Li SC, Backman L. Delineating brain-behavior mappings across the lifespan: substantive and methodological advances in developmental neuroscience. Neurosci Biobehav Rev. 2006;30:713–717. doi: 10.1016/j.neubiorev.2006.06.006. [DOI] [PubMed] [Google Scholar]
- 77.Basar E, Basar-Eroglu C, Karakas S, Schurmann M. Oscillatory brain theory: a new trend in neuroscience. IEEE Eng Med Biol Mag. 1999;18:56–66. doi: 10.1109/51.765190. [DOI] [PubMed] [Google Scholar]
- 78.Basar E, Demiralp T, Schurmann M, Basar-Eroglu C, Ademoglu A. Oscillatory brain dynamics, wavelet analysis, and cognition. Brain Lang. 1999;66:146–183. doi: 10.1006/brln.1998.2029. [DOI] [PubMed] [Google Scholar]
- 79.Basar E, Basar-Eroglu C, Karakas S, Schurmann M. Are cognitive processes manifested in event-related gamma, alpha, theta and delta oscillations in the EEG? Neurosci Lett. 1999;259:165–168. doi: 10.1016/s0304-3940(98)00934-3. [DOI] [PubMed] [Google Scholar]
- 80.Curio G, Mackert BM, Burghoff M, Koetitz R, braham-Fuchs K, Harer W. Localization of evoked neuromagnetic 600 Hz activity in the cerebral somatosensory system. Electroencephalogr Clin Neurophysiol. 1994;91:483–487. doi: 10.1016/0013-4694(94)90169-4. [DOI] [PubMed] [Google Scholar]
- 81.Monto S, Palva S, Voipio J, Palva JM. Very slow EEG fluctuations predict the dynamics of stimulus detection and oscillation amplitudes in humans. J Neurosci. 2008;28:8268–8272. doi: 10.1523/JNEUROSCI.1910-08.2008. [DOI] [PMC free article] [PubMed] [Google Scholar]
- 82.Xiang J, Liu Y, Wang Y, Kotecha R, Kirtman EG, Chen Y, Huo X, Fujiwara H, Hemasilpin N, Degrauw T, Rose D. Neuromagnetic correlates of developmental changes in endogenous high-frequency brain oscillations in children: a wavelet-based beamformer study. Brain Res. 2009;1274:28–39. doi: 10.1016/j.brainres.2009.03.068. [DOI] [PubMed] [Google Scholar]
- 83.Basar E, Yordanova J, Kolev V, Basar-Eroglu C. Is the alpha rhythm a control parameter for brain responses? Biol Cybern. 1997;76:471–480. doi: 10.1007/s004220050360. [DOI] [PubMed] [Google Scholar]
- 84.Klimesch W, Schimke H, Schwaiger J. Episodic and semantic memory: an analysis in the EEG theta and alpha band. Electroencephalogr Clin Neurophysiol. 1994;91:428–441. doi: 10.1016/0013-4694(94)90164-3. [DOI] [PubMed] [Google Scholar]
- 85.Klimesch W, Doppelmayr M, Schimke H, Ripper B. Theta synchronization and alpha desynchronization in a memory task. Psychophysiology. 1997;34:169–176. doi: 10.1111/j.1469-8986.1997.tb02128.x. [DOI] [PubMed] [Google Scholar]
- 86.Klimesch W, Doppelmayr M, Pachinger T, Ripper B. Brain oscillations and human memory: EEG correlates in the upper alpha and theta band. Neurosci Lett. 1997;238:9–12. doi: 10.1016/s0304-3940(97)00771-4. [DOI] [PubMed] [Google Scholar]
- 87.Klimesch W, Sauseng P, Hanslmayr S. EEG alpha oscillations: the inhibition-timing hypothesis. Brain Res Rev. 2007;53:63–88. doi: 10.1016/j.brainresrev.2006.06.003. [DOI] [PubMed] [Google Scholar]
- 88.Klimesch W. Evoked alpha and early access to the knowledge system: the P1 inhibition timing hypothesis. Brain Res. 2011;1408:52–71. doi: 10.1016/j.brainres.2011.06.003. [DOI] [PMC free article] [PubMed] [Google Scholar]
- 89.Basar E, Basar-Eroglu C, Karakas S, Schurmann M. Gamma, alpha, delta, and theta oscillations govern cognitive processes. Int J Psychophysiol. 2001;39:241–248. doi: 10.1016/s0167-8760(00)00145-8. [DOI] [PubMed] [Google Scholar]
- 90.Basar E, Schurmann M, Demiralp T, Basar-Eroglu C, Ademoglu A. Event-related oscillations are ‘real brain responses’--wavelet analysis and new strategies. Int J Psychophysiol. 2001;39:91–127. doi: 10.1016/s0167-8760(00)00135-5. [DOI] [PubMed] [Google Scholar]
- 91.Schurmann M, Basar-Eroglu C, Basar E. Gamma responses in the EEG: elementary signals with multiple functional correlates. Neuroreport. 1997;8:531–534. doi: 10.1097/00001756-199701200-00030. [DOI] [PubMed] [Google Scholar]
- 92.Basar E, Schurmann M, Basar-Eroglu C, Demiralp T. Selectively distributed gamma band system of the brain. Int J Psychophysiol. 2001;39:129–135. doi: 10.1016/s0167-8760(00)00136-7. [DOI] [PubMed] [Google Scholar]
- 93.Basar E, Schurmann M, Sakowitz O. The selectively distributed theta system: functions. Int J Psychophysiol. 2001;39:197–212. doi: 10.1016/s0167-8760(00)00141-0. [DOI] [PubMed] [Google Scholar]
- 94.Doppelmayr M, Klimesch W, Schwaiger J, Auinger P, Winkler T. Theta synchronization in the human EEG and episodic retrieval. Neurosci Lett. 1998;257:41–44. doi: 10.1016/s0304-3940(98)00805-2. [DOI] [PubMed] [Google Scholar]
- 95.Gevins A, Smith ME, Leong H, McEvoy L, Whitfield S, Du R, Rush G. Monitoring working memory load during computer-based tasks with EEG pattern recognition methods. Hum Factors. 1998;40:79–91. doi: 10.1518/001872098779480578. [DOI] [PubMed] [Google Scholar]
- 96.Klimesch W, Doppelmayr M, Stadler W, Pollhuber D, Sauseng P, Rohm D. Episodic retrieval is reflected by a process specific increase in human electroencephalographic theta activity. Neurosci Lett. 2001;302:49–52. doi: 10.1016/s0304-3940(01)01656-1. [DOI] [PubMed] [Google Scholar]
- 97.Bressler SL, Freeman WJ. Frequency analysis of olfactory system EEG in cat, rabbit, and rat. Electroencephalogr Clin Neurophysiol. 1980;50:19–24. doi: 10.1016/0013-4694(80)90319-3. [DOI] [PubMed] [Google Scholar]
- 98.Ohl FW, Deliano M, Scheich H, Freeman WJ. Early and late patterns of stimulus-related activity in auditory cortex of trained animals. Biol Cybern. 2003;88:374–379. doi: 10.1007/s00422-002-0389-z. [DOI] [PubMed] [Google Scholar]
- 99.Kopell N, Ermentrout GB, Whittington MA, Traub RD. Gamma rhythms and beta rhythms have different synchronization properties. Proc Natl Acad Sci U S A. 2000;97:1867–1872. doi: 10.1073/pnas.97.4.1867. [DOI] [PMC free article] [PubMed] [Google Scholar]
- 100.Lubar JF. Neocortical dynamics: implications for understanding the role of neurofeedback and related techniques for the enhancement of attention. Appl Psychophysiol Biofeedback. 1997;22:111–126. doi: 10.1023/a:1026276228832. [DOI] [PubMed] [Google Scholar]
- 101.Yordanova J, Kolev V. Alpha response system in children: changes with age. Int J Psychophysiol. 1997;26:411–430. doi: 10.1016/s0167-8760(97)00779-4. [DOI] [PubMed] [Google Scholar]
- 102.Yordanova J, Kolev V, Demiralp T. Effects of task variables on the amplitude and phase-locking of auditory gamma band responses in human. Int J Neurosci. 1997;92:241–258. doi: 10.3109/00207459708986404. [DOI] [PubMed] [Google Scholar]
- 103.Muller V, Anokhin AP. Neural synchrony during response production and inhibition. PLoS ONE. 2012;7:e38931. doi: 10.1371/journal.pone.0038931. [DOI] [PMC free article] [PubMed] [Google Scholar]
- 104.Yordanova J, Kolev V, Heinrich H, Woerner W, Banaschewski T, Rothenberger A. Developmental event-related gamma oscillations: effects of auditory attention. Eur J Neurosci. 2002;16:2214–2224. doi: 10.1046/j.1460-9568.2002.02286.x. [DOI] [PubMed] [Google Scholar]
- 105.Sauseng P, Klimesch W, Gruber WR, Hanslmayr S, Freunberger R, Doppelmayr M. Are event-related potential components generated by phase resetting of brain oscillations? A critical discussion. Neuroscience. 2007;146:1435–1444. doi: 10.1016/j.neuroscience.2007.03.014. [DOI] [PubMed] [Google Scholar]
- 106.Klimesch W, Sauseng P, Hanslmayr S, Gruber W, Freunberger R. Event-related phase reorganization may explain evoked neural dynamics. Neurosci Biobehav Rev. 2007;31:1003–1016. doi: 10.1016/j.neubiorev.2007.03.005. [DOI] [PubMed] [Google Scholar]
- 107.Munk MH, Roelfsema PR, Konig P, Engel AK, Singer W. Role of reticular activation in the modulation of intracortical synchronization. Science. 1996;272:271–274. doi: 10.1126/science.272.5259.271. [DOI] [PubMed] [Google Scholar]
- 108.Boord PR, Rennie CJ, Williams LM. Integrating “brain” and “body” measures: correlations between EEG and metabolic changes over the human lifespan. J Integr Neurosci. 2007;6:205–218. doi: 10.1142/s0219635207001416. [DOI] [PubMed] [Google Scholar]
- 109.Clarke AR, Barry RJ, McCarthy R, Selikowitz M. Age and sex effects in the EEG: development of the normal child. Clin Neurophysiol. 2001;112:806–814. doi: 10.1016/s1388-2457(01)00488-6. [DOI] [PubMed] [Google Scholar]
- 110.Gasser T, Verleger R, Bacher P, Sroka L. Development of the EEG of school-age children and adolescents. I. Analysis of band power. Electroencephalogr Clin Neurophysiol. 1988;69:91–99. doi: 10.1016/0013-4694(88)90204-0. [DOI] [PubMed] [Google Scholar]
- 111.Klimesch W. EEG alpha and theta oscillations reflect cognitive and memory performance: a review and analysis. Brain Res Brain Res Rev. 1999;29:169–195. doi: 10.1016/s0165-0173(98)00056-3. [DOI] [PubMed] [Google Scholar]
- 112.Rodriguez-Martinez E, Barriga-Paulino C, Zapata M, Chinchilla C, Lopez-Jimenez A, Gomez C. Narrow band quantitative and multivariate electroencephalogram analysis of peri-adolescent period. BMC Neurosci. 2012;13:104. doi: 10.1186/1471-2202-13-104. [DOI] [PMC free article] [PubMed] [Google Scholar]
- 113.John ER, Ahn H, Prichep L, Trepetin M, Brown D, Kaye H. Developmental equations for the electroencephalogram. Science. 1980;210:1255–1258. doi: 10.1126/science.7434026. [DOI] [PubMed] [Google Scholar]
- 114.Whitford TJ, Rennie CJ, Grieve SM, Clark CR, Gordon E, Williams LM. Brain maturation in adolescence: concurrent changes in neuroanatomy and neurophysiology. Hum Brain Mapp. 2007;28:228–237. doi: 10.1002/hbm.20273. [DOI] [PMC free article] [PubMed] [Google Scholar]
- 115.Tass P, Rosenblum MG, Weule J, Kurths J, Pikovsky A, Volkmann J, Schnitzler A, Freund HJ. Detection of n:m phase locking from nosiy data: application to magnetoencephalography. Phys Rev Lett. 1998;81:3291–3294. [Google Scholar]
- 116.Werkle-Bergner M, Shing YL, Muller V, Li SC, Lindenberger U. EEG gamma-band synchronization in visual coding from childhood to old age: evidence from evoked power and inter-trial phase locking. Clin Neurophysiol. 2009;120:1291–1302. doi: 10.1016/j.clinph.2009.04.012. [DOI] [PubMed] [Google Scholar]
- 117.Sander MC, Werkle-Bergner M, Lindenberger U. Amplitude modulations and inter-trial phase stability of alpha-oscillations differentially reflect working memory constraints across the lifespan. Neuroimage. 2012;59:646–654. doi: 10.1016/j.neuroimage.2011.06.092. [DOI] [PubMed] [Google Scholar]
- 118.Werkle-Bergner M, Freunberger R, Sander MC, Lindenberger U, Klimesch W. Inter-individual performance differences in younger and older adults differentially relate to amplitude modulations and phase stability of oscillations controlling working memory contents. Neuroimage. 2012;60:71–82. doi: 10.1016/j.neuroimage.2011.11.071. [DOI] [PubMed] [Google Scholar]
- 119.Vakorin VA, Lippe S, McIntosh AR. Variability of brain signals processed locally transforms into higher connectivity with brain development. J Neurosci. 2011;31:6405–6413. doi: 10.1523/JNEUROSCI.3153-10.2011. [DOI] [PMC free article] [PubMed] [Google Scholar]
- 120.Thatcher RW, North D, Biver C. EEG and intelligence: relations between EEG coherence, EEG phase delay and power. Clin Neurophysiol. 2005;116:2129–2141. doi: 10.1016/j.clinph.2005.04.026. [DOI] [PubMed] [Google Scholar]
- 121.Thatcher RW, North DM, Biver CJ. Development of cortical connections as measured by EEG coherence and phase delays. Hum Brain Mapp. 2008;29:1400–1415. doi: 10.1002/hbm.20474. [DOI] [PMC free article] [PubMed] [Google Scholar]
- 122.Preuss TM. Do rats have prefrontal cortex? The Rose-Woolsey-Akert program reconsidered. J Cogn Neurosci. 1995;7:1–24. doi: 10.1162/jocn.1995.7.1.1. [DOI] [PubMed] [Google Scholar]
- 123.Kolb B, Whishaw IQ. Fundamentals of human neuropsychology. 3rd. New York: W.H. Freeman; 1990. [Google Scholar]
- 124.Frodl T, Meisenzahl EM, Muller D, Leinsinger G, Juckel G, Hahn K, Moller HJ, Hegerl U. The effect of the skull on event-related P300. Clin Neurophysiol. 2001;112:1773–1776. doi: 10.1016/s1388-2457(01)00587-9. [DOI] [PubMed] [Google Scholar]
- 125.Keulers EH, Goulas A, Jolles J, Stiers P. Maturation of task-induced brain activation and long range functional connectivity in adolescence revealed by multivariate pattern. 2012 doi: 10.1016/j.neuroimage.2011.12.079. [DOI] [PubMed] [Google Scholar]