

Abstract
Background
Acute myelogenous leukemia (AML) associated with core binding factor abnormalities (CBF) is the type of leukemia most responsive to cytarabine (ara-C) therapy and is of relative favorable prognosis. In vitro and ex vivo observations suggest that increases in intra-cellular ara-C levels influenced by administration of fludarabine and granulocyte colony stimulating factor (GCSF) increase the effect of ara-C; prompting us to clinically evaluate the efficacy of such combinations.
Methods
We analyzed the event free survival of patients with newly diagnosed CBF AML treated with fludarabine and ara-C (FA) (N=45) or with FA and GCSF (FLAG)(N=22) and compared results to patients treated with regimens consisting of idarubicin and ara-C with or without GCSF (IA/IAG)(N=47).
Results
We demonstrate that after accounting for prognostic covariates other than treatment (including year in which treatment was administered); FA, and in particular FLAG, were associated with longer event free survival (EFS) than IA/IAG.
Conclusion
Thus our data lends clinical credence to the observed modulation of ara-C by fludarabine and G-CSF.
Keywords: fludarabine, ara-C, G-CSF, core binding factor
INTRODUCTION
Core Binding factor (CBF) acute myelogenous leukemias (AML) results from non-random chromosomal translocations involving heterodimeric transcription factors known as CBFs. CBFs include three alpha subunits, each on chromosome 21, and a common beta subunit CBFB. In t(8;21) AML, a balanced translocation results in fusion of RUNX1 (one of the three alpha subunits) with RUNX1T1 from chromosome 8.1 In inv(16) AML, CBFB fuses with the MYH11 gene.2
Clinically CBF AMLs are characterized by sensitivity to high-dose cytarabine (ara-C), which induce complete remission (CR) in >90% of patients. Repetitive cycles of high-dose ara-C in consolidation improve relapse free survival (RFS).3 Nonetheless larger studies report RFS only in the range of 40–60% at 3–5 years4–6 and about 40% at 10 years,4 leaving room for improvement. The effect of high-dose ara-C may be limited by the inability of leukemic blasts to convert additional ara-C to the active 5′ triphosphate of ara-C (ara-CTP) at ara-C doses > 2g/m2.7 However, treatment of leukemic cells with fludarabine or granulocyte colony stimulating factor (GCSF) can potentiate intracellular ara-CTP accumulation8–10 leading to a potentially more robust ara-C effect without increasing neurotoxicity. Given the sensitivity of CBF leukemias to ara-C, these pharmacological data prompted us to evaluate combinations of fludarabine and ara-C with or without G-CSF in patients with CBF AMLs.
We had previously suggested a better EFS in CBF AMLs treated with fludarabine and ara-C (FA) or FA + G-CSF (FLAG) rather than idarubicin and ara-C (IA), or topotecan and ara-C.11 However because only 14 CBF patients had received FA or FLAG, we extended our observations by treating all CBF AML patients at M. D. Anderson Cancer Center from year 2000 until present time with these regimens. Herein we report an updated comparison of FA, FLAG, and IA or IA+G-CSF (IAG) in patients with CBF AML. Since these regimens were administered at different time periods multivariate analyses were performed to account for possible confounding of the effect between treatment and covariates including year of treatment administration.
PATIENTS AND METHODS
Patients
Between 1992 and 2005, 114 patients with CBF AML were treated. They fall into 3 groups (Table 1). Prior to 2000, 47 patients received IA or IA plus G-CSF (IAG). IA and IAG produced similar outcomes and were combined for purposes of this analysis. From 2000–2002, 22 patients received FLAG and from 2003–2005, 45 patients received FA. The principal difference between the IA/IAG, FA, and FLAG groups was the higher WBC counts in the FA and particularly in the IA/IAG group (Table 1). This is important because, higher WBC augurs a worse outcome in patients with t (8;21)6, 12 and, in some series, in patients with inv 1613. No patients in the FLAG group had a performance status of 3–4.
Table 1.
Summary of patient characteristics by treatment
| Treatment Group | ||||
|---|---|---|---|---|
| FLAG N=22 |
FA N=45 |
IA± G-CSF N=47 |
||
| Parameters | Median (Range) | Median (Range) | Median (Range) | P value |
| Age | 39 (18–74) | 47 (18–80) | 36 (16–83) | 0.33 |
| Sex (Male/Female) | 10/12 | 20/25 | 29/18 | 0.20 |
| ECOG PS | 1 (0–2) | 1 (0–4) | 1 (0–4) | 0.02 |
| WBC | 7.4 (1.1–91) | 13 (0.6–93) | 23.4 (1–226.5) | 0.06 |
| Platelet count | 38 (6–119) | 40 (12–330) | 38 (6–183) | 0.98 |
| Hemoglobin | 8.1 (3.4–11.9) | 8.1 (2.5–13.1) | 8.4 (3.7–12.3) | 0.68 |
| Creatinine | 0.85 (0.6–1.2) | 0.8 (0.5–2.8) | 0.9 (0.6–2.9) | 0.71 |
| Total Bilirubin | 0.5 (0.3–1.5) | 0.5 (0.1–4.7) | 0.6 (0.2–2.2) | 0.23 |
| Percentage bone marrow blast | 42 (30–80) | 51 (10–86) | 54 (20–94) | 0.43 |
| Cytogenetics (N) | ||||
| INV 16/T(8;21) | 13/9 | 36/9 | 32/15 | 0.55 |
Abbreviations:
FLAG= fludarabine, cytarabine and G-CSF
FA= fludarabine, cytarabine
IA= idarubicin, cytarabine
ECOG= Eastern Co-operative Oncology Group
PS= performance status
Treatment
Induction
Patients treated with FA or FLAG received fludarabine 30 mg/m2 over 30 minutes daily × 5 days and ara-C 2 gm/ m2 × 5 days over 4 hours starting 3.5 hours after completion of that day’s fludarabine. In the FLAG regimen, patients received G-CSF 5 μgm/kg body weight subcutaneously daily on days −1 through 5, in addition to FA. IA regimen contained idarubicin 12 mg/m2 on days 1, 2 and 3 and ara-C 1.5 gm/m2/day by continuous infusion for 4 days (3 days if age > 65) and IAG regimen contained added G-CSF 5 μgm/kg body weight subcutaneously daily on days −1 through 5.
Post-remission
Patients in CR following FA (or FLAG) received post-remission therapy with alternated cycles of ara-C 2 gm/m2 every 12 hours on days 1, 3, 5 and FA (or FLAG), with FA given for 4 days instead of 5. Post-remission therapy in patients given IA or IAG alternated cycles of ara-C 100 mg/m2 daily × 5 days and IA (idarubicin 8 mg/m2 days 1 and 2 and ara-C 1.5 g/ m2 daily X 2–3 days by continuous infusion). Post-remission therapy continued for 6–12 cycles as determined by tolerability.
Statistical Analysis
CR and relapse were assessed according to established criteria14. For event-free survival (EFS) analysis, “event” was defined as death, failure to enter CR, or relapse and counted from the start of induction therapy. Relapse free survival (RFS) was defined as the time from response (CR/CRp) to relapse or last follow-up. Kaplan-Meier15 method was used to estimate the EFS/RFS probability and log-rank test16 was used to compare EFS/RFS among subgroups of patients. Univariate and multivariate Cox proportional hazards models17 were fit for EFS. The covariates examined included age, sex, performance status (0–2 versus 3–4), WBC, platelet count, hemoglobin, creatinine, bilirubin, days to CR, number of cycles needed to reach CR, treatment (FA versus FLAG versus IA/IAG), and year of treatment given. Martingale residual plots18 were used to determine the functional relationship between continuous variables, such as age and WBC, and the risk of “event”. Year of treatment was important because IA/IAG was given exclusively in the 1990s while FA/ FLAG was primarily used from 2000 to present. To assess the time effect, we compared the EFS in 241 patients with non-CBF AML given IA before 2000 and 322 non-CBF-AML patients given IA after 2000, with time as one of the predictors of EFS. The estimated time effect of post versus pre-2000 was then taken into account in our analysis of the effects of FA or FLAG versus IA/IAG in the CBF AML patients. To accomplish this, a Bayesian multivariate log-normal model was fit for the EFS time and the treatment effect was assessed after adjusting for the time period effect. All statistical analyses were carried out in Splus19 and WinBugs.20
RESULTS
Patient characteristics are shown in Table 1. One hundred and six of 114 patients (93%) achieved complete remission (CR) after induction and 1 achieved complete remission with incomplete platelet recovery (CRp). Three patients needed 2 and 3 patients needed 3 courses of therapy to achieve CR. There were 5 induction deaths and 2 patients with resistant disease. CR rates were 95% (41 out of 43) and 92% (65 out of 71) in patients with, respectively, t (8;21) and inv 16. Median number of days to CR was 27 (range, 5–119 days). There was no differences in the median number of days to CR among regimens (p= 0.67)
Event-free and Relapse Free Survival Analysis
Fifty-eight of the 114 patients (51%) had an event. The remaining 56 patients have been followed for a median of 159 weeks. The median EFS was 91 weeks (95% CI 72 weeks-not reached). Older age, lower hemoglobin and platelet count, higher values of creatinine and bilirubin, PS 3–4, and need for more than 1 course to CR were each associated with worse EFS. There was no significant difference in EFS between t (8;21) and inv 16 patients. FLAG appears to be associated with the best EFS both without accounting (Fig 1) and with (Table 2) accounting for the effect of the covariates listed above. Since some patients in the IA/IAG or FA group, but none in the FLAG group, had performance status (PS) 3–4, we repeated the analysis considering only patients with PS 0–2. This analysis confirmed the results noted in Table 2 (data not shown). The RFS analysis showed trend towards better outcome with FLAG (FLAG versus IA/IAG, p= 0.046; FLAG versus FA, p= 0.16). Among the 107 patients achieving CR/CRp, frequency of relapse was 32% in the FLAG group, 33% in the FA group and 52% in the IA/IAG group. Forty-four percent of the patients with relapsed disease achieved second CR with salvage therapy. There was no significant difference in overall survival among the groups.
Fig 1.
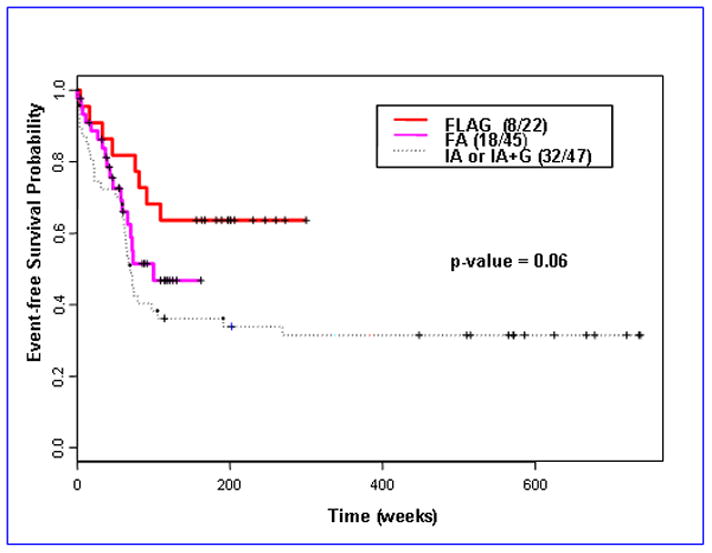
Kaplan-Meier estimates for event-free survival by treatment
Table 2.
Multivariate Cox proportional hazards model for event-free survival
| Variable | Coefficient | SE | Relative Risk | P-value |
|---|---|---|---|---|
| Age | 0.02 | 0.01 | 1.02 | 0.05 |
| HGB | −0.17 | 0.07 | 0.84 | 0.02 |
| log(Bilirubin) | 0.46 | 0.21 | 1.59 | 0.03 |
| PS = 3, 4 (vs.0–2) | 1.03 | 0.46 | 2.81 | 0.03 |
| Number of course to response = 2, 3 (vs. 1) | 1.35 | 0.58 | 3.86 | 0.02 |
| FA (vs. IA/IAG) | −0.17 | 0.31 | 0.84 | 0.58 |
| FLAG (vs. IA/IAG)) | −0.75 | 0.42 | 0.47 | 0.07 |
Abbreviations:
PS= performance status
FA= fludarabine, ara-C
FLAG= fludarabine, ara-C, G-CSF
IA= idarubicin, ara-C
IAG= idarubicin, ara-C and G-CSF
A Bayesian log-normal survival model was fit to account, additionally, for the effect of time (prior to 2000 versus 2000-present). This model (Table 3) suggests that there was a 92% probability that FA was associated with better EFS than IA/IAG and there was a 98% probability that FLAG was associated with better EFS than IA/IAG. These Bayesian posterior probabilities corresponded to the frequentist two-sided p-values of 0.16 and 0.04, respectively. The model also suggests that the posterior probability that FLAG is superior to FA with regards to EFS was 91%, corresponding to a frequentist two-sided p-value of 0.18.
Table 3.
Bayesian multivariate log-normal survival model for event-free survival
| Variable | Mean | 95% Credible Interval | Probability of a beneficial effect on EFS | |
|---|---|---|---|---|
| 2.5% | 97.5% | |||
| Intercept | 4.296 | 0.537 | 3.290 | |
| Age | −0.029 | −0.041 | −0.018 | 0.002 |
| Hemoglobin | 0.092 | −0.008 | 0.184 | 0.964 |
| Log(Bilirubin) | −0.157 | −0.444 | 0.133 | 0.139 |
| PS = 3, 4 (vs. 0, 1, 2) | −1.625 | −2.241 | −1.004 | < 0.001 |
| Cyto = good (vs. bad) | 0.852 | 0.151 | 1.589 | 0.992 |
| Number of course to response = 2, 3 (vs. 1) | −0.584 | −1.288 | 0.078 | 0.047 |
| Period effect: after 2000 (vs. before 2000) | −0.422 | −0.909 | 0.045 | 0.051 |
| FA (vs. IA/IAG) | 0.714 | −0.245 | 1.694 | 0.923 |
| FLAG (vs. FA) | 0.868 | −0.249 | 2.092 | 0.912 |
| FLAG (vs. IA/IAG) | 1.582 | 0.354 | 2.796 | 0.977 |
Abbreviations:
PS= performance status
FA= fludarabine, ara-C
FLAG= FA and G-CSF
IA= idarubicin, ara-C
IAG= IA and G-CSF
Differences in Post-remission Therapy
Patients treated with IA/IAG received more total number of cycles of post-remission therapy (p=.0001). Post-remission therapy in this group comprised of low dose ara-C alternating with high dose ara-C (HDAC) containing IA, while in the FA/FLAG groups post-remission therapy consisted of alternating cycles of FA/FLAG (containing HDAC) and HDAC alone. Hence we compared the number of HDAC-containing post-remission therapies that each group of patients received. There was no significant difference in the number of post-remission HDAC containing therapies between IA/IAG (median 7, range 1–11) and FLAG groups (median 8, range 1–14) (p= 0.25) while patients in the FA group (median 6, range 1–7) received less number of post-remission HDAC therapies compared to IA/IAG group (p=.0007). Even though a similar number of post-remission therapies were planned for all the groups, the patients in the FA group received less post-remission therapies mostly due to delayed cytopenias.
DISCUSSION
Randomized studies indicate that consolidation therapy with repetitive doses of high-dose ara-C reduces the chances of relapse3 indicating sensitivity to ara-C in CBF AML. Pre-clinical data suggest that increasing intra cellular ara-CTP levels with fludarabine and G-CSF is associated with greater antileukemia effect. Our observation of improved EFS in patients with CBF AML given FLAG and to a less extent FA, is the clinical counterpart of this observation. Our analysis did not show difference in overall survival among treatment groups. This is possibly attributable to the fact that upon relapse, close to half the patients could be successfully salvaged to a second complete remission by high-dose ara-C based therapy.
An obvious limitation of this report is the lack of randomization. We attempted to address this problem by accounting for potential differences between treatment groups in the distribution of covariates, other than treatment, predictive of response (Table 2). Since IA/IAG was used to treat CBF leukemias prior to year 2000 and FA/FLAG were used for this patient population after 2000, we also investigated the effect on outcome of year when treatment was given. This analysis (Table 3) suggested that the “time-period” effect favored patients treated before 2000 (i.e. treated with IA/IAG), lending further credence to the improved EFS with FLAG.
Another potential confounding influence is differences between our treatment groups in the number of post-remission HDAC containing courses administered. However, patients with the worst EFS (treated with IA/IAG) received the most post-remission HDAC containing therapies, suggesting that the superior results with FLAG resulted from an effect of fludarabine and GCSF rather than an ara-C-dose effect. During induction, however the FLAG and FA patients typically received more ara-C (10g/m2) than the IA/IAG patients (6g/m2). However, from published literature it is unclear that, once in this dose range, such differences are meaningful. In particular, results from the MRC and CALGB in CBF AML seem equivalent despite similar differences in ara-C dose, prompting the National Comprehensive Cancer Network (NCCN) to recommend either high or intermediate dose ara-C for CBF AML (http://www.nccn.org/professionals/physician_gls/PDF/aml.pdf).
Despite improved EFS with FLAG regimen, therapy for CBF AML is suboptimal.4, 21 Because of the presence of unique fusion transcripts, CBF leukemias are amenable to molecular monitoring. Though standards are not established and there is lack of universal agreement on methodology, persistently high transcript level after remission and consolidation is associated with disease relapse.4, 5, 22, 23 Incorporation of treatment approaches that target minimal residual disease after induction and consolidation may eventually result in better EFS and overall survival in CBF AML.
References list
- 1.Erickson P, Gao J, Chang KS, Look T, Whisenant E, Raimondi S, et al. Identification of breakpoints in t(8;21) acute myelogenous leukemia and isolation of a fusion transcript, AML1/ETO, with similarity to Drosophila segmentation gene, runt. Blood. 1992;80(7):1825–31. Available from http://www.ncbi.nlm.nih.gov/entrez/query.fcgi?cmd=Retrieve&db=PubMed&dopt=Citation&list_uids=1391946. [PubMed] [Google Scholar]
- 2.Liu P, Tarle SA, Hajra A, Claxton DF, Marlton P, Freedman M, et al. Fusion between transcription factor CBF beta/PEBP2 beta and a myosin heavy chain in acute myeloid leukemia. Science. 1993;261(5124):1041–4. doi: 10.1126/science.8351518. Available from http://www.ncbi.nlm.nih.gov/entrez/query.fcgi?cmd=Retrieve&db=PubMed&dopt=Citation&list_uids=8351518. [DOI] [PubMed] [Google Scholar]
- 3.Byrd JC, Ruppert AS, Mrozek K, Carroll AJ, Edwards CG, Arthur DC, et al. Repetitive cycles of high-dose cytarabine benefit patients with acute myeloid leukemia and inv(16)(p13q22) or t(16;16)(p13;q22): results from CALGB 8461. J Clin Oncol. 2004;22(6):1087–94. doi: 10.1200/JCO.2004.07.012. Available from http://www.ncbi.nlm.nih.gov/entrez/query.fcgi?cmd=Retrieve&db=PubMed&dopt=Citation&list_uids=15020610. [DOI] [PubMed] [Google Scholar]
- 4.Appelbaum FR, Kopecky KJ, Tallman MS, Slovak ML, Gundacker HM, Kim HT, et al. The clinical spectrum of adult acute myeloid leukaemia associated with core binding factor translocations. Br J Haematol. 2006;135(2):165–73. doi: 10.1111/j.1365-2141.2006.06276.x. Available from http://www.ncbi.nlm.nih.gov/entrez/query.fcgi?cmd=Retrieve&db=PubMed&dopt=Citation&list_uids=16939487. [DOI] [PubMed] [Google Scholar]
- 5.Marcucci G, Livak KJ, Bi W, Strout MP, Bloomfield CD, Caligiuri MA. Detection of minimal residual disease in patients with AML1/ETO-associated acute myeloid leukemia using a novel quantitative reverse transcription polymerase chain reaction assay. Leukemia. 1998;12(9):1482–9. doi: 10.1038/sj.leu.2401128. Available from http://www.ncbi.nlm.nih.gov/entrez/query.fcgi?cmd=Retrieve&db=PubMed&dopt=Citatio. [DOI] [PubMed] [Google Scholar]
- 6.Schlenk RF, Benner A, Krauter J, Buchner T, Sauerland C, Ehninger G, et al. Individual patient data-based meta-analysis of patients aged 16 to 60 years with core binding factor acute myeloid leukemia: a survey of the German Acute Myeloid Leukemia Intergroup. J Clin Oncol. 2004;22(18):3741–50. doi: 10.1200/JCO.2004.03.012. Available from http://www.ncbi.nlm.nih.gov/entrez/query.fcgi?cmd=Retrieve&db=PubMed&dopt=Citation&list_uids=15289486. [DOI] [PubMed] [Google Scholar]
- 7.Plunkett W, Liliemark JO, Adams TM, Nowak B, Estey E, Kantarjian H, et al. Saturation of 1-beta-D-arabinofuranosylcytosine 5′-triphosphate accumulation in leukemia cells during high-dose 1-beta-D-arabinofuranosylcytosine therapy. Cancer Res. 1987;47(11):3005–11. Available from http://www.ncbi.nlm.nih.gov/entrez/query.fcgi?cmd=Retrieve&db=PubMed&dopt=Citation&list_uids=3471322. [PubMed] [Google Scholar]
- 8.Gandhi V, Estey E, Du M, Nowak B, Keating MJ, Plunkett W. Modulation of the cellular metabolism of cytarabine and fludarabine by granulocyte-colony-stimulating factor during therapy of acute myelogenous leukemia. Clin Cancer Res. 1995;1(2):169–78. Available from http://www.ncbi.nlm.nih.gov/entrez/query.fcgi?cmd=Retrieve&db=PubMed&dopt=Citation&list_uids=9815970. [PubMed] [Google Scholar]
- 9.Gandhi V, Estey E, Keating MJ, Plunkett W. Fludarabine potentiates metabolism of cytarabine in patients with acute myelogenous leukemia during therapy. J Clin Oncol. 1993;11(1):116–24. doi: 10.1200/JCO.1993.11.1.116. Available from http://www.ncbi.nlm.nih.gov/entrez/query.fcgi?cmd=Retrieve&db=PubMed&dopt=Citation&list_uids=8418222. [DOI] [PubMed] [Google Scholar]
- 10.Gandhi V, Plunkett W. Modulation of arabinosylnucleoside metabolism by arabinosylnucleotides in human leukemia cells. Cancer Res. 1988;48(2):329–34. Available from http://www.ncbi.nlm.nih.gov/entrez/query.fcgi?cmd=Retrieve&db=PubMed&dopt=Citation&list_uids=3335008. [PubMed] [Google Scholar]
- 11.Estey EH, Thall PF, Cortes JE, Giles FJ, O’Brien S, Pierce SA, et al. Comparison of idarubicin + ara-C-, fludarabine + ara-C-, and topotecan + ara-C-based regimens in treatment of newly diagnosed acute myeloid leukemia, refractory anemia with excess blasts in transformation, or refractory anemia with excess blasts. Blood. 2001;98(13):3575–83. doi: 10.1182/blood.v98.13.3575. Available from http://www.ncbi.nlm.nih.gov/entrez/query.fcgi?cmd=Retrieve&db=PubMed&dopt=Citation&list_uids=11739159. [DOI] [PubMed] [Google Scholar]
- 12.Nguyen S, Leblanc T, Fenaux P, Witz F, Blaise D, Pigneux A, et al. A white blood cell index as the main prognostic factor in t(8;21) acute myeloid leukemia (AML): a survey of 161 cases from the French AML Intergroup. Blood. 2002;99(10):3517–23. doi: 10.1182/blood.v99.10.3517. Available from http://www.ncbi.nlm.nih.gov/entrez/query.fcgi?cmd=Retrieve&db=PubMed&dopt=Citation&list_uids=11986202. [DOI] [PubMed] [Google Scholar]
- 13.Delaunay J, Vey N, Leblanc T, Fenaux P, Rigal-Huguet F, Witz F, et al. Prognosis of inv(16)/t(16;16) acute myeloid leukemia (AML): a survey of 110 cases from the French AML Intergroup. Blood. 2003;102(2):462–9. doi: 10.1182/blood-2002-11-3527. Available from http://www.ncbi.nlm.nih.gov/entrez/query.fcgi?cmd=Retrieve&db=PubMed&dopt=Citation&list_uids=12649129. [DOI] [PubMed] [Google Scholar]
- 14.Cheson BD, Bennett JM, Kopecky KJ, Buchner T, Willman CL, Estey EH, et al. Revised recommendations of the International Working Group for Diagnosis, Standardization of Response Criteria, Treatment Outcomes, and Reporting Standards for Therapeutic Trials in Acute Myeloid Leukemia. J Clin Oncol. 2003;21(24):4642–9. doi: 10.1200/JCO.2003.04.036. Available from http://www.ncbi.nlm.nih.gov/entrez/query.fcgi?cmd=Retrieve&db=PubMed&dopt=Citation&list_uids=14673054. [DOI] [PubMed] [Google Scholar]
- 15.Kaplan E, Meier P. Nonparametric estimator from incomplete observations. J American Statistical Association. 1958;53:457–81. [Google Scholar]
- 16.Mantel N. Evaluation of survival data and two new rank order statistics arising in its consideration. Cancer Chemother Rep. 1966;50(3):163–70. Available from http://www.ncbi.nlm.nih.gov/entrez/query.fcgi?cmd=Retrieve&db=PubMed&dopt=Citation&list_uids=5910392. [PubMed] [Google Scholar]
- 17.Cox D. Regression models and life tables (with discussion) J R Statistical Soc. 1972;B34:187–220. [Google Scholar]
- 18.Therneau T, Grambchs P. Modeling Survival Data. New York: Springer; 2000. [Google Scholar]
- 19.Venebales W, Ripley B. Modern Applied Statistics With Splus. 3. New York: Springer; 1999. [Google Scholar]
- 20.Lunn D, Thomas A, Best N, Siegelhalter D. WinBUGS--a Bayesian modeling framework: concepts, structure, and extensibility. Statistics and Computing. 2000;10:325–37. [Google Scholar]
- 21.Farag SS, Archer KJ, Mrozek K, Ruppert AS, Carroll AJ, Vardiman JW, et al. Pretreatment cytogenetics add to other prognostic factors predicting complete remission and long-term outcome in patients 60 years of age or older with acute myeloid leukemia: results from Cancer and Leukemia Group B 8461. Blood. 2006;108(1):63–73. doi: 10.1182/blood-2005-11-4354. Available from http://www.ncbi.nlm.nih.gov/entrez/query.fcgi?cmd=Retrieve&db=PubMed&dopt=Citation&list_uids=16522815. [DOI] [PMC free article] [PubMed] [Google Scholar]
- 22.Schnittger S, Schoch C. Quantitative PCR based minimal residual disease detection in core binding factor leukemias: prognostication and guiding of therapy. Leuk Res. 2006;30(6):657–8. doi: 10.1016/j.leukres.2005.11.002. Available from http://www.ncbi.nlm.nih.gov/entrez/query.fcgi?cmd=Retrieve&db=PubMed&dopt=Citation&list_uids=16386301. [DOI] [PubMed] [Google Scholar]
- 23.Schnittger S, Weisser M, Schoch C, Hiddemann W, Haferlach T, Kern W. New score predicting for prognosis in PML-RARA+, AML1-ETO+, or CBFBMYH11+ acute myeloid leukemia based on quantification of fusion transcripts. Blood. 2003;102(8):2746–55. doi: 10.1182/blood-2003-03-0880. Available from http://www.ncbi.nlm.nih.gov/entrez/query.fcgi?cmd=Retrieve&db=PubMed&dopt=Citation&list_uids=12842988. [DOI] [PubMed] [Google Scholar]