

Abstract
Aims
To examine patterns of concurrent substance use among adults with nonmedical ADHD stimulant use.
Methods
We used latent class analysis (LCA) to examine patterns of past-year problematic substance use (meeting any criteria for abuse or dependence) in a sample of 6,103 adult participants from the National Surveys on Drug Use and Health 2006-2011 who reported past-year nonmedical use of ADHD stimulants. Multivariable latent regression was used to assess the association of socio-demographic characteristics, mental health and behavioral problems with the latent classes.
Results
A four-class model had the best model fit, including 1) participants with low probabilities for any problematic substance use (Low substance class, 53.3%); 2) problematic users of all types of prescription drugs (Prescription drug class, 13.3%); 3) participants with high probabilities of problematic alcohol and marijuana use (Alcohol/Marijuana class, 28.8%); and 4) those with high probabilities of problematic use of multiple drugs and alcohol (Multiple substance class, 4.6%). Participants in the 4 classes had distinct socio-demographic, mental health and service use profiles with those in the Multiple substance class being more likely to report mental health and behavioral problems and service use.
Conclusion
Nonmedical users of ADHD stimulants are a heterogeneous group with a large subgroup with low prevalence of problematic use of other substances. These subgroups have distinct patterns of mental health comorbidity, behavior problems and service use, with implications for prevention and treatment of nonmedical stimulant use.
Keywords: prescription drug abuse, ADHD stimulant, Deviant behaviors, concurrent substance use
1. Introduction
Prescription stimulants, commonly prescribed for treatment of Attention Deficit Hyperactivity Disorder (ADHD), are classified as schedule II based on the Controlled Substances Act (CSA) due to the high abuse potential (Drug Enforcement Administration, 2003). Nonmedical use of these stimulants is a growing problem especially among young adults (Johnston, 2003; McCabe et al., 2005, 2007b; SAMHSA, 2009a; Teter et al., 2005, 2006; White et al., 2006). Furthermore, nonmedical use of these sstimulants is associated with higher odds of other substance use or deviant behaviors (McCabe, 2008, 2005; SAMHSA, 2009a; Teter et al., 2005).
While prior research compared nonmedical ADHD stimulant users to non-users regarding substance comorbidities or risky behaviors (Arria et al., 2008; McCabe et al., 2007a, 2005; SAMHSA, 2009a; Teter et al., 2006; White et al., 2006), it is not clear whether distinct subgroups of nonmedical ADHD stimulant users can be identified based on their concurrent substance use patterns. It is also not clear whether any heterogeneity in concurrent use of other substances would be reflected in mental health and behavioral profiles of these individuals. While concurrent use of more than one substance has been found to be associated with more severe physical and psychological consequences (Conway et al., 2003; Hedden et al., 2009; Kandel et al., 2001), the psychological and social correlates of multiple substance use among nonmedical ADHD stimulant users has not been previously examined
This study aimed to first identify heterogeneous subgroups among nonmedical ADHD stimulant users by examining their concurrent problematic substance use patterns (defined as meeting any criteria for abuse or dependence), including alcohol and illegal drugs, using latent class analysis. Second, we examined the socio-demographic, psychological and social characteristics of these subgroups. We hypothesized that the class with greater concurrent problematic substance use would have more severe psychological and social problems.
2. Methods
2.1. Study sample and measures
Data were drawn from the combined 2006-2011 NSDUH data. The sample was restricted to adult participants (aged 18 or older) who reported using ADHD stimulants nonmedically in the past year (N=6,103). The NSDUH is an annual cross-sectional survey sponsored by the Substance Abuse and Mental Health Administration (SAMHSA) and is designed to provide estimates of the prevalence of alcohol and drug use in the household population of the United States, 12 years of age and older. The response rate for household screening ranged from 87% to 91% and for completed interviews from 74% to 76% across the 6 years. Survey items were administered by Computer-assisted personal interviewing (CAPI) and audio computer-assisted self-interviewing (ACASI). Detailed information about the survey methodology of the NSDUH are found elsewhere (SAMHSA, 2007, 2008, 2009b, 2010, 2011, 2012).
2.1.1. Assessment of past-year nonmedical ADHD stimulant use
ADHD stimulants included in this study were Ritalin® or methylphenidate, Cylert®, Dexedrine®, Dextroamphetamine, Adderall®, and Vyvanse®. The survey used the following question to assess nonmedical use of ADHD stimulants in the lifetime: “Have you ever, even once, used [Drug name] that was not prescribed for you or that you took only for the experience or feeling it caused?” Those who reported last time use within the prior 12 months were defined as past-year nonmedical ADHD stimulant users.
2.1.2. Past-year problematic substances use
Past-year problematic substance use was defined by fulfilling any criteria for substance abuse or dependence based on the Diagnostic and Statistical Manual of Mental Disorders–IV (DSM-IV) criteria (American Psychiatric Association, 1994). The substances examined included alcohol, marijuana, cocaine, heroin, hallucinogens, inhalants, and prescription opioids, and prescription tranquilizers/sedatives (combined).
2.1.3. Socio-demographic measures
Socio-demographic variables included in the analyses were gender, age (18-25, ≥ 26 years), race/ethnicity (non-Hispanic white, racial/ethnic minority), marital status (married, no longer married, never married), employment status (partial or full employment, unemployed, not in the labor force), education (less than high school, high school, college and above), annual household income (≤ $19,999, $20,000-$34,999, $35,000-$69,999, ≥ $70,000).
2.1.4. Past-year mental health and behavioral problems
Mental health variables included were past-year clinician-identified anxiety disorder or depression, and self-reported serious psychological distress (SPD). SPD was ascertained if a score based on the K6 measure was 13 or greater (Kessler et al., 2003). The use of mental health and substance abuse services was ascertained by asking participants whether they received any mental health treatment or substance abuse treatment in the past year. Past-year behavioral problems were ascertained by asking participants how many times they had attacked someone, sold drugs and stolen anything worth more than $50 over the year. Consistent with past research (Chen et al., 2014), participants who reported any of the three behaviors were categorized as having a behavioral problem (0 for none and 1 for engaging in one or more of these behaviors). Past-year arrest was assessed in a similar fashion by asking how many times the participants had been arrested and charged with breaking the law (0 for none and 1 for at least once). Sexually transmitted diseases (STD) were also assessed by participant self-reports of diagnosis by a clinician.
2.2. Statistical analyses
Complex latent class analysis (LCA) was used to identify subgroups according to concurrent problematic substance use among past-year nonmedical ADHD stimulant users using Mplus software (Muthén, 1998-2010). LCA for 1 to 7 classes were performed and fit indices were compared. Bayesian Information Criterion (BIC) was given priority over the other fit statistics such as Akaikes Information Criterion (AIC) and Sample Size Adjusted BIC (ABIC) given its more stable performance in simulation studies (Nylund et al., 2007). We also considered the class size and clinical interpretability in selecting a model.
Once the number of classes was ascertained, correlates including socio-demographic characteristics, mental health and behavioral problems were incorporated into the models using unadjusted and adjusted multinomial regression models. These analyses were conducted using a modal assignment latent regression approach with Stata 13.0 software (StataCorp, 2013). All analyses included adjustment for weights and complex survey design.
3. Results
3.1. Subtypes of nonmedical ADHD stimulant users identified by LCA (Figure 1)
Figure 1.
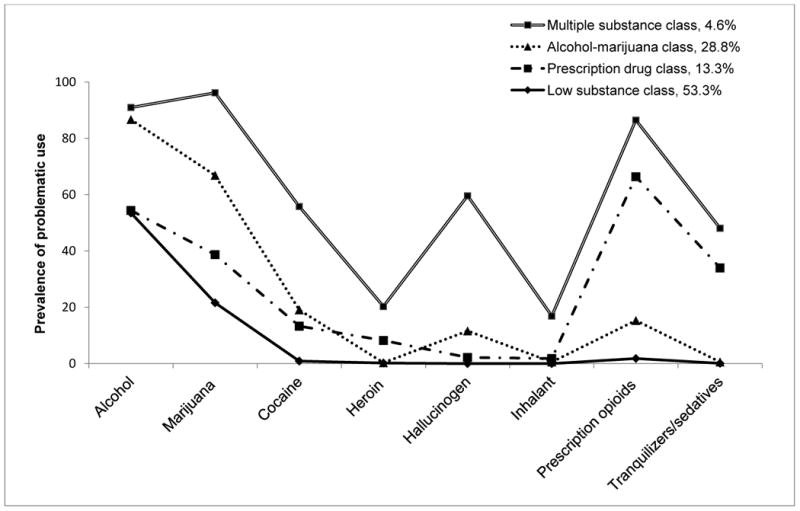
Prevalence of problematic substances use among 6,103 participants of 2006–2011 National Survey on Drug Use and Health with past-year nonmedical ADHD stimulant use categorized according to classes identified through latent class analysis.
The most common problematic substance use among nonmedical ADHD stimulants users was problematic alcohol use (64.2%), followed by problematic use of marijuana (43.6%), cocaine (10.6%), tranquilizers/sedatives (8.8%), hallucinogens (8.4%), heroin (2.5%), inhalants (2.3%), and pain relievers (2.1%).
A latent class model with 4-classes was selected based on BIC and clinical interpretability of the classes (The fit indices for 2-6 classes is presented in Supplementary Material1).
Figure 1 presents the probability of past-year problematic use of each substance for the four classes. Participants in all four classes had at least a moderate probability of problematic use of alcohol and marijuana. Class 1 had near zero probabilities of other problematic substance use (Low substance class, 53.3%). Class 2 additionally showed relatively higher probability of problematic use of pain relievers and sedatives/tranquilizers (Prescription drug class, 13.3%). Class 3 reported relatively higher probabilities of problematic use of marijuana and alcohol (Alcohol-marijuana class, 28.8%). Class 4 reported higher probabilities of problematic use of most of the substances examined (Multiple substance class, 4.6%).
3.2 Characteristic of participants in the LCA-defined classes (Table 1)
Table 1.
Characteristics of past-year nonmedical ADHD stimulant classes identified through latent class analysis in a sample of the US population aged 18 and above (N= 6,103): data from 2006–2011 National Survey on Drug Use and Health.
| Characteristics |
Low substance class N (Wgt%) |
Prescription drug class N (Wgt%) |
Prescription drug class vs Low substance class aORa (95% CI) |
Alcohol- marijuana class N (Wgt%) |
Alcohol-marijuana class vs Low substance class aORa (95% CI) |
Multiple substance class N (Wgt%) |
Multiple substance class vs Low substance class aORa (95% CI) |
|---|---|---|---|---|---|---|---|
|
| |||||||
| Total | 2,995(53.3) | 718(13.3) | 2,064(28.8) | 326(4.6) | |||
|
| |||||||
| Gender | |||||||
| Male | 1,556(54.6) | 34 9(51.5) | 1.00 | 1,271(62.4) | 1.00 | 193(63.7) | 1.00 |
| Female | 1,439(45.4) | 369(48.5) | 1.18(0.92,1.50) | 793(37.6) | 0.74(0.62,0.89)† | 133(36.3) | 0.74(0.52,1.04) |
|
| |||||||
| Age | |||||||
| 18-25 | 2,578(61.0) | 55 8(50. 1) | 1.00 | 1,912(80.1) | 1.00 | 299(75.6) | 1.00 |
| ≥ 26 | 417(39.1) | 16 0(49.9) | 1.23(0.84,1.79) | 152(19.9) | 0.52(0.37,0.72)‡ | 27(24.5) | 0.71(0.38,1.31) |
|
| |||||||
| Race | |||||||
| Non-Hispanic White | 2,533(86.4) | 620(89.5) | 1.00 | 1717(85.6) | 1.00 | 258(84.3) | 1.00 |
| Minorities | 462(13.6) | 98(10.6) | 0.69(0.31,1.16) | 347(14.4) | 1.01(0.77,1.33) | 68(15.7) | 1.03(0.63,1.68) |
|
| |||||||
| Marital status | |||||||
| Married | 225(15.9) | 73 (18.4) | 1.00 | 66(5.0) | 1.00 | 8(6.4) | 1.00 |
| No longer married | 107(8.3) | 62 (17.7) | 1.63(0.97,2.75) | 46(4.4) | 1.63(0.83,3.23) | 14(6.7) | 1.69(0.37,7.67) |
| Never married | 2,663(75.9) | 583(63.9) | 0.84(0.51,1.38) | 1,952(90.6) | 2.35(1.44,3.84)† | 304(86.9) | 2.16(0.78,6.89) |
|
| |||||||
| Employment | |||||||
| Full/Partial | 2,116(72.8) | 45 9(65.7) | 1.00 | 1,376(67.9) | 1.00 | 185(59.1) | 1.00 |
| Unemployed | 214(7.6) | 10 0(12.4) | 1.66(1.08,2.55)* | 249(11.2) | 1.41(1.03,1.94)* | 79(20.8) | 2.55(1.56,4.17)‡ |
| Not labor force | 665(19.7) | 159(21.9) | 1.23(0.83,1.83) | 439(21.0) | 1.05(0.83,1.31) | 62(20.2) | 1.10(0.62,1.95) |
|
| |||||||
| Education | |||||||
| < high school | 271(8.8) | 15 6(16.2) | 1.00 | 282(11.6) | 1.00 | 85(20.9) | 1.00 |
| High school | 645(19.7) | 23 8(33.8) | 0.92(0.62,1.38) | 622(27.9) | 1.05 (0.79,1.39) | 143(47.6) | 1.04(0.61,1.78) |
| ≥ College | 2,079(71.5) | 324(50.0) | 0.40(0.26,0.63)‡ | 1,160(60.6) | 0.66(0.50,0.86)† | 98(31.6) | 0.20(0.11,0.34)‡ |
|
| |||||||
| Income | |||||||
| < $20,000 | 1,198(32.2) | 24 0(27.4) | 1.00 | 866(37.4) | 1.00 | 121(35.6) | 1.00 |
| $20,000- $49,999 | 763(26.9) | 24 9(39.3) | 1.53(1.10,2.12)* | 547(28.5) | 1.05(0. 85,1.31) | 91(29.9) | 0.92(0.57,1.49) |
| $50,000- $74,999 | 368(13.6) | 92 (10.8) | 0.86(0.55,1.37) | 235(12.8) | 0.98(0.75,1.29) | 43(11.0) | 0.72(0.41,1.24) |
| ≥ $75,000 | 666(27.3) | 173(22.5) | 1.04(0.74,1.45) | 416(21.3) | 0.80(0.66,0.97)* | 71(23.5) | 0.88(0.55,1.41) |
|
| |||||||
| Past-year Depression | |||||||
| No | 2,658(88.2) | 50 2(69.4) | 1.00 | 1,778(87.6) | 1.00 | 222(71.7) | 1.00 |
| Yes | 299(11.8) | 205(30.6) | 3.40(2.05,5.63)‡ | 249(12.4) | 1.29(0.92,1.82) | 99(28.3) | 2.92(2.15,3.96)‡ |
|
| |||||||
| Past-year Anxiety | |||||||
| No | 2,749(91.6) | 532(71.8) | 1.00 | 1,853(89.8) | 1.00 | 238(76.0) | 1.00 |
| Yes | 246(8.5) | 186(28.2) | 4.09(2.71,6.17)‡ | 211(10.2) | 1.47(1.06,2.04)* | 88(24.0) | 4.15(2.56,6.74)‡ |
|
| |||||||
| Past-year serious psychological distress | |||||||
| No | 2,372(78.2) | 36 7(47.6) | 1.00 | 1,448(71.6) | 1.00 | 158(46.4) | 1.00 |
| Yes | 623(21.8) | 351(52.4) | 3.54(2.76,4.54)‡ | 616(28.4) | 1.63(1.32,2.02)* | 168(53.6) | 4.52(3.11,6.57)‡ |
|
| |||||||
| Past-year mental health treatment | |||||||
| No | 2,483(81.6) | 41 7(52.9) | 1.00 | 1,640(78.0) | 1.00 | 203(59.9) | 1.00 |
| Yes | 502(18.4) | 296(47.1) | 3.95(2.78,5.62)‡ | 418(22.0) | 1.51(1.08,2.10)* | 120(40.1) | 4.12(2.81,5.89)‡ |
|
| |||||||
| Past-year SUD treatment | |||||||
| No | 2,866(95.2) | 57 3(74.5) | 1.00 | 1,852(90.3) | 1.00 | 231(70.9) | 1.00 |
| Yes | 129(4.8) | 145(25.5) | 5.99(3.82,9.41)‡ | 212(9.7) | 2.33(1.52,3.28)‡ | 95(29.1) | 7.27(4.37,12.01)‡ |
|
| |||||||
| Past-year deviant Behaviors | |||||||
| No | 2,497(84.6) | 40 0(63.3) | 1.00 | 1,103(56.9) | 1.00 | 65(20.7) | 1.00 |
| Yes | 498(15.4) | 318(36.7) | 3.07(2.37,3.97)‡ | 961(43.1) | 3.67(3.03,4.43)‡ | 261(79.3) | 16.59(11.03,24.96)‡ |
|
| |||||||
| Past-year arrest | |||||||
| No | 2,715(90.6) | 55 5(80.2) | 1.00 | 1,681(84.2) | 1.00 | 201(66.7) | 1.00 |
| Yes | 280(9.4) | 163(19.8) | 2.03(1.54,2.67)‡ | 383(15.8) | 1.53(1.17,1.99)‡ | 125(33.3) | 3.36(2.14,5.28)‡ |
|
| |||||||
| Past-year STD | |||||||
| No | 2,905(95.7) | 68 9(97.0) | 1.00 | 1,993(96.5) | 1.00 | 304(90.4) | 1.00 |
| Yes | 90(4.3) | 29(3.0) | 0.68(0.33,1.40) | 71(3.5) | 0.86(0.49,1.51) | 22(9.6) | 2.95(1.47,5.95)† |
Note: aOR stands for adjusted odds ratio, CI for confidence interval and Wgt% for percentages weighted by the survey weights.
p<0.05,
p<0.01,
p<0.001
Adjusted model was adjusted for gender, age, race, marital status, employment, education, and income.
In multivariable logistic regression analysis, compared to participants in the Low substance class, those in the other three classes were more likely to be unemployed and less likely to have college or above education. Being male, in the younger age group (aged 18-25), and never married was associated with higher odds of being in the Alcohol-marijuana class compared to the Low substance class. With few exceptions, participants in class 2-4 were overall more likely to have all types of mental health problems, mental health and substance service use, deviant behaviors and arrests even after adjustment for socio-demographic characteristics. The Multiple substance class additionally had higher odds of past-year sexually transmitted disease compared with the Low substance class.
4. Discussion
There were three main findings in this study. First, nonmedical ADHD stimulants users appear to be heterogeneous group, with one large subgroup that uses few other substances (the Low substance class). Second, the other three subgroups including the Prescription drug class, Alcohol-marijuana class and Multiple substance class each had higher probabilities for mental health problems, service use, and behavioral problems relative to the Low substance class. Third, participants in the 4 classes had distinct socio-demographic, mental health and service use profiles.
More than half of nonmedical ADHD stimulant users fell in the Low substance class, some members of which simply reported problematic alcohol and marijuana use and virtually no other substances. A previous NSDUH report showed college students who used Adderall® nonmedically were 3 times more likely to drink heavily than nonusers (SAMHSA, 2009a). Considering a great deal of adverse physical and social consequences of alcohol use (Brown et al., 2000; Chesson et al., 2000; Hedden et al., 2010), alcohol use screen among this subgroup should be considered.
Consistent with our hypothesis, individuals in classes with a greater likelihood of concurrent problematic substance use were also more likely to report mental health problems, use of mental health and substance abuse services, and behavioral problems compared to Low substance class. This finding is consistent with past research indicating an association between nonmedical use of ADHD stimulants and depressed mood (Compton et al., 2006; Poulin, 2007; Teter et al., 2010). However, the temporal order between psychological problems and the nonmedical use of stimulants remains unclear. While in some cases the use stimulants and other substances may have contributed to new onset of mental health problems, in other cases, substance might represent an attempt at self-medication of psychological problems (Khantzian, 1997).
The socio-demographic characteristics of these classes were somewhat different. Whereas individuals in the Alcohol-marijuana class was more likely to be younger, male and never married, the Prescription drug class participants tended to be older and no longer married (although not at a statistically significant level), which is consistent with past research indicating that individuals with tranquilizer or sedative use problems are generally older than other substance users (Becker et al., 2008).
Comorbid substance use and psychiatric disorders confer an additional risk for poorer treatment response or poorer outcomes among substance abusing patients (Hedden et al., 2010; Strain, 2002), indicating that need for an integrated services which address both physical and psychological needs of this population.
This study has several strengths including a large sample size and generalizability to the US household population. However, the study also several important limitations. First, the cross-sectional nature of the data limits assessment of temporal relationships and causal inferences. Second, two of the mental health measures (e.g., clinician-identified depression and anxiety) were subject to health care utilization. Third, we were not able to explore the motives and the trajectories of substance use which may offer significant implications for prevention. Lastly, all the information were based on self-report, which is vulnerable to recall and reporting biases.
In the context of these limitations, our study provides evidence for the existence of distinct subgroups among adult nonmedical ADHD stimulant users, which has potential implications for clinicians and public health policy makers. Future studies need to explore sources of nonmedically used stimulants and severity of stimulant use across these classes.
Supplementary Material
Acknowledgments
Role of funding source: This study was supported by National Institute on Drug Abuse grant DA023186 (P.I.: Dr. Strain), National Institute of Child and Human Development grant HD060072 (P.I.: Dr. Martins) and National Research Service Award F31AG044052 (recipient: Mr. Kaufmann). NIDA, NICH and NRSA have no further role in study design; in the collection, analysis and interpretation of data; in the writing of the report; or in the decision to submit the paper for publication.
Footnotes
Supplementary material can be found by accessing the online version of this paper at http://dx.doi.org and by entering doi:…
Supplementary material can be found by accessing the online version of this paper at http://dx.doi.org and by entering doi:…
Conflict of Interest Disclosures: Dr. Mojtabai has received consulting fees from Lundbeck Pharmaceuticals.
Other authors declare they have no conflicts of interest.
Author Contributions: Study concept and design: Lian-Yu Chen, Ramin Mojtabai
Acquisition of data: The data reported herein come from the 2006–2011 National Survey of Drug Use and Health (NSDUH) public data files available at the Substance
Abuse and Mental Health Data Archive and the Inter-university Consortium for Political and Social Research, which are sponsored by the Office of Applied Studies, Substance
Abuse and Mental Health Services Administration.
Analysis and interpretation of data: Lian-Yu Chen, Rosa M. Crum, Ramin Mojtabai & Silvia S. Martins.
Critical revision of the manuscript for important intellectual content: Drs. Silvia S. Martins, Eric C. Strain, Christopher Kaufmann, Ramin Mojtabai
Statistical analysis: Lian-Yu Chen
Publisher's Disclaimer: This is a PDF file of an unedited manuscript that has been accepted for publication. As a service to our customers we are providing this early version of the manuscript. The manuscript will undergo copyediting, typesetting, and review of the resulting proof before it is published in its final citable form. Please note that during the production process errors may be discovered which could affect the content, and all legal disclaimers that apply to the journal pertain.
References
- American Psychiatric Association. Diagnostic and Statistical Manual of Mental Disorders. 4th. American Psychiatric Publishing; Washington, DC: 1994. [Google Scholar]
- Arria AM, Caldeira KM, O'Grady KE, Vincent KB, Johnson EP, Wish ED. Nonmedical use of prescription stimulants among college students: associations with attention-deficit-hyperactivity disorder and polydrug use. Pharmacotherapy. 2008;28:156–169. doi: 10.1592/phco.28.2.156. [DOI] [PMC free article] [PubMed] [Google Scholar]
- Becker WC, Sullivan LE, Tetrault JM, Desai RA, Fiellin DA. Non-medical use, abuse and dependence on prescription opioids among U.S. adults: psychiatric, medical and substance use correlates. Drug Alcohol Depend. 2008;94:38–47. doi: 10.1016/j.drugalcdep.2007.09.018. [DOI] [PubMed] [Google Scholar]
- Brown SA, Tapert SF, Granholm E, Delis DC. Neurocognitive functioning of adolescents: effects of protracted alcohol use. Alcohol Clin Exp Res. 2000;24:164–171. [PubMed] [Google Scholar]
- Chen LY, Strain EC, Alexandre PK, Alexander GC, Mojtabai R, Martins SS. Correlates of nonmedical use of stimulants and methamphetamine use in a national sample. Addict Behav. 2014;39:829–836. doi: 10.1016/j.addbeh.2014.01.018. [DOI] [PMC free article] [PubMed] [Google Scholar]
- Chesson H, Harrison P, Kassler WJ. Sex under the influence: the effect of alcohol policy on sexually transmitted disease rates in the United States. J Law Econ. 2000;43:215–238. doi: 10.1086/467453. [DOI] [PubMed] [Google Scholar]
- Compton WM, Conway KP, Stinson FS, Grant BF. Changes in the prevalence of major depression and comorbid substance use disorders in the United States between 1991-1992 and 2001-2002. Am J Psychiatry. 2006;163:2141–2147. doi: 10.1176/ajp.2006.163.12.2141. [DOI] [PubMed] [Google Scholar]
- Conway KP, Kane RJ, Ball SA, Poling JC, Rounsaville BJ. Personality, substance of choice, and polysubstance involvement among substance dependent patients. Drug Alcohol Depend. 2003;71:65–75. doi: 10.1016/s0376-8716(03)00068-1. [DOI] [PubMed] [Google Scholar]
- Drug Enforcement Administration. ARCOS 2: Report 1, Retail drug distribution. Department of Justice, Drug Enforcement Administration; Washington, DC: 2003. [Google Scholar]
- Hedden SL, Malcolm RJ, Latimer WW. Differences between adult non-drug users versus alcohol, cocaine and concurrent alcohol and cocaine problem users. Addict Behav. 2009;34:323–326. doi: 10.1016/j.addbeh.2008.11.001. [DOI] [PMC free article] [PubMed] [Google Scholar]
- Hedden SL, Martins SS, Malcolm RJ, Floyd L, Cavanaugh CE, Latimer WW. Patterns of illegal drug use among an adult alcohol dependent population: results from the National Survey on Drug Use and Health. Drug Alcohol Depend. 2010;106:119–125. doi: 10.1016/j.drugalcdep.2009.08.002. [DOI] [PMC free article] [PubMed] [Google Scholar]
- Johnston LD, O'Malley PM, Bachman JG. National Institute on Drug Abuse. Bethesda, MD: 2003. Monitoring the Future National Survey Results on Drug Use, 1975–2002: II. College Students and Adults Ages 19–40. NIH Publication No. 03-5376. [Google Scholar]
- Kandel DB, Huang FY, Davies M. Comorbidity between patterns of substance use dependence and psychiatric syndromes. Drug Alcohol Depend. 2001;64:233–241. doi: 10.1016/s0376-8716(01)00126-0. [DOI] [PubMed] [Google Scholar]
- Kessler RC, Barker PR, Colpe LJ, Epstein JF, Gfroerer JC, Hiripi E, Howes MJ, Normand SL, Manderscheid RW, Walters EE, Zaslavsky AM. Screening for serious mental illness in the general population. Arch Gen Psychiatry. 2003;60:184–189. doi: 10.1001/archpsyc.60.2.184. [DOI] [PubMed] [Google Scholar]
- Khantzian EJ. The self-medication hypothesis of substance use disorders: a reconsideration and recent applications. Harv Rev Psychiatry. 1997;4:231–244. doi: 10.3109/10673229709030550. [DOI] [PubMed] [Google Scholar]
- McCabe SE. Screening for drug abuse among medical and nonmedical users of prescription drugs in a probability sample of college students. Arch Pediatr Adolesc Med. 2008;162:225–231. doi: 10.1001/archpediatrics.2007.41. [DOI] [PMC free article] [PubMed] [Google Scholar]
- McCabe SE, Boyd CJ, Young A. Medical and nonmedical use of prescription drugs among secondary school students. J Adolesc Health. 2007a;40:76–83. doi: 10.1016/j.jadohealth.2006.07.016. [DOI] [PMC free article] [PubMed] [Google Scholar]
- McCabe SE, Knight JR, Teter CJ, Wechsler H. Non-medical use of prescription stimulants among US college students: prevalence and correlates from a national survey. Addiction. 2005;100:96–106. doi: 10.1111/j.1360-0443.2005.00944.x. [DOI] [PubMed] [Google Scholar]
- McCabe SE, West BT, Wechsler H. Trends and college-level characteristics associated with the non-medical use of prescription drugs among US college students from 1993 to 2001. Addiction. 2007b;102:455–465. doi: 10.1111/j.1360-0443.2006.01733.x. [DOI] [PMC free article] [PubMed] [Google Scholar]
- Muthén BO, Muthén LK. Mplus User's Guide. Sixth. Muthén & Muthén; Los Angeles,CA: 1998-2010. [Google Scholar]
- Nylund KL, Asparoutiov T, Muthen BO. Deciding on the number of classes in latent class analysis and growth mixture modeling: a Monte Carlo simulation study. Struct Equ Modeling. 2007;14:535–569. [Google Scholar]
- Poulin C. From attention-deficit/hyperactivity disorder to medical stimulant use to the diversion of prescribed stimulants to non-medical stimulant use: connecting the dots. Addiction. 2007;102:740–751. doi: 10.1111/j.1360-0443.2007.01758.x. [DOI] [PubMed] [Google Scholar]
- Substance Abuse and Mental Health Services Administration. Office of Applied Studies, NSDUH Series H-32. Rockville, MD: 2007. Results from the 2006 National Survey on Drug Use and Health: National Findings. DHHS Publication No. SMA 07-4293. [Google Scholar]
- Substance Abuse and Mental Health Services Administration. Office of Applied Studies, NSDUH Series H-34. Rockville, MD: 2008. Results from the 2007 National Survey on Drug Use and Health: National Findings. DHHS Publication No. SMA 08-4343. [Google Scholar]
- Substance Abuse and Mental Health Services Administration. Office of Applied Studies. Rockville, MD: 2009a. The NSDUH Report: Nonmedical Use of Adderall® among Full-Time College Students. [Google Scholar]
- Substance Abuse and Mental Health Services Administration. Office of Applied Studies, NSDUH Series H-36. Rockville, MD: 2009b. Results from the 2008 National Survey on Drug Use and Health: National Findings. HHS Publication No. SMA 09-4434. [Google Scholar]
- Substance Abuse and Mental Health Services Administration. Office of Applied Studies, NSDUH Series H-38A. Rockville, MD: 2010. Results from the 2009 National Survey on Drug Use and Health: Volume I. Summary of National Findings. HHS Publication No. SMA 10-4856. [Google Scholar]
- Substance Abuse and Mental Health Services Administration. Office of Applied Studies, NSDUH Series H-41. Rockville, MD: 2011. Results from the 2010 National Survey on Drug Use and Health: Summary of National Findings. HHS Publication No. SMA 11-4658. [Google Scholar]
- Substance Abuse and Mental Health Services Administration. Office of Applied Studies, NSDUH Series H-44. Rockville, MD: 2012. Results from the 2011 National Survey on Drug Use and Health: Summary of National Findings. HHS Publication No. SMA 12-4713. [Google Scholar]
- StataCorp. Stata Statistical Software: Release 13. StataCorp LP; College Station, TX: 2013. [Google Scholar]
- Strain EC. Assessment and treatment of comorbid psychiatric disorders in opioid-dependent patients. Clin J Pain. 2002;18:S14–27. doi: 10.1097/00002508-200207001-00003. [DOI] [PubMed] [Google Scholar]
- Teter CJ, Falone AE, Cranford JA, Boyd CJ, McCabe SE. Nonmedical use of prescription stimulants and depressed mood among college students: frequency and routes of administration. J Subst Abuse Treat. 2010;38:292–298. doi: 10.1016/j.jsat.2010.01.005. [DOI] [PMC free article] [PubMed] [Google Scholar]
- Teter CJ, McCabe SE, Cranford JA, Boyd CJ, Guthrie SK. Prevalence and motives for illicit use of prescription stimulants in an undergraduate student sample. J Am Coll Health. 2005;53:253–262. doi: 10.3200/JACH.53.6.253-262. [DOI] [PubMed] [Google Scholar]
- Teter CJ, McCabe SE, LaGrange K, Cranford JA, Boyd CJ. Illicit use of specific prescription stimulants among college students: prevalence, motives, and routes of administration. Pharmacotherapy. 2006;26:1501–1510. doi: 10.1592/phco.26.10.1501. [DOI] [PMC free article] [PubMed] [Google Scholar]
- White BP, Becker-Blease KA, Grace-Bishop K. Stimulant medication use, misuse, and abuse in an undergraduate and graduate student sample. J Am Coll Health. 2006;54:261–268. doi: 10.3200/JACH.54.5.261-268. [DOI] [PubMed] [Google Scholar]
Associated Data
This section collects any data citations, data availability statements, or supplementary materials included in this article.