

Abstract
Objective
Previous studies have shown active brown adipose tissue (BAT) is present in adults and may play important roles in regulating energy homeostasis. However, nearly every study was done with patients undergoing scanning for cancer surveillance whose metabolism and BAT activity may not reflect that seen in healthy individuals. The objective of this study was to investigate the prevalence and predictors of active BAT in Chinese adults, particularly in healthy individuals.
Design
In this study, a total of 31,088 consecutive subjects with age≥18 years old performed PET/CT scans in the site.
Methods
We measured BAT activity via 18F-fluorodeoxyglucose (FDG) positron emission tomography/computed tomography in these subjects who underwent scanning for either routine medical check-up (MC) or cancer surveillance (CS) in Shanghai. Then we investigated the predictors of active BAT, particularly in healthy individuals.
Results
In both groups, the prevalence of BAT was higher in women than men. Using a multivariate logistic analysis, we found in the MC group, age, sex, BMI, and thyroid tissue metabolism were significant predictors of BAT activity. Similarly, in the CS group, age, sex, and BMI were significant predictors of BAT activity, but not thyroid metabolism.
Conclusions
In Chinese adults, BAT activity correlates inversely with BMI and thyroid metabolic activity, which reinforces the central role of brown fat in adult metabolism and a potential means for treating metabolic syndrome.
Key terms: Positron-emission Tomography and Computed Tomography (PET-CT), Brown Adipose Tissue (BAT), adults, predictor, activity
Introduction
Mammals have two types of adipose tissue, white adipose tissue (WAT) and brown adipose tissue (BAT), which are distinct in both structure and physiologic function 1, 2. WAT is unilocular and contains a large single vacuole while BAT is multilocular and contains a large number of mitochondria 3. WAT stores energy and releases adipocytokines, which have been implicated in the impairment of insulin signaling 4. BAT plays a central role in non-shivering and diet-induced thermogenesis in small mammals 5, and is considered to be a target in the treatment of obesity 6. It was believed that in humans, BAT only existed in newborns and young children but disappeared or had negligible roles in adults 1, 7. However, recent studies have demonstrated active BAT is present in adult humans and its presence may be metabolically important 8, 9.
The evidence of the presence of BAT in adult humans has come from 18F-fluorodeoxyglucose (18F-FDG) positron-emission tomography/computed tomographic (PET/CT) scans and biopsy. PET/CT showed high uptake of 18F-FDG in supraclavicular and paracervical regions, which were confirmed to be BAT by detection of mRNA and protein expression of uncoupling protein-1 (UCP-1), the BAT-specific thermogenic protein 8, 9. The physiological significance of the presence of BAT in adult human is not fully understood, but previous studies provided evidence for a potential role of BAT in the regulation of body weight and energy homeostasis 8–11. Thus, the presence of BAT may help to explain the interindividual differences in metabolism in regard to weight gain in humans 12.
Despite the recent significant progress in understanding adult human BAT, little is known about the prevalence and related factors of active BAT in Chinese adult. Almost all human population studies were done in subjects for cancer surveillance and thus may not reflect BAT behavior in a healthy population. In the present study, we reviewed 31,088 subjects who underwent PET/CT scans at Huashan Hospital in Shanghai and further examined the characteristics of active BAT in this large cohort of adults. Due to the large amount in our cohort, we were able to look at the difference between subjects for medical check-up (MC) and subjects for cancer surveillance (CS), and to clarify the impact of clinical and lifestyle parameters.
Research Design and Methods
Patients
This study followed institutional guidelines and was approved by the ethnic committees of Huashan Hospital, in Shanghai and Beth Israel Deaconess Medical Center and Partners HealthCare, in Boston. Since only medical records were examined, the consent of subjects was not required. From July 2006 to June 2010, a total of 31,088 consecutive subjects with age≥18 years old performed PET/CT scans at the Huashan PET/CT centre (geographic coordinates: 31° 12′ N, 121° 30′ E). These scans were done for either medical check-up or cancer surveillance. All scans were obtained using a Siemens Biograph 64 PET/CT scanner.
Data collection
Age, imaging date, sex, and outdoor temperature were collected for all 31,088 subjects. Outdoor temperatures in Shanghai for the scan dates were obtained from the Chinese Meteorological Administration. To evaluate the effects of multiple metabolic parameters on BAT activity, we collected height, body weight, fasting plasma glucose (FPG), medical history, diagnosis, liver triglyceride content, and thyroid metabolic activity for all subjects with detectable BAT and their negative controls, consisting of two subjects who underwent PET/CT scans at the same day but without detectable BAT.
PET/CT scanning and image reconstruction
Before the PET/CT scan, subjects were asked to fast for 8 hours, but had free access to water. After the intravenous injection of 5.55-7.40MBq/kg of 18F-FDG, subjects rested comfortably, with the head, neck, and shoulders supported from the outset of the experiment until imaging began. Room temperature was 21–23°C. Imaging was performed in three-dimensional mode, with emission scans of 1.5 minutes per bed position. The CT scan was used for attenuation correction and localization of the 18F-FDG uptake sites. Both image sets were reconstructed in transaxial, coronal, and sagittal images with a slice thickness of 2 mm. More than three nuclear-medicine physicians interpreted the PET/CT images using OpenPACS and PET/CT Viewer shareware 8. Each physician reviewed all cases separately, and then they discussed and reached the final consensus.
To examine liver triglyceride content, images from CT scans at thoracic vertebra 11 to 12 were reviewed (Fig. 1B in the Supplementary Appendix). CT attenuation (Hounsfield Unit, HU) was determined in 4 regions of interests (ROIs) for both liver and spleen, each ROI of 120mm2. ROIs for liver were selected manually to avoid major vessels. The average HU was used to calculate the liver-to-spleen ratio (L/S ratio). Fatty liver was defined as HU< 50 or L/S <1 (Fig. 1C in the Supplementary Appendix) 13, 14.
Thyroid metabolic activity was evaluated by local maximum standard uptake value (SUVmax) of PET scans. The SUVmax of thyroid > 2.5 was considered as thyroid hypermetabolism 15, 16.
Statistical analysis
The data were analyzed with SAS software, version 9.1. Normally distributed continuous variables were compared between study groups with Student’s t-test, and non-normally distributed continuous variables were compared with Mann–Whitney U test. The roles of sex, age, BMI, cancer diagnosis, fatty liver and thyroid hypermetabolism as predictors of substantial brown adipose tissue were tested by logistic regression with both univariate and multivariate models.
The subjects were divided into groups corresponding to the upper, middle, and lower thirds of the values for age, BMI, and plasma glucose level; the significance of linear trends across the thirds was tested by assigning each participant the median value for the third and modeling this value as a continuous variable. Missing values for plasma glucose were assigned to the middle third. Odds ratios and 95% confidence intervals were estimated as measures of the magnitude of the associations. All P values presented are two tailed, and values less than 0.05 are considered to be statistically significant.
Results
Prevalence, Age, Body Weight, and Sexual Dimorphism of Brown Adipose Tissue
In the analysis of 18F-FDG PET/CT scans, active brown adipose tissue was considered present if there were areas of tissues that were more than 4 mm in diameter, had the CT density of adipose tissue (−250 to −50 Hounsfield units), and had a maximal SUV of 18F-FDG of at least 2.0 g per milliliter (Fig. 1A in the Supplementary Appendix). This cutoff represented the lower boundary of activity in subjects with detectable brown adipose tissue according to previous study 17, and it was more than 2 SD above the maximal SUV seen in typical depots of white adipose tissue 8. According to these criteria, 410 of the 31,088 subjects (1.32%) had tissue that was identified by PET/CT as being active brown adipose tissue, which was from 1.3% to 6.7% shown in previous retrospective studies 8, 18–20. The prevalence of detectable BAT in the medical check-up group was 1.58% [264 of 16,699] while it was 1.01% [146 of 14,389] in the cancer surveillance group ((Fig 1A). In both the medical check-up group and, cancer surveillance group, women had a higher prevalence of active BAT than men (3.16% vs 0.77%, p<0.001; 1.59% vs 0.61%, p<0.001, Fig 1B). The association between the prevalence of active BAT and mean monthly temperature was evaluated by logistic regression. In both medical check-up group (r = −0.759, P<0.0001) and, cancer surveillance group (r = −0.227, P=0.196), the probability of detecting BAT decreased with increasing outdoor temperature (Fig 2 in the Supplementary Appendix). In both groups, the average age of BAT negative subjects was older than BAT-positive subjects (47.78±9.45 years vs. 40.00±8.17 years, P<0.0001; 55.2±14.12 years vs. 43.7±13.38 years, P<0.0001, respectively, Table 1 in the Supplementary Appendix). In addition, in both groups, the body weight was higher in BAT-negative subjects than in BAT-positive subjects (68.78±12.51kg vs. 58.47±10.13kg, P<0.001; 63.10±11.56kg vs. 58.20±9.10kg, P<0.001, Table 1 in the Supplementary Appendix).
Figure 1. The prevalence of active BAT in both cancer surveillance patients and medical check-up subjects.
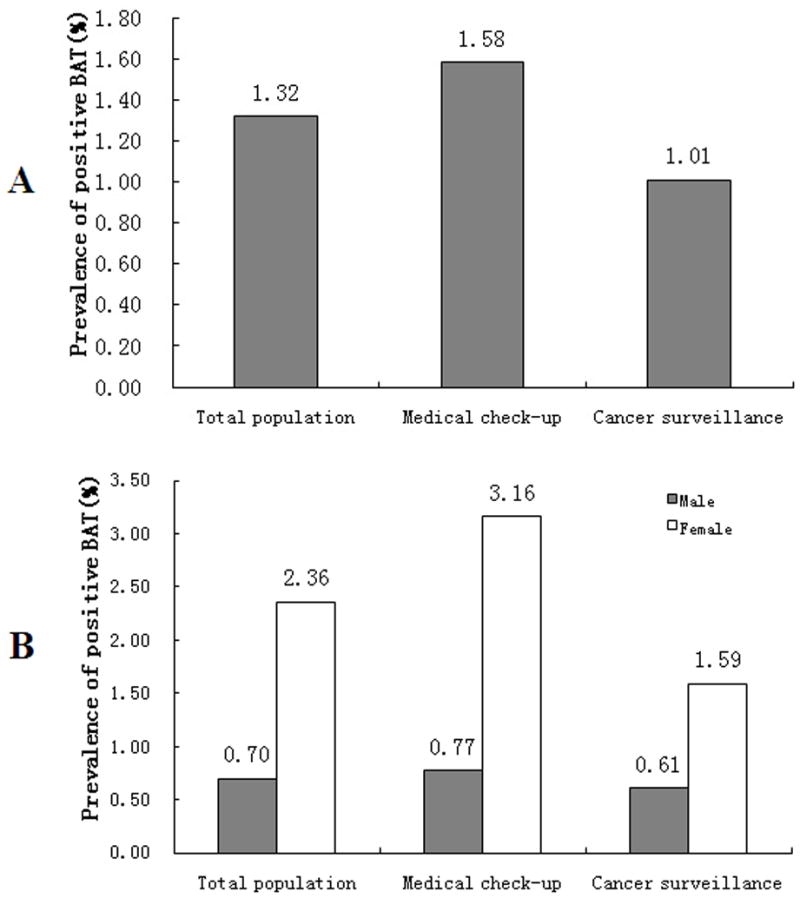
In figure 1A, it shows that in all adult subjects, the prevalence of active BAT is 1.32% while in those patients for cancer surveillance, it is 1.01% and in those for medical check-up, it is 1.58% (P<0.001, medical check-up vs. cancer surveillance). Figure 1B shows the prevalence of active BAT in men and women. In both cancer surveillance patients and medical check-up subjects, the prevalence of detective BAT is higher in women than in men (1.59% vs. 0.61%, 3.16% vs. 0.77%, P<0.0001, respectively).
Anthropometric and Metabolic Predictors of Active Brown Adipose Tissue
Additional predictors of a high mass of detectable brown adipose tissue were estimated by examining the association of brown adipose tissue with sex, age, BMI, and fasting plasma glucose in the 410 subjects who had detectable brown adipose tissue and a sample of 818 date-matched control subjects who did not show active brown adipose tissue (Table 1). All of these parameters were significantly different between the BAT-positive and BAT-negative subjects in both medical check-up and cancer surveillance groups (Table 2 and 3). In univariate analyses of medical check-up subjects (Table 4), BAT was more likely to be detected in women (P<0.0001), patients in the bottom third for age (younger than 39.2 years) (P<0.0001), the least obese patients (P<0.0001), and those who had no fatty liver (P<0.0001) (Table 4). The univariate analyses of cancer surveillance patients showed results with similar significance (Table 5).
Table 1.
Clinical characteristics of BAT positive subjects in medical check-up and cancer surveillance patients.
| Characteristics | Medical check-up (N=264) | Cancer surveillance (N=146) | P Value |
|---|---|---|---|
| Female - no. (%) | 179 (67.80%) | 94 (64.38%) | 0.5125 |
| Age – years | 40.00±8.17 | 43.70±13.38 | 0.0027 |
| Age – tertiles | 0.0002 | ||
| <39.7 y - no. (%) | 130 (49.24%) | 59 (40.41%) | |
| 39.7–50.7 y - no. (%) | 85 (32.20%) | 33 (22.60%) | |
| >50.7 y - no. (%) | 49 (18.56%) | 54 (36.99%) | |
| BMI - kg/m2 | 21.10±2.46 | 21.00±2.43 | 0.6924 |
| BMI – tertiles | 0.4193 | ||
| <21.5 kg/m2 - no. (%) | 164 (62.12%) | 88 (60.27%) | |
| 21.5–24.7 kg/m2 - no. (%) | 82 (31.06%) | 52 (35.62%) | |
| >24.7 kg/m2 - no. (%) | 18 (6.82%) | 6 (4.11%) | |
| Glucose - mmol/l | 4.88±0.52 | 4.99±0.50 | 0.0330 |
| Glucose - tertiles | 0.2520 | ||
| <4.8 mmol/l - no. (%) | 110 (41.98%) | 47 (33.57%) | |
| 4.8–5.3 mmol/l - no. (%) | 77 (29.39%) | 46 (32.86%) | |
| >5.3 mmol/l - no. (%) | 75 (28.63%) | 47 (33.57%) | |
| Fatty Liver | 0.7624 | ||
| NO - no. (%) | 227 (85.98%) | 128 (87.67%) | |
| YES - no. (%) | 37 (14.02%) | 18 (12.33%) | |
| Thyroid Hypermetabolism | 0.1999 | ||
| NO - no. (%) | 200 (75.76%) | 102 (69.86%) | |
| YES - no. (%) | 64 (24.24%) | 44 (30.14%) |
Note: In medical check-up group, data on BMI were missing for 4 BAT-negative subjects and 4 BAT-positive subjects.
In cancer surveillance group, data on BMI were missing for 6 BAT-negative subjects and 1 BAT-positive subject. Data on FBG were missing for 6 BAT-negative subjects and 6 BAT-positive subjects.
Table 2.
Clinical characteristics of BAT positive subjects and date-matched negative controls in medical check-up subjects.
| Characteristics | Medical check-up
|
||
|---|---|---|---|
| BAT negative (N=528) | BAT positive (N=264) | P Value | |
| Female - no. (%) | 223 (42.40%) | 179 (67.80%) | <0.0001 |
| Age – years | 44.58±8.06 | 40.00±8.17 | <0.0001 |
| Age – tertiles | <0.0001 | ||
| <39.2 y - no. (%) | 140 (26.52%) | 130 (49.24%) | |
| 39.2–45.7 y - no. (%) | 218 (41.29%) | 85 (32.20%) | |
| >45.7 y - no. (%) | 170 (32.20%) | 49 (18.56%) | |
| BMI - kg/m2 | 24.80±3.22 | 21.10±2.46 | <0.0001 |
| BMI – tertiles | <0.0001 | ||
| <21.7 kg/m2 - no. (%) | 92 (17.42%) | 164 (62.12%) | |
| 21.7–25.0 kg/m2 - no. (%) | 182 (34.47%) | 82 (31.06%) | |
| >25.0 kg/m2 - no. (%) | 254 (48.11%) | 18 (6.82%) | |
| Glucose - mmol/l | 5.05±0.85 | 4.88±0.52 | 0.0006 |
| Glucose – tertiles | 0.2789 | ||
| <4.7 mmol/l - no. (%) | 192 (36.50%) | 110 (41.98%) | |
| 4.7–5.0 mmol/l - no. (%) | 177 (33.65%) | 77 (29.39%) | |
| >5.0 mmol/l - no. (%) | 157 (29.85%) | 75 (28.63%) | |
Table 3.
Clinical characteristics of BAT positive patients and date-matched negative controls in cancer surveillance patients.
| Characteristics | Cancer surveillance
|
||
|---|---|---|---|
| BAT negative (N=292) | BAT positive (N=146) | P Value | |
| Female - no. (%) | 136 (46.58%) | 94 (64.38%) | 0.0004 |
| Age – years | 45.67±10.62 | 43.70±13.38 | 0.1216 |
| Age – tertiles | 0.0085 | ||
| <39.7 y - no. (%) | 80 (27.40%) | 59 (40.41%) | |
| 39.7–50.7 y - no. (%) | 75 (25.68%) | 33 (22.60%) | |
| >50.7 y - no. (%) | 137 (46.92%) | 54 (36.99%) | |
| BMI - kg/m2 | 24.27±3.39 | 21.00±2.43 | <0.0001 |
| BMI – tertiles | <0.0001 | ||
| <21.5 kg/m2 - no. (%) | 64 (21.92%) | 88 (60.27%) | |
| 21.5–24.7 kg/m2 - no. (%) | 97 (33.22%) | 52 (35.62%) | |
| >24.7 kg/m2 - no. (%) | 131 (44.86%) | 6 (4.11%) | |
| Glucose - mmol/l | 5.23±0.98 | 4.99±0.50 | 0.0011 |
| Glucose – tertiles | 0.2337 | ||
| <4.8 mmol/l - no. (%) | 94 (32.87%) | 47 (33.57%) | |
| 4.8–5.3 mmol/l - no. (%) | 68 (23.78%) | 46 (32.86%) | |
| >5.3 mmol/l - no. (%) | 124 (43.36%) | 47 (33.57%) | |
Table 4.
Predictors of detectable BAT based on PET–CT scanning in medical check-up subjects.
| Variable | Medical check-up
|
|||
|---|---|---|---|---|
| Univariate Analysis | Multivariate logistic regression | |||
| Odds Ratio (95% CI) | P Value | Odds Ratio (95% CI) | P Value | |
| Sex | ||||
| Female vs. male | 2.861 (2.097–3.904) | <0.0001 | 1.405 (0.853–2.314) | 0.1815 |
| Years of age | ||||
| 39.2–45.7 vs. <39.2 | 0.420 (0.297–0.594) | <0.0001 | ||
| >45.7 vs. <39.2 | 0.310 (0.209–0.462) | <0.0001 | 0.745 (0.591–0.939) | 0.0126 |
| Body-mass index | ||||
| 21.7–25.0 vs. <21.7 | 0.253 (0.175–0.364) | <0.0001 | ||
| >25.0 vs. <21.7 | 0.040 (0.023–0.068) | <0.0001 | 0.237 (0.185–0.305) | <0.0001 |
| Fasting plasma glucose | ||||
| 4.7–5.0 vs. <4.7 | 0.754 (0.529–1.074) | 0.1177 | ||
| >5.0 vs. <4.7 | 0.827 (0.577–1.186) | 0.3028 | 1.193 (0.948–1.502) | 0.1321 |
| Fatty liver | ||||
| Yes vs. no | 0.323 (0.218–0.478) | <0.0001 | 0.695 (0.430–1.123) | 0.1368 |
| Thyroid Hypermetabolism | ||||
| Yes vs. no | 0.853 (0.607–1.199) | 0.3612 | 0.595 (0.398–0.890) | 0.0114 |
Note: Logistic regression is based on the age- and sex- adjusted results.
Table 5.
Predictors of detectable BAT based on PET–CT scanning in cancer surveillance patients.
| Variable | Cancer Surveillance
|
|||
|---|---|---|---|---|
| Univariate Analysis | Multivariate logistic regression | |||
| Odds Ratio (95% CI) | P Value | Odds Ratio (95% CI) | P Value | |
| Sex | ||||
| Female vs. male | 2.073 (1.377–3.122) | 0.0005 | 1.057 (0.586–1.906) | 0.8546 |
| Years of age | ||||
| 39.7–50.7 vs. <39.7 | 0.597 (0.351–1.013) | 0.0561 | ||
| >50.7 vs. <39.7 | 0.534 (0.337–0.847) | 0.0077 | 0.976 (0.736–1.295) | 0.8683 |
| Body-mass index | ||||
| 21.5–24.7 vs. <21.5 | 0.390 (0.245–0.621) | <0.0001 | ||
| >24.7 vs. <21.5 | 0.033 (0.014–0.080) | <0.0001 | 0.221 (0.155–0.316) | <0.0001 |
| Fasting plasma glucose | ||||
| 4.8–5.3 vs. <4.8 | 1.276 (0.773–2.106) | 0.3396 | ||
| >5.3 vs. <4.8 | 0.715 (0.446–1.148) | 0.1647 | 1.058 (0.788–1.421) | 0.7062 |
| Fatty liver | ||||
| Yes vs. no | 0.360 (0.207–0.628) | 0.0003 | 0.646 (0.335–1.246) | 0.1923 |
| Thyroid Hypermetabolism | ||||
| Yes vs. no | 1.086 (0.703–1.679) | 0.7097 | 0.672 (0.392–1.152) | 0.1485 |
Note: Logistic regression is based on the age- and sex- adjusted results.
In age- and sex- adjusted multivariate analyses, BMI in the cancer surveillance patients remained significant (Table 5), while in the medical check-up subjects, BMI and thyroid hypermetabolism remained statistically significant (Table 4). The likelihood of having detectable brown adipose tissue was greater in the least obese subjects by a factor of approximately 4; and in those medical check-up subjects who had no thyroid hypermetabolism by a factor of approximately 2 (Table 4 and 5). Thus, brown adipose tissue was found most frequently in young women who had lower BMI.
Medical check-up versus cancer surveillance subjects
264/410 (64.39%) of subjects in the BAT positive cohort did not have a diagnosis of cancer and underwent PET/CT for medical check-up. There were three different factors between the cancer surveillance patients and the medical check-up subjects. The check-up subjects in the BAT positive cohort were younger (40.00 vs. 43.70, P=0.0027) and with lower fasting plasma glucose levels (4.88 vs. 4.99, P=0.0330) (Table 1).
Discussion
Obesity is a significant cause of morbidity and mortality, and there has been considerable recent interest in studying the physiology of BAT in humans, given its protective role against obesity in animal studies 21, 22. Recently, several studies led to a paradigm shift in our comprehension of the potential role of BAT in adult humans. A greater understanding of BAT function could thus help to develop treatment strategies for obesity, especially as many have shown both retrospectively 8, 18 and prospectively 23 that there is an inverse correlation between BAT activity and obesity. However, the retrospective studies were done using patients with a history of cancers and in cohorts that were of mostly European decent, and the prospective studies to date have been too small and only in healthy volunteers, so our understanding of BAT activity remains unknown in large, healthy populations, and in the Chinese in particular.
PET-CT has long been used to stage cancers. Recently, it has been used to detect malignant cancers in asymptomatic individuals 24. Our study took advantage of this and included 16,699 healthy subjects in this cohort. To our knowledge, our report is the largest study of its kind documenting the prevalence and predictors of active BAT in healthy adults. We found substantial collections of brown adipose tissue in 1.32% of subjects which was lower than previous studies 8, 25. Factors such as race, region, underlying disease, type and size of study, and ambient temperature, likely contributed to the different outcomes. The significantly lower prevalence of detectable BAT in the cancer surveillance group than medical check-up group (1.01% vs. 1.58%, P<0.001) may result from the latter being a younger cohort, though other metabolic parameters should also be considered. Our results also suggested that despite some quantitative differences between the CS and MC groups, most of findings were qualitatively similar, including age, sex, and BMI. This indicated that studies done in CS patients are likely reflective of the general population.
In unstimulated conditions, the reported prevalence of active BAT in previous studies were from 4.6% to 6.8% 8, 25, 26, which were higher than that (1.32%, 410 of 31,088 subjects) reported here. As it has been shown that ambient temperature and photoperiod is correlated with the prevalence of active BAT, the various prevalence can at least partially be attributed to the different locations. The latitude of geographic coordinates for the three locations where the previous studies were done is 42°21′ North (Boston, USA), 45°24′ North (Sherbrooke, Canada) and 52°58′ North (Nottingham, UK), while our location is 31°12′ North (Shanghai, China). The mean annual temperature for these four cities is 11° in Boston, 5° in Sherbrooke, 9° in Nottingham and 16° in Shanghai (Table 2 in the Supplementary Appendix). Obviously, Shanghai has the warmest climate among these four locations. Consistent with previous findings 25, 26, here we also showed an inverse correlation between the prevalence of detectable BAT and mean monthly temperature. In addition to the location and temperature, the ethnics may also contribute to the various prevalence, which need to be clarified in future studies.
Our study also demonstrated significantly increased prevalence of BAT in female subjects, which is consistent with other studies 8, 18. Possible sources for this sex-based difference may be seen in rodents, where female rats have higher levels of UCP1 in the interscapular BAT depot compared to males when housed at the same temperature, suggesting that they may have a lower threshold temperature for cold-induced thermogenesis 27. BAT also expresses oestrogen receptors which may further explain these differences 1, since the decrease in sex hormone levels with increased age could be a cause of BAT atrophy. As a result, these subjects will be in a metabolic state with an increased propensity to develop obesity 28. Interestingly, the BMI was lower in the BAT positive group than in negative group in both MC and CS groups, which could be highly relevant in terms of human energy expenditure. Thus, BAT was found most frequently in young healthy women with lower BMI in cold days.
In BAT positive subjects, age was lower in the medical check-up group than in the cancer surveillance group. Cancer usually occurs in older people, thus it is easy to understand the lower age in check-up group. And the findings in the medical check-up group were more representative of the general population than the cancer surveillance group.
In the medical check-up groups, there appeared to be an inverse correlation between the probability of detecting BAT and thyroid hypermetabolism in a multivariate analysis (P = 0.0114). Thyroid hormones are known to be the main regulators of heat generation during shivering and non-shivering cold adaptation 29. When exposed to cold or a lesser degree after meals, the expression of UCP1 is induced by the synergistic action of norepinephrine (NE) and thyroid hormones in animals 1. But it is unclear what the effect of the thyroid hormones has on BAT activity in adult humans. Recently, Skarulis et al. have shown that levothyroxine replacement increased 18F-FDG uptake of BAT in a hypothyroid patient. Consistent with the PET/CT data, both the suprascapular and periumbilical adipose tissue samples of the patient showed significant type 2 deiodinase (D2) activity that was not present in a control sample obtained from another subject 30. In our study, the PET/CT assessment of thyroid metabolism has high sensitivity, but poor specificity. It cannot reflect the thyroid hormones levels directly. Moreover, BAT expresses D2, which converts T4 into active T3, so thyroid gland metabolism and serum thyroid hormones may not reflect the microenvironment of the brown adipocytes. Further studies are required to understand the effect of thyroid hormones on human BAT activation.
In summary, our very large retrospective study demonstrates that the parameters affecting the detection of BAT activity are similar in both healthy subjects undergoing PET/CT for a medical check-up and those patients being scanned for cancer surveillance. Detectable BAT activity correlates positively with more fixed parameters such as climate, age, and sex, but also with factors that can be modified, including BMI, liver fat content, and liver triglyceride content. Given the metabolic benefits seen in animal models with the activation of BAT, our study reinforces the goal of increasing BAT mass and activity through both lifestyle and pharmacologic interventions as a way to treat obesity and its associated metabolic complications.
Supplementary Material
Acknowledgments
Funding
This work was supported by the National Natural Science Foundation of China (No.30771024, No.30900502, No.30800344 and No.81070680), the Shanghai Committee of Science and Technology, China (No.10JC1401002 and No.11PJ1402000), the National Basic Research Program of China (973 Program) (No. 2011CB910201), the 985 Project (III-YFX0302), the Shanghai Municipal Health Bureau (No. XYQ2011002), the Specialized Research Fund for the Doctoral Program of Higher Education (State Education Ministry 131), and the NIH grants DK046200, DK081604, (A.M.C.), and P30 DK036836 from the National Institute of Diabetes and Digestive and Kidney Diseases (NIDDK), and the Eli Lilly Foundation.
Abbreviations
- BAT
brown adipose tissue
- PET/CT
positron emission tomography/computed tomography
- MC
medical check-up
- CS
cancer surveillance
- WAT
white adipose tissue
- 18F-FDG
18F-fluorodeoxyglucose
- UCP-1
uncoupling protein-1
- FPG
fasting plasma glucose
- HU
Hounsfield Unit
- ROI
region of interest
- L/S ratio
liver–spleen Hounsfield ratio
- SUVmax
maximum standard uptake value
- NE
norepinephrine
- D2
type 2 deiodinase
Footnotes
Disclosure Summary: None of the authors have any conflicts of interest to disclose.
The content is solely the responsibility of the authors and does not necessarily represent the official views of the National NIDDK or the NIH.
References
- 1.Cannon B, Nedergaard J. Brown adipose tissue: function and physiological significance. Physiol Rev. 2004;84:277–359. doi: 10.1152/physrev.00015.2003. [DOI] [PubMed] [Google Scholar]
- 2.Rosen ED, Spiegelman BM. Adipocytes as regulators of energy balance and glucose homeostasis. Nature. 2006;444:847–853. doi: 10.1038/nature05483. [DOI] [PMC free article] [PubMed] [Google Scholar]
- 3.Wu Z, Puigserver P, Andersson U, Zhang C, Adelmant G, Mootha V, Troy A, Cinti S, Lowell B, Scarpulla RC, Spiegelman BM. Mechanisms controlling mitochondrial biogenesis and respiration through the thermogenic coactivator PGC-1. Cell. 1999;98:115–124. doi: 10.1016/S0092-8674(00)80611-X. [DOI] [PubMed] [Google Scholar]
- 4.Rasouli N, Kern PA. Adipocytokines and the metabolic complications of obesity. J Clin Endocrinol Metab. 2008;93:S64–73. doi: 10.1210/jc.2008-1613. [DOI] [PMC free article] [PubMed] [Google Scholar]
- 5.Silva JE. Thermogenic mechanisms and their hormonal regulation. Physiol Rev. 2006;86:435–464. doi: 10.1152/physrev.00009.2005. [DOI] [PubMed] [Google Scholar]
- 6.Lowell BB, Spiegelman BM. Towards a molecular understanding of adaptive thermogenesis. Nature. 2000;404:652–660. doi: 10.1038/35007527. [DOI] [PubMed] [Google Scholar]
- 7.Cunningham S, Leslie P, Hopwood D, Illingworth P, Jung RT, Nicholls DG, Peden N, Rafael J, Rial E. The characterization and energetic potential of brown adipose tissue in man. Clin Sci (Lond) 1985;69:343–348. doi: 10.1042/cs0690343. [DOI] [PubMed] [Google Scholar]
- 8.Cypess AM, Lehman S, Williams G, Tal I, Rodman D, Goldfine AB, Kuo FC, Palmer EL, Tseng YH, Doria A, Kolodny GM, Kahn CR. Identification and importance of brown adipose tissue in adult humans. N Engl J Med. 2009;360:1509–1517. doi: 10.1056/NEJMoa0810780. [DOI] [PMC free article] [PubMed] [Google Scholar]
- 9.Virtanen KA, Lidell ME, Orava J, Heglind M, Westergren R, Niemi T, Taittonen M, Laine J, Savisto NJ, Enerback S, Nuutila P. Functional brown adipose tissue in healthy adults. N Engl J Med. 2009;360:1518–1525. doi: 10.1056/NEJMoa0808949. [DOI] [PubMed] [Google Scholar]
- 10.Stefan N, Pfannenberg C, Haring HU. The importance of brown adipose tissue. N Engl J Med. 2009;361:416–417. author reply 418–421. [PubMed] [Google Scholar]
- 11.Seale P, Lazar MA. Brown fat in humans: turning up the heat on obesity. Diabetes. 2009;58:1482–1484. doi: 10.2337/db09-0622. [DOI] [PMC free article] [PubMed] [Google Scholar]
- 12.Wijers SL, Saris WH, van Marken Lichtenbelt WD. Recent advances in adaptive thermogenesis: potential implications for the treatment of obesity. Obes Rev. 2009;10:218–226. doi: 10.1111/j.1467-789X.2008.00538.x. [DOI] [PubMed] [Google Scholar]
- 13.Ricci C, Longo R, Gioulis E, Bosco M, Pollesello P, Masutti F, Croce LS, Paoletti S, de Bernard B, Tiribelli C, Dalla Palma L. Noninvasive in vivo quantitative assessment of fat content in human liver. J Hepatol. 1997;27:108–113. doi: 10.1016/s0168-8278(97)80288-7. [DOI] [PubMed] [Google Scholar]
- 14.Yoneda M, Iwasaki T, Fujita K, Kirikoshi H, Inamori M, Nozaki Y, Maeyama S, Wada K, Saito S, Terauchi Y, Nakajima A. Hypoadiponectinemia plays a crucial role in the development of nonalcoholic fatty liver disease in patients with type 2 diabetes mellitus independent of visceral adipose tissue. Alcohol Clin Exp Res. 2007;31:S15–21. doi: 10.1111/j.1530-0277.2006.00281.x. [DOI] [PubMed] [Google Scholar]
- 15.Pan Z, editor. PET/CT diagnostics. Beijing: People’s Health Press; 2009. [Google Scholar]
- 16.Iagaru A, Kalinyak JE, McDougall IR. F-18 FDG PET/CT in the management of thyroid cancer. Clin Nucl Med. 2007;32:690–695. doi: 10.1097/RLU.0b013e318125037a. [DOI] [PubMed] [Google Scholar]
- 17.Williams G, Kolodny GM. Method for decreasing uptake of 18F-FDG by hypermetabolic brown adipose tissue on PET. AJR Am J Roentgenol. 2008;190:1406–1409. doi: 10.2214/AJR.07.3205. [DOI] [PubMed] [Google Scholar]
- 18.Cohade C, Mourtzikos KA, Wahl RL. “USA-Fat”: prevalence is related to ambient outdoor temperature-evaluation with 18F-FDG PET/CT. J Nucl Med. 2003;44:1267–1270. [PubMed] [Google Scholar]
- 19.Truong MT, Erasmus JJ, Munden RF, Marom EM, Sabloff BS, Gladish GW, Podoloff DA, Macapinlac HA. Focal FDG uptake in mediastinal brown fat mimicking malignancy: a potential pitfall resolved on PET/CT. AJR Am J Roentgenol. 2004;183:1127–1132. doi: 10.2214/ajr.183.4.1831127. [DOI] [PubMed] [Google Scholar]
- 20.Hany TF, Gharehpapagh E, Kamel EM, Buck A, Himms-Hagen J, von Schulthess GK. Brown adipose tissue: a factor to consider in symmetrical tracer uptake in the neck and upper chest region. Eur J Nucl Med Mol Imaging. 2002;29:1393–1398. doi: 10.1007/s00259-002-0902-6. [DOI] [PubMed] [Google Scholar]
- 21.Lowell BB, VSS, Hamann A, Lawitts JA, Himms-Hagen J, Boyer BB, Kozak LP, Flier JS. Development of obesity in transgenic mice after genetic ablation of brown adipose tissue. Nature. 1993;366:740–742. doi: 10.1038/366740a0. [DOI] [PubMed] [Google Scholar]
- 22.Liu X, Zheng Z, Zhu X, Meng M, Li L, Shen Y, Chi Q, Wang D, Zhang Z, Li C, Li Y, Xue Y, Speakman JR, Jin W. Brown adipose tissue transplantation improves whole-body energy metabolism. Cell Res. 2013 doi: 10.1038/cr.2013.64. [DOI] [PMC free article] [PubMed] [Google Scholar]
- 23.van Marken Lichtenbelt WD, Vanhommerig JW, Smulders NM, Drossaerts JM, Kemerink GJ, Bouvy ND, Schrauwen P, Teule GJ. Cold-activated brown adipose tissue in healthy men. N Engl J Med. 2009;360:1500–1508. doi: 10.1056/NEJMoa0808718. [DOI] [PubMed] [Google Scholar]
- 24.Chen YK, Ding HJ, Su CT, Shen YY, Chen LK, Liao AC, Hung TZ, Hu FL, Kao CH. Application of PET and PEt/CT imaging for cancer screening. Anticancer Res. 2004;24:4103–4108. [PubMed] [Google Scholar]
- 25.Ouellet V, Routhier-Labadie A, Bellemare W, Lakhal-Chaieb L, Turcotte E, Carpentier AC, Richard D. Outdoor temperature, age, sex, body mass index, and diabetic status determine the prevalence, mass, and glucose-uptake activity of 18F-FDG-detected BAT in humans. J Clin Endocrinol Metab. 2010;96:192–199. doi: 10.1210/jc.2010-0989. [DOI] [PubMed] [Google Scholar]
- 26.Au-Yong IT, Thorn N, Ganatra R, Perkins AC, Symonds ME. Brown adipose tissue and seasonal variation in humans. Diabetes. 2009;58:2583–2587. doi: 10.2337/db09-0833. [DOI] [PMC free article] [PubMed] [Google Scholar]
- 27.Quevedo S, Roca P, Pico C, Palou A. Sex-associated differences in cold-induced UCP1 synthesis in rodent brown adipose tissue. Pflugers Arch. 1998;436:689–695. doi: 10.1007/s004240050690. [DOI] [PubMed] [Google Scholar]
- 28.Nedergaard J, Cannon B. The changed metabolic world with human brown adipose tissue: therapeutic visions. Cell Metab. 2010;11:268–272. doi: 10.1016/j.cmet.2010.03.007. [DOI] [PubMed] [Google Scholar]
- 29.Silva JE. Thermogenic mechanisms and their hormonal regulation. Physiol Rev. 2006;86:435–464. doi: 10.1152/physrev.00009.2005. [DOI] [PubMed] [Google Scholar]
- 30.Skarulis MC, Celi FS, Mueller E, Zemskova M, Malek R, Hugendubler L, Cochran C, Solomon J, Chen C, Gorden P. Thyroid hormone induced brown adipose tissue and amelioration of diabetes in a patient with extreme insulin resistance. J Clin Endocrinol Metab. 2010;95:256–262. doi: 10.1210/jc.2009-0543. [DOI] [PMC free article] [PubMed] [Google Scholar]
Associated Data
This section collects any data citations, data availability statements, or supplementary materials included in this article.