

Abstract
Exome sequencing (ES) is rapidly being deployed for use in clinical settings despite limited empirical data about the number and types of incidental results (with potential clinical utility) that could be offered for return to an individual. We analyzed deidentified ES data from 6,517 participants (2,204 African Americans and 4,313 European Americans) from the National Heart, Lung, and Blood Institute Exome Sequencing Project. We characterized the frequencies of pathogenic alleles in genes underlying Mendelian conditions commonly assessed by newborn-screening (NBS, n = 39) programs, genes associated with age-related macular degeneration (ARMD, n = 17), and genes known to influence drug response (PGx, n = 14). From these 70 genes, we identified 10,789 variants and curated them by manual review of OMIM, HGMD, locus-specific databases, or primary literature to a total of 399 validated pathogenic variants. The mean number of risk alleles per individual was 15.3. Every individual had at least five known PGx alleles, 99% of individuals had at least one ARMD risk allele, and 45% of individuals were carriers for at least one pathogenic NBS allele. The carrier burden for severe recessive childhood disorders was 0.57. Our results demonstrate that risk alleles of potential clinical utility for both Mendelian and complex traits are detectable in every individual. These findings highlight the necessity of developing guidelines and policies that consider the return of results to all individuals and underscore the need to develop innovative approaches and tools that enable individuals to exercise their choice about the return of incidental results.
Introduction
Exome sequencing and whole-genome sequencing (ES/WGS) are highly effective tools for identifying the genetic basis of heritable disorders, and their use in clinical settings is rapidly increasing.1–3 Aside from identifying the variant(s) underlying the disorder for which sequencing was performed (i.e., the primary result), ES/WGS can identify other variants (i.e., secondary or incidental results) that could be of clinical and/or personal (e.g., reproductive planning or lifestyle modification) utility.4 The ability to identify incidental results has led to considerable controversy about whether such variants should be reported to individuals and/or families in clinical settings and research participants and, if so, how they should be offered for return.5–10 Clinical utility is defined as the existence of established therapeutic interventions or actions that have the potential to change the clinical course of disease,11 whereas personal utility is more broadly debated and can include reproductive decision making, lifestyle changes with a less direct impact on disease risk, and life planning.12 Several recent studies have demonstrated that personal utility is an important consideration for individuals in clinical care and research participants in making decisions about the return of genetic results, given that the vast majority of individuals indicate that they want access to a broad range of results beyond those with a direct clinical benefit.13–15 Recently published results of survey responses from ∼900 genetic professionals suggest that genetics care providers also value the potential benefit of results of personal utility and think they should be offered for return.16
Frequently, the debate about the return of incidental results from ES/WGS has been framed by major gaps in knowledge: (1) the frequency with which incidental results that prompt clinical action (i.e., changes in medical management) are identified in ES/WGS data5,6 and (2) the extent to which the process of curating and reporting such variants is beyond what is required to answer a clinical question.5 Yet, how much weight these issues should be given has been informed to only a very limited extent by empirical data on the effectiveness of curating large ES/WGS data sets for well-known pathogenic risk variants, the proportion of individuals who have known risk variants for disease, and the number and kinds of risk variants (i.e., burden) found in each individual.10,17–22
Most recent attempts to estimate the number of predicted or known pathogenic variants in subsets of genes underlying various phenotypes in certain populations18,23 have focused on identifying large-effect variants with high clinical impact for very rare autosomal-recessive and autosomal-dominant conditions.10,17–23 The prior probability of finding risk variants that underlie most rare Mendelian conditions is very low. This fosters screening of relatively large numbers of genes with little expectation that variants of known pathogenic significance will be found in many individuals. For example, recommendations from the American College of Medical Genetics and Genomics (ACMG) on the return of incidental results from 56 genes captured by exome sequencing suggest that only 1% of individuals will have a result to return.24 Moreover, the large-effect alleles that underlie Mendelian conditions represent a small fraction of the risk variants that could be of utility for an individual. In other words, risk variants underlying more common complex diseases also need to be considered for return. With this in mind, it has been emphasized that every individual most likely has an ES/WGS result(s) that could be offered for return.25 Yet, there is scant empirical evidence from assessments of large ES/WGS data sets to support this claim.
To characterize the broad range of risk alleles that could be offered for return in individuals who undergo ES/WGS and to better frame the debate about the return of incidental results, we sought to address four major questions about the spectrum of genetic results of potential utility, both clinical and personal, in both individual exomes and collectively in a large set of exomes sampled from European American (EA) and African American (AA) individuals: for genes associated with common Mendelian conditions and common complex diseases, (1) what is the per-individual burden of pathogenic risk variants, (2) what is the cumulative burden of risk variants per individual, (3) how well do computational predictors of deleterious variants identify known disease-risk variants, and (4) what are the implications of estimates of per-individual burden of variants of utility for the management of incidental results from ES/WGS?
We assessed protein-coding variants in health-related genes in 6,517 individuals enrolled in the National Heart, Lung, and Blood Institute (NHLBI) Exome Sequencing Project (ESP). The ESP data set consists of high-coverage (average median depth ∼ 90×) exome sequences from 2,204 AA and 4,313 EA individuals sampled from more than 20 cohorts with heart and lung phenotypes unrelated to those conditions assessed herein (Table S1, available online).26
In this ESP data set, we identified pathogenic variants in three broad categories that represent the spectrum of potential utility and across a range of allele frequencies and disease prevalences. The first category included 39 genes underlying 31 Mendelian conditions, most of which are inborn errors of metabolism, recommended for newborn screening (NBS) (Table S2) by the Discretionary Advisory Committee on Heritable Disorders in Newborns and Children (formerly known as the Secretary’s Advisory Committee on Heritable Disorders in Newborns and Children) Recommended Uniform Screening Panel (Table S2). NBS results in adults are primarily of personal utility because they can be used for reproductive planning.
The second category included 17 genes associated with risk of age-related macular degeneration (ARMD) (Table S2). ARMD is a common complex condition with onset late in life and a relatively high frequency and is the third leading cause of vision loss worldwide.27 Many healthy adults are likely to carry ARMD risk variants, and at present there are limited interventions to prevent or mitigate ARMD. Therefore, ARMD results are primarily of utility for potential early risk identification, improved diagnosis, and delay of onset and/or mitigation of symptoms through lifestyle modifications (e.g., diet, vitamin supplementation, and smoking cessation), as well as life planning. In the future, such results might allow for risk stratification and targeted interventions.27,28
The third category included 14 genes containing variants known to influence drug response (PGx) (Table S2). PGx results are primarily of utility for the avoidance of adverse reactions or lack of response to certain medications across a range of clinical conditions or settings. Our selection criteria for this set depended upon the higher levels of evidence of association in the PharmGKB database, including replicated studies with significant p values and/or medical-society-endorsed PGx guidelines. Although the relative risks for these variants vary, their clinical utility and functional significance are well documented. Consequences for these variants range from severe allergic reactions to a lack of response to a range of drugs, including blood-thinning agents, antipsychotic medications, and chemotherapeutic agents.29–31
We annotated all variants in each of these 70 genes with commonly available computational-prediction approaches and manually curated them to determine whether they were pathogenic. We subsequently compared the effectiveness of computational predictions of known risk variants and generated individual and population-specific estimates of the burden of risk variants for Mendelian and complex traits in the NBS, ARMD, and PGx gene sets.
Material and Methods
Exome Sequencing and Variant Calling
Library construction, exome capture, sequencing, and mapping were performed as previously described.26 Sequencing was performed at the University of Washington (UW) and the Broad Institute of MIT and Harvard (Broad). In brief, exome capture was performed with the Roche Nimblegen SeqCap EZ Library or the Agilent SureSelect Human All Exon 50 Mb Kit. Paired-end sequencing (2 × 76 bp) was performed on Illumina GAII and HiSeq instruments. Single-nucleotide variants (SNVs) were called with a maximum-likelihood approach32 implemented in the UMAKE pipeline at the University of Michigan, which allowed all samples to be analyzed simultaneously for both variant calling and filtering. BAM33 files summarizing Burrows-Wheeler Aligner34 alignments generated at the UW and the Broad were used as input. BAM files summarized alignments mapped to the GRCh37 human reference sequence and were refined by duplicate removal, recalibration, and indel realignment with the Genome Analysis Toolkit.35 We excluded all reads that were not confidently mapped (Phred-scaled mapping quality < 20) from further analysis. We then used SAMtools33 to compute genotype likelihoods for exome targeted regions and 50 flanking bases while accounting for per-base alignment quality. We identified variable sites and their allele frequencies by using a maximum-likelihood model implemented in glfMultiples.32 These analyses assumed a uniform prior probability of polymorphism at each site. The final call set was performed on 6,823 samples.
We used a support vector machine (SVM) classifier to separate most likely true-positive and false-positive variant sites with the use of various quality metrics. These included allelic balance (the proportional representation of each allele in likely heterozygotes), base-quality distribution for sites supporting the reference and alternate alleles, and the distribution of supporting evidence between strands and sequencing cycle, among others. We used variants identified by dbSNP or 1000 Genomes36 as the positive training set and used variants that failed multiple filters as the negative training set. This method was effective at removing sequencing artifacts while preserving good-quality data, as indicated by the transition-transversion ratio for previously known and newly identified variant sites, the proportion of high-frequency variants overlapping with dbSNP, and the ratio of synonymous to nonsynonymous variants, as well as attempts at validating a subset of sites. A total of 1,908,614 SNVs passed the SVM filter.
In order to obtain high-quality genotypes for estimating allele frequency and carrier burden, we set individual genotypes to missing if the corresponding read depth was <10×. We also excluded variants with read depth > 500×. With the exception of one outlier with a low call rate, all samples had high call rates. The outlier was removed from the analysis.
Identification of Related Individuals and Ancestry Designation
We used principal-component analysis (PCA) to assign genetic ancestry. Only autosomal SNVs with a minor allele frequency (MAF) ≥ 0.1% and a call rate > 95% were included in the PCA, which we executed in PLINK37 after pruning SNVs in linkage disequilibrium. The first two principal components clearly separated AA samples from EA samples (Figure S1). Thirty individuals of indeterminate genetic ancestry (i.e., located between the two vertical lines in Figure S1) were removed.
After designating samples to AA and EA ancestry groups, we used KING38 to run a kinship analysis stratified by genetic-ancestry assignment to identify cryptically related individuals. Pairs of samples with a kinship-coefficient range of >0.354, [0.177, 0.354], [0.0884, 0.177], and [0.0442, 0.0884] were designated as duplicates, first-degree relatives, second-degree relatives, and third-degree relatives, respectively. Only the sample with the higher overall call rate from each duplicate or relative pair was retained. This resulted in the removal of 274 samples from analysis. We also estimated inbreeding coefficients for each pair of samples and removed one sample with a value higher than that of all other samples. This resulted in a final data set of 2,204 AA and 4,313 EA samples (total = 6,517), hereafter referred to as ESP6500.
The 6,517 ESP samples contained 422 samples from cystic-fibrosis (CF [MIM 219700])-affected individuals who were known carriers for pathogenic CFTR mutations. We excluded these 422 CF individuals from the CFTR carrier-burden and risk-variant frequency estimates described in the Results.
Annotation and Selection of Risk Variants
Variants that were polymorphic and had a call rate ≥ 90% in ESP6500 were submitted to the SeattleSeq Annotation server on May 29, 2012. We used SeattleSeq Annotation 134, the hg19 build of the human reference genome (UCSC Genome Browser), and the NCBI full genes (NM, XM) gene-model option. For variants mapping to multiple transcripts, we retained the most damaging classification (from most to least damaging: nonsense, splice, missense, synonymous, UTR, other). PolyPhen-239 scores were obtained from the PolyPhen-2 server with the use of the HumDiv classifier model. Combined Annotation-Dependent Depletion (CADD) scores were obtained from the CADD server.40
All annotated variants from the 70 genes selected for assessment were entered into a spreadsheet for curation. Each variant was manually compared to variants in the Human Gene Mutation Database (HGMD Professional 2012.3) and Online Mendelian Inheritance in Man (OMIM) by either rsID or by protein position. Variants not found in OMIM or HGMD in the PGx and ARMD gene sets and variants not found in OMIM or HGMD as either “disease mutation” (DM) or “disease mutation?” (DM?) in the NBS gene set were eliminated from further consideration (i.e., exclusion step 1; Table S3 and Figure S2). Next, we eliminated variants listed in HGMD or OMIM but associated with a phenotype that differed from the one for which screening was intended, those listed as polymorphic in one of 27 locus-specific databases (LSDBs), and those not in PharmGKB (Tables S2 and S4; exclusion step 2 in Figure S2). We then excluded variants with a call rate < 90% in either EA or AA individuals (exclusion step 3; Table S3 and Figure S2). Lastly, we excluded ten NBS variants that were homozygous in the absence of compelling evidence, via literature review, of disease causality and three NBS variants that had an allele frequency > 3% (suggesting that they were polymorphisms rather than risk variants for a rare Mendelian disorder and/or had recently been shown not to be pathogenic); excluded PGx variants that had the lowest level of evidence of functional significance (i.e., level 4) in PharmGKB; and excluded ARMD variants for which clinical testing was not available per GeneTests (exclusion step 4; Table S3 and Figure S2). We included all nonsense variants that had not been observed previously, all of which were singletons.
The institutional review boards at all participating sites approved the NHLBI ESP study protocols.
Results
Curation of Variants
We identified a total of 10,879 different variants (i.e., candidate-variant set) in 70 disease-related genes in the 6,517 ESP samples. A total of 5,155 variants in AA individuals and 5,724 variants in EA individuals were found. As anticipated, manual comparison of the set of candidate variants to HGMD and OMIM resulted in a substantial reduction in the number of variants retained for further review; 91%, 92%, and 90% of variants were excluded in the total sample, in AA individuals, and in EA individuals, respectively (Table S3). A larger fraction of variants were excluded in the ARMD (94%) and PGx (94%) gene sets than in the NBS gene set (86%) partly because of the retention of a larger fraction of rare variants in the NBS gene set.
To evaluate the extent to which the curation process enriched the set of risk variants with those likely to confer disease risk, we compared metrics of evolutionary conservation, pathogenicity, and deleteriousness between the set of risk variants and the variants that were excluded from further analysis. A Genome Evolutionary Rate Profiling (GERP) score is a measure of evolutionary constraint, such that high GERP scores reflect the strength of past purifying selection.41 Heuristically, variants with high GERP scores are more likely to exert phenotypic consequences than variants with low GERP scores. Mean GERP scores of variants in the risk set were significantly higher than the mean scores of the excluded variants (Figure 1) for NBS (p = 1.45 × 10−86) and ARMD (p = 4.40 × 10⁻⁴) gene sets, but not for the PGx gene set (p = 0.066).
Figure 1.
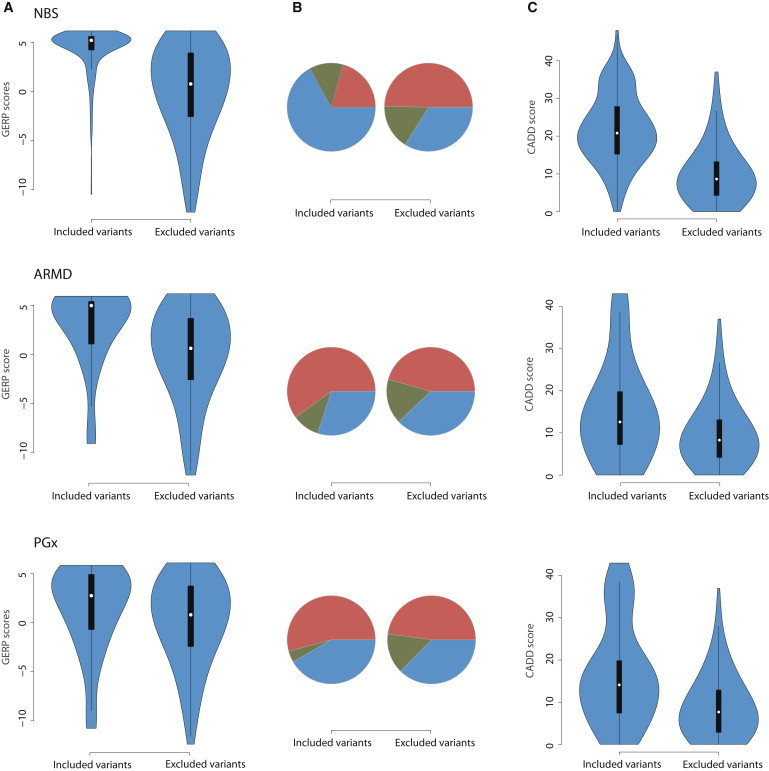
Extent to which the Variant-Curation Process Enriched the Risk-Variant Set with Those that Most Likely Confer Disease Risk
Violin plots showing the distribution of metrics of conservation (A), pathogenicity (B), and deleteriousness (C) between included and excluded variants in the NBS, ARMD, and PGx gene sets.
(A) Mean GERP scores of variants in the risk set were significantly higher than the mean scores of the excluded variants for the NBS (p = 1.45 × 10−86) and ARMD (p = 4.40 × 10⁻⁴) gene sets, but not for the PGx gene set (p = 0.066).
(B) Significantly more variants were predicted to be probably damaging (blue) by PolyPhen-2 in the NBS (p = 1.99 × 10⁻¹⁹) and ARMD (p = 0.42) gene sets than in the PGx gene set (p = 0.25). The fraction of variants predicted to be benign (red) or possibly damaging (green) is denoted.
(C) With the use of CADD scores, significantly more damaging variants were found in the NBS (p = 1.38 × 10−109), ARMD (p = 9.9 × 10⁻⁴), and PGx (p = 1.47 × 10⁻⁹) risk-variant sets.
PolyPhen-2 scores are a measure of the impact of an amino acid substitution on the structure and function of a protein.39 Variants with PolyPhen-2 scores nearer to 1 are predicted to be damaging, whereas scores close to 0 are less likely to affect protein function. There were significantly more damaging variants in the NBS set of risk variants than among excluded variants (p = 1.99 × 10⁻¹⁹; Figure 1). The difference was not significant for the ARMD (p = 0.42) or PGx (p = 0.25) variant sets.
CADD scores provide another means of prioritizing variants. Larger CADD scores correspond to variants that are more likely to be deleterious in terms of overall organismal fitness.40 CADD scores are available for all 8.6 billion possible SNVs in the human genome and are Phred scaled. There were significantly more damaging variants in the NBS set of risk variants than among excluded variants (p = 1.38 × 10−109; Figure 1). The difference was still significant but less striking for ARMD (p = 9.9 × 10⁻⁴) and PGx (p = 1.47 × 10⁻⁹) variant sets, consistent with the prediction that variants underlying rare, Mendelian disorders are highly deleterious whereas variants for complex phenotypes (e.g., ARMD) and phenotypes with low to modest effects on fitness (e.g., PGx) are less deleterious.
Whereas the percentage of variants retained in the ARMD and PGx variant sets was similar between AA and EA individuals, the percentage of variants retained in the NBS gene set was substantially higher in EA individuals (15%) than in AA individuals (10%). This observation raised the possibility that a greater fraction of true risk variants in AA individuals were being excluded as a result of underrepresentation of pathogenic rare variants in AA individuals in HGMD and/or OMIM.42 If this was the case, one prediction is that compared to rare variants excluded in EA individuals, rare variants excluded in AA individuals should be enriched with predicted deleterious variants. However, the mean GERP, PolyPhen-2, and CADD scores did not differ significantly.
Because the allele frequencies of variants that cause inborn errors of metabolism assessed via NBS are generally well known, we compared the allele frequency of each NBS risk variant with a MAF > 1% in ESP6500 to estimates from 1000 Genomes data. Allele frequencies were similar except for rs334, the variant underlying sickle cell disease (MIM 603903), which had a MAF of only 4.0% in ESP6500 but an MAF of 9.0% in the 1000 Genomes data (Table S5).
We also estimated carrier frequencies of many of the conditions in the NBS gene set in order to compare our estimates to those previously published. For several conditions, our observed carrier frequencies were higher than published estimates (Table S6). Our original strategy for curating variants included HGMD, OMIM, and LSDB variants that could be identified during NBS but that might not cause a phenotype (e.g., pseudodeficiency or partial-deficiency alleles) requiring treatment. As a consequence, our observed carrier-frequency estimates for some NBS conditions were inflated. For this reason, we performed an additional step of manually reviewing variants listed in HGMD as DM? (n = 12); variants present as homozygotes in either EA or AA individuals and/or variants with a MAF > 0.5% in either EA or AA individuals (n = 15) (Table S7); all variants in CFTR (MIM 602421) (n = 60); and PAH (MIM 261600) variants listed in HGMD as “hyperphenylalaninemia” (MIM 261600) (n = 13). Hyperphenylalaninemia is detected by NBS but is not associated with clinical or symptomatic phenylketonuria (MIM 261600). Detailed methods of this additional review are described in Table S6, and the revised carrier frequencies are shown in Table S7.
For the majority of examined NBS conditions, our original and revised carrier-frequency estimates were similar to, and often lower than, population-based estimates of carrier frequencies (Figure 2). For example, our review of variants for congenital adrenal hyperplasia (MIM 201910) eliminated the only two potentially pathogenic variants in ESP6500. This resulted in a carrier frequency of 0, which is unrealistic given that the published carrier frequency is 1/61. This result suggests that our additional review to attempt to generate more accurate estimates of carrier frequencies was too strict for many conditions. This observation is consistent with the fact that pathogenic copy-number variants (CNVs), indels, and variants outside of the target were not included in the ESP6500 data set.
Figure 2.
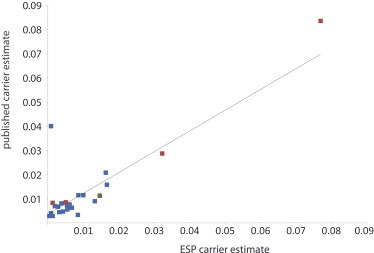
Comparison of Published versus Observed Carrier Estimates for NBS Conditions
Published estimates of carrier frequencies were similar to estimates on the basis of a conservative manual review of NBS risk variants. Carrier estimates for sickle cell anemia (MIM 603903), beta-thalassemia (MIM 613985), and hemoglobin C disease (MIM 141900.0038) were calculated in AA individuals separately (red), and estimates for CF (MIM 219700) were calculated in AA (red) and EA (green) individuals separately, whereas all other estimates were calculated in the total ESP6500 sample (blue).
Distribution of Risk Variants
In the overall EA and AA samples, a total of 399 validated risk variants (i.e., risk-variant set) were identified in 6,517 individuals in the NBS gene set (n = 328), the ARMD gene set (n = 25), and the PGx gene set (n = 46) (Table S8). The majority (87%) of variants were rare (MAF ≤ 0.5%), and as expected given the predicted phenotypic consequences of risk variants in each gene set, there was a higher percentage of rare variants in the NBS gene set (96%) than in either the ARMD set (68%) or the PGx set (39%). As a corollary, the site-frequency spectrum of risk variants underlying PGx and ARMD phenotypes included a higher percentage of variants of intermediate (1% < MAF < 5%) and high (MAF ≥ 5%) frequency (Figure S3).
A total of 309 and 197 risk variants were identified in EA and AA individuals, respectively. The higher number of risk variants in EA individuals was partly due to the fact that a larger number of EA individuals (n = 4,313) than AA individuals (n = 2,204) were sequenced. The overall distribution of risk variants of rare, intermediate, and high frequency in both EA and AA individuals was similar to that observed for the total sample. The percentage of rare risk variants in each gene set was slightly higher in EA than in AA individuals, and a higher fraction of rare risk variants in each gene set in EA individuals had never been observed. Most risk variants that were of rare or intermediate frequency were specific to EA or AA individuals; however, most of the risk variants of intermediate frequency for ARMD were shared by both AA and EA individuals.
Burden of Risk Alleles per Individual
The mean number of risk alleles per individual in the NBS gene set was 0.57 (0.60 in EA individuals and 0.51 in AA individuals). This diminished to 0.18 overall (0.17 in EA individuals and 0.22 in AA individuals) if we excluded all variants that are typically reported and therefore of potential personal utility but for which it is quite unclear whether they are truly pathogenic. In both EA and AA individuals, 45% had at least one and 11% had at least two pathogenic alleles in the NBS gene set (Figure 3A). The maximum number of pathogenic alleles per individual was four in AA individuals (n = 2) and five in EA individuals (n = 1). Two pathogenic variants of intermediate or higher frequency accounted for the majority (68%) of pathogenic alleles found in each individual. The most common pathogenic variant (allele frequency = 7.2% [9.4% in EA individuals and 2.9% in AA individuals]) in the NBS gene set was c.940A>G (p.Asn314Asp) (rs2070074, or the Duarte allele) in GALT (MIM 606999), mutations in which cause classical galactosemia (MIM 230400). This was the only risk variant with an allele frequency > 5% in EA individuals in the NBS gene set. The second most common pathogenic variant (allele frequency ∼ 4.2%) in EA individuals was c.1330G>C (p.Asp444His) (rs13078881) in BTD (MIM 609019), mutations in which underlie biotinidase deficiency (MIM 253260). The most common variant (allele frequency = 4.0%) in AA individuals was c.20T>A (p.Glu7Val) (rs334) in HBB (MIM 141900), mutations in which cause sickle cell anemia (MIM 603903).
Figure 3.
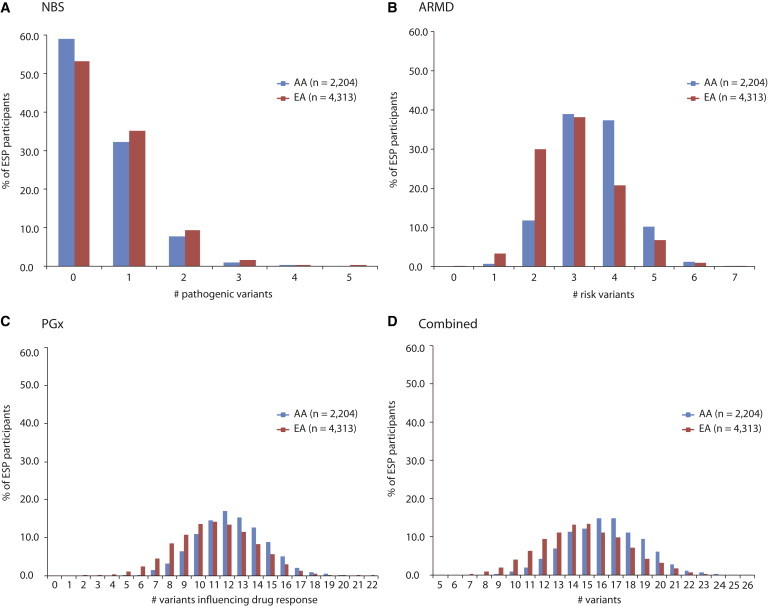
Plots of the Number of Pathogenic or Risk Variants per Individual
AA individuals are in blue, and EA individuals are in red. Plots are shown for NBS (A), ARMD (B), and PGx (C) gene sets and a combination across gene sets (D).
The mean number of risk alleles per individual in the ARMD gene set was 3.16 (3.00 for EA individuals and 3.48 for AA individuals). Almost every individual (i.e., 99.98%) carried at least one risk allele, and more than half carried more than three risk alleles in the ARMD gene set (Figure 3B). Four variants had allele frequencies > 20% in EA individuals, and three variants in AA individuals had allele frequencies > 20%. These four variants were located in either C3 (MIM 120700) or CFH (MIM 134370) (Table S8). The maximum number of ARMD risk alleles per person was seven in both EA (n = 2) and AA (n = 1) individuals.
The mean individual burden of known functional alleles in the PGx gene set was 11.5 (11.1 for EA individuals and 12.3 for AA individuals; Figure 3C). Each individual carried at least five known functional PGx alleles, and every AA individual carried at least six. The maximum number of known functional alleles per individual in the PGx gene set was 22 in EA individuals (n = 1) and 20 in AA individuals (n = 4). The frequency spectrum of PGx risk variants was fairly flat, suggesting that both rare and common variants contributed to the overall burden of risk (Figure S3; Table S8).
Across the NBS, ARMD, and PGx gene sets, the mean burden of risk alleles per individual was 15.3 (14.7 for EA individuals and 16.3 for AA individuals; Figure 3D). The overall estimate of burden was largely unchanged with the use of the more conservative NBS variant list (14.9: 14.3 in EA individuals and 16.0 in AA individuals). The range of risk alleles per individual varied widely. The minimum was five for EA individuals (n = 1) and seven for AA individuals (n = 1), and the maximum was 26 in both EA (n = 2) and AA (n = 1) individuals. These estimates represent a “snapshot” of the total burden of risk alleles to be found in any single individual but underscore the contention that every individual has alleles of potential clinical utility.
Carrier Burden for Severe Recessive Disorders of Childhood
Over the past several decades, attempts have been made to estimate the burden of deleterious variants per individual with the use of computational and/or population-genetic approaches.20,21,43 More recently, next-generation sequencing has enabled screening of relatively large numbers of genes that underlie disease-related traits in hundreds to thousands of individuals for estimating empirical burden.19 One estimate that has been widely cited is that by Bell et al.,19 who reported that individuals carry, on average, 2.8 alleles for severe (i.e., causing substantial morbidity or reduced lifespan) autosomal-recessive pediatric disorders on the basis of a sampling of 437 genes in 104 individuals. Their criteria for assessing whether a variant conferred risk of disease were conservative in that they excluded HGMD variants not listed as “DM,” variants with MAF ≥ 5%, and variants observed to be homozygous. Yet, 76 of the individuals sampled by Bell et al. were either known to be carriers or affected by a severe childhood recessive disorder, and the authors did not adequately control for the excess of pathogenic alleles in those individuals.
Using the same approach as Bell et al.19 but limiting the individuals assessed to the 26 “controls” in their sample and the 35 genes with “severe pediatric recessive mutations,” we found that the burden of risk alleles, excluding indels, was 1.73 instead of 2.8. This result suggests that their original calculation was biased upward in part by their inclusion of known affected and carrier individuals. Moreover, a sample size of 26 individuals is very small and prone to sampling bias. We therefore repeated the analysis for 10,000 subsamples of 26 ESP6500 individuals, excluding CF individuals from the calculations involving CFTR, to generate a distribution of 10,000 estimates of the carrier burden of severe pediatric recessive mutations. None of the average carrier burdens were close to the 1.73 we obtained by using their controls. Specifically, the average number of risk alleles per individual was 0.68 (SD = 0.17), and the maximum was 1.5. Results from our curation strategy on the same 35 genes were similar. The average carrier burden was 0.69 (SD = 0.16), and the maximum was 1.5. Accordingly, we think that ∼0.7 is most likely a more reliable estimate of the burden of risk alleles for severe childhood recessive disorders.
Discussion
Each of the 70 genes that we assessed contained known pathogenic variants, and every individual had several alleles (with potential clinical utility) that could be offered for return. This is an often-stated result with little, if any, empirical support. Moreover, our results most likely underestimate the number of risk alleles in each of the three gene sets (NBS, ARMD, PGx), much less each individual, because we did not have the opportunity to include pathogenic indels (e.g., ΔF508-CFTR) in our analysis, and accurate curation was limited by the quality and incompleteness of existing risk-variant databases, specifically HGMD, OMIM, and LSDBs. These databases are imperfect because estimates of allele frequencies in populations of non-European ancestry are often incomplete, and it is challenging to populate databases efficiently with up-to-date curated variant information. Indeed, the development of accurate and accessible variant databases will be critical to efforts to report both primary and incidental results from ES/WGS.
Our estimate of the carrier burden for severe recessive childhood disorders was 0.57, significantly less than the estimate of 2.8 variants per person for severe autosomal-recessive disorders reported by Bell et al.19 Although the genes we analyzed were not identical, we demonstrated that their estimate was biased upward because of their small sample size and by the inclusion of individuals who were ascertained because they were affected by a Mendelian disorder. The relatively large size of the ESP6500 data set enabled more accurate estimates of variant frequencies and improved detection of rare variants, at least in populations of European and African ancestry.
Our findings challenge the assumption that actionable incidental results, much less incidental results of potential clinical utility, in ES/WGS are rare. Indeed, they are rare only to the extent that the search is limited to those most likely affected by highly penetrant phenotypes. Empirical confirmation that incidental results of potential clinical utility are common in ES/WGS data is important because ES/WGS are being used in a variety of healthcare settings, including the evaluation of children with birth defects, developmental delay, or autism; the assessment of family risk of cancer and cancer profiling for personalizing therapeutics and delivering precision medicine; and the evaluation of adult-onset conditions, such as cardiomyopathy. Our results bring into better focus both the potential benefit of offering incidental results from ES/WGS to study participants, individuals, and families undergoing clinical care and the potential reporting burden that could be borne by clinicians. These findings, coupled with professional attitudes and concerns about the return of results,16 highlight the potential need for future recommendations and guidelines for considering the return of results to broader groups of individuals, including “healthy” individuals.
Our findings also undermine the notion that curating and/or reporting known risk alleles is an added burden to a service lab beyond what is required to answer a clinical question. Manual curation of the variants in ESP6500 was, of course, labor intensive, but annotating ES/WGS data for the 399 validated risk variants was computationally trivial. Development of comprehensive databases of validated risk variants is a major goal of multiple national and international efforts, and using such databases to annotate ES/WGS data in order to identify a primary result is standard practice in exome service laboratories.
Existing approaches to returning genetic results are not optimal for the return of large numbers of results with the breadth and scope (i.e., that influence a wide spectrum of phenotypes across the life of an individual) that we have demonstrated could be offered for return. Whether to return all or some incidental results and, if only some, which results to return, how to most effectively return them, and how best to use them to benefit health are unknown. The lack of such information is a major gap in knowledge in empowering individuals and families to translate genomic information into improved lifestyles, medical care, and ultimately long-term health. This problem is compounded further by challenges to the traditional process of communicating and disseminating genetic results.
Traditionally, genetic and genomic test results are usually communicated from provider to individual or family via mail, phone, or face-to-face contact. However, the volume of results and information is typically far in excess of staffing allocations at many institutions, resulting in long delays for the return of result information (National Society of Genetic Counselors 2014 Professional Status Survey Executive Summary).44,45 This delay and the resultant inability to act on the information can compromise patient safety, increase the risk of a poor clinical outcome, and disenfranchise families. Furthermore, with existing approaches to returning results, there are often few, if any, convenient and inexpensive ways for a provider to ensure that an individual and/or family has received and understood a result. This situation will continue to worsen, perhaps exponentially, as the use of ES/WGS in both research and clinical settings continues to expand. The countervailing concern is that the return of such incidental results might increase unnecessary follow-up costs.46 Although this would certainly be a concern in the context of a policy mandating the return of results, this empirical question remains open in the context of offering secondary results that hold a range of clinical and personal utility.
A number of alternative strategies for the return of results from ES/WGS are under development and/or being tested empirically.47,48 These strategies must meet the needs of individuals and families undergoing genetic testing and providers and institutions returning the genetic results. We have advocated for the use of individual- and family-focused web-based tools for self-guided management of genetic and genomic results such that ES/WGS results are framed as a dynamic resource of information that is managed by individuals in partnership with their healthcare providers.47 These approaches present ES/WGS results as a resource rather than a test, recognize that the utility of results will vary over time at different stages of life, and describe results in such a way as to make them more accessible and informative without excessively reducing their medical impact.
We were able to overcome several limitations of previous studies: (1) small sample sizes, ranging from 30 to 1,000 individuals;17,19,21,43 (2) analysis of primarily affected individuals;19 (3) analysis of lower-coverage exomes;21,43 (4) analysis of only known genotypes20 or targeted sequencing;19 and (5) analysis of only genes associated with autosomal-recessive conditions.19,20 Nevertheless, there are several important limitations to this work. First, the ESP6500 data set is derived from exomes of individuals with heart, lung, and blood phenotypes. Therefore, our results might not be fully generalizable to other populations. In particular, the variants identified, allele frequencies, and burden calculations might be underestimates for younger, specifically newborn, populations, given that most early-onset disorders and conditions that cause early death (e.g., <18 years of age) were not included in the cohorts sequenced by the ESP. Second, because the ESP sampled mainly individuals who self-identified as EA or AA, burden estimates of variants of utility in other populations (e.g., Asian Americans, Hispanic Latinos, Ashkenazi Jews, etc.) most likely differ. Third, we were unable to assess CNVs and indels in the ESP6500 cohort. For this reason, our burden calculations are probably underestimates and are unlikely to fully capture the potential burden of pathogenic variants for these three gene categories.
In summary, we have demonstrated that every exome can be expected to contain variants of potential clinical utility. Considering only those affected by highly penetrant actionable disorders, as suggested by the ACMG, would result in the return of incidental results from ES/WGS to only 1%–3% of the population. Expanding the return to include conditions such as those studied here has the potential to increase the value of ES/WGS because of its possible large-scale consequences on the effective practice of medicine. To this end, we think that efforts should focus on providing individuals with the opportunity to make educated choices about whether they would like to receive incidental results from ES/WGS and, if so, what kinds. In turn, this will require the development and testing of tools for effectively exercising this autonomy, allowing individuals in partnership with their healthcare providers to utilize genomic information as a resource over their lifespans for disease prevention, treatment, reproductive planning, and other psychosocial benefits. Finally, a more inclusive focus on curating risk variants in populations other than EA individuals is imperative for providing these potential benefits to all populations, especially underserved minorities.
Acknowledgments
We acknowledge the support of the National Heart, Lung, and Blood Institute (NHLBI), the contributions of the many research institutions that participated in this study, the study investigators, field staff, and the study participants who created the Exome Sequencing Project (ESP) resource for biomedical research. Funding for the NHLBI Grand Opportunity (GO) ESP was provided by NHLBI grants RC2 HL-103010 (Heart GO), RC2 HL-102923 (Lung GO), and RC2 HL-102924 (Women’s Health Initiative Sequencing Project). Exome sequencing was supported by NHLBI grants RC2 HL-102925 (Broad GO) and RC2 HL-102926 (Seattle GO). The content is solely the responsibility of the authors and does not necessarily represent the official views of the NIH.
Supplemental Data
Web Resources
The URLs for data presented herein are as follows:
1000 Genomes, http://www.1000genomes.org/
GeneTests, http://www.genetests.org/
HGMD, http://www.hgmd.org/
National Society of Genetic Counselors (NSGC) 2014 Professional Status Survey Executive Summary, http://nsgc.org/p/cm/ld/fid=68
NHLBI Exome Sequencing Project (ESP) Exome Variant Server, http://evs.gs.washington.edu/EVS/
Online Mendelian Inheritance in Man (OMIM), http://www.omim.org/
PharmGKB,https://www.pharmgkb.org/
PolyPhen-2, http://genetics.bwh.harvard.edu/pph2/
SeattleSeq Annotation 138 (134 used in this study), http://snp.gs.washington.edu/SeattleSeqAnnotation138/
References
- 1.Bamshad M.J., Ng S.B., Bigham A.W., Tabor H.K., Emond M.J., Nickerson D.A., Shendure J. Exome sequencing as a tool for Mendelian disease gene discovery. Nat. Rev. Genet. 2011;12:745–755. doi: 10.1038/nrg3031. [DOI] [PubMed] [Google Scholar]
- 2.Yang Y., Muzny D.M., Reid J.G., Bainbridge M.N., Willis A., Ward P.A., Braxton A., Beuten J., Xia F., Niu Z. Clinical whole-exome sequencing for the diagnosis of mendelian disorders. N. Engl. J. Med. 2013;369:1502–1511. doi: 10.1056/NEJMoa1306555. [DOI] [PMC free article] [PubMed] [Google Scholar]
- 3.Below J.E., Earl D.L., Shively K.M., McMillin M.J., Smith J.D., Turner E.H., Stephan M.J., Al-Gazali L.I., Hertecant J.L., Chitayat D., University of Washington Center for Mendelian Genomics Whole-genome analysis reveals that mutations in inositol polyphosphate phosphatase-like 1 cause opsismodysplasia. Am. J. Hum. Genet. 2013;92:137–143. doi: 10.1016/j.ajhg.2012.11.011. [DOI] [PMC free article] [PubMed] [Google Scholar]
- 4.Ng S.B., Buckingham K.J., Lee C., Bigham A.W., Tabor H.K., Dent K.M., Huff C.D., Shannon P.T., Jabs E.W., Nickerson D.A. Exome sequencing identifies the cause of a mendelian disorder. Nat. Genet. 2010;42:30–35. doi: 10.1038/ng.499. [DOI] [PMC free article] [PubMed] [Google Scholar]
- 5.Burke W., Matheny Antommaria A.H., Bennett R., Botkin J., Clayton E.W., Henderson G.E., Holm I.A., Jarvik G.P., Khoury M.J., Knoppers B.M. Recommendations for returning genomic incidental findings? We need to talk! Genet. Med. 2013;15:854–859. doi: 10.1038/gim.2013.113. [DOI] [PMC free article] [PubMed] [Google Scholar]
- 6.Green R.C., Lupski J.R., Biesecker L.G. Reporting genomic sequencing results to ordering clinicians: incidental, but not exceptional. JAMA. 2013;310:365–366. doi: 10.1001/jama.2013.41703. [DOI] [PMC free article] [PubMed] [Google Scholar]
- 7.McGuire A.L., Joffe S., Koenig B.A., Biesecker B.B., McCullough L.B., Blumenthal-Barby J.S., Caulfield T., Terry S.F., Green R.C. Point-counterpoint. Ethics and genomic incidental findings. Science. 2013;340:1047–1048. doi: 10.1126/science.1240156. [DOI] [PMC free article] [PubMed] [Google Scholar]
- 8.Ross L.F., Rothstein M.A., Clayton E.W. Mandatory extended searches in all genome sequencing: “incidental findings,” patient autonomy, and shared decision making. JAMA. 2013;310:367–368. doi: 10.1001/jama.2013.41700. [DOI] [PubMed] [Google Scholar]
- 9.Tabor H.K., Berkman B.E., Hull S.C., Bamshad M.J. Genomics really gets personal: how exome and whole genome sequencing challenge the ethical framework of human genetics research. Am. J. Med. Genet. A. 2011;155A:2916–2924. doi: 10.1002/ajmg.a.34357. [DOI] [PMC free article] [PubMed] [Google Scholar]
- 10.Dewey F.E., Grove M.E., Pan C., Goldstein B.A., Bernstein J.A., Chaib H., Merker J.D., Goldfeder R.L., Enns G.M., David S.P. Clinical interpretation and implications of whole-genome sequencing. JAMA. 2014;311:1035–1045. doi: 10.1001/jama.2014.1717. [DOI] [PMC free article] [PubMed] [Google Scholar]
- 11.Fabsitz R.R., McGuire A., Sharp R.R., Puggal M., Beskow L.M., Biesecker L.G., Bookman E., Burke W., Burchard E.G., Church G., National Heart, Lung, and Blood Institute working group Ethical and practical guidelines for reporting genetic research results to study participants: updated guidelines from a National Heart, Lung, and Blood Institute working group. Circ Cardiovasc Genet. 2010;3:574–580. doi: 10.1161/CIRCGENETICS.110.958827. [DOI] [PMC free article] [PubMed] [Google Scholar]
- 12.Parens E., Appelbaum P., Chung W. Incidental findings in the era of whole genome sequencing? Hastings Cent. Rep. 2013;43:16–19. doi: 10.1002/hast.189. [DOI] [PMC free article] [PubMed] [Google Scholar]
- 13.Bollinger J.M., Scott J., Dvoskin R., Kaufman D. Public preferences regarding the return of individual genetic research results: findings from a qualitative focus group study. Genet. Med. 2012;14:451–457. doi: 10.1038/gim.2011.66. [DOI] [PMC free article] [PubMed] [Google Scholar]
- 14.Sapp J., Dong D., Stark C., Ivey L., Hooker G., Biesecker L., Biesecker B. Parental attitudes, values, and beliefs toward the return of results from exome sequencing in children. Clin. Genet. 2013 doi: 10.1111/cge.12254. Published online August 20, 2013. [DOI] [PMC free article] [PubMed] [Google Scholar]
- 15.Levenseller B.L., Soucier D.J., Miller V.A., Harris D., Conway L., Bernhardt B.A. Stakeholders’ Opinions on the Implementation of Pediatric Whole Exome Sequencing: Implications for Informed Consent. J. Genet. Couns. 2014;23:552–565. doi: 10.1007/s10897-013-9626-y. [DOI] [PMC free article] [PubMed] [Google Scholar]
- 16.Yu J.H., Harrell T.M., Jamal S.M., Tabor H.K., Bamshad M.J. Attitudes of genetics professionals toward the return of incidental results from exome and whole-genome sequencing. Am. J. Hum. Genet. 2014;95:77–84. doi: 10.1016/j.ajhg.2014.06.004. [DOI] [PMC free article] [PubMed] [Google Scholar]
- 17.Dorschner M.O., Amendola L.M., Turner E.H., Robertson P.D., Shirts B.H., Gallego C.J., Bennett R.L., Jones K.L., Tokita M.J., Bennett J.T., National Heart, Lung, and Blood Institute Grand Opportunity Exome Sequencing Project Actionable, pathogenic incidental findings in 1,000 participants’ exomes. Am. J. Hum. Genet. 2013;93:631–640. doi: 10.1016/j.ajhg.2013.08.006. [DOI] [PMC free article] [PubMed] [Google Scholar]
- 18.Johnston J.J., Rubinstein W.S., Facio F.M., Ng D., Singh L.N., Teer J.K., Mullikin J.C., Biesecker L.G. Secondary variants in individuals undergoing exome sequencing: screening of 572 individuals identifies high-penetrance mutations in cancer-susceptibility genes. Am. J. Hum. Genet. 2012;91:97–108. doi: 10.1016/j.ajhg.2012.05.021. [DOI] [PMC free article] [PubMed] [Google Scholar]
- 19.Bell C.J., Dinwiddie D.L., Miller N.A., Hateley S.L., Ganusova E.E., Mudge J., Langley R.J., Zhang L., Lee C.C., Schilkey F.D. Carrier testing for severe childhood recessive diseases by next-generation sequencing. Sci. Transl. Med. 2011;3:ra4. doi: 10.1126/scitranslmed.3001756. [DOI] [PMC free article] [PubMed] [Google Scholar]
- 20.Lazarin G.A., Haque I.S., Nazareth S., Iori K., Patterson A.S., Jacobson J.L., Marshall J.R., Seltzer W.K., Patrizio P., Evans E.A., Srinivasan B.S. An empirical estimate of carrier frequencies for 400+ causal Mendelian variants: results from an ethnically diverse clinical sample of 23,453 individuals. Genet. Med. 2013;15:178–186. doi: 10.1038/gim.2012.114. [DOI] [PMC free article] [PubMed] [Google Scholar]
- 21.Xue Y., Chen Y., Ayub Q., Huang N., Ball E.V., Mort M., Phillips A.D., Shaw K., Stenson P.D., Cooper D.N., Tyler-Smith C., 1000 Genomes Project Consortium Deleterious- and disease-allele prevalence in healthy individuals: insights from current predictions, mutation databases, and population-scale resequencing. Am. J. Hum. Genet. 2012;91:1022–1032. doi: 10.1016/j.ajhg.2012.10.015. [DOI] [PMC free article] [PubMed] [Google Scholar]
- 22.Gonzalez-Garay M.L., McGuire A.L., Pereira S., Caskey C.T. Personalized genomic disease risk of volunteers. Proc. Natl. Acad. Sci. USA. 2013;110:16957–16962. doi: 10.1073/pnas.1315934110. [DOI] [PMC free article] [PubMed] [Google Scholar]
- 23.Refsgaard L., Holst A.G., Sadjadieh G., Haunsø S., Nielsen J.B., Olesen M.S. High prevalence of genetic variants previously associated with LQT syndrome in new exome data. Eur. J. Hum. Genet. 2012;20:905–908. doi: 10.1038/ejhg.2012.23. [DOI] [PMC free article] [PubMed] [Google Scholar]
- 24.Green R.C., Berg J.S., Grody W.W., Kalia S.S., Korf B.R., Martin C.L., McGuire A.L., Nussbaum R.L., O’Daniel J.M., Ormond K.E., American College of Medical Genetics and Genomics ACMG recommendations for reporting of incidental findings in clinical exome and genome sequencing. Genet. Med. 2013;15:565–574. doi: 10.1038/gim.2013.73. [DOI] [PMC free article] [PubMed] [Google Scholar]
- 25.Biesecker L.G. Opportunities and challenges for the integration of massively parallel genomic sequencing into clinical practice: lessons from the ClinSeq project. Genet. Med. 2012;14:393–398. doi: 10.1038/gim.2011.78. [DOI] [PMC free article] [PubMed] [Google Scholar]
- 26.Tennessen J.A., Bigham A.W., O’Connor T.D., Fu W., Kenny E.E., Gravel S., McGee S., Do R., Liu X., Jun G., Broad GO. Seattle GO. NHLBI Exome Sequencing Project Evolution and functional impact of rare coding variation from deep sequencing of human exomes. Science. 2012;337:64–69. doi: 10.1126/science.1219240. [DOI] [PMC free article] [PubMed] [Google Scholar]
- 27.Resnikoff S., Pascolini D., Etya’ale D., Kocur I., Pararajasegaram R., Pokharel G.P., Mariotti S.P. Global data on visual impairment in the year 2002. Bull. World Health Organ. 2004;82:844–851. [PMC free article] [PubMed] [Google Scholar]
- 28.Porter L.F., Black G.C. Personalized ophthalmology. Clin. Genet. 2014;86:1–11. doi: 10.1111/cge.12389. [DOI] [PMC free article] [PubMed] [Google Scholar]
- 29.Lee J.W., Aminkeng F., Bhavsar A.P., Shaw K., Carleton B.C., Hayden M.R., Ross C.J. The emerging era of pharmacogenomics: current successes, future potential, and challenges. Clin. Genet. 2014;86:21–28. doi: 10.1111/cge.12392. [DOI] [PMC free article] [PubMed] [Google Scholar]
- 30.Rieder M.J., Carleton B. Pharmacogenomics and adverse drug reactions in children. Front. Genet. 2014;5:78. doi: 10.3389/fgene.2014.00078. [DOI] [PMC free article] [PubMed] [Google Scholar]
- 31.Filipski K.K., Mechanic L.E., Long R., Freedman A.N. Pharmacogenomics in oncology care. Front. Genet. 2014;5:73. doi: 10.3389/fgene.2014.00073. [DOI] [PMC free article] [PubMed] [Google Scholar]
- 32.Li H., Ruan J., Durbin R. Mapping short DNA sequencing reads and calling variants using mapping quality scores. Genome Res. 2008;18:1851–1858. doi: 10.1101/gr.078212.108. [DOI] [PMC free article] [PubMed] [Google Scholar]
- 33.Li H., Handsaker B., Wysoker A., Fennell T., Ruan J., Homer N., Marth G., Abecasis G., Durbin R., 1000 Genome Project Data Processing Subgroup The Sequence Alignment/Map format and SAMtools. Bioinformatics. 2009;25:2078–2079. doi: 10.1093/bioinformatics/btp352. [DOI] [PMC free article] [PubMed] [Google Scholar]
- 34.Li H., Durbin R. Fast and accurate short read alignment with Burrows-Wheeler transform. Bioinformatics. 2009;25:1754–1760. doi: 10.1093/bioinformatics/btp324. [DOI] [PMC free article] [PubMed] [Google Scholar]
- 35.McKenna A., Hanna M., Banks E., Sivachenko A., Cibulskis K., Kernytsky A., Garimella K., Altshuler D., Gabriel S., Daly M., DePristo M.A. The Genome Analysis Toolkit: a MapReduce framework for analyzing next-generation DNA sequencing data. Genome Res. 2010;20:1297–1303. doi: 10.1101/gr.107524.110. [DOI] [PMC free article] [PubMed] [Google Scholar]
- 36.Abecasis G.R., Auton A., Brooks L.D., DePristo M.A., Durbin R.M., Handsaker R.E., Kang H.M., Marth G.T., McVean G.A., 1000 Genomes Project Consortium An integrated map of genetic variation from 1,092 human genomes. Nature. 2012;491:56–65. doi: 10.1038/nature11632. [DOI] [PMC free article] [PubMed] [Google Scholar]
- 37.Purcell S., Neale B., Todd-Brown K., Thomas L., Ferreira M.A., Bender D., Maller J., Sklar P., de Bakker P.I., Daly M.J., Sham P.C. PLINK: a tool set for whole-genome association and population-based linkage analyses. Am. J. Hum. Genet. 2007;81:559–575. doi: 10.1086/519795. [DOI] [PMC free article] [PubMed] [Google Scholar]
- 38.Manichaikul A., Mychaleckyj J.C., Rich S.S., Daly K., Sale M., Chen W.M. Robust relationship inference in genome-wide association studies. Bioinformatics. 2010;26:2867–2873. doi: 10.1093/bioinformatics/btq559. [DOI] [PMC free article] [PubMed] [Google Scholar]
- 39.Adzhubei I.A., Schmidt S., Peshkin L., Ramensky V.E., Gerasimova A., Bork P., Kondrashov A.S., Sunyaev S.R. A method and server for predicting damaging missense mutations. Nat. Methods. 2010;7:248–249. doi: 10.1038/nmeth0410-248. [DOI] [PMC free article] [PubMed] [Google Scholar]
- 40.Kircher M., Witten D.M., Jain P., O’Roak B.J., Cooper G.M., Shendure J. A general framework for estimating the relative pathogenicity of human genetic variants. Nat. Genet. 2014;46:310–315. doi: 10.1038/ng.2892. [DOI] [PMC free article] [PubMed] [Google Scholar]
- 41.Cooper G.M., Stone E.A., Asimenos G., Green E.D., Batzoglou S., Sidow A., NISC Comparative Sequencing Program Distribution and intensity of constraint in mammalian genomic sequence. Genome Res. 2005;15:901–913. doi: 10.1101/gr.3577405. [DOI] [PMC free article] [PubMed] [Google Scholar]
- 42.Boone P.M., Campbell I.M., Baggett B.C., Soens Z.T., Rao M.M., Hixson P.M., Patel A., Bi W., Cheung S.W., Lalani S.R. Deletions of recessive disease genes: CNV contribution to carrier states and disease-causing alleles. Genome Res. 2013;23:1383–1394. doi: 10.1101/gr.156075.113. [DOI] [PMC free article] [PubMed] [Google Scholar]
- 43.MacArthur D.G., Balasubramanian S., Frankish A., Huang N., Morris J., Walter K., Jostins L., Habegger L., Pickrell J.K., Montgomery S.B., 1000 Genomes Project Consortium A systematic survey of loss-of-function variants in human protein-coding genes. Science. 2012;335:823–828. doi: 10.1126/science.1215040. [DOI] [PMC free article] [PubMed] [Google Scholar]
- 44.Dickerson J.A., Cole B., Conta J.H., Wellner M., Wallace S.E., Jack R.M., Rutledge J., Astion M.L. Improving the value of costly genetic reference laboratory testing with active utilization management. Arch. Pathol. Lab. Med. 2014;138:110–113. doi: 10.5858/arpa.2012-0726-OA. [DOI] [PubMed] [Google Scholar]
- 45.Casalino L.P., Dunham D., Chin M.H., Bielang R., Kistner E.O., Karrison T.G., Ong M.K., Sarkar U., McLaughlin M.A., Meltzer D.O. Frequency of failure to inform patients of clinically significant outpatient test results. Arch. Intern. Med. 2009;169:1123–1129. doi: 10.1001/archinternmed.2009.130. [DOI] [PubMed] [Google Scholar]
- 46.Feero W.G. Clinical application of whole-genome sequencing: proceed with care. JAMA. 2014;311:1017–1019. doi: 10.1001/jama.2014.1718. [DOI] [PubMed] [Google Scholar]
- 47.Yu J.H., Jamal S.M., Tabor H.K., Bamshad M.J. Self-guided management of exome and whole-genome sequencing results: changing the results return model. Genet. Med. 2013;15:684–690. doi: 10.1038/gim.2013.35. [DOI] [PMC free article] [PubMed] [Google Scholar]
- 48.Vassy J.L., Lautenbach D.M., McLaughlin H.M., Kong S.W., Christensen K.D., Krier J., Kohane I.S., Feuerman L.Z., Blumenthal-Barby J., Roberts J.S., MedSeq Project The MedSeq Project: a randomized trial of integrating whole genome sequencing into clinical medicine. Trials. 2014;15:85. doi: 10.1186/1745-6215-15-85. [DOI] [PMC free article] [PubMed] [Google Scholar]
Associated Data
This section collects any data citations, data availability statements, or supplementary materials included in this article.