

Abstract
Studies of time-dependent drug and environmental effects on single, live bacterial cells would benefit significantly from a permeable, nonperturbative, long-lived fluorescent stain specific to the nucleoids (chromosomal DNA). The ideal stain would not affect cell growth rate or nucleoid morphology and dynamics, even during laser illumination for hundreds of camera frames. In this study, time-dependent, single-cell fluorescence imaging with laser excitation and a sensitive electron-multiplying charge-coupled-device (EMCCD) camera critically tested the utility of “dead-cell stains” (SYTOX orange and SYTOX green) and “live-cell stains” (DRAQ5 and SYTO 61) and also 4′,6-diamidino-2-phenylindole (DAPI). Surprisingly, the dead-cell stains were nearly ideal for imaging live Escherichia coli, while the live-cell stains and DAPI caused nucleoid expansion and, in some cases, cell permeabilization and the halting of growth. SYTOX orange performed well for both the Gram-negative E. coli and the Gram-positive Bacillus subtilis. In an initial application, we used two-color fluorescence imaging to show that the antimicrobial peptide cecropin A destroyed nucleoid-ribosome segregation over 20 min after permeabilization of the E. coli cytoplasmic membrane, reminiscent of the long-term effects of the drug rifampin. In contrast, the human cathelicidin LL-37, while similar to cecropin A in structure, length, charge, and the ability to permeabilize bacterial membranes, had no observable effect on nucleoid-ribosome segregation. Possible underlying causes are suggested.
INTRODUCTION
The morphology of bacterial nucleoids (the regions containing the chromosomal DNA) is sensitive to the stage of growth (degree of chromosome replication and segregation), to the quality of growth medium, and to the application of external stresses such as nutrient downshift or treatment with drugs (1–5). High-resolution structural studies of bacterial nucleoids using electron microscopy (EM) on slices of fixed cells have a long history (6). Over time, it became clear that nucleoid morphology is highly sensitive to the method of fixation (6, 7). Wide-field fluorescence microscopy lacks the spatial resolution of EM, but it has the important advantage of enabling imaging of live cells as they grow. Live-cell imaging thus offers the possibility of monitoring time-dependent changes in nucleoid morphology during normal growth or following application of an external stress.
A simple, general method for nonspecific, nonperturbative fluorescent staining of DNA in live bacterial cells remains elusive. One useful strategy places a genetically encoded fluorescent protein on the broadly distributed DNA-binding protein HU (2, 8, 9). However, there is not yet a clear understanding of how HU and other DNA-binding proteins distribute across the chromosomal DNA. As a simple alternative strategy, in this study, we tested a variety of commercially available DNA-staining dyes for their utility in nucleoid imaging for live E. coli cells. When used in flow cytometry assays, these stains are often classified as “dead-cell stains” (which permeate only dead cells whose membranes are compromised) or “live-cell stains” (which permeate live cells). Dead-cell stains include members of the proprietary SYTOX family (Molecular Probes, Invitrogen Life Technologies) (10). Live-cell stains include DRAQ5 (Biostatus Limited) and members of the SYTO family (Molecular Probes, Invitrogen Life Technologies). We also test the widely used DAPI (4′,6-diamidino-2-phenylindole).
We employed single-cell fluorescence microscopy and phase-contrast microscopy to monitor nucleoid size and shape and tip-to-tip cell length (Lcell) in real time. Images were collected with a sensitive electron-multiplying charge-coupled device (EMCCD) camera. Surprisingly, we found that the dead-cell stains SYTOX orange and SYTOX green are excellent nucleoid stains for live-cell imaging of both the Gram-negative E. coli and the Gram-positive Bacillus subtilis under sensitive measurement conditions. In sharp contrast, the live-cell stains DRAQ5 and SYTO 61 and also DAPI inhibit growth, perturb apparent nucleoid size and shape, and may even permeabilize the cytoplasmic membrane of E. coli. Our method for quantitative characterization of the overall spatial extent of the nucleoids along the long and short E. coli axes may find widespread use as well.
In an initial application, we coimaged the E. coli nucleoids (stained by SYTOX orange) and ribosomes (labeled with an S2-YFP construct expressed from the chromosome) and tested for effects of antimicrobial peptides (AMPs) on DNA-ribosome segregation (11). After permeabilizing both outer membrane (OM) and cytoplasmic membrane (CM), cecropin A (from a moth) causes dramatic axial and radial expansion of the nucleoid and mixing of DNA and ribosomes, behavior reminiscent of the long-time effects of the drug rifampin. In contrast, the human antimicrobial peptide LL-37 leaves the normal DNA-ribosome spatial distributions intact.
MATERIALS AND METHODS
Sample preparation for microscopy.
Measurements of single-cell growth rate and imaging of the E. coli nucleoids were performed on strain VH1000 (MG1655; lacI and lacZ negative and pyrE+) (12). Cell cultures were grown in EZ rich defined medium (EZRDM; Teknova) (13). The VH1000 strain grows with a doubling time of 45 min in a shaken batch culture at 30°C (see Fig. S1 in the supplemental material). Cells were grown overnight with shaking in a 30°C water bath. We subsequently made subcultures by diluting the stationary-phase culture at least 1:100 into 2 ml of fresh EZRDM. When cells had grown to mid-log phase (optical density at 600 nm [OD600] = 0.2 to 0.4 with 1-cm path length), 500 μl of cell culture was injected into a microfluidics flow chamber and then rinsed with 1 ml of fresh, warmed, aerated growth medium. The microfluidics chamber is made of polydimethylsiloxane (PDMS) adhered to a glass coverslip. It provides a simple rectilinear observation volume of the dimensions 11 mm by 6 mm by 50 μm (length by width by height), with inlet and outlet ports to enable flow. The preassembled microfluidics chamber was brought into contact with the microscope objective and warmed to 30°C before injection of the cells for imaging.
Doubling times for single-cell growth in the microfluidics device were estimated by measuring cell length versus time using phase-contrast microscopy (11). Cells grew with an average doubling time of 47.5 min (see Fig. S2 in the supplemental material) in the microfluidics chamber. The day-to-day variation in doubling time was ±3 min.
For nucleoid staining experiments, SYTOX orange solution (50 μM stock concentration) was added to a growing mid-log-phase culture (OD600 = 0.2 to 0.4) to a final concentration of 500 nM. After 10 min of incubation, the cells were centrifuged twice at 8,000 × g for 2 min and resuspended in fresh EZRDM, after which 500 μl of cell culture was injected into the microfluidics chamber. The rinsing steps eliminate background fluorescence from dye molecules that adhere to the coverslip without removing SYTOX orange from the cytoplasm. This SYTOX orange concentration and incubation time provide bright staining of the nucleoids, enabling at least 500 high-quality DNA snapshots without extensive photobleaching. For long experiments, cell growth during imaging causes dilution of the SYTOX orange signal over time. Experiments with SYTOX green were conducted in the same way, again using incubation for 10 min in a 500 nM bulk concentration and prerinsing twice.
DRAQ5 was used at a final concentration of 500 nM. This is 10 times lower than our measured 5 μM MIC for DRAQ5 (data not shown). Similarly, Silva and coworkers found that 5 to 10 μM DRAQ5 reduces E. coli viability (14). For the imaging studies, 10 μl of a 100 μM stock solution of DRAQ5 was added to a 2-ml culture of cells in mid-log phase (500 nM DRAQ5 concentration) and the culture was shaken for 10 min. However, rinsing of the residual bulk DRAQ5 resulted in a severe loss of DRAQ5 fluorescence signal from the cells. Therefore, the DRAQ5 imaging studies were carried out without rinsing.
DAPI (Sigma) was used at a final concentration of 500 nM. Cells were incubated in DAPI for 10 min before imaging, without rinsing. The DNA stain SYTO 61 (Molecular Probes) was used at a final concentration of 200 nM. Cells were incubated for 10 min in SYTO 61 and then centrifuged and rinsed with EZRDM twice before imaging.
We carried out several experiments measuring growth rates of Bacillus subtilis (strain 168; BGSC code 1A1) with and without SYTOX orange staining. The growth medium was “subtilis-EZRDM,” a modified version of the EZRDM used for E. coli (15). Additional details of cell handling are given elsewhere (15). The B. subtilis studies used a 60-μl flow chamber constructed of two glass coverslips that sandwich a silicone gasket with a 3-mm by 31-mm by 650-μm slit carved in it. After the chamber was assembled, it was placed in vacuum for ∼5 min to remove unwanted air pockets. The chamber was then placed on the microscope, equilibrated to 37°C, and loaded with cells from a liquid culture. Cells in bulk medium were grown to mid-log phase (OD600 = 0.2 to 0.4), incubated with 100 nM SYTOX orange for 15 min, centrifuged twice at 8,000 × g for 2 min, and resuspended in fresh medium. Eight hundred microliters of cell culture was injected into the flow chamber for plating, after which plated cells were rinsed with 1 ml of fresh growth medium. Subsequently, fresh, aerated growth medium flowed through the chamber at 0.1 ml/min using a syringe pump. Under these conditions, unstained B. subtilis cells grew in the flow chamber with a doubling time of ∼47 min. This is faster than the ∼60-min doubling time of B. subtilis in the chamber without flow but substantially slower than the ∼20-min doubling time found in bulk medium.
One-color fluorescence and phase-contrast microscopy.
E. coli cells were imaged using a Nikon Eclipse Ti inverted microscope equipped with an oil immersion objective (Nikon CFI Plan Apo Lambda DM; 100× oil immersion objective, 1.45 numerical aperture [NA]). Alternating fluorescence and phase-contrast images were recorded by a back-illuminated EMCCD camera with 512 by 512 pixels of 16 μm by 16 μm each (iXon DV-897; Andor Technology, CT). Each pixel corresponds to 105 by 105 nm2 in real space (150× overall magnification). The spatial distribution of SYTOX orange is monitored using 561-nm laser excitation (CrystaLaser, Reno, NV) of an intensity of 5 to 10 W/cm2 at the sample. The SYTOX orange fluorescence was collected through a bandpass filter (bright line 617/73-25; Semrock). To enable measurement of both fluorescence and cell length versus time, the sample was alternately illuminated by the 561-nm laser and by white light for phase-contrast imaging. Camera frames were acquired at a total rate of 1 frame per 6 s, with an exposure time of 50 ms during each frame. Thus, each complete phase-contrast/fluorescence cycle took 12 s. For imaging of DNA stained by DRAQ5 or SYTO 61, the sample was illuminated by a 633-nm HeNe laser (50 to 100 W/cm2) using a z633rpc dichroic mirror. Fluorescence was isolated with a 700/75 emission filter (Chroma). SYTOX green-stained DNA was imaged using a 488-nm Ar+ excitation laser (Melles Griot, Carlsbad, CA; 5 to 10 W/cm2) and a 525/50 emission filter (Chroma). A Lumen Pro 2000 illumination system was used to illuminate DAPI-stained cells. Bacillus subtilis cells stained by SYTOX orange, and the effects of cecropin A and LL-37 on the nucleoids were imaged in a different microscope setup as described earlier (15, 16).
Image acquisition and data analysis.
The interleaved fluorescence and phase-contrast images were separated during image processing. To determine the tip-to-tip cell length (Lcell), phase-contrast images were analyzed using the MicrobeTracker suite (developed by the Jacobs-Wagner lab [17]), with input parameters modified appropriately for E. coli and B. subtilis. After the cells are outlined (see yellow boundary in Fig. 3B), Lcell is calculated as the contour length of the central spine of the outline (see red line in Fig. 3B). The estimated precision of the measurement is ±30 nm.
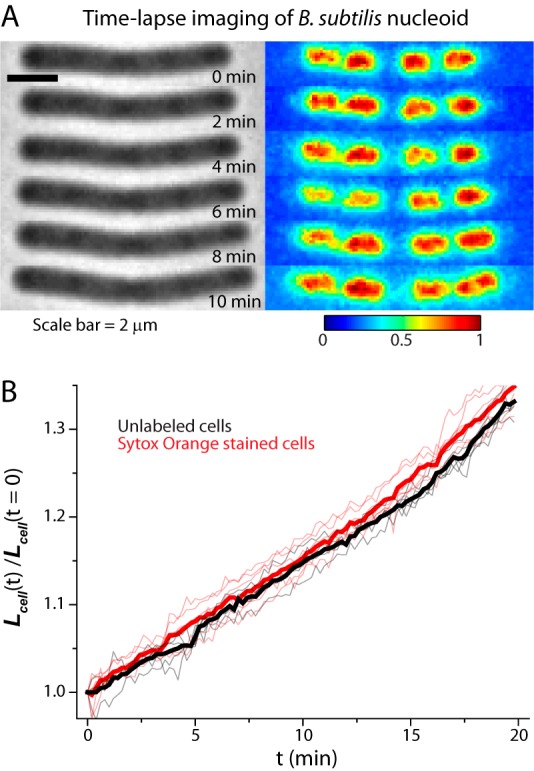
FIG 3.

Growth control experiments using SYTOX orange staining and 561-nm laser light. (A) Schematic of alternating illumination for phase-contrast and fluorescence imaging. Alternate laser illumination begins at the time indicated by a blue line. (B) Tip-to-tip length of the cell is calculated from the red centerline of the yellow outline of the cell obtained from MicrobeTracker. (C) Relative cell length versus time for 18 cells subjected only to phase-contrast imaging (thin black lines). The thick black line is the mean of the 18 traces. (D) On the left is a schematic of first growth control experiment; see the text. On the right is shown relative cell length versus time for SYTOX orange-labeled cells that are illuminated (thin red lines; 11 cells) or not illuminated (thin gray lines; 18 cells). Thick lines show the mean in each case. In both panels D and E, the blue dashed line indicates the onset of 561-nm illumination. (E) On the left is a schematic of second growth control experiment; see the text. On the right is shown relative cell length versus time for SYTOX orange-labeled cells (thin red lines; 7 cells) with cells that are not stained (thin gray lines; 19 cells). Thick lines are means. The two cell types received the same illumination.
Fluorescence images were analyzed using a MATLAB program developed in the Weisshaar lab. First, a binary mask was made from the prior phase-contrast image of each cell in each frame. The program fits an ellipse to the binary mask to determine the orientation of the cell. The two principal axes of the ellipse are used as the coordinate system for the cell. The long axis is referred to as x (axial dimension), and the short axis perpendicular to the x axis is referred to as y (transverse dimension). Fluorescence images of the DNA stain are projected along the x or y axis for the nucleoid shape analysis presented below (see Fig. 2C). Time courses of the intensity profiles of the nucleoid images along these two dimensions are analyzed to follow coarse changes in nucleoid morphology over time.
FIG 2.

Nucleoid morphology versus time from SYTOX orange staining of a single cell. (A) Time course of phase-contrast images (left) and SYTOX orange-stained DNA images of a single cell. Each false-color image of the fluorescence intensity has background subtracted and intensities scaled so that the maximum pixel intensity is 1 and the minimum is 0. This relative scale provides correction for photobleaching and volume dilution over the 20-min observation period. (B) Axial line scans of SYTOX orange intensity over time for the same cell as in panel A. (C) Fluorescence image of a different cell stained with SYTOX orange. Features of the axial and transverse line scans define the nucleoid length, lDNA, and width, wDNA. (D and E) For 142 cells stained with SYTOX orange and imaged once, scatter plots (“+” symbols) of the lDNA (D) and wDNA (E) versus tip-to-tip cell length, Lcell, are shown. The green, red, and blue traces show lDNA(t) and wDNA(t) versus Lcell for three single cells over 20 min of observation. For each cell, time progresses from left to right (lighter shade to darker shade).
Two-color imaging of AMP action on nucleoids and ribosomes.
We employed a two-color imaging scheme to simultaneously observe the effect of the antimicrobial peptides (AMPs) cecropin A and LL-37 on the spatial distributions of the E. coli nucleoids and 30S ribosomal subunits. The SYTOX orange staining protocol was used as described above. SYTOX orange was imaged using 561-nm excitation and a 605/75 emission filter. To enable imaging of ribosomes, we used strain AFS55, which expresses the ribosomal protein S2-YFP from the chromosome. S2-YFP is incorporated into 30S subunits prior to YFP fluorescence maturation (11). The 30S subunits were imaged using 488-nm excitation and a 525/50 emission filter. As before, phase-contrast images were used to monitor cell length versus time. The imaging sequence consisted of interleaved pulses of 488 nm (30S ribosomal subunits), 561 nm (DNA stained by SYTOX orange), and phase contrast (to obtain the cell outline). The exposure time for each light pulse was 50 ms and consecutive pulses were spaced by 3 s, resulting in a total cycle time of 9 s. Cells were treated with antimicrobial peptides at 4.5 min after the start of image acquisition. The total observation time was 45 min (300 imaging cycles). Additional details are provided in earlier publications (18, 19). Postacquisition, the interleaved snapshots were separated into the three respective channels for image analysis.
RESULTS
Tests of SYTOX orange for imaging nucleoids in live E. coli.
A fluorescence image of a field of E. coli cells prestained with 500 nM SYTOX orange is shown in Fig. 1. These images are qualitatively similar to those obtained by imaging of the DNA-binding protein HU labeled by YFP (HU-YFP) shown in Fig. S3 in the supplemental material and to the HU-mCherry images in the work of Fisher et al. (2). The overall intensity of fluorescence is quite uniform from cell to cell, and the level and quality of staining are consistent from cell culture to cell culture. If the amount of DNA grows in proportion to cell volume and if staining is uniform, then total intensity would be directly proportional to volume and roughly proportional to length. This is essentially the case. In Fig. S2 in the supplemental material, we show that total SYTOX orange fluorescence intensity is roughly proportional to the cell length (Lcell). The cell-to-cell variation in stain intensity among cells of similar length is about ±30%. Part of this variation is due to nonuniform laser intensity (±20%) across the field of cells.
FIG 1.
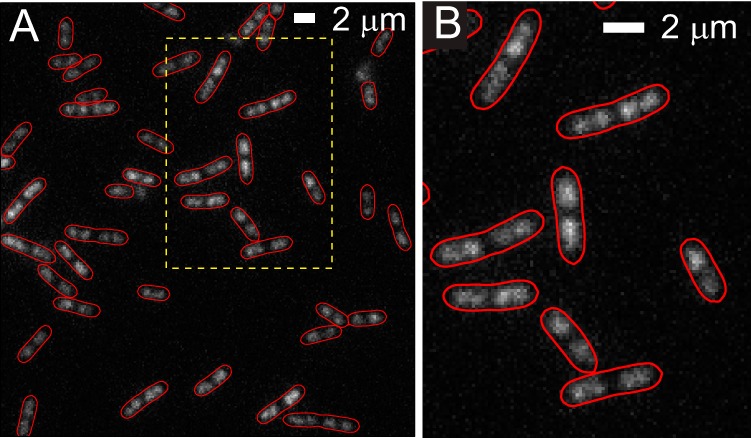
Fluorescence image of E. coli cells stained by SYTOX orange. The red cell outline is created from the phase-contrast images using MicrobeTracker. (A) Large field of view. (B) Zoomed-in view of the dashed box in panel A. For comparison with HU-YFP images, see Fig. S3 in the supplemental material.
Time-lapse microscopy was performed on cells stained by SYTOX orange to examine the nucleoid morphology as the cells grew and to test for possible effects of the stain plus laser illumination on growth rate. In Fig. 2A, we show phase-contrast images and false-color renditions of the SYTOX orange intensity distribution over 20 min for one representative (fairly long) cell. The phase-contrast images show gradual cell growth, and the fluorescence images show development of structure within each of two major nucleoid lobes. Line scans of fluorescence intensity projected onto the long axis of the same cell are shown in Fig. 2B. The apparent segregation between nucleoid lobes and sublobes in axial line scans is slightly deeper for HU labeling than for SYTOX orange (compare Fig. 2B with Fig. S3C in the supplemental material), perhaps due to some binding of the dye to mRNA or to ribosomes. The axial distributions in Fig. 2B are aligned to place the center of the cell (centroid of the binary mask calculated from the phase-contrast image) in the same position. At time zero, each major nucleoid lobe has already begun to segregate into two sublobes (seen most clearly in the line scans). Over the next 20 min, segregation of the sublobes gradually progresses. The detailed nucleoid spatial distribution is dynamic, seemingly similar to recent observations of HU-YFP dynamics (2). From the axial line scans, it appears that the inner two sublobes remain stationary as the outer two sublobes develop and segregate outward (as followed by the red dotted lines in Fig. 2B). The movement of these outer sublobes appears to be tracking cell elongation. This is similar to the conclusion drawn from our previous study in which we compared the positions of sublobes across a population of 286 different cells of various lengths to determine how nucleoid segregation progresses with cell elongation (Fig. 1C and D in reference 11).
In order to quantitatively describe the overall spatial extent of the nucleoids versus time, we define two parameters measured from the fluorescence intensity distributions projected along x (axial coordinate) and y (transverse coordinate). The axial distribution was characterized by the overall length (lDNA), measured as the “outside” full-width at half-maximum height (FWHM) of the intensity distribution along x (Fig. 2C). The width (wDNA), a rough measure of the mean nucleoid diameter, is measured as the FWHM of the projection along y (Fig. 2C). While lDNA estimates the overall spatial extent of both nucleoid lobes combined, note that the central dip in the axial distribution is deeper than the dip within a pair of sublobes. The true degree of segregation within the DNA axial distribution is much better defined in superresolution images of species that bind DNA, such as RNA polymerase or HU (8, 16). However, superresolution imaging of live-cell nucleoids has much slower time resolution than wide-field fluorescence imaging.
The two parameters lDNA and wDNA quantify the approximate size and aspect ratio of the nucleoids in each cell. Next we compared the time evolutions, lDNA(t) and wDNA(t), for three individual growing cells with the distribution of lDNA and wDNA across single snapshots of the nucleoids from a large number of cells of various length. Figure 2D and E show scatter plots of lDNA and of wDNA versus Lcell taken from one snapshot each of 142 cells stained with SYTOX orange. The nucleoid length increases monotonically with cell length, while the nucleoid width is almost independent of cell length. We superimposed 20-min time courses of nucleoid length and width for three individual cells chosen to have short, medium, and long initial Lcell. The single-cell time courses follow the general trend of the single-snapshot distribution across many individual cells. This demonstrates that the light exposure cycles over 20 min do not alter nucleoid morphology and suggests that SYTOX orange provides a good representation of the native nucleoid spatial distribution during normal cell growth.
To examine whether laser illumination, staining of nucleoids with SYTOX orange, or both staining and laser illumination affects cell growth, we designed two types of control experiments. The first control follows the growth of cells stained with SYTOX orange in the presence or absence of 561-nm laser illumination. The second control plates a mixture of cells stained with SYTOX orange plus unstained cells and subjects both to the same growth medium and laser illumination. In both cases, alternate phase-contrast images and fluorescence images are taken at 6-s intervals (Fig. 3A). For each cell in the field of view, we monitor cell length, Lcell (Fig. 3B), versus time as a signature of cell growth. To compare the growth rates of cells having different initial lengths, we scale each Lcell(t) measurement to Lcell at time zero to obtain the relative cell length versus time (see Fig. S4 in the supplemental material). While the absolute value of cell length from MicrobeTracker depends somewhat on the choice of input parameters, relative changes in cell length are reliable (supporting information in reference 15). Without any staining or laser illumination, relative cell length increases in exponential fashion, with a mean doubling time of 47.5 min (Fig. 3C).
In the first control experiment, we plated cells prestained with SYTOX orange and used a mask to illuminate only half of the field of view of the microscope with the 561-nm laser (Fig. 3D). The laser is turned on 10 min after the beginning of the movie. At the right of Fig. 3D, we plot the relative cell length versus time for the cells receiving no laser illumination (gray line) and for those receiving illumination beginning at 10 min (red line). The mean of the growth curves for each set of cells is plotted as a thick solid line. Compared with the unstained cells imaged only by phase contrast (Fig. 3C), neither SYTOX orange staining alone nor SYTOX orange staining with laser illumination significantly affected growth rate. Evidently laser illumination of SYTOX orange bound to DNA does not perturb E. coli growth under our imaging conditions. See Movie S1 in the supplemental material. The stain DRAQ5 behaves very differently, as shown below.
In a variation on this theme, we plated a mixture of cells prestained with SYTOX orange and cells receiving no stain and subjected the entire field of view to the same laser illumination and phase-contrast imaging over 20 min (Fig. 3E). This directly compares growth of stained cells with unstained cells, with both receiving the same laser and white light (phase contrast) illumination (Fig. 3E). Staining with SYTOX orange has no perturbative effect on the cell growth; see also Movie S2 in the supplemental material.
Tests of DRAQ5 for imaging DNA in live E. coli.
The quality of staining of E. coli by DRAQ5 is inconsistent from cell to cell, with cells in a single field of view differing in fluorescence intensity by a factor of 2. The first pulse of light can be used to faithfully measure the distribution of DNA in single cells (11) or in fixed cells (14). However, shortly after a cell stained by DRAQ5 is exposed to laser illumination, cell growth halts and the structure of the nucleoid is badly perturbed.
As before, alternating fluorescence and phase-contrast images were acquired at 3 s/frame. In Fig. 4A we show sequential snapshots of DRAQ5-stained cells over the first 10 min of exposure to 633-nm laser light. Three of the corresponding axial line scans and the nucleoid size parameters lDNA(t) and wDNA(t) are shown for the same cell in Fig. 4B and C. Figure 4D shows Lcell(t) and total DRAQ5 fluorescence intensity versus time for the same cell. The DRAQ5 stained nucleoids expand both radially and axially within 3 to 4 min of the onset of laser exposure. This time scale is dependent on the total illumination time. Continuous imaging of DRAQ5 resulted in similar changes within 20 s of illumination. At the same time, Lcell shrinks and the total fluorescence intensity grows abruptly (see Movie S3 in the supplemental material).
FIG 4.

(A) Phase-contrast and fluorescence images of a DRAQ5-stained cell over 10 min. Signals in each frame are background subtracted and then normalized so that the maximum pixel intensity is 1 and minimum is 0. (B) Axial intensity profiles of the DRAQ5 fluorescence. (C) Time course of lDNA and wDNA of the cell shown in panel A, plotted as red circles. The laser is turned on at 5 min. Solid lines are spline interpolation to guide the eye. For comparison, we also show a plot of lDNA and wDNA versus time for a SYTOX orange-stained cell (black open circles). (D) Time course of Lcell (black circles) and total DRAQ5 intensity for the same single cell as in panel A. The blue dashed line marks the onset of 633-nm illumination. (E) Relative changes in cell length over time are plotted for DRAQ5-labeled cells that are illuminated by the laser (red line) and that are not illuminated by the laser (gray lines). Heavy red and gray lines are means. The heavy black line is mean curve for untreated cells.
After 4 min, the nucleoid appears to shrink back to its original spatial extent, but the troughs between nucleoid lobes remain filled in (compare Fig. 2B). Lcell gradually shrinks as well. This is reminiscent of the effects of antimicrobial peptides such as LL-37 and cecropin A on live E. coli (15, 18).
We suspect that the combination of DRAQ5 and 633-nm illumination permeabilizes the bacterial membranes at ∼3 min. Loss of turgor pressure causes the abrupt cell shrinkage, and exposure of the cytoplasm to bulk DRAQ5 explains the sharp rise in total fluorescence intensity. Phase-contrast imaging of a number of cells over 15 min (Fig. 4E) shows that slowing of growth as judged by Lcell(t) begins shortly after laser illumination and that abrupt shrinkage of Lcell at ∼3 min is a general phenomenon. With DRAQ5 but without the laser, Lcell(t) increases almost normally. DRAQ5 staining combined with 633-nm illumination has a potent bacteriostatic effect. As already noted, attempts to rinse away bulk DRAQ5 prior to observation were not successful. Thus, it remains uncertain whether the damage is caused by dye molecules already within the cytoplasm or molecules that enter from the bulk surround or both. The more modest light exposure during phase-contrast imaging is evidently much less harmful (gray lines in Fig. 4E).
In normal cells, plasmolysis is the abrupt shrinkage of the cytoplasmic volume (and enhancement of the periplasmic volume) after a rapid increase in external osmolality. We found that cells labeled with DRAQ5 and imaged with 633-nm laser light prior to an osmotic upshift in NaCl did not undergo plasmolysis (data not shown). The cytoplasm remained similar in volume. We believe this to be due to permeabilization of the cytoplasmic membrane prior to the upshift, which enables the osmotic pressure to remain equal on both sides of the CM.
Tests of SYTOX green, DAPI, and SYTO 61 for imaging nucleoids in live E. coli.
We carried out less extensive studies of the nucleoid staining properties of SYTOX green, DAPI, and SYTO 61. SYTOX green is a “dead-cell stain” with absorption maximum at 504 nm and emission maximum at 523 nm. It behaved much like SYTOX orange and should prove quite useful in imaging the nucleoids of live E. coli when green emission is desirable.
DAPI is a permeable dye excited in the near UV at ∼350 nm and imaged at ∼450 nm. Images of DNA stained by DAPI typically lack proper contrast, partly due to strong background autofluorescence from the entire cytoplasm during UV illumination. We found that exposure of DAPI-stained cells to the UV lamp badly perturbs the nucleoid structure. In Fig. 5, we show SYTOX orange and DAPI images for two cells of similar length. During illumination over 12 min, the two DAPI-stained nucleoid lobes gradually expand and merge. This is shown more quantitatively in the axial line scans of Fig. S5A in the supplemental material. See Movie S4 in the supplemental material as well. More prolonged UV illumination of DAPI-stained cells caused permeabilization of the membranes, similar to the behavior of DRAQ5. Overall, the effects of DAPI plus UV illumination are qualitatively similar to the effects of DRAQ5 plus red illumination. The adverse effects of DAPI/UV arose more slowly under our imaging conditions.
FIG 5.
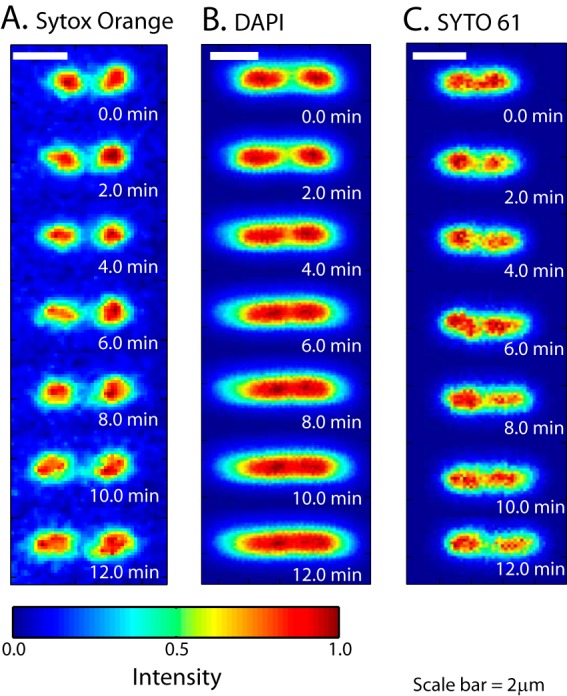
Comparison of time-lapse images of nucleoid morphology for three different stains: SYTOX orange (A), DAPI (B), and SYTO 61 (C). The three cells have similar lengths. In the relative intensity scale, 0 is the background level and 1 denotes the brightest pixel in each image.
SYTO 61 is a red DNA stain with absorption maximum at 628 nm and emission maximum at 645 nm. After incubation with 200 nM SYTO 61 for 10 min, we observed quite uniform staining of the E. coli nucleoids from cell to cell and from day to day. Cell growth inferred from Lcell(t) was not significantly perturbed by imaging of SYTO 61, and normal DNA segregation was observed with time-lapse imaging (Fig. 5C). However, compared with SYTOX orange images of the nucleoids, the SYTO 61 images look featureless and lack detail. Axial line scans for comparison with Fig. 2B are provided in Fig. S5B in the supplemental material. Perhaps imaging with SYTO 61 expands the nucleoids locally and smooths the apparent spatial distribution. Alternatively, SYTO 61 may bind to mRNA and ribosomes to a greater extent than SYTOX orange, which would also expand the images.
Tests of SYTOX orange for imaging of the nucleoids of B. subtilis.
Incubation in only 100 nM SYTOX orange for 15 min produced bright images of the nucleoids of B. subtilis. Evidently the single membrane of the Gram-positive B. subtilis is much more permeable to the dye than the double membrane of the Gram-negative E. coli. A series of snapshots of a representative B. subtilis cell imaged in phase contrast and in SYTOX orange fluorescence is shown in Fig. 6A. Corresponding axial intensity profiles are provided in Fig. S6 in the supplemental material. The DNA lobes elongate and segregate as the cell length increases. The level of detail revealed by wide-field imaging of the nucleoids of B. subtilis and E. coli appear comparable (compare Fig. S6 in the supplemental material with Fig. 2B). Growth control experiments were carried out for B. subtilis to test for possible effects of staining and laser illumination on the growth rate (Fig. 5B; see also Movie S5 in the supplemental material). Cells labeled with SYTOX orange and illuminated with 561-nm laser light grow similarly to unlabeled cells that are not illuminated.
FIG 6.
(A) Time-lapse imaging of B. subtilis using phase-contrast and SYTOX orange fluorescence. Fluorescence images at each time point are background subtracted and then normalized so that the maximum pixel intensity is 1 and minimum is 0 to correct for photobleaching. (B) Relative changes in cell length versus time are plotted for illuminated SYTOX orange-labeled cells (red line; 6 cells) and for unlabeled cells without illumination (gray lines; 5 cells). Mean trends are shown as thick lines.
Effects of the antimicrobial peptides cecropin A and LL-37 on E. coli nucleoid and ribosome distributions.
In unperturbed cells growing normally in EZRDM at 30°C, imaging of RNA polymerase and 30S ribosomal subunits by superresolution fluorescence microscopy reveals that the chromosomal DNA and the ribosomes exhibit strong spatial segregation (11). Due to segregation of nascent chromosomes, cells of medium length exhibit two distinct nucleoid lobes. The ribosomes preferentially occupy three “ribosome-rich regions” where the DNA density is low: two at the end caps and one at the cell center. Examples are shown in Fig. 7. Longer cells (like that of Fig. 2B) exhibit two sublobes within each nucleoid lobe. A simple model of excluded volume and polymer entropy helps explain this segregation (20).
FIG 7.

Phase-contrast and two-color fluorescence images of a representative E. coli cell before and after treatment with antimicrobial peptides. DNA is stained with SYTOX orange, and 30S ribosomal subunits are labeled with an S2-YFP construct. (A and B) At time zero, cecropin A is injected at 2 μM, four times the MIC. Nucleoid expansion and DNA-ribosome mixing occur over tens of minutes after cell shrinkage, as shown by false-color images (left) and axial intensity line scans (right). (C and D) At time zero, LL-37 is injected at 8 μM, eight times the MIC. DNA-ribosome segregation is maintained over the following 35 min. See the text for further details.
As an initial application of SYTOX orange staining of the nucleoids, we used two-color, time-lapse imaging to study the effects of two natural antimicrobial peptides (AMPs), Cecropin A and LL-37, on the E. coli DNA and ribosome spatial distributions within the cytoplasm. Cecropin A and LL-37 are similar in length (37 amino acids) and charge (+7) and exist as amphipathic α-helices on binding to model lipid bilayers (21, 22). We previously reported the sequence of events involved in the membrane permeabilization and growth inhibition caused by these peptides (19). In earlier work (18), we carried out time-lapse imaging on single E. coli cells that transport green fluorescent protein (GFP) to the periplasm via the twin-arginine transport system (23). Both peptides first permeabilize the outer membrane (OM) of E. coli to periplasmic GFP and subsequently permeabilize the cytoplasmic membrane (CM) to SYTOX green (18, 19). Cell growth halts and cells shrink at the same time as the OM permeabilization event. Although membrane permeabilization is a major step in the mechanism of action of these AMPs, the postpermeabilization effects on the DNA, ribosomes, and other cytosolic components have not been studied.
In each cell, SYTOX orange stained the nucleoids and S2-YFP expressed from the chromosome labeled all copies of the 30S ribosomal subunit. The long maturation time of YFP ensures that all S2-YFP copies are incorporated into 30S subunits (11). The 30S subunits may occur as free 30S or as complete 70S ribosomes, most often members of a “polysome,” a chain of 70S ribosomes translating the same message. The two-color fluorescence plus phase-contrast imaging scheme provided interleaved images of DNA, ribosomes, and cell dimensions over some 40 min with a 9-s cycle time.
The time-lapse series in Fig. 7A and B shows images of a single representative cell following injection at time zero of 400 μl of 2 μM cecropin A into the observation chamber (four times the MIC). At time −4.5 min (before injection of cecropin A), the images and line scan show normal DNA-ribosome segregation. At ∼4 min after injection, growth halts and the cell length (Lcell) shrinks abruptly by ∼10%. This is shown quantitatively in the Lcell(t) curve in Fig. S7 in the supplemental material. Shortly after the shrinkage event, the nucleoid lobes and ribosome-rich regions begin to merge, as seen most clearly in the false-color images at 13.5 and 31.5 min. Eventually, the DNA and ribosomes mix almost completely; see the images and line scans at 38.5 min. Similar behavior was observed for all 22 cells in the field of view.
Treatment of cells with 8 μM LL-37 (eight times the MIC) causes cells to shrink at 2.0 min after injection (Fig. 7C and D; see also Fig. S7 in the supplemental material). In contrast to cecropin A, LL-37 treatment does not subsequently affect the spatial segregation of the nucleoid lobes and ribosome-rich regions, even 35 min after cells have stopped growing. Axial line scans (Fig. 7D) of the fluorescence images at 13.5 min and 38.5 min continue to exhibit well-separated peaks corresponding to the DNA-rich and ribosome-rich regions. Normal segregation persists.
DISCUSSION
Our search for an ideal nucleoid stain for imaging of single, live bacterial cells was motivated by an interest in the time-dependent effects of drugs and other antimicrobial agents on overall nucleoid morphology. An ideal stain would permeate the membranes of both Gram-negative and Gram-positive species and provide bright, long-lasting fluorescence on binding to DNA without perturbing cell growth or nucleoid morphology. Ironically, the “dead-cell stains” SYTOX orange and SYTOX green appear nearly ideal in all regards. The dye within the cytoplasm remains bound to DNA even after double rinsing of residual dye from the bulk. Binding to DNA enhances the fluorescence quantum yield some 500-fold. Cell growth and DNA replication and segregation appear normal. The contrast and level of detail in wide-field images appear comparable to those in a recent study using the labeled DNA-binding protein HU-mCherry to image E. coli nucleoids (2) and to our own images of HU-YFP in Fig. S3 in the supplemental material.
The fluorescence quantum yield of SYTOX dye is enhanced a factor of 450 on binding to double-stranded DNA (10). However, a significant enhancement occurs on binding to RNA as well. Because of this, HU-YFP images show stronger apparent segregation between nucleoid lobes. We suspect that the SYTOX orange signal has contributions from binding to mRNA and ribosomes within the bacterial cytoplasm. However, HU-based imaging strategies have some limitations in time-resolved studies. In the transition from exponential growth to early stationary phase, bacteria such as E. coli replace much of the “histone-like” protein HU with the structural homologs IHF (integration host factor) and Dps (20). As a consequence, HU labeling strategies are probably not suitable for studies of the dependence of nucleoid organization on growth phase. In addition, some perturbations such as drug treatment may affect the interaction between DNA and HU. DNA-specific fluorescent dyes like SYTOX orange should allow nonperturbative study of the nucleoid morphology in a living cell under a wide variety of conditions. The orange and green emission wavelengths of SYTOX orange and green provide flexibility for two-color imaging schemes beyond the SYTOX orange-YFP combination demonstrated here.
Single-cell imaging using laser excitation and an EMCCD camera is extremely sensitive compared with typical flow cytometry. This enables us to readily observe the modest staining levels achieved by the dead-cell stains over long periods without perturbing growth and nucleoid morphology. We see no reason why the SYTOX dyes could not be used in a conventional fluorescence microscope using lamp illumination. However, the sensitive EMCCD camera enables low illumination levels and is thus essential to minimize photobleaching during a long series of snapshots.
The traditional UV stain DAPI and the red, live-cell stain DRAQ5 seem unsuitable for time-lapse imaging of nucleoids in live E. coli. They share several flaws. Both cause expansion of the nucleoids and blurring of detail, and both eventually permeabilize the E. coli cytoplasmic membrane in long movies. DAPI requires near-UV excitation, which is known to be toxic. DRAQ5 may be useful for DNA imaging in fixed cells. After formaldehyde fixation of E. coli, we observed no nucleoid expansion over repeated cycles of imaging of DRAQ5 with 633-nm illumination. In addition, the better behavior of dead-cell stains such as SYTOX orange and SYTOX green in live-cell imaging may be due to the relatively small concentration of dye bound to DNA compared with the more permeable live-cell stains such as SYTO 61 and DRAQ5. DRAQ5, an intercalator, has a very low fluorescence quantum yield (0.003), whether bound to DNA or not. The singlet excited state is a diradical, and close proximity to DNA bases may enable undesirable photochemistry. In contrast, our single-molecule tracking studies of SYTOX orange show that it binds transiently to DNA (data not shown). Relatively weak binding coupled with the large (450-fold) fluorescence enhancement on binding may help prevent photodamage.
Our initial application demonstrated that the antimicrobial peptide cecropin A gradually causes mixing of DNA and ribosomes over tens of minutes after the abrupt cell shrinkage event and the halting of growth. In sharp contrast, LL-37 causes no such mixing. The underlying cause of these intriguingly different behaviors deserves further investigation. On similar timescales, certain antibacterial drugs are also known to alter nucleoid morphology, either expanding the nucleoid (e.g., rifampin) or contracting it (e.g., chloramphenicol) (3, 5). The underlying mechanisms are again not well understood. It is possible that certain drugs and AMPs may displace nucleoid-associated proteins whose binding to DNA contributes to DNA compactness in normal conditions. We also wonder if 30S and 50S monomeric ribosomal subunits may mix freely with the nucleoids, while 70S polysomes cannot mix due to excluded volume/entropy effects (20). That idea is consistent with the contrasting effects of chloramphenicol (which freezes ribosomes on the mRNA) and rifampin (which prevents transcription initiation, eventually causing 70S to dissociate). In the future, single-molecule studies of the diffusive properties of ribosomes and DNA binding proteins before and after treatment with drugs and AMPs will shed additional light on these phenomena.
Supplementary Material
ACKNOWLEDGMENTS
This work was supported by the National Institutes of Health (NIGMS; grants R01-GM094510 to J.C.W. and R01-GM093265 to J.C.W. and S. Gellman) and the National Science Foundation (grant CHE-1213860 to S. Cavagnero and J.C.W.).
The content is solely the responsibility of the authors and does not necessarily represent the official views of the National Institutes of Health.
We thank Tamas Gaal and Rick Gourse for use of their UV fluorescence microscope for DAPI imaging.
Footnotes
Published ahead of print 6 June 2014
Supplemental material for this article may be found at http://dx.doi.org/10.1128/AEM.00989-14.
REFERENCES
- 1.Thanbichler M, Shapiro L. 2006. Chromosome organization and segregation in bacteria. J. Struct. Biol. 156:292–303. 10.1016/j.jsb.2006.05.007 [DOI] [PubMed] [Google Scholar]
- 2.Fisher JK, Bourniquel A, Witz G, Weiner B, Prentiss M, Kleckner N. 2013. Four-dimensional imaging of E. coli nucleoid organization and dynamics in living cells. Cell 153:882–895. 10.1016/j.cell.2013.04.006 [DOI] [PMC free article] [PubMed] [Google Scholar]
- 3.Cabrera JE, Cagliero C, Quan S, Squires CL, Jin DJ. 2009. Active transcription of rRNA operons condenses the nucleoid in Escherichia coli: examining the effect of transcription on nucleoid structure in the absence of transertion. J. Bacteriol. 191:4180–4185. 10.1128/JB.01707-08 [DOI] [PMC free article] [PubMed] [Google Scholar]
- 4.Frenkiel-Krispin D, Ben-Avraham I, Englander J, Shimoni E, Wolf SG, Minsky A. 2004. Nucleoid restructuring in stationary-state bacteria. Mol. Microbiol. 51:395–405. 10.1046/j.1365-2958.2003.03855.x [DOI] [PubMed] [Google Scholar]
- 5.van Helvoort JMLM, Woldringh CL. 1994. Nucleoid partitioning in Escherichia coli during steady-state growth and upon recovery from chloramphenicol treatment. Mol. Microbiol. 13:577–583. 10.1111/j.1365-2958.1994.tb00452.x [DOI] [PubMed] [Google Scholar]
- 6.Robinow C, Kellenberger E. 1994. The bacterial nucleoid revisited. Microbiol. Rev. 58:211–232 [DOI] [PMC free article] [PubMed] [Google Scholar]
- 7.Kellenberger E, Johansen R, Maeder M, Bohrmann B, Stauffer E, Villiger W. 1992. Artefacts and morphological changes during chemical fixation. J. Microsc. 168:181–201. 10.1111/j.1365-2818.1992.tb03260.x [DOI] [PubMed] [Google Scholar]
- 8.Wang WQ, Li GW, Chen CY, Xie XS, Zhuang XW. 2011. Chromosome organization by a nucleoid-associated protein in live bacteria. Science 333:1445–1449. 10.1126/science.1204697 [DOI] [PMC free article] [PubMed] [Google Scholar]
- 9.Pelletier J, Halvorsen K, Ha B-Y, Paparcone R, Sandler SJ, Woldringh CL, Wong WP, Jun S. 2012. Physical manipulation of the Escherichia coli chromosome reveals its soft nature. Proc. Natl. Acad. Sci. U. S. A. 109:E2649–E2656. 10.1073/pnas.1208689109 [DOI] [PMC free article] [PubMed] [Google Scholar]
- 10.Roth BL, Poot M, Yue ST, Millard PJ. 1997. Bacterial viability and antibiotic susceptibility testing with SYTOX green nucleic acid stain. Appl. Environ. Microbiol. 63:2421–2431 [DOI] [PMC free article] [PubMed] [Google Scholar]
- 11.Bakshi S, Siryaporn A, Goulian M, Weisshaar JC. 2012. Superresolution imaging of ribosomes and RNA polymerase in live Escherichia coli cells. Mol. Microbiol. 85:21–38. 10.1111/j.1365-2958.2012.08081.x [DOI] [PMC free article] [PubMed] [Google Scholar]
- 12.Schneider DA, Gourse RL. 2004. Relationship between growth rate and ATP concentration in Escherichia coli—a bioassay for available cellular ATP. J. Biol. Chem. 279:8262–8268. 10.1074/jbc.M311996200 [DOI] [PubMed] [Google Scholar]
- 13.Neidhardt FC, Bloch PL, Smith DF. 1974. Culture medium for enterobacteria. J. Bacteriol. 119:736–747 [DOI] [PMC free article] [PubMed] [Google Scholar]
- 14.Silva F, Lourenco O, Pina-Vaz C, Rodrigues AG, Queiroz JA, Domingues FC. 2010. The use of DRAQ5 to monitor intracellular DNA in Escherichia coli by flow cytometry. J. Fluorescence 20:907–914. 10.1007/s10895-010-0636-y [DOI] [PubMed] [Google Scholar]
- 15.Barns KJ, Weisshaar JC. 2013. Real-time attack of LL-37 on single Bacillus subtilis cells. Biochim. Biophys. Acta 1828:1511–1520. 10.1016/j.bbamem.2013.02.011 [DOI] [PMC free article] [PubMed] [Google Scholar]
- 16.Bakshi S, Dalrymple RM, Li W, Choi H, Weisshaar JC. 2013. Partitioning of RNA polymerase activity in live Escherichia coli from analysis of single-molecule diffusive trajectories. Biophys. J. 105:2676–2686. 10.1016/j.bpj.2013.10.024 [DOI] [PMC free article] [PubMed] [Google Scholar]
- 17.Sliusarenko O, Heinritz J, Emonet T, Jacobs-Wagner C. 2011. High-throughput, subpixel precision analysis of bacterial morphogenesis and intracellular spatio-temporal dynamics. Mol. Microbiol. 80:612–627. 10.1111/j.1365-2958.2011.07579.x [DOI] [PMC free article] [PubMed] [Google Scholar]
- 18.Sochacki KA, Barns KJ, Bucki R, Weisshaar JC. 2011. Real-time attack on single Escherichia coli cells by the human antimicrobial peptide LL-37. Proc. Natl. Acad. Sci. U. S. A. 108:E77–E81. 10.1073/pnas.1101130108 [DOI] [PMC free article] [PubMed] [Google Scholar]
- 19.Rangarajan N, Bakshi S, Weisshaar JC. 2013. Localized permeabilization of E. coli membranes by the antimicrobial peptide cecropin A. Biochemistry 52:6584–6594. 10.1021/bi400785j [DOI] [PMC free article] [PubMed] [Google Scholar]
- 20.Mondal J, Bratton BP, Li Y, Yethiraj A, Weisshaar JC. 2011. Entropy-based mechanism of ribosome-nucleoid segregation in E. coli cells. Biophys. J. 100:2605–2613. 10.1016/j.bpj.2011.04.030 [DOI] [PMC free article] [PubMed] [Google Scholar]
- 21.Oren Z, Lerman JC, Gudmundsson GH, Agerberth B, Shai Y. 1999. Structure and organization of the human antimicrobial peptide LL-37 in phospholipid membranes: relevance to the molecular basis for its non-cell-selective activity. Biochem. J. 341:501–513. 10.1042/0264-6021:3410501 [DOI] [PMC free article] [PubMed] [Google Scholar]
- 22.Silvestro L, Axelsen PH. 2000. Membrane-induced folding of cecropin A. Biophys. J. 79:1465–1477. 10.1016/S0006-3495(00)76398-3 [DOI] [PMC free article] [PubMed] [Google Scholar]
- 23.Sochacki KA, Shkel IA, Record MT, Weisshaar JC. 2011. Protein diffusion in the periplasm of E. coli under osmotic stress. Biophys. J. 100:22–31. 10.1016/j.bpj.2010.11.044 [DOI] [PMC free article] [PubMed] [Google Scholar]
Associated Data
This section collects any data citations, data availability statements, or supplementary materials included in this article.