

Abstract
Refractive errors, myopia and hyperopia, are the most common causes of visual impairment worldwide. Recent advances in genetics have been utilized to identify a wealth of genetic loci believed to contain susceptibility genes for refractive error. The current genetic evidence confirms that refractive error is influenced by both common and rare variants with a significant environmental component. These studies argue that only by combining genetic knowledge with in vivo measurements of biological states will it be possible to understand the underlying biology of refractive error that will lead to novel therapeutic targets and accurate genetic predictions.
Keywords: Refractive Error, Myopia, Hyperopia, Genetic Variation, Animal Models, Gene-Environment Interaction
Introduction
Refractive error (RE) is a complex, multifactorial disorder characterized by a mismatch between the optical power of the eye and the axial length that causes the object image to be focused off the retina. The two major subtypes of RE are myopia (nearsightedness) and hyperopia (farsightedness). In uncorrected myopia the image is focused in front of the retina while in uncorrected hyperopia the image is focused behind the retina. The distance the image is focused from the retina determines the degree of myopia and hyperopia. Correction of both refractive errors is accomplished by lenses, concave or negative powered lenses for myopia and convex or positively powered lenses for hyperopia. The amount of correction is defined by the unit, diopters (D). Genetic studies have analyzed RE as a binary variable (i.e. present or absent) or as a continuous variable (i.e. spherical equivalent or axial length).
Susceptibility to Refractive Error
Refractive errors are the most common human eye disorders. [1] Myopia affects about 25% of individuals over age 40 in the United States and western Europe and hyperopia affects about 10% of individuals in this same age group. [2] The prevalence does vary between ethnic groups. For example the adult (over age 40) prevalence for myopia is 38.7 % in Singaporean Chinese [3] but 28% in Indian adults. [4]
The search for environmental factors influencing RE have mostly focused on myopia. In particular education, near work and outdoor activity have been reported with mixed results to be associated with myopia. Most convincing are the multiple reports linking higher education with higher prevalence of myopia. [5–8] The amount of near work activity, a function of education, is reported to be positively correlated with myopia while the amount of outdoor activity is negatively correlated with myopia. Multiple reports have identified a positive correlation between myopic parents and their children developing myopia implicating genetics and shared family environmental exposure as important determinants. (See additional references in Supplementary Material 1)
Complications of the Refractive Error Phenotype
Myopia is commonly divided into physiological and high myopia.[9] The cut-off between the two is conventionally set at a spherical refractive equivalent of -6 Diopters. Unfortunately, this classification implies that physiological myopes have no additional risks over emmetropes which is incorrect. Maculopathy is the most devastating complication of myopia because it leads to vision loss from atrophy of the retinal pigment epithelium and/or sub-retinal neovascularization that is untreatable.[10] The Blue Mountains Eye Study reported a maculopathy prevalence of 0.42% in myopes of less than 5 D and 25% for myopes greater than 5 D. [11] Despite the far higher prevalence of maculopathy in high myopes the high proportion of low myopes in the Blue Mountain population resulted in the mild myope group contributing 43% of the total cases of maculopathy. Thus, physiological myopes contribute almost as many cases as the pathological myopes despite the lower odds ratio.
Non-traumatic retinal detachment is another complication of myopia secondary to thinning of the peripheral retina secondary to axial length elongation. Again, no degree of myopia is safe because the OR for retinal detachment is 4.4 for low myopia and 9.9 for high myopia. [12,13] Similar trends have been reported for glaucoma secondary to myopia with an OR of 1.65 for low myopia and 2.5 for high myopia. [14] Similar risk between myopia and posterior subcapsular cataract has been reported. [12]
Contrary to myopia, hyperopia has not been reported to have as many secondary sight threatening complications with the possible exception of a weak correlation with angle closure glaucoma. [12]
Animal models
Animal studies for RE have laid the foundation for our understanding of visual experience on eye growth. Such studies have their onset in 1977 with the report by Wiesel and Raviola [15] that eyelid fusion in macaque monkeys produces excessive axial length elongation or myopia. This result was replicated in chicks and in a wide variety of animal species including tree shrews, guinea pigs and adult monkeys. These landmark studies stimulated decades of research on experimental myopia that also included optical lens induced models of eye growth in addition to lid fusion. Critical experiments in chicks with severed optic nerves provided evidence that optically dependent growth mechanisms acted independently of the central nervous system; although this independence of the eye from the central nervous system is not conserved across all species. One species of primates demonstrates some dependence between the eye and CNS suggesting an additional hierarchical influence. Additional studies using pharmacologic agents defined the layers of the eye responsible for regulating eye growth. For example, large increases in the retinal neurotransmitter, vasoactive intestinal peptide, were reported in experimental animal models of myopia. Alteration of dopamine levels, another retinal neurotransmitter, and ZENK, a retina transcription factor, in myopia animal models identified the retina as the major control of eye growth. Intraocular injections of neurotoxins that block action potentials in the retina, particularly of the ganglion cells, showed that ganglion cells within the retina were not involved in regulating eye growth in deprivation myopia. Experiments were also done to assess the influence of the choroid on eye growth. Measurement of chick choroidal thickness during form deprivation and lens defocus was shown to vary before changes in axial length. This change in choroidal thickness has been replicated in primates. Importantly, similar choroidal changes in thickness have been reported in humans within 60 minutes of imposed lens defocus. (See additional references in Supplementary Material 2)
The central hypothesis for the experimental animal models is that the environmental change produced by extraocular lens or lid fusion interacts with genes important in regulating eye growth. [12] Controversy over the relevance to human myopia of the genes expressed in these animal models has existed for sometime. One concern about their relevance is inferred from the lack of portability of gene-environment interactions from other animal models to humans. Such animal models for gene-environment interactions exist and have been studied systematically [16–18] and suggest that an interaction detected in one species is often dissimilar in a second species. [19] Therefore, while gene function is highly conserved across long evolutionary timescales, non-additive genetic interactions such as gene and environment are poorly conserved because they are a direct consequence of networks that are not conserved between species. Therefore, the current rodent, chick and primate gene-environment models for myopia will probably show little gene overlap with the human genes interacting under similar environmental influences. In addition to specific interactions with particular genes, it is important to note that the environment can also influence the outcome of gene mutations. For example, the environment can influence the effects of mutated proteins by altering the availability or activity of molecular chaperones, which are proteins that influence the folding or activity of other proteins in the cell. [20] Many mutated proteins are modified by molecular chaperone activity, either because chaperones directly stabilize mutated proteins or because the outcome of a mutation is influenced by the activity of a second, chaperone-dependent pathway or process. [21] The chaperone activity — and therefore the mutation-buffering capacity — of a cell or organism can increase or decrease in response to environmental stimuli. For example, an environmental stress can titrate away molecular chaperones and can therefore ‘unbuffer’ (that is, enhance) the effects of otherwise phenotypically inconsequential mutations. [22,23] Conversely, another environmental stimulus that induces a protective stress response and induction of chaperones can increase the buffering capacity of detrimental mutations. [24] Thus, environmental modifications can have indirect influences on the outcome of mutations through biological pathways that are unlikely to be conserved across species.
Still, it is good science to set up a hypothesis and test for the possibility that the genes differentially expressed in myopia animal models are associated with human myopia. To test this hypothesis we collected the microarray data obtained from two myopia animal models. A bioninformatic pipeline was established to identify and locate the human orthologs of the genes differentially expressed in chick and non-human primate models. The analysis pipeline was as follows: 1) Significant differentially expressed genes identified in microarrays from animal studies were assessed for conservation in humans; 2) Location of orthologs in humans and their proximity to published GWAS results for RE [25] was determined using UCSC genome browser (http://genome.ucsc.edu); 3) Human orthologs located further than 1 Megabase from the GWAS RE locus were not considered as candidates for human RE. The assumption of the 1 Megabase distance is based on the fact that a SNP with potential enhancer function could affect the expression of a gene within a distance of 1 Megabase. Human ortholog IDs and positions were retrieved from Ensembl’s BioMart (http://www.ensembl.org/biomart/martview). Biological information about the final set of selected genes was obtained from the NCBI Gene Dataset. Retina data for the chick model was obtained from a lens defocusing experiment in chicks. [26] We identified 100 human orthologs from the reported differentially expressed 100 chick genes. Filtering of these genes resulted in only 2 human orthologs, TMEM200A and FAM189A2 being located within 1 Mb of a GWAS peak. (Table 1, SI) Both genes were evaluated for expression by RNASeq of the human retina and showed a 6.4 FPKM and 4.5 FPKM, respectively. We next assessed the retina primate genes resulting from a lid suture experiment published by Tkatchenko et al. [27] One hundred nine of the reported 118 differentially expressed genes had human orthologs and only two of these 109 genes fulfilled our pipeline criteria of location close to a GWAS peak. (Table 1, SI) Both genes, IDH3A and CNOT2, are expressed in the human retina at 41.4 FPKM and 20.3 respectively. The small number of identified human orthologues located in GWAS peaks coupled with the lack of exact gene matches suggests that the biological pathways involved in animal myopia models are different from those pathways operating in human myopia.
Table 1.
Human orthologues demonstrating proximity to GWAS peaks
| Gene | Source | RNASeq-Retina | RNASeq-RPE/Choroid/Sclera | Chr., SNP ID | Human Diseases |
|---|---|---|---|---|---|
| BMP2K | Yeast | + | + | 4,rs9307551 | NA |
| EXOC6 | Yeast | + | + | 10,rs10882165 | NA |
| GIGYF2 | Yeast | + | + | 2,rs1656404, rs1881492 | Parkinson Disease |
| IDE | Yeast | + | + | 10,rs10882165 | Alzheimer Disease |
| PAN2 | Yeast | + | + | 12,rs3138144 | NA |
| PIP5K1B | Yeast | + | + | 9,rs11145465 | Friedreich ataxia |
| PM20D1 | Yeast | + | + | 1,rs1652333 | Parkinson Disease |
| PRKACG | Yeast | − | − | 9,rs11145465 | NA |
| PRKG2 | Yeast | + | + | 4,rs1960445 | Dwarfism |
| RPS26 | Yeast | + | + | 12,rs3138144 | Diamond-Blackfan Anemia |
| SCO1 | Yeast | + | + | 17,rs2969180 | Cytochrome C Oxidase Deficiency |
| SLC38A6 | Yeast | + | + | 14,rs1254319 | NA |
| SMARCC2 | Yeast | + | + | 12,rs3138144 | NA |
| TMEM30B | Yeast | + | + | 14,rs1254319 | NA |
| TOX | Yeast | + | + | 8,rs7837791 | NA |
| ZADH2 | Yeast | + | + | 18,rs12971120 | NA |
| DIS3L2 | Yeast | + | + | 2,rs1656404 | Perlman Syndrome |
| IREB2 | Yeast | + | + | 15,rs4778879 | COPD |
| ZADH2 | Yeast | + | + | 18,rs12971120 | NA |
| DIS3L2 | Yeast | + | + | 2,rs1881492 | Perlman Syndrome |
| CNOT2 | Monkey | + | + | 12,rs12229663 | Dengue Virus |
| IDH3a | Monkey | + | + | 15,rs4778879 | NA |
| TMEM200A | Chicken | + | + | 6,rs12205363 | NA |
| FM189A2 | Chicken | + | + | 9,rs11145465 | NA |
Another potential source of candidate genes for RE could exist in the multitude of genes regulating growth. In particular, yeast have been extensively studied to identify growth genes. Published data on yeast overgrowth genes [28] were assessed for overlap with the peaks for the human RE GWAS.[25] Sopko et al. [28] reported 769 genes differentially expressed with yeast overgrowth. Human orthologs were found in our pipeline for 454 genes with 18 human orthologs fulfilling our criteria for location near GWAS peaks. (Table 1, SI) Retinal expression by RNASeq varied from 0.1 FPKM to 58.2 FPKM for these 18 genes. This result suggests that an alternative approach for finding genes influencing myopia might pass through a screen for overgrowth genes from multiple species.
Genetic Studies
RE associated with other phenotypes as part of syndromes will not be discussed in this review. Twin studies have reported a heritability greater than 0.50 for RE. Several studies have calculated the heritability for myopia to be as high as 0.98 and 0.75 for hyperopia and axial length to be as high as 0.95. Therefore, the underlying genetics of an individual is believed to have a major influential role on RE. (See additional references in Supplementary Material 3)
Linkage and Association Studies
Until recently, most of the linkage analysis was performed on DNA genotyped by microsatellites. The first published report of significant linkage was completed in 8 autosomal dominant families with high myopia. The location, MYP2, on 18p11.31 (Figure 1, SI) was subsequently refined to a smaller region.[29,30] Additional loci mapped by linkage include MYP5 on 17q21–22, MYP6 on 22q12, MYP7 on 11p13, MYP8 on 3q26, MYP9 on 4q12, MYP10 on 8p23, MYP11 on 4q22–q27, MYP12 on 2q37.1, MYP14 on 1p36, MYP15 on 10q21.1, MYP16 on 5p15.33–15.2, MYP17 on 7p15, and MYP19 on 5p15.1–p13.3 (Figure 1, SI). (See additional references in Supplementary Material 4)
Figure 1.
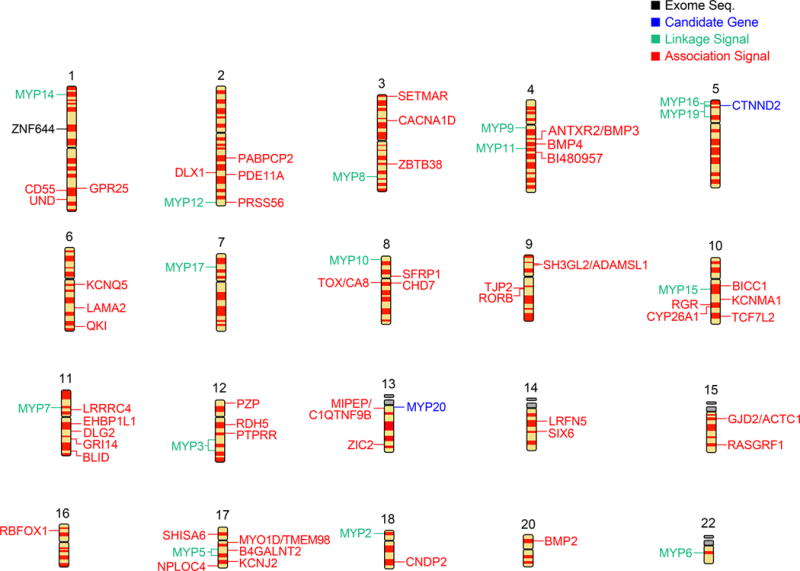
Early association studies were completed on candidate genes within families or case/controls. Many of these candidate studies were not replicated across multiple studies either because the sample sizes were too small or corrections for population stratification were not performed. A rather extensive review of the candidate gene association studies has been recently published. [31,32] Therefore, we will only reference the significant candidate gene studies. The MYP 3 locus at 12q21–23 has undergone a series of candidate gene studies. The first was the report of a significantly associated SNP in the 3’UTR of the insulin-like growth factor.[33] Two additional publications found significant association within 12q21–q23 of the lumican promoter and a 3′. UTR SNP in the same gene. [34] The CTNND2 (5p15.2) gene was reported to be significant for myopia in a case/control cohort of Chinese high myopes. [35] Finally, a large study of a Han Chinese case control cohort found evidence for association among 3 candidate genes at 13q12.12 (MYP 20). [36]
The first and only successful attempt at sequencing the exome in a myopic family was reported by Shi et al. [37] This study found a missense mutation in the ZNF644 gene that segregated with affected members in the family. A follow-up study of 131 myopes identified additional novel missense mutations in the ZNF644 gene supporting the hypothesis that this gene is involved in myopia. [38]
The new technology of the GWAS has stimulated multiple studies for both the quantitative and qualitative traits of RE. The first reported GWAS was from Nakanishi et al. [39] in a Japanese case/control cohort with high myopia. Although the result was not genome wide significant, it did identify a suggestive locus on 11q24.1 and stimulated the field to do additional GWASs. Two GWAS reports published simultaneously on two large European cohorts, Rotterdam Study and U.K. Twins, identified two independent loci on 15q14 and 15q25 for spherical equivalent.[40,41] Both studies were seminal in demonstrating the power of GWAS to identify quantitative RE loci influencing the field to collect much larger numbers of individuals to identify additional RE loci. Two GWAS reports followed for high myopia including Shi et al. [36] and Li et al. [42]. Shi et al. [36] completed a GWAS on a large case/control cohort of Han Chinese with high myopia. Initial analysis did not reveal a genome wide significant peak, although on replication and combining of specific SNP p-values a significant locus (p < 10−13) was located at 13q12.12. Li et al. [42] performed a meta-study on high myopia in the Han Chinese and reported a second locus (10−13) on 4q25. The modern era of the meta-GWAS was recently demonstrated in 3 publications. Stambolian et al. [43] performed a GWAS on the trait, spherical equivalent, in a combined discovery and replication set of 27,000 individuals and reported a single significant peak on 16p13.3 in the RBFOX1 gene. A much larger meta-analysis of 38,000 individuals spanning European and Asian ancestry, identified 24 new loci for spherical equivalent. [25] Importantly, a risk score analysis using the associated SNPs demonstrated a 10-fold higher risk for myopia in those individuals carrying the highest genetic load. A still larger study of 45,771 subjects using participants recall rather than clinical assessments to identify myopia found 22 genome-wide significant loci in the discovery cohort but only 11 loci were replicated in a set of 8,323 individuals.[44]
Finally, there is one reported significant GWAS for the phenotype, axial length, in Chinese and Malay subjects from Singapore that found a single genome wide significant peak at 1q41.[45]
Conclusions
Several decades of research on animals and humans has shown that the retina has a central role in regulating eye growth through processing of the image and sending signals to the sclera to influence its remodeling to compensate for the RE. The contributions of model organisms to our understanding of these fundamental processes are irrefutable and the complexity of the interactions has been confirmed by the recently successful genetic studies associating a multiplicity of genes with RE. But the underlying premise that the RE animal models can truly reiterate the human processes that lead to the eventual phenotype ignores the multiple stimuli operating in conjunction with a very large number of other causal fields that are not shared between model organisms and humans. The most commonly used model organism, the mouse, is separated from humans by about 75–100 million years of evolution [46,47] resulting in a large number of differences with respect to DNA sequence variants (DSVs). It merits reminding ourselves that intraindividual differences in the frequencies of DSVs (humans differ in about 0.1% of their genomes) is the essence of genetic studies of complex diseases in humans. Based on the genetic differences between model organisms and humans as well as the environmental differences, the etiological interactomes for RE would not be expected to be similar. Considering these limitations, it is not surprising but rather anticipated that the genetic findings in the model organisms for RE do not effectively translate to the underlying genetics of the human phenotype.
The genetic studies of RE have evolved in a similar fashion to many other complex phenotypes. Linkage and candidate studies were the early approaches but had modest success. The linkage studies found very few causal genes and although there were a few candidate studies that had success, many more were unsuccessful and underreported. These early studies were supplanted by the unbiased approach of the GWAS that is designed on the common disease-common variant hypothesis (CD-CV). While the earliest GWAS studies on RE were successful at finding 1 or 2 genes significantly associated, it was not until this year that much larger sample sizes were reported to discover multiple loci. The power of increased sample size is well known for GWAS [48–50] and relates inversely to the risk allele frequency and effect size. Both recently published large GWAS studies on RE reported small effect sizes which is expected for a complex phenotype. [25,44] This is all consistent with the CD-CV hypothesis that posits that a complex phenotype results from the cumulative effects of a large number of common variants, each exerting a modest effect. [51–53] Still, the GWAS approach has provided input into several biological pathways that are involved in RE and include extracellular matrix remodeling, visual cycle, neuronal development, eye and body growth, retinal cell development and neural signaling.
There are now 67 loci reported to be associated with RE using various technologies. (Figure 1, SI) Very few of these loci have genes that have been experimentally validated. Several approaches can now be used to experimentally validate these candidate genes and include: 1) identification of rare variants, 2) involvement in regulation of gene expression, 3) animal studies, and 4) interactions with environment. Alleles identified through GWAS are typically not the causative alleles but rather are in linkage disequilibrium with the true causative alleles. Identification of the causative alleles could be accomplished by searching for rare alleles and their subsequent validation in animal studies. A more direct approach using knockdown and overexpression of candidate genes will be more straightforward for validating genes. Rare variants in linkage disequilibrium with the common variants are expected to have larger effects that are easier validated in animal studies.[54,55] Finally, the mechanisms that govern the expression of the RE phenotype are embedded not only in the DSVs directly but also through their effects on various genomic components that participate in regulation of gene expression, such as histone modifications, microRNAs, long noncoding RNAs, epigenetics, splice variants, and posttranslational modifications of the encoded proteins in conjunction with the environmental factors. Such complex interactions will require identification to explain the underlying genetic architecture of RE.
Finally, a more sensitive indicator is needed for predicting ocular complications from RE. It is quite possible that underlying genotypes will be able to classify individuals into high and low risk and provide the clinician with the necessary information to determine frequency of follow-up. Additionally, there could be a particular biological network whose activity is determined by a particular genotype that predisposes to a sight threatening complication that is treatable by a drug. Still, even with a complete understanding of the genetics of RE, we may never be able to make accurate predictions about disease risk in individuals using genetics alone, as is well demonstrated by the high levels of discordance for most common diseases in identical twins. [56–58] Genetic studies of RE have provided a wealth of gene information that now require validation through functional studies.
Supplementary Material
Acknowledgments
The author wishes to acknowledge support from NIH EY020483.
Footnotes
The author has no potential conflicts.
References
- 1.Pizzarello L, Abiose A, Ffytche T, et al. VISION 2020: The Right to Sight: a global initiative to eliminate avoidable blindness. Arch Ophthalmol. 2004;122(4):615–620. doi: 10.1001/archopht.122.4.615. [DOI] [PubMed] [Google Scholar]
- 2.Kempen JH, Mitchell P, Lee KE, et al. The prevalence of refractive errors among adults in the United States, Western Europe, and Australia. Arch Ophthalmol. 2004;122(4):495–505. doi: 10.1001/archopht.122.4.495. [DOI] [PubMed] [Google Scholar]
- 3.Wong TY, Foster PJ, Hee J, et al. Prevalence and risk factors for refractive errors in adult Chinese in Singapore. Invest Ophthalmol Vis Sci. 2000;41(9):2486–2494. [PubMed] [Google Scholar]
- 4.Pan CW, Wong TY, Lavanya R, et al. Prevalence and risk factors for refractive errors in Indians: the Singapore Indian Eye Study (SINDI) Invest Ophthalmol Vis Sci. 2011;52(6):3166–3173. doi: 10.1167/iovs.10-6210. [DOI] [PubMed] [Google Scholar]
- 5.Katz J, Tielsch JM, Sommer A. Prevalence and risk factors for refractive errors in an adult inner city population. Invest Ophthalmol Vis Sci. 1997;38(2):334–340. [PubMed] [Google Scholar]
- 6.Wang Q, Klein BE, Klein R, et al. Refractive status in the Beaver Dam Eye Study. Invest Ophthalmol Vis Sci. 1994;35(13):4344–4347. [PubMed] [Google Scholar]
- 7.Wensor M, McCarty CA, Taylor HR. Prevalence and risk factors of myopia in Victoria, Australia. Arch Ophthalmol. 1999;117(5):658–663. doi: 10.1001/archopht.117.5.658. [DOI] [PubMed] [Google Scholar]
- 8.Tay MT, Au Eong KG, Ng CY, et al. Myopia and educational attainment in 421,116 young Singaporean males. Ann Acad Med Singapore. 1992;21(6):785–791. [PubMed] [Google Scholar]
- 9.Curtin BJ. The Myopias. 1985 [Google Scholar]
- 10.Hayashi K, Ohno-Matsui K, Shimada N, et al. Long-term pattern of progression of myopic maculopathy: a natural history study. Ophthalmology. 2010;117(8):1595–611. 1611.e1–4. doi: 10.1016/j.ophtha.2009.11.003. [DOI] [PubMed] [Google Scholar]
- 11.Vongphanit J, Mitchell P, Wang JJ. Prevalence and progression of myopic retinopathy in an older population. Ophthalmology. 2002;109(4):704–711. doi: 10.1016/s0161-6420(01)01024-7. [DOI] [PubMed] [Google Scholar]
- 12.Flitcroft DI. The complex interactions of retinal, optical and environmental factors in myopia aetiology. Prog Retin Eye Res. 2012;31(6):622–660. doi: 10.1016/j.preteyeres.2012.06.004. [DOI] [PubMed] [Google Scholar]
- 13.The Eye Disease Case-Control Study Group. Risk Factors for idiopathic rhegmatogenous retinal detachment. Am J Epidemiol. 1993;137:749–757. [PubMed] [Google Scholar]
- 14.Marcus MW, de Vries MM, Junoy Montolio FG, et al. Myopia as a risk factor for open-angle glaucoma: a systematic review and meta-analysis. Ophthalmology. 2011;118(10):1989–1994.e2. doi: 10.1016/j.ophtha.2011.03.012. [DOI] [PubMed] [Google Scholar]
- 15.Wiesel TN, Raviola E. Myopia and eye enlargement after neonatal lid fusion in monkeys. Nature. 1977;266(5597):66–68. doi: 10.1038/266066a0. [DOI] [PubMed] [Google Scholar]
- 16.Dudley AM, Janse DM, Tanay A, et al. A global view of pleiotropy and phenotypically derived gene function in yeast. Mol Syst Biol. 2005;1:2005.0001. doi: 10.1038/msb4100004. [DOI] [PMC free article] [PubMed] [Google Scholar]
- 17.Brown JA, Sherlock G, Myers CL, et al. Global analysis of gene function in yeast by quantitative phenotypic profiling. Mol Syst Biol. 2006;2:2006.0001. doi: 10.1038/msb4100043. [DOI] [PMC free article] [PubMed] [Google Scholar]
- 18.Hillenmeyer ME, Fung E, Wildenhain J, et al. The chemical genomic portrait of yeast: uncovering a phenotype for all genes. Science. 2008;320(5874):362–365. doi: 10.1126/science.1150021. [DOI] [PMC free article] [PubMed] [Google Scholar]
- 19.Tischler J, Lehner B, Fraser AG. Evolutionary plasticity of genetic interaction networks. Nat Genet. 2008;40(4):390–391. doi: 10.1038/ng.114. [DOI] [PubMed] [Google Scholar]
- 20.Lindquist S. Protein folding sculpting evolutionary change. Cold Spring Harb Symp Quant Biol. 2009;74:103–108. doi: 10.1101/sqb.2009.74.043. [DOI] [PubMed] [Google Scholar]
- 21.Zhao R, Davey M, Hsu YC, et al. Navigating the chaperone network: an integrative map of physical and genetic interactions mediated by the hsp90 chaperone. Cell. 2005;120(5):715–727. doi: 10.1016/j.cell.2004.12.024. [DOI] [PubMed] [Google Scholar]
- 22.Rutherford SL, Lindquist S. Hsp90 as a capacitor for morphological evolution. Nature. 1998;396(6709):336–342. doi: 10.1038/24550. [DOI] [PubMed] [Google Scholar]
- 23.Queitsch C, Sangster TA, Lindquist S. Hsp90 as a capacitor of phenotypic variation. Nature. 2002;417(6889):618–624. doi: 10.1038/nature749. [DOI] [PubMed] [Google Scholar]
- 24.Casanueva MO, Burga A, Lehner B. Fitness trade-offs and environmentally induced mutation buffering in isogenic C. elegans. Science. 2012;335(6064):82–85. doi: 10.1126/science.1213491. [DOI] [PubMed] [Google Scholar]
- 25.Verhoeven VJ, Hysi PG, Wojciechowski R, et al. Genome-wide meta-analyses of multiancestry cohorts identify multiple new susceptibility loci for refractive error and myopia. Nat Genet. 2013;45(3):314–318. doi: 10.1038/ng.2554. [DOI] [PMC free article] [PubMed] [Google Scholar]
- 26.Schippert R, Schaeffel F, Feldkaemper MP. Microarray analysis of retinal gene expression in chicks during imposed myopic defocus. Mol Vis. 2008;14:1589–1599. [PMC free article] [PubMed] [Google Scholar]
- 27.Tkatchenko AV, Walsh PA, Tkatchenko TV, et al. Form deprivation modulates retinal neurogenesis in primate experimental myopia. Proc Natl Acad Sci U S A. 2006;103(12):4681–4686. doi: 10.1073/pnas.0600589103. [DOI] [PMC free article] [PubMed] [Google Scholar]
- 28.Sopko R, Huang D, Preston N, et al. Mapping pathways and phenotypes by systematic gene overexpression. Mol Cell. 2006;21(3):319–330. doi: 10.1016/j.molcel.2005.12.011. [DOI] [PubMed] [Google Scholar]
- 29.Young TL, Ronan SM, Drahozal LA, et al. Evidence that a locus for familial high myopia maps to chromosome 18p. Am J Hum Genet. 1998;63(1):109–119. doi: 10.1086/301907. [DOI] [PMC free article] [PubMed] [Google Scholar]
- 30.Young TL, Atwood LD, Ronan SM, et al. Further refinement of the MYP2 locus for autosomal dominant high myopia by linkage disequilibrium analysis. Ophthalmic Genet. 2001;22(2):69–75. doi: 10.1076/opge.22.2.69.2233. [DOI] [PubMed] [Google Scholar]
- 31.Wojciechowski R. Nature and nurture: the complex genetics of myopia and refractive error. Clin Genet. 2011;79(4):301–320. doi: 10.1111/j.1399-0004.2010.01592.x. [DOI] [PMC free article] [PubMed] [Google Scholar]
- 32.Hawthorne FA, Young TL. Genetic contributions to myopic refractive error: Insights from human studies and supporting evidence from animal models. Exp Eye Res. 2013 doi: 10.1016/j.exer.2012.12.015. [DOI] [PubMed] [Google Scholar]
- 33.Metlapally R, Ki CS, Li YJ, et al. Genetic association of insulin-like growth factor-1 polymorphisms with high-grade myopia in an international family cohort. Invest Ophthalmol Vis Sci. 2010;51(9):4476–4479. doi: 10.1167/iovs.09-4912. [DOI] [PMC free article] [PubMed] [Google Scholar]
- 34.Lin HJ, Kung YJ, Lin YJ, et al. Association of the lumican gene functional 3′-UTR polymorphism with high myopia. Invest Ophthalmol Vis Sci. 2010;51(1):96–102. doi: 10.1167/iovs.09-3612. [DOI] [PubMed] [Google Scholar]
- 35.Lu B, Jiang D, Wang P, et al. Replication study supports CTNND2 as a susceptibility gene for high myopia. Invest Ophthalmol Vis Sci. 2011;52(11):8258–8261. doi: 10.1167/iovs.11-7914. [DOI] [PubMed] [Google Scholar]
- 36.Shi Y, Qu J, Zhang D, et al. Genetic variants at 13q12.12 are associated with high myopia in the Han Chinese population. Am J Hum Genet. 2011;88(6):805–813. doi: 10.1016/j.ajhg.2011.04.022. [DOI] [PMC free article] [PubMed] [Google Scholar]
- 37.Shi Y, Li Y, Zhang D, et al. Exome sequencing identifies ZNF644 mutations in high myopia. PLoS Genet. 2011;7(6):e1002084. doi: 10.1371/journal.pgen.1002084. [DOI] [PMC free article] [PubMed] [Google Scholar]
- 38.Tran-Viet KN, St Germain E, Soler V, et al. Study of a US cohort supports the role of ZNF644 and high-grade myopia susceptibility. Mol Vis. 2012;18:937–944. [PMC free article] [PubMed] [Google Scholar]
- 39.Nakanishi H, Yamada R, Gotoh N, et al. A genome-wide association analysis identified a novel susceptible locus for pathological myopia at 11q24.1. PLoS Genet. 2009;5(9):e1000660. doi: 10.1371/journal.pgen.1000660. [DOI] [PMC free article] [PubMed] [Google Scholar]
- 40.Solouki AM, Verhoeven VJ, van Duijn CM, et al. A genome-wide association study identifies a susceptibility locus for refractive errors and myopia at 15q14. Nat Genet. 2010;42(10):897–901. doi: 10.1038/ng.663. [DOI] [PMC free article] [PubMed] [Google Scholar]
- 41.Hysi PG, Young TL, Mackey DA, et al. A genome-wide association study for myopia and refractive error identifies a susceptibility locus at 15q25. Nat Genet. 2010;42(10):902–905. doi: 10.1038/ng.664. [DOI] [PMC free article] [PubMed] [Google Scholar]
- 42.Li Z, Qu J, Xu X, et al. A genome-wide association study reveals association between common variants in an intergenic region of 4q25 and high-grade myopia in the Chinese Han population. Hum Mol Genet. 2011;20(14):2861–2868. doi: 10.1093/hmg/ddr169. [DOI] [PubMed] [Google Scholar]
- 43.Stambolian D, Wojciechowski R, Oexle K, et al. Meta-Analysis of Genome-wide Association Studies in 5 cohorts reveals common variants in RBFOX1, a regulator of tissue-specific splicing, associated with refractive error. Hum Mol Genet. 2013 doi: 10.1093/hmg/ddt116. [DOI] [PMC free article] [PubMed] [Google Scholar]
- 44.Kiefer AK, Tung JY, Do CB, et al. Genome-wide analysis points to roles for extracellular matrix remodeling, the visual cycle, and neuronal development in myopia. PLoS Genet. 2013;9(2):e1003299. doi: 10.1371/journal.pgen.1003299. [DOI] [PMC free article] [PubMed] [Google Scholar]
- 45.Fan Q, Barathi VA, Cheng CY, et al. Genetic variants on chromosome 1q41 influence ocular axial length and high myopia. PLoS Genet. 2012;8(6):e1002753. doi: 10.1371/journal.pgen.1002753. [DOI] [PMC free article] [PubMed] [Google Scholar]
- 46.Kumar S, Hedges SB. A molecular timescale for vertebrate evolution. Nature. 1998;392(6679):917–920. doi: 10.1038/31927. [DOI] [PubMed] [Google Scholar]
- 47.Mouse Genome Sequencing Consortium. Waterston RH, Lindblad-Toh K, et al. Initial sequencing and comparative analysis of the mouse genome. Nature. 2002;420(6915):520–562. doi: 10.1038/nature01262. [DOI] [PubMed] [Google Scholar]
- 48.Newton-Cheh C, Johnson T, Gateva V, et al. Genome-wide association study identifies eight loci associated with blood pressure. Nat Genet. 2009;41(6):666–676. doi: 10.1038/ng.361. [DOI] [PMC free article] [PubMed] [Google Scholar]
- 49.Teslovich TM, Musunuru K, Smith AV, et al. Biological, clinical and population relevance of 95 loci for blood lipids. Nature. 2010;466(7307):707–713. doi: 10.1038/nature09270. [DOI] [PMC free article] [PubMed] [Google Scholar]
- 50.Sotoodehnia N, Isaacs A, de Bakker PI, et al. Common variants in 22 loci are associated with QRS duration and cardiac ventricular conduction. Nat Genet. 2010;42(12):1068–1076. doi: 10.1038/ng.716. [DOI] [PMC free article] [PubMed] [Google Scholar]
- 51.Risch N, Merikangas K. The future of genetic studies of complex human diseases. Science. 1996;273(5281):1516–1517. doi: 10.1126/science.273.5281.1516. [DOI] [PubMed] [Google Scholar]
- 52.Bodmer W, Bonilla C. Common and rare variants in multifactorial susceptibility to common diseases. Nat Genet. 2008;40(6):695–701. doi: 10.1038/ng.f.136. [DOI] [PMC free article] [PubMed] [Google Scholar]
- 53.Schork NJ, Murray SS, Frazer KA, et al. Common vs. rare allele hypotheses for complex diseases. Curr Opin Genet Dev. 2009;19(3):212–219. doi: 10.1016/j.gde.2009.04.010. [DOI] [PMC free article] [PubMed] [Google Scholar]
- 54.Cirulli ET, Goldstein DB. Uncovering the roles of rare variants in common disease through whole-genome sequencing. Nat Rev Genet. 2010;11(6):415–425. doi: 10.1038/nrg2779. [DOI] [PubMed] [Google Scholar]
- 55.Pritchard JK. Are rare variants responsible for susceptibility to complex diseases? Am J Hum Genet. 2001;69(1):124–137. doi: 10.1086/321272. [DOI] [PMC free article] [PubMed] [Google Scholar]
- 56.Burga A, Lehner B. Beyond genotype to phenotype: why the phenotype of an individual cannot always be predicted from their genome sequence and the environment that they experience. FEBS J. 2012;279(20):3765–3775. doi: 10.1111/j.1742-4658.2012.08810.x. [DOI] [PubMed] [Google Scholar]
- 57.Clayton DG. Prediction and interaction in complex disease genetics: experience in type 1 diabetes. PLoS Genet. 2009;5(7):e1000540. doi: 10.1371/journal.pgen.1000540. [DOI] [PMC free article] [PubMed] [Google Scholar]
- 58.Roberts NJ, Vogelstein JT, Parmigiani G, et al. The predictive capacity of personal genome sequencing. Sci Transl Med. 2012;4(133):133ra58. doi: 10.1126/scitranslmed.3003380. [DOI] [PMC free article] [PubMed] [Google Scholar]
Associated Data
This section collects any data citations, data availability statements, or supplementary materials included in this article.