

Abstract
The identification of phenotypic associations in high-dimensional brain connectivity data represents the next frontier in the neuroimaging connectomics era. Exploration of brain-phenotype relationships remains limited by statistical approaches that are computationally intensive, depend on a priori hypotheses, or require stringent correction for multiple comparisons. Here, we propose a computationally efficient, data-driven technique for connectome-wide association studies (CWAS) that provides a comprehensive voxel-wise survey of brain-behavior relationships across the connectome; the approach identifies voxels whose whole-brain connectivity patterns vary significantly with a phenotypic variable. Using resting state fMRI data, we demonstrate the utility of our analytic framework by identifying significant connectivity-phenotype relationships for full-scale IQ and assessing their overlap with existent neuroimaging findings, as synthesized by openly available automated meta-analysis (www.neurosynth.org). The results appeared to be robust to the removal of nuisance covariates (i.e., mean connectivity, global signal, and motion) and varying brain resolution (i.e., voxelwise results are highly similar to results using 800 parcellations). We show that CWAS findings can be used to guide subsequent seed-based correlation analyses. Finally, we demonstrate the applicability of the approach by examining CWAS for three additional datasets, each encompassing a distinct phenotypic variable: neurotypical development, Attention-Deficit/Hyperactivity Disorder diagnostic status, and L-dopa pharmacological manipulation. For each phenotype, our approach to CWAS identified distinct connectome-wide association profiles, not previously attainable in a single study utilizing traditional univariate approaches. As a computationally efficient, extensible, and scalable method, our CWAS framework can accelerate the discovery of brain-behavior relationships in the connectome.
Keywords: brain-behavior relationships, connectome, discovery, functional connectivity, phenotype, resting-state
Introduction
The human connectome, comprising the complete set of neural interactions in the brain, provides the framework for behavior and cognition (Craddock et al., 2013; Sporns, 2011; Sporns et al., 2005). A key challenge for neuroscience is to understand the relationship between inter-individual variations in the organization of functional systems within the connectome, and environmental and phenotypic factors (Akil et al., 2011; Biswal et al., 2010). Phenotypic variables such as task performance, psychological traits, and disease states have been found to be associated with variation within and between specific functional brain circuits (Andrews-Hanna et al., 2010; Fornito and Bullmore, 2010; Greicius, 2008; Kelly et al., 2012, 2008; Zhu et al., 2008). However, connectome-wide association studies (CWAS) permitting the exploration of brain-behavior relationships across the entire connectome remain a challenge as they entail a massive number of comparisons (Milham, 2012). For example, an investigation of connectivity for 25,000 voxels requires considering of more than 300 million voxel pairings.
As in genome-wide association studies (Burton et al., 2007; McCarthy et al., 2008), investigations of connectome-wide associations typically employ mass-univariate statistical analyses. In the univariate approach, a phenotypic measure is related to only one functional connection at a time (e.g., between regions of interest [ROIs], or between voxels in a whole-brain analysis); concurrent contributions from other connections are necessarily ignored (Cole et al., 2010). The large number of statistical tests entailed by this approach (thousands to millions) increases the potential for false positives, requiring stringent correction for multiple comparisons (Benjamini and Hochberg, 1995; Chumbley and Friston, 2009; Genovese et al., 2002; Hu et al., 2010; Worsley et al., 2005; Zalesky et al., 2010a). In addition, visualization and interpretation of results from such a massive number of univariate analyses in three dimensions represent major challenges (e.g., visualization of the voxel-wise connectome) (Margulies et al., 2013).
Multivariate learning methods have been advocated as an alternative approach for exploring connectivity-phenotype associations (Margulies et al., 2010). In the multivariate framework, the simultaneous contribution of entire sets of functional connections to a phenotypic variable (e.g., age, clinical diagnosis, behavioral performance) is evaluated. This reduces the number of connectivity-phenotype evaluations to one per set and thus reduces the scale of the multiple comparison problem. Given that cognitive and perceptual processes are driven by patterns of concurrent activity across distributed brain networks rather than individual regions (Haynes and Rees, 2006; Norman et al., 2006), simultaneous assessment of multiple connections may capture connectivity-phenotype relationships more accurately (Varoquaux and Craddock, 2013). While a variety of multivariate approaches can assess phenotypic associations in the connectome (Varoquaux and Craddock, 2013), several factors led us to pursue multivariate distance matrix regression (MDMR) (Anderson, 2001; McArdle and Anderson, 2001; Reiss et al., 2010; Zapala and Schork, 2006). These include: 1) the ability to examine more than one predictor variable at a time (i.e., covariates can be incorporated), 2) applicability for categorical and/or continuous variables, 3) minimal requirements for parameter-specific or analytic decision-making (e.g., a user only needs to choose the distance measure), and 4) ease of interpretability due to regression-like analytic structure. MDMR has also been shown to have excellent test level accuracy and good statistical power (Schork et al., 2008; Zapala and Schork, 2012, 2006, Lin and Schaid, 2009).
Here, we provide a whole-brain framework for identifying phenotypic associations in the connectome. While the approach is illustrated using several examinations of functional connectivity, it can also be applied to structural connectivity. At each node in the connectome (defined by voxels, brain areas, or parcellation units), we test whether inter-individual whole-brain connectivity patterns are related to differences in one or more phenotypic variables of interest. This is accomplished using a two-step approach. First, for each node in the connectome, we calculate a whole brain functional connectivity map, and then calculate the similarity between the connectivity maps of all possible pairings of participants using spatial correlation, yielding an n × n matrix (n = number of participants). Then, at each node, we use MDMR to test whether a variable of interest (e.g., a clinical diagnosis) is associated with the between-subject distances: significance is determined using permutation testing (Fig. 1). The end result is a statistic for each node that indicates the strength of the relationship between a phenotypic measure and variations in its connectivity patterns across participants.
Figure 1. Schematic of the CWAS Analytic Framework.

The proposed framework is carried out for each grey matter voxel separately. Starting with (1) a single seed voxel, (2) maps of temporal correlations (i.e., functional connectivity) between the seed voxel and every other grey matter voxel are generated (yellow-red = positive correlations, blue-cyan = negative correlations). Next, (3) the distance (one minus the correlation) between every pair of participants' connectivity maps is computed (red-white = positive correlation or distance of 0-1, white-blue = negative correlation or distance of 1-2), and (4) an analysis of distance, analogous to an analysis of variance, is performed. The sum of squared distances between typically developing children (TDC) and children with ADHD is compared to the residual sum of squared distances (the error term) to produce a pseudo-F statistic. An accompanying p-value is obtained by permutation. This workflow (steps 1-4) is then repeated for every grey matter voxel to produce a whole-brain map of p-values values, which is then thresholded at p<0.05 and corrected for multiple comparisons by setting a minimum cluster size (p < 0.05) based on Monte Carlo simulations. All flat maps are of the right hemisphere and are rendered on the PALS-B12 atlas in caret.
Our approach attempts to lower common barriers to effective discovery science and full-brain exploration of the connectome (Biswal et al., 2010; Van Horn and Gazzaniga, 2002); in particular, the high computational demands and resulting necessity to incorporate a priori information to constrain the problem. The proposed MDMR-based framework does not require the user to pre-specify or estimate the dimensionality of the data (as in independent component analysis or clustering; Beckmann, 2012; Bellec et al., 2010; Damoiseaux et al., 2006; Hartigan, 1975; Mckeown et al., 1998) or select parameters for graph construction (as in network centrality-based approaches; Buckner et al., 2009; Bullmore and Sporns, 2009; Bullmore and Bassett, 2011; Zuo et al., 2012). The resolution of brain representations (e.g., voxels) does not need to be reduced to facilitate computation, as is common with graph theoretic analyses (Buckner et al., 2009; Cole et al., 2010; Zalesky et al., 2010b). Finally, there is no need to select particular seeds or networks, as in seed-based correlation analyses (Cole et al., 2010).
Our primary demonstration and evaluation of the MDMR-based CWAS approach focuses on the identification of connectome-wide associations for IQ using resting state data from the publicly available Enhanced Nathan Kline Institute Rockland Sample (NKI-RS; http://fcon_1000.projects.nitrc.org/indi/enhanced). Advantages of this dataset include moderate sample size (n = 104) and multiple resting-state scans (albeit with different imaging sequence parameters). This enabled us to evaluate the robustness of our results, their overlap with existing meta-analyses of IQ-brain relationships, and their utility in guiding subsequent seed-based correlation analyses. The impact of potential confound signals (e.g., motion), preprocessing strategies (e.g., global signal regression), and brain parcellation strategies were considered, as well as overall differences in measured brain connectivity from one individual to the next. In addition, we provide three other examples of MDMR-based CWAS applications using a range of phenotypes and experimental designs (Attention-Deficit/Hyperactivity Disorder [ADHD] vs. controls, age-related developmental effects, and administration of L-DOPA vs. placebo). A summary of our approach is provided in Figure 1, and an overview of analyses is provided in Figure 2. Code for all analyses and figures in the paper are available online (https://github.com/czarrar/cwas-paper).
Figure 2. Overview of Analyses.

Goals or objectives are given in the first column, followed by the particular analyses used in the second column, the datasets examined in the third column, and the associated figures in the final column. Supplementary analyses provide further applications and details of MDMR-based CWAS, including false positive and negative rates using simulations and the potential impact of selecting difference distance measures.
Methods
Participants
We examined resting-state fMRI scans from four community-based datasets (see Table 2 for demographics). The four datasets included: 1) IQ: healthy adults with Full Scale IQ estimated with the Wechsler Abbreviated Scale of Intelligence (WASI) from the NKI-RS with ages 18 to 65 (http://fcon_1000.projects.nitrc.org/indi/enhanced; Nooner et al., 2012); 2) Development: healthy individuals ranging from children to young adults (http://fcon_1000.projects.nitrc.org/indi/retro/Power2012.html; Power et al., 2012); 3) ADHD: typically developing children and children meeting DSM-IV criteria for ADHD sampled from the NYU site of the ADHD200 dataset that were matched for age and sex (http://fcon_1000.projects.nitrc.org/indi/adhd200; Chabernaud et al., 2012; Di Martino et al., 2011; Kelly et al., 2009; Koyama et al., 2011; Mennes et al., 2012; Zuo et al., 2010); and 4) L-dopa: healthy adults administered 100mg of L-dopa or placebo double-blind on two separate scan visits (Kelly et al., 2009). Datasets 1-3 and the placebo scans from Dataset 4 are publicly available for download from the International Data-Sharing Initiative at http://fcon_1000.projects.nitrc.org.
Table 2.
Listed are the peaks of significant connectome-wide associations related to full-scale IQ for Scans 1 and 2. Peaks were found using AFNI's 3dExtrema by setting a voxel-level threshold of Z > 1.65 and a minimum distance of 20mm between peaks. Abbreviations: H, hemisphere; R, right; L, left; BA = Brodmann Area.
| Scan 1 | |||||||
|---|---|---|---|---|---|---|---|
|
| |||||||
| Network | H | Region | BA | x | y | z | Statistic |
| Cluster 1 (1,110 voxels [4mm]) | |||||||
| Default | L | Isthmus Cingulate Gyrus | 29 | -4 | -52 | 14 | 2.46 |
| Default | R | Precuneus Sulcus | 23 | 16 | -44 | 34 | 2.29 |
| Dorsal Attention | R | Inferior Parietal Gyrus | 39 | 44 | -76 | 18 | 3.28 |
| Dorsal Attention | L | Inferior Temporal Gyrus | 37 | -48 | -68 | 2 | 2.26 |
| Somatomotor | L | Cerebellum (V) | -8 | -56 | -10 | 3.64 | |
| Ventral Attention | L | Cerebellum (VI) | -28 | -52 | -22 | 2.48 | |
| Visual | R | Peri Calcarine Sulcus | 17 | 12 | -76 | 14 | 3.33 |
| Visual | L | Peri Calcarine Gyrus | 17 | -12 | -72 | 10 | 3.31 |
| Visual | R | Lingual Gyrus | 18 | 12 | -52 | -6 | 3.30 |
| Visual | L | Cuneus Gyrus | 17 | -8 | -96 | 18 | 3.21 |
| Visual | L | Lingual Sulcus | 19 | -24 | -68 | -6 | 2.86 |
| Visual | R | Parahippocampal Sulcus | 20 | 32 | -40 | -10 | 2.78 |
| Visual | R | Lingual Gyrus | 18 | 16 | -80 | -10 | 2.70 |
| Visual | R | Lingual Sulcus | 19 | 32 | -52 | 6 | 2.65 |
| Visual | R | Lateral Occipital Gyrus | 17 | 20 | -96 | 10 | 2.34 |
| Cluster 2 (1,026 voxels) | |||||||
| Default | L | Pars Orbitalis Gyrus | 11 | -48 | 24 | -10 | 3.34 |
| Default | L | Middle Temporal Gyrus | 21 | -60 | -40 | -6 | 2.80 |
| Default | L | Caudal Middle Frontal Gyrus | 44 | -44 | 20 | 42 | 2.37 |
| Default | L | Superior Frontal Gyrus | 32 | -8 | 40 | 42 | 2.20 |
| Default | L | Superior Frontal Gyrus | 6 | -20 | 20 | 54 | 2.08 |
| Dorsal Attention | L | Precentral Sulcus | 6 | -24 | -12 | 50 | 2.90 |
| Frontoparietal | R | Posterior Cingulate Sulcus | 12 | -16 | 34 | 3.56 | |
| Frontoparietal | L | Precentral Sulcus | -40 | -4 | 30 | 2.79 | |
| Limbic | L | Lateral Orbital Frontal Gyrus | -24 | 16 | -18 | 3.02 | |
| Limbic | R | Thalamus | 4 | -4 | -2 | 1.99 | |
| Somatomotor | L | Superior Temporal Gyrus | 22 | -60 | -4 | -6 | 2.55 |
| Somatomotor | R | Paracentral Gyrus | 6 | 4 | -12 | 58 | 2.43 |
| Somatomotor | L | Post Central Gyrus | 43 | -64 | -20 | 18 | 1.91 |
| Somatomotor | L | Precentral Gyrus | 4 | -60 | -4 | 34 | 1.79 |
| Ventral Attention | L | Superior Frontal Gyrus | 6 | -4 | 8 | 50 | 3.03 |
| Ventral Attention | L | Superior Temporal Sulcus | 20 | -40 | 0 | -22 | 3.02 |
| Ventral Attention | L | Superior Frontal Gyrus | 6 | -16 | 0 | 70 | 2.92 |
| Ventral Attention | L | Putamen | -28 | 4 | 10 | 2.90 | |
| Ventral Attention | L | Insula Gyrus | -32 | 24 | 6 | 1.99 | |
| Cluster 3 (301 voxels) | |||||||
| Default | R | Inferior Parietal Sulcus | 41 | 44 | -44 | 22 | 2.79 |
| Default | R | Lateral Orbital Frontal Gyrus | 47 | 32 | 24 | -18 | 2.59 |
| Frontoparietal | R | Rostral Middle Frontal Sulcus | 46 | 36 | 40 | 10 | 2.08 |
| Limbic | R | Banks Superior Temporal Gyrus | 38 | 32 | 4 | -22 | 2.70 |
| Somatomotor | R | Banks Superior Temporal Gyrus | 22 | 64 | -40 | 10 | 3.12 |
| Somatomotor | R | Banks Superior Temporal Gyrus | 22 | 64 | -24 | -2 | 2.32 |
| Ventral Attention | R | Precentral Gyrus | 56 | 8 | 6 | 2.88 | |
| Ventral Attention | R | Insula Sulcus | 36 | 8 | 10 | 2.76 | |
|
| |||||||
| Scan 2 | |||||||
|
| |||||||
| Cluster 1 (1,655 voxels [4mm]) | |||||||
| Default | L | Lateral Orbital Frontal Gyrus | 47 | -36 | 52 | -10 | 3.178 |
| Default | L | Superior Frontal Gyrus | 9 | -16 | 64 | 22 | 3.167 |
| Default | L | Medial Orbital Frontal Sulcus | 32 | -12 | 48 | -2 | 3.05 |
| Default | L | Inferior Parietal Gyrus | 19 | -40 | -72 | 42 | 2.853 |
| Default | R | Isthmus Cingulate Sulcus | 23 | 8 | -48 | 22 | 2.272 |
| Default | L | Precuneus Gyrus | 5 | -4 | -48 | 46 | 2.196 |
| Default | R | Superior Frontal Gyrus | 9 | 12 | 64 | 22 | 2.173 |
| Dorsal Attention | L | Middle Temporal Gyrus | 39 | -48 | -64 | 14 | 2.475 |
| Frontoparietal | L | Caudal Anterior Cingulate Sulcus | 32 | -12 | 32 | 26 | 3.243 |
| Frontoparietal | L | Superior Frontal Gyrus | 8 | -4 | 28 | 46 | 3.067 |
| Frontoparietal | L | Superior Frontal Sulcus | 6 | -16 | 8 | 62 | 2.485 |
| Limbic | L | Brain Stem | -8 | -28 | -2 | 2.454 | |
| Somatomotor | L | Superior Frontal Sulcus | 6 | -12 | -8 | 46 | 2.729 |
| Somatomotor | L | Cerebellum (V) | -28 | -36 | -30 | 2.727 | |
| Somatomotor | R | Paracentral Gyrus | 4 | 4 | -8 | 70 | 2.512 |
| Somatomotor | L | Paracentral Sulcus | 4 | -12 | -24 | 62 | 2.428 |
| Somatomotor | L | Supra Marginal Sulcus | 41 | -48 | -44 | 18 | 2.343 |
| Ventral Attention | R | Brain Stem | 8 | -32 | -22 | 3.152 | |
| Ventral Attention | L | Cerebellum (VI) | -12 | -68 | -18 | 1.989 | |
| Visual | R | Precuneus Sulcus | 28 | -56 | 14 | 3.173 | |
| Visual | R | Peri Calcarine Gyrus | 17 | 4 | -68 | 14 | 2.066 |
| Visual | R | Precuneus Sulcus | 7 | 20 | -60 | 34 | 2.057 |
| Visual | R | Parahippocampal Sulcus | 37 | 28 | -40 | -6 | 1.774 |
| Cluster 2 (333 voxels) | |||||||
| Default | L | Pars Orbitalis Gyrus | 11 | -48 | 24 | -10 | 3.393 |
| Default | L | Pars Triangularis Gyrus | 47 | -52 | 40 | 2 | 1.762 |
| Frontoparietal | L | Precentral Gyrus | 6 | -48 | 12 | 34 | 2.794 |
| Ventral Attention | L | Insula Gyrus | 38 | -36 | 8 | -18 | 3.057 |
| Ventral Attention | L | Precentral Gyrus | -56 | 4 | 6 | 2.57 | |
Data Acquisition
For the first dataset (IQ), imaging data were acquired using a Siemens Tim Trio 3T scanner with a 32-channel head coil at the Center for Advanced Brain Imaging, NKI. Three different resting-state fMRI scans were collected in the following order: (i) Scan 1, a multiband echoplanar imaging (EPI) sequence (Moeller et al., 2010; Xu et al., 2013) (900 time points, repetition time [TR] = 645 ms, echo time [TE] = 30 ms, flip angle = 60°, 40 slices, voxel size = 3×3×3 mm), (ii) Scan 2, a higher spatial resolution multiband EPI sequence (404 time points, TR = 1400 ms, TE = 30 ms, flip angle = 60°, 64 slices, voxel size = 2×2×2 mm), and (iii) Scan 3, a standard EPI sequence (120 time points, TR = 2500 ms, TE = 30ms, flip angle = 80°, 38 slices, voxel size = 3×3×3.33 mm). Scan 3 was not included in the present study because its duration is half that of Scans 1 and 2, decreasing detectability and comparability. A T1-weighted magnetization prepared gradient echo sequence (MPRAGE) structural image was also acquired (TR = 1900 ms, TE = 2.52 ms, flip angle = 9°, 176 slices, voxel size = 1×1×1 mm). Only datasets for individuals between ages 18.0 and 65.0 years old were included in the present analyses (n = 104; mean age = 40.3 years).
Dataset 2 (development; Power et al., 2012) was acquired using a Siemens Tim Trio 3T at Washington University at St. Louis. Resting-state fMRI data were obtained using a BOLD contrast sensitive gradient EPI sequence (133 time points, TR = 2500 ms [n = 68] or 2200 ms [n = 5] or 2000 ms [n = 4], TE = 27 ms, flip angle = 90°, 32 slices, voxel size = 4×4×4 mm). A T1-weighted sagittal MPRAGE structural image was also obtained (TR-partition = 2.4 s, TE = 3.06 ms, TI=1000 ms, flip angle=8°, 176 slices, acquisition voxel size=1×1×1 mm).
For Dataset 3 (ADHD-200: NYU), imaging data were acquired using a Siemens Allegra 3T (NYU Center for Brain Imaging). Resting-state fMRI data were collected with a multi-echo EPI sequence (180 time points; repetition time [TR], 2000 ms; effective echo time [TE] = 33ms; flip angle, 90°; 33 slices; voxel size, 3×3×4mm). A T1-weighted MPRAGE sequence was also acquired (TR=2530ms; TE=3.25ms; TI=1100ms; flip angle=7°; 128 slices; FOV=256mm; acquisition voxel size=1.3×1×1.3mm). Following removal of participants with data that failed quality assurance (as described in a later section), we selected our sample for analysis from those remaining to group-match the ADHD and TDC groups on age and sex (see Table 2).
Dataset 4 (L-dopa; Kelly et al., 2009) was acquired using a 4T Bruker Med Spec system (Centre for Magnetic Resonance, University of Queensland) equipped with a transverse electromagnetic head coil. Resting-state fMRI data comprised 200 contiguous EPI volumes (TR = 2100ms; TE = 30ms; flip angle = 90; 36 slices; acquisition voxel size = 3.6×3.6×3mm). A high-resolution T1-weighted MPRAGE sequence was also acquired (TR = 2500 ms; TE = 3.83ms; TI = 1500 ms; flip angle = 8 degrees; 256 slices; acquisition voxel size = 0.9 × 0.9 × 0.9 mm).
Preparation of Functional Connectivity Data
Each resting-state fMRI scan was preprocessed via a development version of the Configurable Pipeline for the Analysis of Connectomes (C-PAC, http://fcp-indi.github.com/C-PAC), which builds on AFNI (http://afni.nimh.nih.gov/afni), FSL (http://www.fmrib.ox.ac.uk), and Nipype (Gorgolewski et al., 2011). Preprocessing comprised slice time correction; motion correction; mean-based intensity normalization; nuisance signal removal via multiple regression (described below); temporal bandpass filtering (0.009–0.1Hz); linear registration of functional to structural images using FSL's Flirt; and nonlinear registration of structural images to the MNI152 template (2mm isotropic) using FSL's FNIRT (Andersson et al., 2007).
Nuisance signals were removed using two strategies. Both strategies involved removal of linear/quadratic trends (to account for scanner drift) and six motion parameters. The first strategy also removed 5 “nuisance” signals obtained by means of a principal components analysis of white matter (WM) and cerebrospinal fluid (CSF) signals using the component based noise correction (CompCor) approach (Behzadi et al., 2007; Chai et al., 2012). This strategy was used for principal analyses, except where indicated. The second strategy removed signals associated with mean time series extract from CSF, WM, as well as the global signal, and was conducted for comparability with the published literature (Gotts et al., 2013; Murphy et al., 2013; Yan et al., 2013b). As a final step, data were spatially smoothed to FWHM=8mm using AFNI's 3dBlurFWHM, which calculates a smoothing kernel to obtain the predetermined output smoothing from the initial smoothness level. The output of these preprocessing steps was a 4D residual functional volume in MNI152 standard space that was resampled to 4 mm isotropic voxels for the purpose of CWAS.
Group Level Nuisance Covariates
We computed two different measures to be included as nuisance covariates in later group analyses. First, given the potential for spurious results from head movements as small as 0.1mm, we calculated mean framewise displacement (a measure of moment-to-moment changes in motion; Power et al., 2012). Second, to partial out effects of global connectivity when using CompCor for preprocessing, we calculated a measure of mean global connectivity (the average correlation across all possible connections; Saad et al., 2013; Yan et al., 2013b) for use as a covariate. This approach to removing effects of global connectivity has been recommended as an alternative to global signal regression (Gotts et al., 2013) and can be contrasted with our second preprocessing strategy that used CSF, WM, and the global signal as nuisance covariates.
Quality Assurance
Given that the Development and L-DOPA datasets were previously quality controlled and published, we did not exclude any participants (Kelly et al., 2009; Power et al., 2012). In contrast, for the IQ and ADHD-200 datasets, which intentionally include datasets of varying quality, we applied a semi-automated approach to exclude poor quality scans. Anatomical scans (one per participant) and functional scans (one to three per participant) were examined in MNI152 standard space (2mm). Here we explain the steps; Supplementary Table 1 provides the number of participants excluded at each step per dataset. For anatomical images, we measured the percentage of voxels (within a standard brain mask) present after skull stripping and the spatial correlation between a given scan and the sample mean. For functional images, we measured head motion with mean framewise displacement (FD), brain coverage with the number of voxels present in an overlap mask (includes voxels present in at least 90% of subjects), and mean functional signal-to-noise ratio (SNR). We excluded participants whose anatomical or functional scans were outliers (i.e., above or below the median by more than two times the interquartile range on the corresponding measure [for mean FD, only the upper limit was enforced]). Manual inspection of outlier scans confirmed that these scans were generally of poor quality, either noisy (e.g., as a result of motion, for functional scans) or with poor grey-white matter contrast (for anatomical scans).
Connectome-Wide Association Studies (CWAS)
Subsequent analyses were performed in R (version 2.15.3; R Core Team, 2013) using up to 12 2.1-GHz AMD Opteron processors and a maximum of 30 GB of RAM. An overview of analytic steps is given in Figure 1. The code for these analyses has been made publicly available through the R package Connectir (http://connectir.projects.nitrc.org), which relies on the bigmemory and related packages (Kane et al., 2013), and the python library C-PAC (http://fcp-indi.github.com/C-PAC). The following three steps were completed separately for each of the four datasets.
The first step was to assess subject-level functional connectivity using temporal Pearson correlations (Fig. 1b). For each participant, we computed correlations of blood oxygen level dependent (BOLD) fMRI signal between each pair of grey matter voxels in the brain. Computations were restricted to grey-matter voxels falling within a tissue prior mask provided with FSL (thresholded at grey matter probability > 25%). We further restricted computations to connections among those voxels that were present in all participants (separately for each dataset). The result of this step was a v × v correlation matrix, where v is the number of 4mm voxels in the group-level grey matter mask (v = 15,615 for the IQ dataset; v = 16,154 for Development; v = 15,967 for ADHD; v = 16,092 for L-DOPA).
The second step was to summarize individual differences in functional connectivity (Fig. 1c). For each voxel, we calculated the distance between connectivity patterns (i.e., each voxel's correlation with the rest of the brain) for every possible pairings of participants in a given dataset. See the appendix for a basic definition on distances and relevant properties. As the distance between a pair of connectivity patterns (e.g., between two participants for a given voxel) we used where r is the Pearson correlation; this distance measure is a metric (Gower and Krzanowski, 1999; Mardia et al., 1979) ranging between 0 and 2 (0 = perfectly correlated, 1 = uncorrelated, 2 = perfectly negatively correlated). The result was an n × n matrix of distances among participants, for each voxel. The 1st row or column of the matrix represents the dissimilarity between the 1st participant's whole-brain connectivity map with all other participants' whole-brain connectivity maps. In supplementary materials, we also examine alternate distance measures including the Chebychev, Euclidean, Kendall Tau, Lin's Concordance Correlation, Mahalanobois, and Spearman Rank similarities/distances.
The third step used multivariate distance matrix regression (MDMR) to test how well phenotypic variables explain the distances between participants obtained in step two (Fig. 1d). Essentially, MDMR was used to test whether, for each voxel, whole-brain connectivity patterns tend to be more similar in individuals with similar phenotypes (e.g., within-group) than in individuals with dissimilar phenotypes (e.g., between-group). MDMR exhibits excellent test level accuracy and good power (Zapala and Schork, 2012). It yields a pseudo-F statistic analogous to an F-statistic from a standard ANOVA model (see Calculation of Pseudo-F Statistic for details). Since the pseudo-F statistic does not in general have an F-distribution under the null hypothesis, its significance is assessed with a permutation test. The null distribution was simulated by applying a random permutation to the subject indices for the variable of interest (e.g., IQ) 15,000 times and re-computing the pseudo-F statistic each time. The pseudo-F statistic from the original data was then referred to this simulated distribution to obtain a p-value. We controlled for family-wise error rate using Gaussian Random Field (GRF) theory (voxel threshold of Z > 1.65, cluster size threshold p < 0.05; note the one-tailed threshold was employed due to the unidirectional nature of the F-test). For comparison, we also performed a more stringent multiple comparisons correction by simulating a permutation distribution of maximum cluster sizes. For this permutation-based cluster correction, statistical maps were thresholded at a voxel-level pseudo-F value that corresponds to p < 0.05 (via a linear fit between the p and F values across all voxels) and then corrected for multiple comparisons using a cluster size corresponding to p < 0.05. The final result of this third step was a map of brain regions whose whole-brain pattern of connectivity was significantly associated with a phenotypic variable such as IQ.
Calculation of the Pseudo-F Statistic in MDMR
As noted above, the pseudo-F statistic forms the basis for MDMR. Here, we first explain the standard approach to calculating the pseudo-F statistic for a single predictor variable. Second, we present modifications to the formula that allow inclusion of multiple predictor variables analogous to standard multiple regression. Finally, we present a matrix algebra device for rapid simultaneous computation of multiple pseudo-F statistics.
Pseudo-F Statistic Details
McArdle and Anderson (2001) introduced a framework for ANOVA-like hypothesis testing when the outcome data consist of a matrix of distances dij (1<i, j<n) among n data points. In our case, this distance matrix reflects the dissimilarity of subjects i and j with respect to the connections between one brain region and the whole brain. Zapala and Schork (2006) adapted the approach to general linear regression models for complex biomedical data, and used the term “multivariate distance matrix regression”, which we have adopted. The approach builds on Gower's solution to the multidimensional scaling problem, which is based on the matrix G = CAC where , n is the number of participants, I is the n × n identity matrix, and 1 is a vector of n 1s. Pre- and post-multiplying by C has the effect of mean-centering the columns and rows of A. Let X be an n × m design matrix of predictor variables (including a column of all 1s for the intercept), and let H = X(XTX)-1XT be the associated n × n “hat” matrix. McArdle and Anderson (2001) propose to assess the relationship between the predictor variables and the dissimilarities by means of the “pseudo-F” statistic
| (1) |
As in a classical F-statistic, the numerator in (1) corresponds to the amount of variation explained by the predictor variable(s) while the denominator corresponds to the error or unexplained variance. Indeed, if G is constructed from Euclidean distances among univariate outcomes, then F in the above equation is the classical F statistic in standard univariate analysis of variance (ANOVA). Thus the pseudo-F statistic is a generalization of the classical F statistic that can be computed for any set of distances dij (not only Euclidean distances) and can thus serve as a statistic for hypothesis testing based on between-point distances. The distances need not be metric and can be a dissimilarity, which have non-metric properties (Gower and Krzanowski, 1999; McArdle and Anderson, 2001).
Modification to Allow Multiple Predictors
To incorporate multiple predictor as in standard multiple regression, we use a more general pseudo-F statistic. Consider three “partial” design matrices X0=1, X1, and X2, such that for k = 0, 1, 2, Xk is an n participant x mk predictor variable matrix of rank mk (< n). In general we are interested in testing the null hypothesis associated with design matrix (X0 X1) versus an alternative model with design matrix X=(X0 X1 X2); for instance X1 comprises nuisance covariates whereas X2 contains the predictor we wish to test. Let H = X(XTX)-1XT as above, and define H2 as H minus the hat matrix arising from the null design matrix (X0 X1). A pseudo-F statistic extending (1) to this more general setting is given by (Reiss et al., 2010)
| (2) |
Since the pseudo-F statistic has an unknown null distribution, significance is assessed with a permutation test. We first orthogonalize X2 with respect to (X0 X1) to attain exchangeability under the null hypothesis (Potter, 2005), and then proceed by permuting the rows within the columns of X2, re-generating the hat matrices H2 and H, and re-computing the F-statistic q times. The q permutations yield a simulated null distribution, and significance is declared if the real-data pseudo-F statistic lies in the right tail of the distribution.
Expression (2) can be interpreted as a test statistic that arises upon embedding the data into Euclidean space (cf. Trosset et al., 2008). Classical multidimensional scaling theory (Mardia et al., 1979, p. 397) implies that when G is non-negative definite, there exist points y1,…,yn in p-dimensional Euclidean space (for some p≤n), the distances among which are given by D. If we then let F1,…,Fp be F-statistics for testing the effect of X2 on each component of the y's, then the numerators of F1,…,Fp add up to the numerator of (2), while the denominators sum to the denominator of (2). This implies that (2) equals a weighted average of F-statistics for the separate components—but with the advantage that (2) can be computed from the distances alone, without actually performing the embedding into Euclidean space.
Modification to Improve Computational Efficiency
The above pseudo-F statistics (Eqs 1-2) must be computed, both for the real data and for P permuted data sets, separately for each of V voxels. Here we present a rapid procedure for these computations.
Let Gv be the above matrix G for voxel v, and Hπi be the ith of the P permuted versions for the hat matrix H. The P × V matrix of permuted-data versions of tr(HG).
can also be obtained by a single matrix multiplication as
| (3) |
Similarly, the permuted versions of tr[(I-H)G] can be computed as:
| (4) |
Together these two results can be combined to yield pseudo-F statistics across multiple permutations and voxels in a P × V matrix:
| (5) |
Evaluation and Application of MDMR as an Approach to CWAS
Our evaluation strategy for MDMR-based CWAS is summarized in Figure 2, and specific details are presented in combination with results to facilitate ease of reading. In brief, the evaluation strategy aimed to:
Assess the robustness of MDMR-based CWAS by examining the false positive rate and reproducibility of CWAS where we regressed on IQ, controlling for age, sex, and mean FD.
Determine effects of removing noise on CWAS including removal of mean connectivity, global signal, and/or motion from analyses related to IQ or development.
Establish the utility of CWAS in guiding seed-based correlation analyses by comparing the results from CWAS against a standard GLM at every connection.
Demonstrate the applicability of CWAS across a range of predictor variables. Specifically, we examined a continuous between-subject variable, age (6.0-25.0 years old), while controlling for number of runs, sex, and mean FD; a categorical between-subject variable, ADHD diagnostic status (ADHD versus control), controlling for age, sex, scan instructions (eyes open or closed), and mean FD; and a within-subject pharmacological manipulation (L-DOPA versus placebo), controlling for mean FD.
Resolve the optimal brain resolution(s) for CWAS. To this end, we applied CWAS to a variety of brain parcellation resolutions for all four datasets (IQ, Development, ADHD, and L-DOPA). For each dataset, we then examined and compared the extent of significant results, reproducibility, and overlap with voxelwise findings.
Supplementary analyses provide insights into the MDMR approach, including false positive and negative rates using simulations and the potential impact of selecting different distance measures.
Results
Overview
In the following sections we apply MDMR, using the distance between participants' functional connectivity maps, to relate functional connectivity to full-scale IQ. We chose IQ as it is a well-established cognitive phenotype with high inter-rater and test-retest reliability, as well as substantial neuropsychological and neuroimaging literatures documenting its neural correlates (Deary et al., 2010; Jung and Haier, 2007). We examine the impact of certain pre-processing decisions (i.e., standardization approaches, parcellation strategies), and contrast findings from MDMR with those obtained from seed-based correlation analyses. Following this initial demonstration of the utility of MDMR for CWAS, we present several additional applications of the approach. In Supplementary Materials, we measure the variation and consistency in the distance matrices for the Pearson measure, compare alternative distance measures, and evaluate the power of the MDMR approach using simulations.
We took advantage of the presence of two R-fMRI scans in each participant's session to provide initial insights into the reproducibility of our IQ findings. However, we note that these are likely underestimates of reproducibility, as scans 1 and 2 systematically differ – both with respect to when they occur in the imaging session (thus allowing for variability related to scanner fatigue/arousal) and the specific imaging protocols (e.g., sampling rate, spatial resolution).
Connectome-Wide Associations for IQ
For our initial survey of CWAS, we identified brain voxels whose inter-individual variation in whole-brain connectivity was related to inter-individual variation in IQ. Overall, we found a large number of significant associations with IQ in Scan 1 (proportion of voxels found significant: 16%; Fig. 3a) and Scan 2 (13%; Fig. 3b). Highly similar findings were obtained using permutation-based cluster correction for multiple comparisons (see Supplementary Fig. 2). We also performed a “meta-permutation test” by repeating the entire MDMR permutation test procedure for each of 15000 permuted data sets. As shown in Supplementary Figure 3, a greater proportion of significant voxels was obtained on only ∼1% of permuted instances (0.38% Scan 1; 1.02% Scan 2).
Figure 3. Connectome-Wide Associations for IQ Revealed with MDMR.
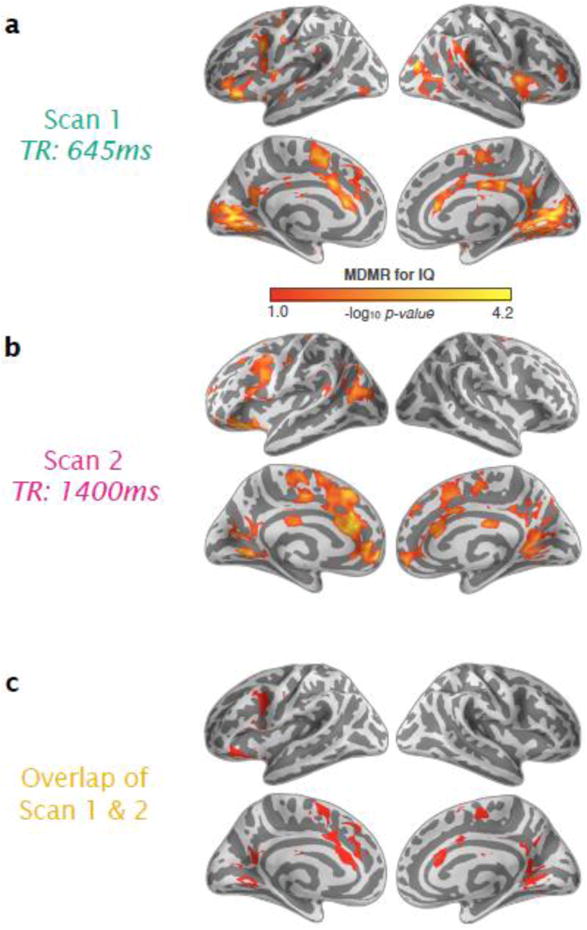
(a) Significant associations between whole-brain functional connectivity and intelligence (full-scale IQ) are shown with p < 0.05 (cluster-corrected using Gaussian random field theory [GRF]) for resting-state Scans 1 and 2. (b) Overlap of significant associations related to IQ between the two scans is shown in red.
We categorized the regions identified across the two scans according to the 7 networks presented by Yeo et al. (2011) and others (Buckner et al., 2011; Choi et al., 2012) (Fig. 4). IQ was significantly associated with variation in whole-brain functional connectivity patterns in fronto-parietal areas (caudal middle frontal and pre-central cortex, frontal operculum/anterior insula; proportion of significant voxels in this network: 8% in Scan 1 and 8% in Scan 2), somatomotor areas (supplementary motor area (SMA), pre-SMA and paracentral cortex; 5% Scan 1 and 22% in Scan 2), ventral attentional network (pre-SMA and caudal anterior cingulate; 18% in Scan 1 and 17% in Scan 2), and visual network areas (lingual and pericalcarine; 34% in Scan 1 and 14% in Scan 2) and default network areas (lateral orbitofrontal, ventromedial prefrontal cortex, precuneus, and posterior cingulate; 28% in Scan 1 and 25% in Scan 2) (see Fig. 5). Overlap between thresholded CWAS maps across Scans 1 and 2 was fair (Dice coefficient = 0.27) but highly significant (p < 0.001, based on a permutation test with 500 permutations), as was the similarity between unthresholded maps (Spearman correlation = 0.25; p < 0.005). Consistent relationships were observed for dorso- and ventrolateral prefrontal cortex (PFC), dorsal anterior cingulate (ACC) and SMA/pre-SMA, posterior cingulate and lingual gyrus, all regions that converge strongly with predictions based on the fronto-parietal integration theory of intelligence (Jung and Haier, 2007).
Figure 4. Large-Scale Network Membership of IQ CWAS.
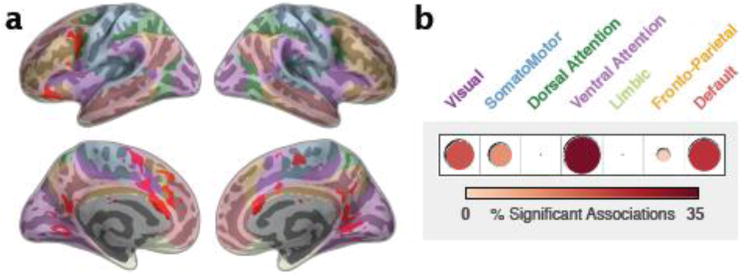
(a) Overlap of significant associations related to IQ between two scans (same as Fig 3b) is shown in red and overlaid on seven functional networks of interest presented by Yeo et al. (2011). The networks are displayed as semi-transparent and correspond to the colored labels given in (b). (b) The proportion of significant associations related to IQ in each of the seven networks is depicted graphically.
Figure 5. Reproducibility of IQ CWAS.
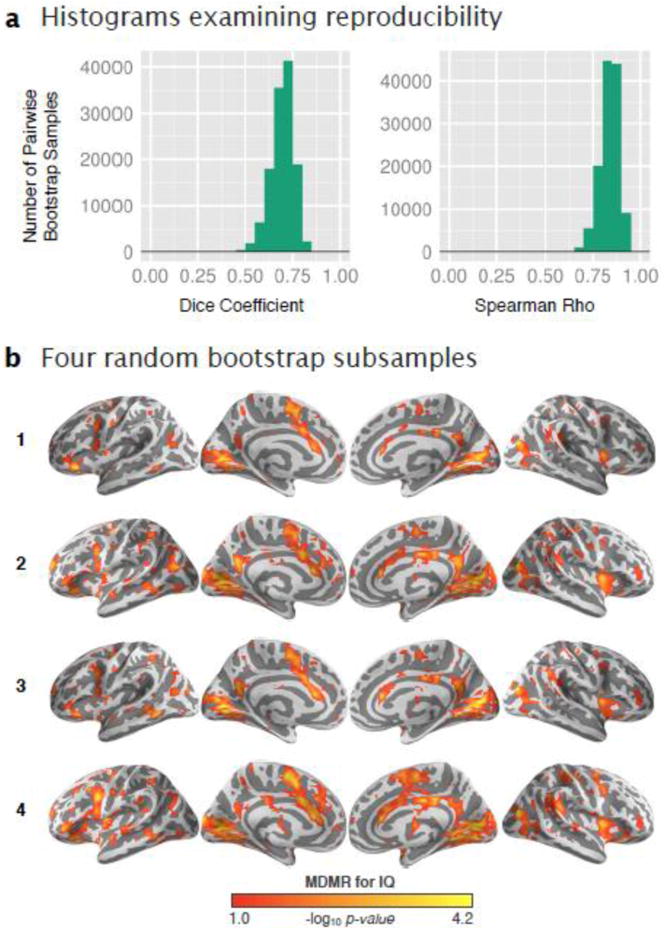
Associations related to IQ were calculated foe each of 500 bootstrap subsamples. (a), Based upon all possible pairings of boostrap subsamples, the histograms display the overlap (Dice coefficient) between significant associations (p < 0.05, uncorrected) and the similarity (Spearman rho) between unthresholded associations. (b) Four random subsamples were selected and the significant associations related to IQ are shown with p < 0.05 (cluster-corrected using GRF).
To further examine the reproducibility of MDMR, we conducted a bootstrap analysis applying MDMR to different subsets of participants using 500 subsamples in total (Figure 5). Overlap between pairs of thresholded bootstrap subsamples (p < 0.05, uncorrected) was high (mean Dice coefficient = 0.69±0.06) as was the similarity between pairs of unthresholded subsamples (mean Spearman rho = 0.84±0.05). When examining four random subsamples (Figure 5b), it's interesting to note the consistency of the same core regions from our main analysis (e.g., anterior cingulate and medial visual cortex) with variability between subsamples occurring around these areas.
Comparison of MDMR Findings with Neurosynth Meta-Analysis Findings
To help validate our claim that MDMR applied to resting state data revealed key brain regions underlying inter-individual variation in IQ, we compared the regions we identified with a meta-analytic summary of the neuroimaging literature. The meta-analysis was performed with Neurosynth (Yarkoni et al., 2011), using search terms highly related to or composing IQ: “intelligence”, “reasoning”, or “WM” (Deary et al., 2010; Duncan et al., 2000, 1995; Kane and Engle, 2002). Search results included studies with a variety of modalities such as task-based fMRI and structural MRI as well as clinical and/or healthy populations. As depicted in Figure 6, our MDMR findings and the Neurosynth meta-analytic results overlapped in key regions highlighted in the literature (Dice coefficient Scan 1 = 0.16 and Scan 2 = 0.17). Areas of overlap included or were proximal to those exhibiting the strongest overlap between scans: dorsolateral and ventrolateral PFC, frontal operculum (including anterior insula), ACC, and adjacent SMA and pre-SMA, all areas commonly implicated in executive control (Dosenbach et al., 2008; Nee et al., 2007; Owen et al., 2005; Simmonds et al., 2008). Although the Neurosynth meta-analysis found more voxels in parietal areas than MDMR, MDMR revealed IQ-related associations in the default network that were not obtained with Neurosynth. Several potential factors could account for differences between text-based meta-analysis and our CWAS analysis. Disparities may reflect noise in Neurosynth study selection (i.e., not all studies using the term ‘intelligence’ were about IQ), variability introduced by the array of imaging modalities and cognitive probes included in Neurosynth, or fundamental differences between regional connectivity (CWAS-MDMR) and regional activation (Neurosynth) with respect to their relations to behavior. In addition, disparities may reflect the need for a larger sample size for CWAS.
Figure 6. Correspondence between CWAS and Neurosynth (Automated Meta-Analyses).
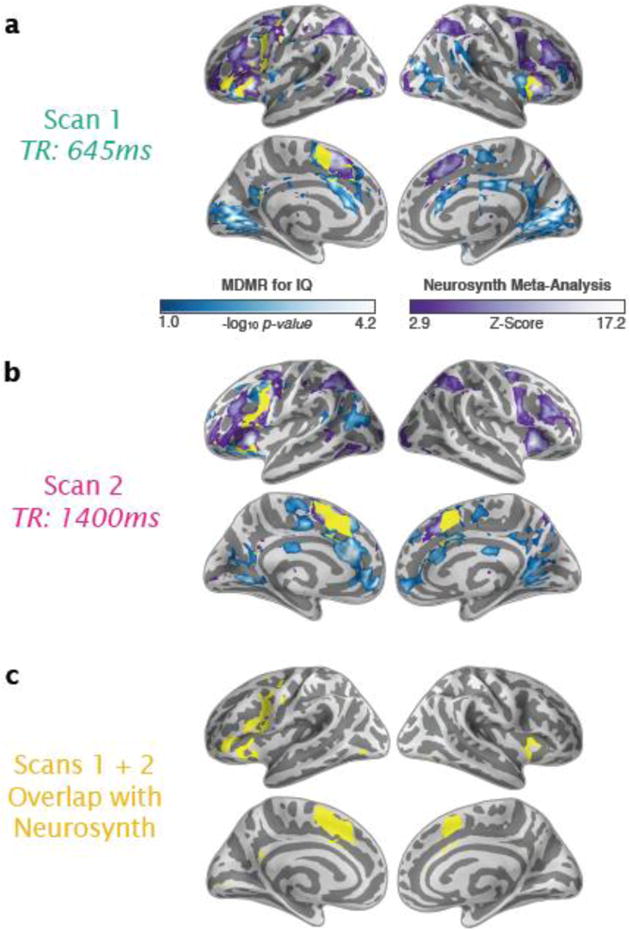
Using our approach, significant associations with intelligence based on MDMR are shown in blue-white for Scans 1 (a) and 2 (b). Using the automated meta-analysis provided with Neurosynth, significant brain activity associated with key terms that were related to IQ (intelligence, reasoning, and WM) are shown in purple-white. The overlap between our approach and the automated meta-analysis is shown in yellow. (c) Only the overlap is shown between the combined MDMR results for Scans 1 and 2 compared to the neurosynth meta-analytic findings.
Effects of Removing Noise (Mean Connectivity, Global Signal Regression and Motion)
Although global signal regression has been criticized for potentially introducing artifactual results under some circumstances (Gotts et al., 2013; Murphy et al., 2009; Saad et al., 2013), standardization of this kind has been shown to provide a simple and effective means of reducing unwanted additive effects including head motion (Saad et al., 2013; Yan et al., 2013a, 2013b). Accordingly, we examined the impact of removing global signal (i.e., average time-series across all voxels in the brain) at the subject level (Fig. 7a), as well as mean connectivity across the whole brain (i.e., the average correlation across all possible connections in the brain) at the group level when examining connectivity-IQ associations (Fig. 7b; see Supplementary Fig. 4 for associations related to mean connectivity). While the percent of significant MDMR findings decreased overall (3 and 10% fewer significant voxels for global signal regression and 9 and 10% fewer significant voxels for mean connectivity covariate, for Scans 1 and 2, respectively), the patterns obtained with both correction strategies strongly resembled those observed in our original IQ findings (Spearman correlation of 0.79 and 0.71 for global signal regression and 0.92 and 0.85 for mean connectivity covariate for Scans 1 and 2, respectively). As potential noise correction approaches, we might expect an increase in the reproducibility of IQ findings between scans. However, we did not observe substantial improvements in the similarity of results between our two scans when using either global signal or mean connectivity correction (no correction: Spearman correlation = 0.25, global signal: 0.21, and mean connectivity: 0.22).
Figure 7. Effects of Global Signal and Mean Connectivity on IQ CWAS.
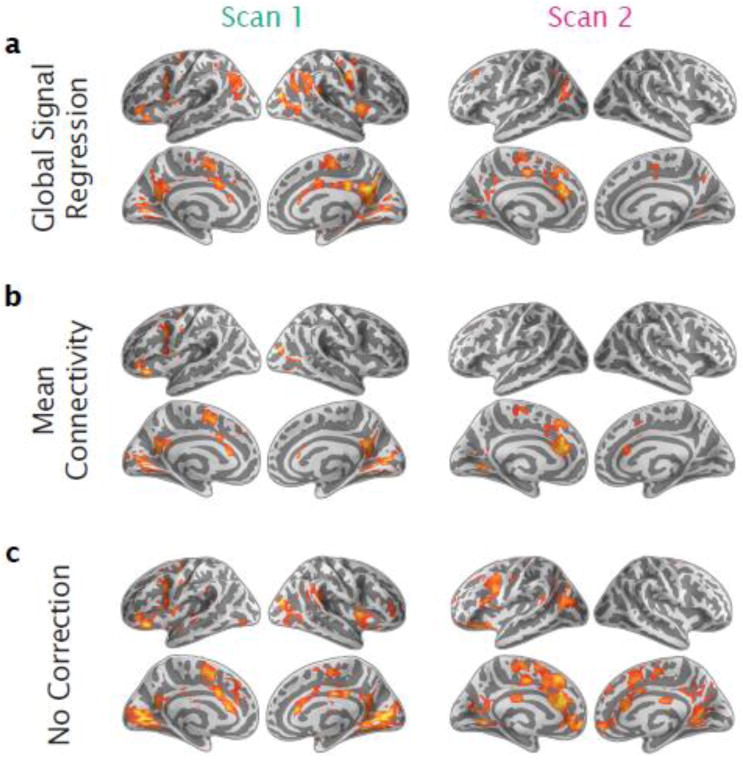
Significant associations for intelligence are shown with p < 0.05 (GRF corrected) when (a) removing the global signal at the individual level, (b) adding the mean connectivity (over all voxelwise functional connections) as a covariate at the group level, or (c) for comparison when using no global-based correction (same as Figure 3a). All results are shown for both resting-state scans.
We evaluated the effects of age – a variable that is more robustly correlated with mean functional connectivity– with MDMR using a developmental dataset (Supplementary Fig. 5; Power et al., 2012). The pattern of findings here was consistent with our IQ analyses: findings for the CompCor analysis path were highly similar to those for global signal regression (Spearman correlation = 0.71) and analysis with mean connectivity covariate (Spearman correlation = 0.85). Relative to IQ findings, we found a greater reduction in the percent of significant associations with age when accounting for global signal (at the subject level; from 45% to 25%) and when accounting for mean connectivity (group level; to 28%). This more substantial reduction in age effects may reflect a greater relationship between age and the global signal as well as age and mean connectivity, both of which are influenced by motion among other factors. In sum, different standardization approaches did not drastically alter the pattern of findings, although global signal regression and mean connectivity did appear to reduce spatial extent of associations. Our supplementary analyses demonstrate the utility of the MDMR-based CWAS framework in accounting for variance related to motion in developmental datasets, where hyperkinetic tendencies can induce artifacts (see Supplementary Fig. 6 and related supplementary discussion).
Comparison of MDMR and GLM Seed-based Connectivity Analyses
Next we compared MDMR results to a more standard general linear model (GLM) relating IQ to each connection between voxels. As in our CWAS analysis, we controlled for age, sex, and mean FD. To facilitate comparison with our CWAS maps, we summarized the GLM results at by the percent of each voxel's connections that were significantly (at p < 0.05, uncorrected) related to IQ. We found a strong positive correlation between the number of connections significantly related with IQ, per GLM, and the log p-value of the relationship between the same voxel and IQ, per MDMR (Spearman correlation = 0.47 [Scan 1] and 0.50 [Scan 2], ps < 0.001; Fig. 8a). In addition, we detected fair overlap between the voxels ranking among the top 5%, 10% and 15% in terms of their significance in the CWAS, and those ranking in the same percentiles based on the number of significant individual connections revealed by GLM (Dice coefficient: 018, 0.28, and 0.36 for Scan 1 and 0.21, 0.29, and 0.35 for Scan 2, respectively; Fig. 8b). This overlap increased when mean connectivity was included as a group-level covariate (Dice coefficient: 0.38, 0.47, and 0.52 for Scan 1 and 0.30, 0.40, and 0.46 for Scan 2, respectively), primarily due to changes in the GLM findings. Adding mean connectivity as a covariate had minimal effects on the rank ordering of voxelwise results for MDMR (Spearman correlation = 0.92 [Scan 1] and 0.85 [Scan 2]) but led to a considerable change for the GLM analyses (Spearman correlation = 0.40 [Scan 1] and 0.27 [Scan 2]).
Figure 8.

Comparison of MDMR analysis and GLM seed-based connectivity analysis (SCA).
(a) For each scan, a voxel's significance based on the MDMR analysis (x-axis) is plotted against the percent of individual connections exhibiting a significant connectivity-IQ relationship for the same voxel in a GLM analysis (y-axis). (b) For each scan, brain regions ranking among the top 15% based on the MDMR analysis are shown in red, those ranking in the same percentiles based on the number of significant GLM findings are shown in green, and the overlap between the two is shown in yellow. (c) The same plot as (b) is shown except mean connectivity is added as a covariate in the MDMR and GLM-based analyses.
MDMR as a Guide for Seed-based Correlation Analyses
Given the relationship between MDMR and voxelwise seed-based correlation analysis (SCA), we wished to test more explicitly whether results from MDMR could be used to guide follow-up seed-based connectivity-phenotype analyses (Fig. 9). In particular, since MDMR-based CWAS indicates only the presence of an association between a phenotypic variable and connectivity patterns, follow-up analyses like SCA are needed to understand the nature of the effect (i.e., direction and specific connections involved). We calculated the percent of significant (p < 0.05) seed-based connectivity-IQ associations for each of a set of regions of interest (ROIs). To start, we selected 100 ROIs from Scan 1 that covered the full range of MDMR values allowing for broad examination of the MDMR-SCA relationship. Specifically, ROIs represented four groups of voxels: global maxima (maximally significant voxels with p < 0.05), significant (random voxels with p < 0.05), non-significant (random voxels with p > 0.05), and global minima (maximally non-significant voxels with p > 0.05). We imposed a minimum distance within ROI groups (20mm) and between ROI groups (10mm) to ensure that regions were well distributed across the brain. As expected, we found that ROIs based on global maxima and significant MDMR values in Scan 1 had significantly more connections showing significant associations with IQ in the massive SCA for Scan 1 (maxima: 23.7%; significant: 14.6%; non-significant 8.3%; minima: 3.4% of seed-based connections; maxima > non-significant: t(37) = 5.9, p < 0.001; maxima > minima: t(26) = 8.7, p < 0.001; significant > non-significant: t(43) = 3.0, p < 0.01; significant > minima: t(28) = 6.3 p < 0.001). A similar pattern of results was noted for the MDMR maxima in Scan 2 and massive SCA in Scan 2 (maxima: 24.4%; significant: 20.8%; nonsignificant 17.1%; minima 4.3%; maxima > non-significant: t(40) = 2.2, p < 0.05; maxima > minima: t(30) = 6.8, p < 0.001; significant > non-significant: t(45) = 1.3, p = 0.2; significant > minima: t(33) = 6.7 p < 0.001).
Figure 9. MDMR as a Guide to SCA.

(a) From Scan 1, 100 regions-of-interest (individual voxels) were selected from associations related to IQ and divided into four groups (25 each) including global maxima significant (maximally significant voxels with p < 0.05; red), significant (random voxels with p < 0.05; green), non-significant (random voxels with p > 0.05; cyan), and global minima (minimally significant voxels with p > 0.05; purple). Bar plots show the percent of individual functional connections that significantly vary with IQ based on a GLM analysis (y-axis), which are averaged within each ROI group (x-axis) for resting-state Scans 1 and 2. (b) As in plot (a), but for 100 ROIs selected from Scan 2.
Next, we carried out a more stringent test of the utility of MDMR in guiding SCA analyses, by using the MDMR ROIs in Scan 1 to guide SCA in Scan 2, and vice-versa (Fig. 9). In both instances, we found that the ROIs based upon maxima and significant voxels in one scan had a higher number of connections showing significant associations with IQ in the massive SCA in the other scan relative to non-significant and minima voxels (Scan 1 to guide Scan 2 - maxima: 13.3%; significant: 14.9%; non-significant 9.4%; minima 10.7%. Scan 2 to guide Scan 1 -maxima: 12.9%; significant: 12.0%; non-significant 10.9%; minima 8.0%). However, differences were significant only for maxima and significant voxels relative to non-significant voxels for Scan 1 guiding Scan 2 (maxima > non-significant: t(48) = 2.0, p < 0.05; significant > non-significant: t(42) = 2.3, p < 0.05) and maxima and significant voxels relative to minima voxels for Scan 2 guiding Scan 1 (maxima > minima: t(39) = 2.0, p < 0.05; significant > minima: t(47) = 2.1, p < 0.05). Differences between ROI groups were notably reduced relative to MDMR-SCA associations within a single scan. These reductions in the magnitude of differences among seed types are not necessarily surprising. As mentioned earlier, there is likely systematic variation related to factors such as the scans being separated in time (in a fixed order) or different imaging protocols (e.g., sampling rate, spatial resolution). Additionally, these differences highlight the need for larger-scale datasets when attempting to carry out replication and follow-up analyses for discovery science; prior work has suggested several hundred participants as preferable for functional connectivity and phenotype associations (Biswal et al., 2010; Kelly et al., 2012).
Applicability of CWAS
We assessed the extensibility of MDMR-based CWAS to a broader range of experimental designs and phenotypic variables. Specifically, we examined a between-subject (continuous) variable, age (6-25 years old), a between-subject (categorical) variable, childhood ADHD diagnostic status; and a within-subject variable, pharmacological manipulation (L-DOPA versus placebo). Each of the analyses revealed a unique pattern of associations (see Figure 10 for cluster-correction based on Gaussian random-field and Supplementary Figure 2 for cluster-correction based on permutations). Some notable findings are as follows. First, for development, nearly 60% of the significant associations observed were in the visual, somatomotor, and ventral attention networks – paralleling results from a support vector machine (SVM) analysis of developmental changes in functional connectivity (Dosenbach et al., 2010). Second, for childhood ADHD, we observed significant associations within the superior parietal cortex – a region involved in goal-directed orienting of attention, highlighted in meta-analyses of task-based and structural imaging studies (Kelly et al., 2007; Valera et al., 2007). Third, the CWAS related to L-DOPA administration was consistent with the results of the published seed-based functional connectivity analysis (Kelly et al., 2009). As in that study, associations were observed for voxels in visual areas (BA 17-19), the default network (dorsal medial PFC and posterior cingulate), brainstem, and the anterior cerebellum and cerebellar vermis. The distinctiveness of these patterns of findings was attested to by our observation that, for almost all pairs of phenotypes, the similarity of MDMR findings (Spearman correlation) approached zero (ADHD-Development = 0.01, ADHD-LDOPA = -0.02, Development-LDOPA = 0.02).
Figure 10. Applicability of MDMR-based CWAS.
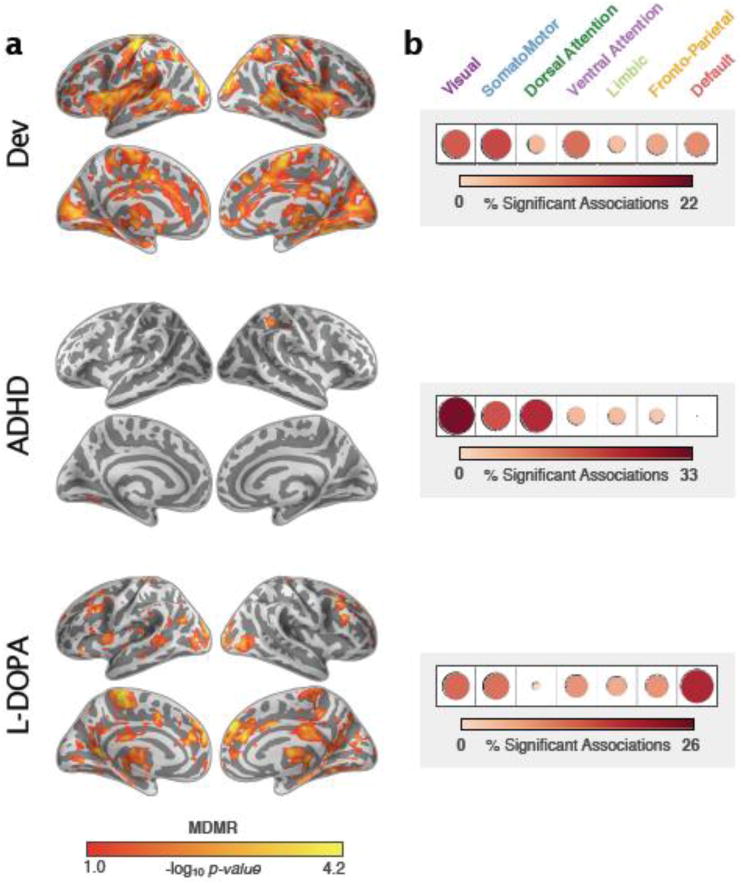
(a) Significant (p < 0.05, cluster-corrected using GRF) connectome-wide associations for development (age), ADHD diagnosis (children with ADHD vs. typically developing controls), and L-DOPA administration (placebo vs. L-DOPA). (b) For each dataset, the percent of significant associations within each of seven functional networks of interest (Yeo et al., 2011).
As expected based upon the literature, age effects were relatively large, whereas findings associated with ADHD were more modest. The extensive findings for the L-DOPA administration is striking given the sample size of 20, but likely ascribable to the within-subject design, which yields greater statistical power.
Resolution Considerations
Voxel-wise analyses entail significant redundancies of information (especially after spatial smoothing), and can have high computational complexity. To examine the effects of data reduction, we parcellated the brain using a variety of resolutions (i.e., 25, 50, 100, 200, 400, 800, 1600, 3200, or 6400 units) based on spatially-constrained spectral clustering (Craddock et al., 2012), and repeated our MDMR analyses at each resolution but transformed each parcellation result to voxelwise space for comparisons. We found high concordance across the various parcellations, regardless of resolution (see Fig. 11 and Supplementary Fig. 6). To provide insight into potential differences, we calculated the following metrics across the various resolutions: 1) number of voxels with significant associations (local maxima: 100, 800, and voxelwise), 2) reproducibility across scans (local maxima: 200, 800 and voxelwise), and 3) overlap with voxelwise results (local maxima: 800 and 1600). Noting that 800 parcels emerged as a local maximum for all three metrics, we examined the effect of using this parcellation set on the Development, ADHD, and L-DOPA MDMR results (Fig. 12). We found substantial overlap between the 800 parcellations and voxelwise MDMR results for each dataset (percent of voxelwise results observed in 800 parcellation results; ADHD: 19%, Development: 64%, IQ [Scan 1]: 66%, and L-DOPA: 67%).
Figure 11. Connectome-Wide Associations for IQ Across Different Parcellations.
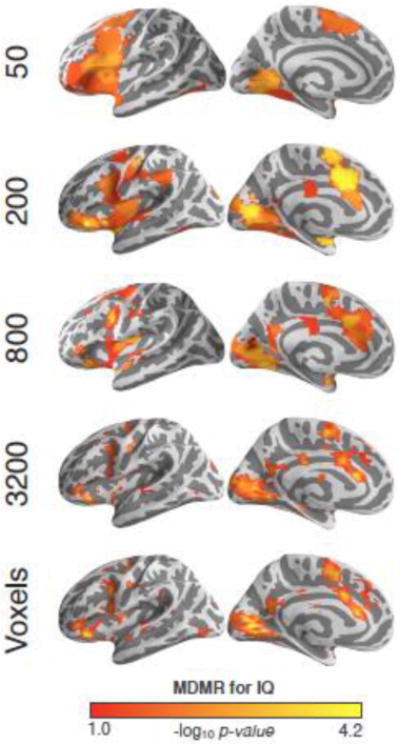
Significant connectome-wide associations for intelligence are shown using 50, 200, 800, and 3200 parcellations as well as the original voxelwise results. All analyses use resting-state Scan 1 and are thresholded at p < 0.05 (cluster-corrected using GRF).
Figure 12. Applicability of Parcellation-Based CWAS.
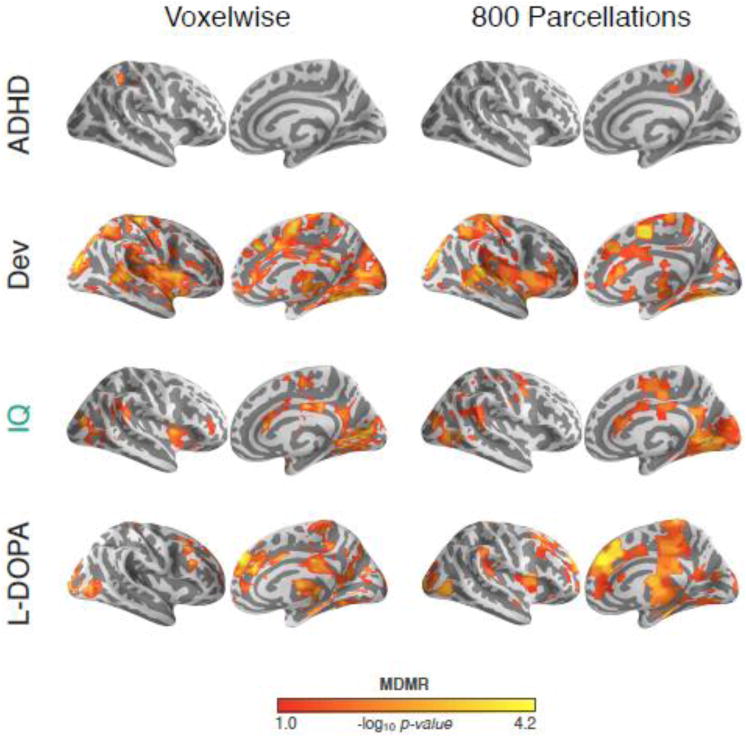
Significant connectome-wide associations for ADHD diagnosis (children with ADHD vs. typically developing controls), development (age), full-scale intelligence (Scan 1), and L-DOPA administration (placebo vs. L-DOPA) are shown based on voxelwise data (left) and 800 parcellation units (right). All datasets are threshold voxelwise at p < 0.05, then cluster-level corrected using GRF at p < 0.05.
Computational Complexity
To assess feasibility for large-scale applications, we summarize the computational complexity of each of the key steps of the framework as a function of U (number of brain units), N (subjects), T (time points), and P (permutations) (see Supplementary Fig. 8). (1) Computing full-brain connectivity is O (U2TN). In practice, this may be the most time-consuming step, as U can be much larger than N (e.g., in voxelwise analyses). (2) Obtaining the distance matrix is O(U2N2). (3) The MDMR step is O(PN2 U) if P>N and O(UN3) if P<N. The overall computational complexity is comparable to other kernel-based approaches in the imaging literature, such as SVMs. Parallelization can be used to reduce the computation time.
Discussion
The present work provides a framework for data-driven connectome-wide examination of the neural correlates of phenotypic variation. The MDMR-based approach is representative of a larger analytic shift in neuroimaging, from examining individual connections to patterns of whole-brain connectivity, which rely minimally on a priori assumptions and is relatively robust to common analytic decisions (e.g., brain parcellation approach, smoothing, and global signal regression). Initial application of the analytic framework to connectivity-IQ relationships provided compelling support for the reproducibility and validity of the findings obtained with MDMR. Specifically, the findings showed impressive reproducibility across first and second within-session scans, and substantial correspondence with a priori predictions based upon the neuropsychological and task-based neuroimaging literatures. Correspondence between MDMR-based findings and those obtained through mass-univariate testing or SCA suggest the utility of the approach in informing the selection of candidate brain regions for more detailed follow-up analyses. Finally, our applications of the MDMR-based approach to a broader range of phenotypes and experimental designs (e.g., within-subject, dimensional, categorical) demonstrate its extensibility.
Mining Neuroscience Data
We believe the following aspects of the MDMR framework make it well suited to exploratory analyses:
Computationally practical. Typically, only a few hours are required for one CWAS (e.g., 3 hours for the IQ dataset (N = 104) using 12 2.21-GHz AMD Opteron processors and 24 GB of RAM) when carried out at the voxel level and less than an hour at the parcellation level. In years to come, as the availability of data stores through initiatives such as the International Neuroimaging Data-Sharing Initiative (http://fcon_1000.projects.nitrc.org), the Human Connectome Project (http://humanconnectome.org) and U.K. Biobank help to bring sample sizes towards the 10,000 mark, emerging technologies for data-intensive computing (e.g., GPUs) will help to maintain the practicality of MDMR and similar approaches.
Extensible. The MDMR framework offers advantages of non-parametric tests and can be applied to any brain-based measure, whether functional or structural. In addition, akin to GLM any variable of interest can be examined, regardless of experimental design (e.g., between- or within-subject design), and interpreted in a regression-like context.(Zapala and Schork, 2012, 2006).
Minimal decision-making or a-priori assumptions. No arbitrary thresholding of functional connectivity or selection of ROIs is required, and findings do not appear to be highly dependent on regional definition methods or spatial resolutions. Selection of a distance measure is necessary and is typically done a-priori. In preliminary comparisons of seven distance measures, we found that all had a similar number and pattern of MDMR results (mean Dice index = 0.63; Supplementary Tables 1-2), in line with prior simulations (Zapala and Schork, 2006). Larger differences were, however, found with the Euclidean and Mahalanobois distances (Supplementary Fig. 10). Further work will be needed to determine ideal distance measures for functional connectivity maps with an understanding that this may vary depending on the question of interest.
Comparisons to Other Techniques
The MDMR-based framework is one of a number of recent approaches to exploratory analysis (similar to a searchlight approach) for the detection of phenotypic associations in human connectomics. Faced with the challenge of exploring a high number of independent variables (P) using a limited number of samples (N; P >> N), an array of exploratory analysis approaches have emerged. This includes classification and graph theoretical techniques.
Within neuroimaging, multivariate techniques are most commonly applied in the context of predictive modeling, whereas MDMR is used to query the presence of an association. Regions found significant with MDMR are not necessarily predictive for classifying novel participants. Instead of being optimized for prediction accuracy, MDMR tests the significance of specific candidate covariates (e.g., IQ) that can be readily applied to exploratory analyses as in the present work. Future research may use classification techniques within our CWAS framework (instead of MDMR) to identify voxels whose whole-brain connectivity patterns are predicted by a phenotypic variable. In cases where the computational demands are too high for such voxelwise classification, our work would suggests lower-dimensional (i.e., ∼800) parcellation units can be used.
Beyond classification techniques, graph theoretical measures that measure invariant graph properties (e.g., network centrality) have become increasingly popular in connectome-wide explorations (Craddock et al., 2013). Such graph properties can help characterize aspects of connectivity patterns (e.g., density and sparsity) in a connectivity pattern that might be relevant for a phenotypic variable. These metrics are often graph invariants and index properties of a graph that are not specific to any one graph (e.g., the same node in two different graphs can have identical degree centrality). In this regard, MDMR-based CWAS differs, as it directly measures variation between the graphs and thus may complement graph invariant measures for more detailed understanding of phenotypic variation in the connectome.
IQ-Related Variation in Frontal Cortex
When we examined MDMR results for IQ with respect to brain resolution, we only found significant relationships between connectivity patterns in prefrontal areas and IQ when using coarser brain resolutions. Similar prefrontal regions were also observed in the Neurosynth meta-analysis. One possibility is that due to anatomical variability between subjects, larger parcellation units may help reduce such variability and recover underlying differences in connectivity patterns related to IQ. Complementing these findings, supplementary analyses examining alternative distance measures found greater sensitivity to prefrontal relationships when Euclidean or Mahalanabis distance were used in place of the Pearson distance. Both these measures consider mean and variance differences in connectivity, which could both be more relevant in IQ related variation for prefrontal connectivity (Cole et al., 2013, 2012).
Considerations for MDMR-Guided Seed-Based Correlation Analysis
Seed-based correlation analysis is perhaps the most popular approach to R-fMRI-based functional connectivity analyses. Despite the simplicity of its implementation and interpretation, this approach faces key challenges—in particular, optimally selecting and specifying regions of interest for seeding. Researchers often rely on findings from a broad array of imaging modalities and neuropsychological studies to identify targets, and often use structural atlases of varying resolution to define seed regions. These strategies may miss potentially valuable seed regions due to a lack of prior work to motivate them.
We have shown a significant relationship between the MDMR-based log p-value observed for a region, and the number of connections exhibiting significant phenotypic associations in SCA (Figs. 8-9). As such, MDMR has the potential to inform and guide SCA by identifying appropriate seed regions. Ideally, MDMR will be performed on one dataset and the regions identified used as seeds in an independent dataset. However, the field is still amassing the necessary datasets to carry out such independent analyses with sufficient power. In the interim, SCA findings obtained in the same dataset used for MDMR should not be interpreted as independent verification (Kriegeskorte et al., 2009), but instead as a type of post-hoc test. Post-hoc explorations are essential to understanding the direction and specific sets of connections driving MDMR findings and valuable in generating hypotheses for replication in future work. We also note that the MDMR log p-value is not perfectly correlated with the number of connections exhibiting significant associations in SCA.
Future Areas for Refinement and Optimization
The MDMR-based CWAS framework can be applied widely depending on the question or neural measure of interest. Here, we focused on correlation-based patterns of functional connectivity revealed by resting-state fMRI in relation to single phenotypic measures, but future work should assess the further extensibility of the approach. First, different functional connectivity metrics can be used, possibly with the aim of refining the connectivity patterns (e.g., partial correlation or inverse covariance matrix) or including directional information (e.g., Patel's tau (Patel et al., 2006) and LiNGAM (Hyvarinen and Smith, 2013)). Second, the approach can be extended beyond functional connectivity. For instance, to better understand the structural connectome, we can examine the relation between a phenotypic variable and patterns of structural connectivity using tractography derived from diffusion-based connectivity (Daducci et al., 2012). Finally, while the present work focuses on MDMR, it is important to note that alternative approaches to hypothesis testing based on distances among observations have been proposed in a number of disciplines, notably ecology and genetics (Gower and Krzanowski, 1999; Minas and Montana, 2012; Rizzo and Székely, 2010; Trosset et al., 2008; Zakharov et al., 2013). Additionally, recent work in the machine learning literature has proposed hypothesis tests based on kernels, which can be regarded as similarities (Gretton et al., 2008; Harchaoui et al., 2013). Typically, these alternative approaches do not allow the possibility of modeling covariates and focus on modeling a single regressor, in contrast to MDMR.
Limitations
Several limitations should be considered. First, examining whole-brain connectivity as we have done here may decrease sensitivity to highly localized sets of connections that relate to a phenotype. This issue can be addressed by limiting patterns of connectivity to specific anatomical regions or networks, rather than considering the full brain. Second, we examined IQ effects on two different resting-state scans, which differed on a number of factors, including a fixed scan order, as well as different imaging protocols (i.e., sampling rate and spatial resolution). Since our focus here was to illustrate the utility of MDMR for CWAS, our results were not intended to provide a definitive characterization of any of the phenotypes we examined. Ultimately, this method should be applied to larger and more diverse samples with follow-up analyses using independent samples and possibly identical scan parameters (e.g., via the Human Connectome Project) that will permit more detailed phenotypic characterization (e.g., separation of subtypes in ADHD) (Fair et al., 2013) and exploration of the individual connections driving connectivity-phenotype relationships. Consequently, future investigations would be well served by applying CWAS to emerging freely available large connectivity-phenotype datasets (e.g., http://fcon_1000.projects.nitrc.org, http://openfmri.org).
Conclusions
We have demonstrated the feasibility of conducting connectome-wide association studies using MDMR. One CWAS captures a rich set of connectivity-phenotype relationships that would have required several traditional functional connectivity studies and can guide subsequent seed-based correlation analyses for more detailed analyses. Given our limited knowledge of how phenotypic variation relates to inter- and intra-individual differences in connectivity, data-driven approaches such as MDMR will be crucial for generating new testable hypotheses that can facilitate our understanding of brain-behavior relationships.
Supplementary Material
Supplementary Figure 1. Power Estimation for MDMR-Based CWAS in the Study Sample.
Based upon simulation data, we calculate the true positive rate (i.e., proportion of significant voxels) as a function of the Cohen's d effect size (for group difference) and percentage of connections exhibiting a group difference (0, 10, 25, 50, 100%). The dotted black line indicates the proportion of individual connections associated with group when using univariate t-tests.
Supplementary Figure 2. Summarizing Inter-Individual Differences in Whole-Brain Connectivity
(a) At each voxel, the mean-adjusted variability (coefficient of variation [CV]) was computed for the distances between all possible pairs of participant connectivity maps. This measure of inter-individual differences in connectivity patterns was standardized (Z-Score) and displayed for Scans 1 and 2 where values in orange-red reflect greater variation and green-purple reflect lower variation in between participant connectivity patterns. (b) The reproducibility of inter-individual differences is displayed at each voxel as the consistency (Kendall's W) between the distances across participant connectivity maps for Scan 1 and Scan 2. (c) Scatter-plots comparing voxelwise values for consistency and coefficient of variation per scan. All inflated brains are rendered with the fsaverage (MNI305) standard brain using pysurfer.
Supplementary Figure 3. CWASusing Permutation-Based Cluster Correction
Significant connectome-wide associations for ADHD diagnosis (children with ADHD vs. typically developing controls), development (age), intelligence (scan 1), intelligence (scan 2), and L-DOPA administration (placebo vs. L-DOPA) are shown with p< 0.05 (permutation-based cluster-correction). These results are similar to those in Fig 3a and Fig 12a, which used GRF for cluster-correction.
Supplementary Figure 4. Comparison of MDMR Findings to Permutation-based Null Distribution
A null distribution with the number of permutations (total 15,000) on the y-axis with the associated percent of significant (p < 0.05, uncorrected) connectome-wide associations for IQ on the x-axis is shown for Scans 1 and 2. The dotted vertical line indicates the percent of significant associations from the real (non-permuted) data.
Supplementary Figure 5. Connectome-Wide Associations for Mean Connectivity
Significant connectome-wide associations for mean global connectivity (i.e., mean across all possible voxelwise functional connections) are shown with p< 0.05 (GRFcluster-corrected) for resting-state Scans 1 and 2.
Supplementary Figure 6. Effects of removing mean and global connectivity as well as motion
Significant connectome-wide associations related to development (age) are shown for different nuisance removal strategies. On the y-axis, MDMR results are displayed for the original analysis using CompCor (top), adding the mean connectivity at the group-level (middle), and removing the global signal at the individual level (bottom). On the x-axix, MDMR results are given for a model with age (left) and one with age that includes motion or mean FD as a covariate (right). The percentages shown indicate the percent of significant associations for that particular analysis. Surface results for the left hemisphere are only displayed.
Supplementary Figure 7. Connectome-Wide Associations for Motion
Significant connectome-wide associations related to motion in the development dataset are shown across the three nuisance removal strategies. Results are displayed for the original analysis using CompCor (top), adding the mean connectivity at the group-level (middle), and removing the global signal at the individual level (bottom). Percentages indicate the percent of significant associations for that particular analysis. Surface results for the left hemisphere are only displayed.
Supplementary Figure 8. Optimal Brain Resolution for CWAS
Significant connectome-wide associations for intelligence were conducted for several resolutions, including 25, 50, 100, 200, 400, 800, 1600, 3200, and 6400 units as well as the original voxelwise analyses with 15,615 units or voxels (x-axis). (a) Percent of significant associations with IQ was then calculated for each resolution (y-axis) and averaged across the two resting-state scans. (b) The overlap (dice coefficient) of significant associations between the two resting-state scans is shown (y-axis). (c) Finally, the percent of significant associations that overlap (dice) with the voxelwise results is shown for each parcellation and represents the average across the two resting-state scans.
Supplementary Figure 9. Theoretical Timing of the CWAS Approach
Expected computational time is shown when running (a) all the steps, (b) the initial connectivity computation, (c) the distance matrices, and (d) MDMR, while varying the number of voxels (x-axis) and number of subjects (y-axis).
Supplementary Figure 10. Comparison of Distance Measures
Significant connectome-wide associations related to IQ(p < 0.05, cluster-corrected) using 800 parcellation units are shown for seven distance measures from top to bottom: Pearson (Pear), Spearman (Spear), Kendall (Kend), Lin's Concordance (Conc), Euclidean (Eucl), and Chebyshev(Cheb).
Supplementary Figure 11. Empirical Timing of MDMR and Related Approaches
Computational time is shown for five approaches: degree centrality, GLM, MDMR, SVM with a linear kernel, and K-Means clustering (x-axis). For each approach, we calculated the average time across 100 iterations in milliseconds (y-axis) taken to measure the association between 10 connectivity maps (800 brain units) and a simulated dichotomous group variable (N = 100).
Table 1.
Demographics. Abbreviations: N, number of participants; F, female; M, Male.
| Dataset | Group | N | F / M | Mean Age | Age Range |
|---|---|---|---|---|---|
| IQ | 104 | 71 / 33 | 40.28 | 18 - 65 | |
|
| |||||
| Development | 77 | 40 / 37 | 14.8 | 6.7- 24.8 | |
|
| |||||
| ADHD | 57 | 22 / 35 | 12.1 | 7.9 - 17.6 | |
| ADHD | |||||
| TDC | 57 | 22 / 35 | 12.4 | 7.2 - 17.8 | |
|
| |||||
| L-DOPA | 19 | 7 / 12 | 26.2 | 20 - 34 | |
Acknowledgments
The authors wish to thank Camille Chabernaud, Chao-Gan Yan, Christine Cox, Damien Fair, Daniel Lurie, Gregory McCarthy, Jonathan Adelstein, Maarten Mennes, Xi-Nian Zuo, and Zhen Yang for helpful comments on earlier versions of this manuscript, and Simon Zorin for assisting in analyses.
Funding: This work was supported by grants from the National Institute of Mental Health (BRAINS R01MH094639 to M.P.M.; R03MH096321 to M.P.M), National Institute of Health (R01MH095836-01A1 to P.T.R.), the Stavros Niarchos Foundation (M. P. M), the Child Mind Institute (1FDN2012-1 to M. P. M.), the Brain and Behavior Research Foundation (R.C.C.), the Leon Levy Foundation (C.K.), a gift from Joseph P. Healey to the Child Mind Institute (M.P.M.), and endowment provided by Phyllis Green and Randolph Cowen (F. X. C.).
Footnotes
Publisher's Disclaimer: This is a PDF file of an unedited manuscript that has been accepted for publication. As a service to our customers we are providing this early version of the manuscript. The manuscript will undergo copyediting, typesetting, and review of the resulting proof before it is published in its final citable form. Please note that during the production process errors may be discovered which could affect the content, and all legal disclaimers that apply to the journal pertain.
References
- Akil H, Martone ME, Essen DCV. Challenges and Opportunities in Mining Neuroscience Data. Science. 2011;331:708–712. doi: 10.1126/science.1199305. [DOI] [PMC free article] [PubMed] [Google Scholar]
- Anderson MJ. A new method for non-parametric multivariate analysis of variance. Austral Ecol. 2001;26:32–46. [Google Scholar]
- Andersson JLR, Jenkinson M, Smith S. Non-Linear Registration, aka Spatial Normalisation (No TR07JA2), FMRIB Technical Report. FMRIB Centre; Oxford, UK: 2007. [Google Scholar]
- Andrews-Hanna JR, Reidler JS, Sepulcre J, Poulin R, Buckner RL. Functional-Anatomic Fractionation of the Brain's Default Network. Neuron. 2010;65:550–562. doi: 10.1016/j.neuron.2010.02.005. [DOI] [PMC free article] [PubMed] [Google Scholar]
- Beckmann CF. Modelling with independent components. NeuroImage. 2012;62:891–901. doi: 10.1016/j.neuroimage.2012.02.020. [DOI] [PubMed] [Google Scholar]
- Behzadi Y, Restom K, Liau J, Liu TT. A component based noise correction method (CompCor) for BOLD and perfusion based fMRI. NeuroImage. 2007;37:90–101. doi: 10.1016/j.neuroimage.2007.04.042. [DOI] [PMC free article] [PubMed] [Google Scholar]
- Bellec P, Rosa-Neto P, Lyttelton OC, Benali H, Evans AC. Multi-level bootstrap analysis of stable clusters in resting-state fMRI. NeuroImage. 2010;51:1126–1139. doi: 10.1016/j.neuroimage.2010.02.082. [DOI] [PubMed] [Google Scholar]
- Benjamini Y, Hochberg Y. Controlling the False Discovery Rate: A Practical and Powerful Approach to Multiple Testing. J R Stat Soc Ser B Methodol. 1995;57:289–300. [Google Scholar]
- Biswal BB, Mennes M, Zuo XN, Gohel S, Kelly C, Smith SM, Beckmann CF, Adelstein JS, Buckner RL, Colcombe S, Dogonowski AM, Ernst M, Fair D, Hampson M, Hoptman MJ, Hyde JS, Kiviniemi VJ, Kötter R, Li SJ, Lin CP, Lowe MJ, Mackay C, Madden DJ, Madsen KH, Margulies DS, Mayberg HS, McMahon K, Monk CS, Mostofsky SH, Nagel BJ, Pekar JJ, Peltier SJ, Petersen SE, Riedl V, Rombouts SARB, Rypma B, Schlaggar BL, Schmidt S, Seidler RD, Siegle GJ, Sorg C, Teng GJ, Veijola J, Villringer A, Walter M, Wang L, Weng XC, Whitfield-Gabrieli S, Williamson P, Windischberger C, Zang YF, Zhang HY, Castellanos FX, Milham MP. Toward discovery science of human brain function. Proc Natl Acad Sci. 2010;107:4734–4739. doi: 10.1073/pnas.0911855107. [DOI] [PMC free article] [PubMed] [Google Scholar]
- Buckner RL, Krienen FM, Castellanos A, Diaz JC, Yeo BTT. The organization of the human cerebellum estimated by intrinsic functional connectivity. J Neurophysiol. 2011;106:2322–2345. doi: 10.1152/jn.00339.2011. [DOI] [PMC free article] [PubMed] [Google Scholar]
- Buckner RL, Sepulcre J, Talukdar T, Krienen FM, Liu H, Hedden T, Andrews-Hanna JR, Sperling RA, Johnson KA. Cortical Hubs Revealed by Intrinsic Functional Connectivity: Mapping, Assessment of Stability, and Relation to Alzheimer's Disease. J Neurosci. 2009;29:1860–1873. doi: 10.1523/JNEUROSCI.5062-08.2009. [DOI] [PMC free article] [PubMed] [Google Scholar]
- Bullmore E, Sporns O. Complex brain networks: graph theoretical analysis of structural and functional systems. Nat Rev Neurosci. 2009;10:186–198. doi: 10.1038/nrn2575. [DOI] [PubMed] [Google Scholar]
- Bullmore ET, Bassett DS. Brain Graphs: Graphical Models of the Human Brain Connectome. Annu Rev Clin Psychol. 2011;7:113–140. doi: 10.1146/annurev-clinpsy-040510-143934. [DOI] [PubMed] [Google Scholar]
- Burton PR, Clayton DG, Cardon LR, Craddock N, Deloukas P, Duncanson A, Kwiatkowski DP, McCarthy MI, Ouwehand WH, Samani NJ, Todd JA, Donnelly P, Barrett JC, Davison D, Easton D, Evans D, Leung HT, Marchini JL, Morris AP, Spencer CCA, Tobin MD, Attwood AP, Boorman JP, Cant B, Everson U, Hussey JM, Jolley JD, Knight AS, Koch K, Meech E, Nutland S, Prowse CV, Stevens HE, Taylor NC, Walters GR, Walker NM, Watkins NA, Winzer T, Jones RW, McArdle WL, Ring SM, Strachan DP, Pembrey M, Breen G, Clair DS, Caesar S, Gordon-Smith K, Jones L, Fraser C, Green EK, Grozeva D, Hamshere ML, Holmans PA, Jones IR, Kirov G, Moskvina V, Nikolov I, O'Donovan MC, Owen MJ, Collier DA, Elkin A, Farmer A, Williamson R, McGuffin P, Young AH, Ferrier IN, Ball SG, Balmforth AJ, Barrett JH, Bishop DT, Iles MM, Maqbool A, Yuldasheva N, Hall AS, Braund PS, Dixon RJ, Mangino M, Stevens S, Thompson JR, Bredin F, Tremelling M, Parkes M, Drummond H, Lees CW, Nimmo ER, Satsangi J, Fisher SA, Forbes A, Lewis CM, Onnie CM, Prescott NJ, Sanderson J, Mathew CG, Barbour J, Mohiuddin MK, Todhunter CE, Mansfield JC, Ahmad T, Cummings FR, Jewell DP, Webster J, Brown MJ, Lathrop GM, Connell J, Dominiczak A, Marcano CAB, Burke B, Dobson R, Gungadoo J, Lee KL, Munroe PB, Newhouse SJ, Onipinla A, Wallace C, Xue M, Caulfield M, Farrall M, Barton A, (braggs), T.B. in R.G and G. Bruce IN, Donovan H, Eyre S, Gilbert PD, Hider SL, Hinks AM, John SL, Potter C, Silman AJ, Symmons DPM, Thomson W, Worthington J, Dunger DB, Widmer B, Frayling TM, Freathy RM, Lango H, Perry JRB, Shields BM, Weedon MN, Hattersley AT, Hitman GA, Walker M, Elliott KS, Groves CJ, Lindgren CM, Rayner NW, Timpson NJ, Zeggini E, Newport M, Sirugo G, Lyons E, Vannberg F, Hill AVS, Bradbury LA, Farrar C, Pointon JJ, Wordsworth P, Brown MA, Franklyn JA, Heward JM, Simmonds MJ, Gough SCL, Seal S, (uk), B.C.S.C. Stratton MR, Rahman N, Ban M, Goris A, Sawcer SJ, Compston Alastair, Conway D, Jallow M, Rockett KA, Bumpstead SJ, Chaney A, Downes K, Ghori MJR, Gwilliam R, Hunt SE, Inouye M, Keniry A, King E, McGinnis R, Potter S, Ravindrarajah R, Whittaker P, Widden C, Withers D, Cardin NJ, Ferreira T, Pereira-Gale J, Hallgrimsdóttir IB, Howie BN, Su Z, Teo YY, Vukcevic D, Bentley D, Compston Alistair. Genome-wide association study of 14,000 cases of seven common diseases and 3,000 shared controls. Nature. 2007;447:661–678. doi: 10.1038/nature05911. [DOI] [PMC free article] [PubMed] [Google Scholar]
- Chabernaud C, Mennes M, Kelly C, Nooner K, Di Martino A, Castellanos FX, Milham MP. Dimensional Brain-Behavior Relationships in Children with Attention-Deficit/Hyperactivity Disorder. Biol Psychiatry. 2012;71:434–442. doi: 10.1016/j.biopsych.2011.08.013. [DOI] [PMC free article] [PubMed] [Google Scholar]
- Chai XJ, Castañón AN, Öngür D, Whitfield-Gabrieli S. Anticorrelations in resting state networks without global signal regression. NeuroImage. 2012;59:1420–1428. doi: 10.1016/j.neuroimage.2011.08.048. [DOI] [PMC free article] [PubMed] [Google Scholar]
- Choi EY, Yeo BTT, Buckner RL. The organization of the human striatum estimated by intrinsic functional connectivity. J Neurophysiol. 2012;108:2242–2263. doi: 10.1152/jn.00270.2012. [DOI] [PMC free article] [PubMed] [Google Scholar]
- Chumbley JR, Friston KJ. False discovery rate revisited: FDR and topological inference using Gaussian random fields. NeuroImage. 2009;44:62–70. doi: 10.1016/j.neuroimage.2008.05.021. [DOI] [PubMed] [Google Scholar]
- Cole DM, Smith SM, Beckmann CF. Advances and Pitfalls in the Analysis and Interpretation of Resting-State FMRI Data. Front Syst Neurosci. 2010;4 doi: 10.3389/fnsys.2010.00008. [DOI] [PMC free article] [PubMed] [Google Scholar]
- Cole MW, Pathak S, Schneider W. Identifying the brain's most globally connected regions. NeuroImage. 2010;49:3132–3148. doi: 10.1016/j.neuroimage.2009.11.001. [DOI] [PubMed] [Google Scholar]
- Cole MW, Reynolds JR, Power JD, Repovs G, Anticevic A, Braver TS. Multitask connectivity reveals flexible hubs for adaptive task control. Nat Neurosci. 2013;16:1348–1355. doi: 10.1038/nn.3470. [DOI] [PMC free article] [PubMed] [Google Scholar]
- Cole MW, Yarkoni T, Repovš G, Anticevic A, Braver TS. Global Connectivity of Prefrontal Cortex Predicts Cognitive Control and Intelligence. J Neurosci. 2012;32:8988–8999. doi: 10.1523/JNEUROSCI.0536-12.2012. [DOI] [PMC free article] [PubMed] [Google Scholar]
- Craddock RC, James GA, Holtzheimer PE, Hu XP, Mayberg HS. A whole brain fMRI atlas generated via spatially constrained spectral clustering. Hum Brain Mapp. 2012;33:1914–1928. doi: 10.1002/hbm.21333. [DOI] [PMC free article] [PubMed] [Google Scholar]
- Craddock RC, Jbabdi S, Yan CG, Vogelstein JT, Castellanos FX, Di Martino A, Kelly C, Heberlein K, Colcombe S, Milham MP. Imaging human connectomes at the macroscale. Nat Methods. 2013;10:524–539. doi: 10.1038/nmeth.2482. [DOI] [PMC free article] [PubMed] [Google Scholar]
- Daducci A, Gerhard S, Griffa A, Lemkaddem A, Cammoun L, Gigandet X, Meuli R, Hagmann P, Thiran JP. The Connectome Mapper: An Open-Source Processing Pipeline to Map Connectomes with MRI. PLoS ONE. 2012;7:e48121. doi: 10.1371/journal.pone.0048121. [DOI] [PMC free article] [PubMed] [Google Scholar]
- Damoiseaux JS, Rombouts SaRB, Barkhof F, Scheltens P, Stam CJ, Smith SM, Beckmann CF. Consistent resting-state networks across healthy subjects. Proc Natl Acad Sci. 2006;103:13848–13853. doi: 10.1073/pnas.0601417103. [DOI] [PMC free article] [PubMed] [Google Scholar]
- Deary IJ, Penke L, Johnson W. The neuroscience of human intelligence differences. Nat Rev Neurosci. 2010;11:201–211. doi: 10.1038/nrn2793. [DOI] [PubMed] [Google Scholar]
- Di Martino A, Kelly C, Grzadzinski R, Zuo XN, Mennes M, Mairena MA, Lord C, Castellanos FX, Milham MP. Aberrant Striatal Functional Connectivity in Children with Autism. Biol Psychiatry. 2011;69:847–856. doi: 10.1016/j.biopsych.2010.10.029. [DOI] [PMC free article] [PubMed] [Google Scholar]
- Dosenbach NUF, Fair DA, Cohen AL, Schlaggar BL, Petersen SE. A dual-networks architecture of top-down control. Trends Cogn Sci. 2008;12:99–105. doi: 10.1016/j.tics.2008.01.001. [DOI] [PMC free article] [PubMed] [Google Scholar]
- Duncan J, Burgess P, Emslie H. Fluid intelligence after frontal lobe lesions. Neuropsychologia. 1995;33:261–268. doi: 10.1016/0028-3932(94)00124-8. [DOI] [PubMed] [Google Scholar]
- Duncan J, Seitz RJ, Kolodny J, Bor D, Herzog H, Ahmed A, Newell FN, Emslie H. A Neural Basis for General Intelligence. Science. 2000;289:457–460. doi: 10.1126/science.289.5478.457. [DOI] [PubMed] [Google Scholar]
- Fair DA, Nigg JT, Iyer S, Bathula D, Mills KL, Dosenbach NUF, Schlaggar BL, Mennes M, Gutman D, Bangaru S, Buitelaar JK, Dickstein DP, Di Martino A, Kennedy DN, Kelly C, Luna B, Schweitzer JB, Velanova K, Wang YF, Mostofsky S, Castellanos FX, Milham MP. Distinct neural signatures detected for ADHD subtypes after controlling for micro-movements in resting state functional connectivity MRI data. Front Syst Neurosci. 2013;6 doi: 10.3389/fnsys.2012.00080. [DOI] [PMC free article] [PubMed] [Google Scholar]
- Fornito A, Bullmore ET. What can spontaneous fluctuations of the blood oxygenation-level-dependent signal tell us about psychiatric disorders? Curr Opin Psychiatry. 2010;23:239–249. doi: 10.1097/YCO.0b013e328337d78d. [DOI] [PubMed] [Google Scholar]
- Genovese CR, Lazar NA, Nichols T. Thresholding of Statistical Maps in Functional Neuroimaging Using the False Discovery Rate. NeuroImage. 2002;15:870–878. doi: 10.1006/nimg.2001.1037. [DOI] [PubMed] [Google Scholar]
- Gorgolewski K, Madison C, Clark D, Halchenko YO, Waskom ML, Ghosh SS. Nipype: a flexible, lightweight and extensible neuroimaging data processing framework in Python. Front Neuroinformatics. 2011;5:13. doi: 10.3389/fninf.2011.00013. [DOI] [PMC free article] [PubMed] [Google Scholar]
- Gotts SJ, Saad ZS, Jo HJ, Wallace GL, Cox RW, Martin A. The perils of global signal regression for group comparisons: a case study of Autism Spectrum Disorders. Front Hum Neurosci. 2013;7 doi: 10.3389/fnhum.2013.00356. [DOI] [PMC free article] [PubMed] [Google Scholar]
- Gower JC, Krzanowski WJ. Analysis of distance for structured multivariate data and extensions to multivariate analysis of variance. J R Stat Soc Ser C Appl Stat. 1999;48:505–519. [Google Scholar]
- Greicius M. Resting-state functional connectivity in neuropsychiatric disorders. Curr Opin Neurol. 2008;24:424–430. doi: 10.1097/WCO.0b013e328306f2c5. [DOI] [PubMed] [Google Scholar]
- Gretton A, Borgwardt K, Rasch MJ, Scholkopf B, Smola AJ. A Kernel Method for the Two-Sample Problem. ArXiv08052368 Cs 2008 [Google Scholar]
- Harchaoui Z, Bach F, Cappe O, Moulines E. Kernel-Based Methods for Hypothesis Testing: A Unified View. IEEE Signal Process Mag. 2013;30:87–97. [Google Scholar]
- Hartigan JA. Clustering Algorithms. 99th. John Wiley & Sons, Inc.; New York, NY, USA: 1975. [Google Scholar]
- Haynes JD, Rees G. Decoding mental states from brain activity in humans. Nat Rev Neurosci. 2006;7:523–534. doi: 10.1038/nrn1931. [DOI] [PubMed] [Google Scholar]
- Hu JX, Zhao H, Zhou HH. False Discovery Rate Control With Groups. J Am Stat Assoc. 2010;105:1215–1227. doi: 10.1198/jasa.2010.tm09329. [DOI] [PMC free article] [PubMed] [Google Scholar]
- Hyvarinen A, Smith SM. Pairwise likelihood ratios for estimation of non-gaussian structural equation models. J Mach Learn Res. 2013;14:111–152. [PMC free article] [PubMed] [Google Scholar]
- Jung RE, Haier RJ. The Parieto-Frontal Integration Theory (P-FIT) of intelligence: Converging neuroimaging evidence. Behav Brain Sci. 2007;30:135–154. doi: 10.1017/S0140525X07001185. [DOI] [PubMed] [Google Scholar]
- Kane M, Emerson JW, Weston S. Scalable Strategies for Computing with Massive Data. J Stat Softw. 2013;55:??–??. [Google Scholar]
- Kane MJ, Engle RW. The role of prefrontal cortex in working-memory capacity, executive attention, and general fluid intelligence: An individual-differences perspective. Psychon Bull Rev. 2002;9:637–671. doi: 10.3758/bf03196323. [DOI] [PubMed] [Google Scholar]
- Kelly AMC, Biswal BB, Craddock RC, Castellanos FX, Milham MP. Characterizing variation in the functional connectome: promise and pitfalls. Trends Cogn Sci. 2012;16:181–188. doi: 10.1016/j.tics.2012.02.001. [DOI] [PMC free article] [PubMed] [Google Scholar]
- Kelly AMClare, Martino AD, Uddin LQ, Shehzad Z, Gee DG, Reiss PT, Margulies DS, Castellanos FX, Milham MP. Development of Anterior Cingulate Functional Connectivity from Late Childhood to Early Adulthood. Cereb Cortex. 2009;19:640–657. doi: 10.1093/cercor/bhn117. [DOI] [PubMed] [Google Scholar]
- Kelly AMC, Uddin LQ, Biswal BB, Castellanos FX, Milham MP. Competition between functional brain networks mediates behavioral variability. NeuroImage. 2008;39:527–537. doi: 10.1016/j.neuroimage.2007.08.008. [DOI] [PubMed] [Google Scholar]
- Kelly AMClare, de Zubicaray G, Martino AD, Copland DA, Reiss PT, Klein DF, Castellanos FX, Milham MP, McMahon K. l-Dopa Modulates Functional Connectivity in Striatal Cognitive and Motor Networks: A Double-Blind Placebo-Controlled Study. J Neurosci. 2009;29:7364–7378. doi: 10.1523/JNEUROSCI.0810-09.2009. [DOI] [PMC free article] [PubMed] [Google Scholar]
- Koyama MS, Martino AD, Zuo XN, Kelly C, Mennes M, Jutagir DR, Castellanos FX, Milham MP. Resting-State Functional Connectivity Indexes Reading Competence in Children and Adults. J Neurosci. 2011;31:8617–8624. doi: 10.1523/JNEUROSCI.4865-10.2011. [DOI] [PMC free article] [PubMed] [Google Scholar]
- Kriegeskorte N, Simmons WK, Bellgowan PSF, Baker CI. Circular analysis in systems neuroscience: the dangers of double dipping. Nat Neurosci. 2009;12:535–540. doi: 10.1038/nn.2303. [DOI] [PMC free article] [PubMed] [Google Scholar]
- Mardia KV, Kent JT, Bibby JM. Multivariate analysis. Academic Press; London; New York: 1979. [Google Scholar]
- Margulies DS, Böttger J, Long X, Lv Y, Kelly C, Schäfer A, Goldhahn D, Abbushi A, Milham MP, Lohmann G, Villringer A. Resting developments: a review of fMRI post-processing methodologies for spontaneous brain activity. Magn Reson Mater Phys Biol Med. 2010;23:289–307. doi: 10.1007/s10334-010-0228-5. [DOI] [PubMed] [Google Scholar]
- Margulies DS, Böttger J, Watanabe A, Gorgolewski KJ. Visualizing the human connectome. NeuroImage. 2013;80:445–461. doi: 10.1016/j.neuroimage.2013.04.111. [DOI] [PubMed] [Google Scholar]
- McArdle BH, Anderson MJ. Fitting Multivariate Models to Community Data: A Comment on Distance-Based Redundancy Analysis. Ecology. 2001;82:290–297. [Google Scholar]
- McCarthy MI, Abecasis GR, Cardon LR, Goldstein DB, Little J, Ioannidis JPA, Hirschhorn JN. Genome-wide association studies for complex traits: consensus, uncertainty and challenges. Nat Rev Genet. 2008;9:356–369. doi: 10.1038/nrg2344. [DOI] [PubMed] [Google Scholar]
- Mckeown MJ, Makeig S, Brown GG, Jung TP, Kindermann SS, Bell AJ, Sejnowski TJ. Analysis of fMRI data by blind separation into independent spatial components. Hum Brain Mapp. 1998;6:160–188. doi: 10.1002/(SICI)1097-0193(1998)6:3<160::AID-HBM5>3.0.CO;2-1. [DOI] [PMC free article] [PubMed] [Google Scholar]
- Mennes M, Vega Potler N, Kelly C, Di Martino A, Castellanos FX, Milham MP. Resting State Functional Connectivity Correlates of Inhibitory Control in Children with Attention-Deficit/Hyperactivity Disorder. Front Psychiatry. 2012;2 doi: 10.3389/fpsyt.2011.00083. [DOI] [PMC free article] [PubMed] [Google Scholar]
- Milham MP. Open Neuroscience Solutions for the Connectome-wide Association Era. Neuron. 2012;73:214–218. doi: 10.1016/j.neuron.2011.11.004. [DOI] [PubMed] [Google Scholar]
- Minas C, Montana G. Distance-based analysis of variance: approximate inference and an application to genome-wide association studies. 2012 arXiv e-print No. 1205.2417. [Google Scholar]
- Moeller S, Yacoub E, Olman CA, Auerbach E, Strupp J, Harel N, Ugurbil K. Multiband Multislice GE-EPI at 7 Tesla, With 16-Fold Acceleration Using Partial Parallel Imaging With Application to High Spatial and Temporal Whole-Brain FMRI. Magn Reson Med Off J Soc Magn Reson Med Soc Magn Reson Med. 2010;63:1144–1153. doi: 10.1002/mrm.22361. [DOI] [PMC free article] [PubMed] [Google Scholar]
- Murphy K, Birn RM, Bandettini PA. Resting-state fMRI confounds and cleanup. NeuroImage. 2013;80:349–359. doi: 10.1016/j.neuroimage.2013.04.001. [DOI] [PMC free article] [PubMed] [Google Scholar]
- Murphy K, Birn RM, Handwerker DA, Jones TB, Bandettini PA. The impact of global signal regression on resting state correlations: Are anti-correlated networks introduced? NeuroImage. 2009;44:893–905. doi: 10.1016/j.neuroimage.2008.09.036. [DOI] [PMC free article] [PubMed] [Google Scholar]
- Nee DE, Wager TD, Jonides J. Interference resolution: Insights from a meta-analysis of neuroimaging tasks. Cogn Affect Behav Neurosci. 2007;7:1–17. doi: 10.3758/cabn.7.1.1. [DOI] [PubMed] [Google Scholar]
- Nooner KB, Colcombe SJ, Tobe RH, Mennes M, Benedict MM, Moreno AL, Panek LJ, Brown S, Zavitz ST, Li Q, Sikka S, Gutman D, Bangaru S, Schlachter RT, Kamiel SM, Anwar AR, Hinz CM, Kaplan MS, Rachlin AB, Adelsberg S, Cheung B, Khanuja R, Yan C, Craddock CC, Calhoun V, Courtney W, King M, Wood D, Cox CL, Kelly AMC, Di Martino A, Petkova E, Reiss PT, Duan N, Thomsen D, Biswal B, Coffey B, Hoptman MJ, Javitt DC, Pomara N, Sidtis JJ, Koplewicz HS, Castellanos FX, Leventhal BL, Milham MP. The NKI-Rockland Sample: A Model for Accelerating the Pace of Discovery Science in Psychiatry. Front Neurosci. 2012;6 doi: 10.3389/fnins.2012.00152. [DOI] [PMC free article] [PubMed] [Google Scholar]
- Norman KA, Polyn SM, Detre GJ, Haxby JV. Beyond mind-reading: multi-voxel pattern analysis of fMRI data. Trends Cogn Sci. 2006;10:424–430. doi: 10.1016/j.tics.2006.07.005. [DOI] [PubMed] [Google Scholar]
- Owen AM, McMillan KM, Laird AR, Bullmore E. N-back working memory paradigm: A meta-analysis of normative functional neuroimaging studies. Hum Brain Mapp. 2005;25:46–59. doi: 10.1002/hbm.20131. [DOI] [PMC free article] [PubMed] [Google Scholar]
- Patel RS, Bowman FD, Rilling JK. A Bayesian approach to determining connectivity of the human brain. Hum Brain Mapp. 2006;27:267–276. doi: 10.1002/hbm.20182. [DOI] [PMC free article] [PubMed] [Google Scholar]
- Potter DM. A permutation test for inference in logistic regression with small- and moderate-sized data sets. Stat Med. 2005;24:693–708. doi: 10.1002/sim.1931. [DOI] [PubMed] [Google Scholar]
- Power JD, Barnes KA, Snyder AZ, Schlaggar BL, Petersen SE. Spurious but systematic correlations in functional connectivity MRI networks arise from subject motion. NeuroImage. 2012;59:2142–2154. doi: 10.1016/j.neuroimage.2011.10.018. [DOI] [PMC free article] [PubMed] [Google Scholar]
- R Core Team. R: A Language and Environment for Statistical Computing. R Foundation for Statistical Computing; Vienna, Austria: 2013. [Google Scholar]
- Reiss PT, Stevens MHH, Shehzad Z, Petkova E, Milham MP. On Distance-Based Permutation Tests for Between-Group Comparisons. Biometrics. 2010;66:636–643. doi: 10.1111/j.1541-0420.2009.01300.x. [DOI] [PubMed] [Google Scholar]
- Rizzo ML, Székely GJ. DISCO analysis: A nonparametric extension of analysis of variance. Ann Appl Stat. 2010;4:1034–1055. [Google Scholar]
- Saad ZS, Reynolds RC, Jo HJ, Gotts SJ, Chen G, Martin A, Cox RW. Correcting Brain-Wide Correlation Differences in Resting-State FMRI. Brain Connect. 2013;3:339–352. doi: 10.1089/brain.2013.0156. [DOI] [PMC free article] [PubMed] [Google Scholar]
- Schork NJ, Wessel J, Malo N. DNA Sequence- Based Phenotypic Association Analysis. In: Rao DC, Charles Gu C, editors. Advances in Genetics, Genetic Dissection of Complex Traits. Academic Press; 2008. pp. 195–217. [DOI] [PubMed] [Google Scholar]
- Simmonds DJ, Pekar JJ, Mostofsky SH. Meta-analysis of Go/No-go tasks demonstrating that fMRI activation associated with response inhibition is task-dependent. Neuropsychologia. 2008;46:224–232. doi: 10.1016/j.neuropsychologia.2007.07.015. [DOI] [PMC free article] [PubMed] [Google Scholar]
- Sporns O. The human connectome: a complex network. Ann N Y Acad Sci. 2011;1224:109–125. doi: 10.1111/j.1749-6632.2010.05888.x. [DOI] [PubMed] [Google Scholar]
- Sporns O, Tononi G, Kötter R. The Human Connectome: A Structural Description of the Human Brain. PLoS Comput Biol. 2005;1:e42. doi: 10.1371/journal.pcbi.0010042. [DOI] [PMC free article] [PubMed] [Google Scholar]
- Trosset MW, Priebe CE, Park Y, Miller MI. Semisupervised learning from dissimilarity data. Comput Stat Data Anal. 2008;52:4643–4657. doi: 10.1016/j.csda.2008.02.030. [DOI] [PMC free article] [PubMed] [Google Scholar]
- Van Horn JD, Gazzaniga MS. Databasing fMRI studies — towards a “discovery science” of brain function. Nat Rev Neurosci. 2002;3:314–318. doi: 10.1038/nrn788. [DOI] [PubMed] [Google Scholar]
- Varoquaux G, Craddock RC. Learning and comparing functional connectomes across subjects. NeuroImage. 2013;80:405–415. doi: 10.1016/j.neuroimage.2013.04.007. [DOI] [PubMed] [Google Scholar]
- Worsley KJ, Chen JI, Lerch J, Evans AC. Comparing functional connectivity via thresholding correlations and singular value decomposition. Philos Trans R Soc B Biol Sci. 2005;360:913–920. doi: 10.1098/rstb.2005.1637. [DOI] [PMC free article] [PubMed] [Google Scholar]
- Xu J, Moeller S, Auerbach EJ, Strupp J, Smith SM, Feinberg DA, Yacoub E, Uğurbil K. Evaluation of slice accelerations using multiband echo planar imaging at 3 T. NeuroImage. 2013 doi: 10.1016/j.neuroimage.2013.07.055. [DOI] [PMC free article] [PubMed] [Google Scholar]
- Yan CG, Cheung B, Kelly C, Colcombe S, Craddock RC, Di Martino A, Li Q, Zuo XN, Castellanos FX, Milham MP. A comprehensive assessment of regional variation in the impact of head micromovements on functional connectomics. NeuroImage. 2013a;76:183–201. doi: 10.1016/j.neuroimage.2013.03.004. [DOI] [PMC free article] [PubMed] [Google Scholar]
- Yan CG, Craddock RC, Zuo XN, Zang YF, Milham MP. Standardizing the intrinsic brain: Towards robust measurement of inter-individual variation in 1000 functional connectomes. NeuroImage. 2013b;80:246–262. doi: 10.1016/j.neuroimage.2013.04.081. [DOI] [PMC free article] [PubMed] [Google Scholar]
- Yarkoni T, Poldrack RA, Nichols TE, Van Essen DC, Wager TD. Large-scale automated synthesis of human functional neuroimaging data. Nat Methods. 2011;8:665–670. doi: 10.1038/nmeth.1635. [DOI] [PMC free article] [PubMed] [Google Scholar]
- Yeo BTT, Krienen FM, Sepulcre J, Sabuncu MR, Lashkari D, Hollinshead M, Roffman JL, Smoller JW, Zöllei L, Polimeni JR, Fischl B, Liu H, Buckner RL. The organization of the human cerebral cortex estimated by intrinsic functional connectivity. J Neurophysiol. 2011;106:1125–1165. doi: 10.1152/jn.00338.2011. [DOI] [PMC free article] [PubMed] [Google Scholar]
- Zakharov S, Salim A, Thalamuthu A. Comparison of similarity-based tests and pooling strategies for rare variants. BMC Genomics. 2013;14:50. doi: 10.1186/1471-2164-14-50. [DOI] [PMC free article] [PubMed] [Google Scholar]
- Zalesky A, Fornito A, Bullmore ET. Network-based statistic: Identifying differences in brain networks. NeuroImage. 2010a;53:1197–1207. doi: 10.1016/j.neuroimage.2010.06.041. [DOI] [PubMed] [Google Scholar]
- Zalesky A, Fornito A, Harding IH, Cocchi L, Yücel M, Pantelis C, Bullmore ET. Whole-brain anatomical networks: Does the choice of nodes matter? NeuroImage. 2010b;50:970–983. doi: 10.1016/j.neuroimage.2009.12.027. [DOI] [PubMed] [Google Scholar]
- Zapala MA, Schork NJ. Multivariate regression analysis of distance matrices for testing associations between gene expression patterns and related variables. Proc Natl Acad Sci. 2006;103:19430–19435. doi: 10.1073/pnas.0609333103. [DOI] [PMC free article] [PubMed] [Google Scholar]
- Zapala MA, Schork NJ. Statistical Properties of Multivariate Distance Matrix Regression for High-Dimensional Data Analysis. Front Genet. 2012;3 doi: 10.3389/fgene.2012.00190. [DOI] [PMC free article] [PubMed] [Google Scholar]
- Zhu CZ, Zang YF, Cao QJ, Yan CG, He Y, Jiang TZ, Sui MQ, Wang YF. Fisher discriminative analysis of resting-state brain function for attention-deficit/hyperactivity disorder. NeuroImage. 2008;40:110–120. doi: 10.1016/j.neuroimage.2007.11.029. [DOI] [PubMed] [Google Scholar]
- Zuo XN, Ehmke R, Mennes M, Imperati D, Castellanos FX, Sporns O, Milham MP. Network Centrality in the Human Functional Connectome. Cereb Cortex. 2012;22:1862–1875. doi: 10.1093/cercor/bhr269. [DOI] [PubMed] [Google Scholar]
- Zuo XN, Kelly C, Martino AD, Mennes M, Margulies DS, Bangaru S, Grzadzinski R, Evans AC, Zang YF, Castellanos FX, Milham MP. Growing Together and Growing Apart: Regional and Sex Differences in the Lifespan Developmental Trajectories of Functional Homotopy. J Neurosci. 2010;30:15034–15043. doi: 10.1523/JNEUROSCI.2612-10.2010. [DOI] [PMC free article] [PubMed] [Google Scholar]
Associated Data
This section collects any data citations, data availability statements, or supplementary materials included in this article.
Supplementary Materials
Supplementary Figure 1. Power Estimation for MDMR-Based CWAS in the Study Sample.
Based upon simulation data, we calculate the true positive rate (i.e., proportion of significant voxels) as a function of the Cohen's d effect size (for group difference) and percentage of connections exhibiting a group difference (0, 10, 25, 50, 100%). The dotted black line indicates the proportion of individual connections associated with group when using univariate t-tests.
Supplementary Figure 2. Summarizing Inter-Individual Differences in Whole-Brain Connectivity
(a) At each voxel, the mean-adjusted variability (coefficient of variation [CV]) was computed for the distances between all possible pairs of participant connectivity maps. This measure of inter-individual differences in connectivity patterns was standardized (Z-Score) and displayed for Scans 1 and 2 where values in orange-red reflect greater variation and green-purple reflect lower variation in between participant connectivity patterns. (b) The reproducibility of inter-individual differences is displayed at each voxel as the consistency (Kendall's W) between the distances across participant connectivity maps for Scan 1 and Scan 2. (c) Scatter-plots comparing voxelwise values for consistency and coefficient of variation per scan. All inflated brains are rendered with the fsaverage (MNI305) standard brain using pysurfer.
Supplementary Figure 3. CWASusing Permutation-Based Cluster Correction
Significant connectome-wide associations for ADHD diagnosis (children with ADHD vs. typically developing controls), development (age), intelligence (scan 1), intelligence (scan 2), and L-DOPA administration (placebo vs. L-DOPA) are shown with p< 0.05 (permutation-based cluster-correction). These results are similar to those in Fig 3a and Fig 12a, which used GRF for cluster-correction.
Supplementary Figure 4. Comparison of MDMR Findings to Permutation-based Null Distribution
A null distribution with the number of permutations (total 15,000) on the y-axis with the associated percent of significant (p < 0.05, uncorrected) connectome-wide associations for IQ on the x-axis is shown for Scans 1 and 2. The dotted vertical line indicates the percent of significant associations from the real (non-permuted) data.
Supplementary Figure 5. Connectome-Wide Associations for Mean Connectivity
Significant connectome-wide associations for mean global connectivity (i.e., mean across all possible voxelwise functional connections) are shown with p< 0.05 (GRFcluster-corrected) for resting-state Scans 1 and 2.
Supplementary Figure 6. Effects of removing mean and global connectivity as well as motion
Significant connectome-wide associations related to development (age) are shown for different nuisance removal strategies. On the y-axis, MDMR results are displayed for the original analysis using CompCor (top), adding the mean connectivity at the group-level (middle), and removing the global signal at the individual level (bottom). On the x-axix, MDMR results are given for a model with age (left) and one with age that includes motion or mean FD as a covariate (right). The percentages shown indicate the percent of significant associations for that particular analysis. Surface results for the left hemisphere are only displayed.
Supplementary Figure 7. Connectome-Wide Associations for Motion
Significant connectome-wide associations related to motion in the development dataset are shown across the three nuisance removal strategies. Results are displayed for the original analysis using CompCor (top), adding the mean connectivity at the group-level (middle), and removing the global signal at the individual level (bottom). Percentages indicate the percent of significant associations for that particular analysis. Surface results for the left hemisphere are only displayed.
Supplementary Figure 8. Optimal Brain Resolution for CWAS
Significant connectome-wide associations for intelligence were conducted for several resolutions, including 25, 50, 100, 200, 400, 800, 1600, 3200, and 6400 units as well as the original voxelwise analyses with 15,615 units or voxels (x-axis). (a) Percent of significant associations with IQ was then calculated for each resolution (y-axis) and averaged across the two resting-state scans. (b) The overlap (dice coefficient) of significant associations between the two resting-state scans is shown (y-axis). (c) Finally, the percent of significant associations that overlap (dice) with the voxelwise results is shown for each parcellation and represents the average across the two resting-state scans.
Supplementary Figure 9. Theoretical Timing of the CWAS Approach
Expected computational time is shown when running (a) all the steps, (b) the initial connectivity computation, (c) the distance matrices, and (d) MDMR, while varying the number of voxels (x-axis) and number of subjects (y-axis).
Supplementary Figure 10. Comparison of Distance Measures
Significant connectome-wide associations related to IQ(p < 0.05, cluster-corrected) using 800 parcellation units are shown for seven distance measures from top to bottom: Pearson (Pear), Spearman (Spear), Kendall (Kend), Lin's Concordance (Conc), Euclidean (Eucl), and Chebyshev(Cheb).
Supplementary Figure 11. Empirical Timing of MDMR and Related Approaches
Computational time is shown for five approaches: degree centrality, GLM, MDMR, SVM with a linear kernel, and K-Means clustering (x-axis). For each approach, we calculated the average time across 100 iterations in milliseconds (y-axis) taken to measure the association between 10 connectivity maps (800 brain units) and a simulated dichotomous group variable (N = 100).