

Abstract
Objectives
BMI and waist circumference (WC) tend to be highly correlated, but changes in lifestyle behaviors may promote greater accumulation of abdominal fat for the same BMI in recent years. We examined secular shifts in BMI and WC distributions, and investigated whether WC for a given BMI has changed over time among Mexican-origin women in Mexico and the U.S., and in U.S. white women as a comparison.
Methods
Nationally-representative surveys for women aged 20-49 years from Mexico (1988, 1999, and 2012) (n=37116) and the US (1988-1994, 1999-2002, and 2007-2010) (n=6985) were used. Quantile regressions estimated age-adjusted changes in BMI and WC across years; linear regression tested changes in mean WC over time, adjusting for age and BMI.
Results
In all women, BMI and WC at most centiles increased over time. WC was also significantly higher over time for the same BMI, though the increase was largest in Mexican women. For example, WC was 6.7 cm (standard error (SE): 0.17, p<0.0001) higher in 2012 than in 1999 among Mexican women, holding age and BMI constant. Estimates were smaller in magnitude for Mexican-American and white women (~3 cm, p<0.01), even when comparing over a longer timeframe (1988-1994 to 2007-2010). In all groups, WC adjusted for BMI increased to a larger extent among younger cohorts.
Conclusion
WC for the same BMI has increased in Mexican-American, white, and Mexican women of reproductive age. These patterns may have implications for future cardio-metabolic burden in Mexico and the US.
Keywords: obesity, population, epidemiology, women, ethnicity
INTRODUCTION
Obesity is a global concern and is considered a major cause of insulin resistance and cardiovascular disease (CVD) (American Institute for Cancer Research 2007; Swinburn et al. 2011; Wang et al. 2011; Popkin et al. 2013; Malik et al. 2013). Although body mass index (BMI) is an incomplete measure of adiposity, globally, it is the most widely used indicator due to its practicality and ease of measurement (WHO 1995).
Waist circumference (WC) has been used as a measure of abdominal obesity because it is well-correlated with underlying visceral fat, and is highly associated with type 2 diabetes and inflammatory diseases (Ness-Abramof et al. 2008; Balkau et al. 2007). However, despite the appeal of WC as a good discriminator of individuals at high cardiovascular risk, it remains unclear whether it provides any additional information in cases where BMI is already available. Several reviews have summarized studies examining the superiority of BMI, WC, and other anthropometric indicators in the prediction of outcomes related to type 2 diabetes, CVD, and mortality (Vazquez et al. 2007; Qiao et al. 2010; Huxley et al. 2010; Lee et al. 2008). Many studies did not support the notion that one indicator is better than another in terms of its discriminatory capabilities. The reason for this is that BMI and WC tend to be highly correlated, and thus perform similarly in health risk prediction.
However there is increasing evidence that the relationship between BMI and WC is changing over time. For example, studies using data from Canada and China have shown that WC for a given level of BMI is higher in more recent years (Janssen et al. 2012; Popkin et al. 2013) If the same BMI is associated with different WC within the same population at different points in time, then what was true in the past about their interchangeability as predictors of health risk may not be true today.
Higher WC has been linked with increased sedentary activity and with diets high in sugar and energy dense foods (Tchernof et al. 2013). These changes in lifestyle behaviors may drive greater accumulation of abdominal fat for a given level of BMI, and thereby account for the secular change in the BMI-WC association. These same shifts in lifestyle behaviors have been observed in Mexican-origin populations both in Mexico and the U.S. (Medina et al. 2013; Barquera et al. 2013; Crespo et al. 2000; Fryar et al. 2012). However, although a high prevalence of obesity has been extensively documented, it is unknown whether this pattern has been accompanied by increases in WC over time for the same BMI in these populations. Using nationally-representative data among Mexican-origin reproductive aged women in Mexico and the U.S., and among U.S. white women as a comparison, we examined secular shifts in BMI and WC distributions, and investigated whether WC for a given BMI has changed over the past decade in each country. Mexican-origin individuals carry a disproportionate burden of type 2 diabetes and cardio-metabolic complications (Cowie et al. 2009; Villalpando et al 2010; Barquera et al. 2009; Flegal et al 2012; FAO 2013). Examining patterns among this high-risk ethnic population both in the country of origin, and in the country to which they migrate, may provide insight into the factors that underlie their high burden of chronic disease (Agyemang et al. 2012).
SUBJECTS AND METHODS
Data came from three nationally representative nutrition health surveys in Mexico and from the National Health and Nutrition Examination Surveys (NHANES) in the U.S. The Ensuesta Nacional de Nutricion (ENN) 1988, ENN 1999, and the Encuesta Nacional de Salud y Nutricion (ENSANUT) 2012 are cross-sectional, multi-stage, stratified, cluster sampling representative surveys conducted by Mexico’s Instituto Nacional de Nutricion (INSP) (National Institute of Public Health). The design and methods have been described elsewhere (Resano-Perez et al. 2003; Olaiz-Fernández et al. 2006; Romero-Martínez et al. 2013). Data collection was approved by Mexico’s National Institute of Public Health Internal Review Board and all participants gave informed consent. All surveys collected data on socio-economic and demographic family characteristics, acute and chronic morbidity, nutritional status and dietary intake in a set of subsamples. ENN 1988 and ENN 1999 included women of reproductive age (12-49 years) and their live children. ENSANUT 2012 included both men and women across a larger age distribution. Subjects for this investigation included non-pregnant women aged 20-49 years.
Data for the U.S. came from successive waves of the third National Health and Nutrition Examination Survey (NHANES) III (1988-1994), and the continuous NHANES (1999-2010). NHANES is a series of cross-sectional nationally representative health examination surveys beginning in 1960. In each survey, a nationally representative sample of the U.S. civilian non-institutionalized population was selected using a complex, stratified multi-stage probability cluster sampling design (CDC, 2013). NHANES III was conducted between 1988 and 1994; and was designed so that the entire six years was a national probability sample. In 1999, NHANES became a continuous survey, in which approximately 5,000 individuals of all ages completed the health examination component of the survey each year. The continuous surveys, a series of repeated cross-sections, are available in two-year blocks (e.g. 1999-2000, 2001-2002, etc.). There were two phases of data collection: in the first phase, researchers collected information from household interviews on demographics, socioeconomic indicators, past medical history, and health behaviors. In the second phase, participants were administered a physical examination in a mobile examination center. The National Center for Health Statistics ethics review board reviewed and approved the survey, and participants gave informed consent before participation.
To achieve sufficient sample sizes, we pooled NHANES data to represent the three time points that most closely corresponded to the years represented in the Mexican data: 1988-1994 (NHANES III), 1999-2002 (continuous NHANES), and 2007-2010 (continuous NHANES). We restricted the sample to adult, non-pregnant women aged 20-49 who self-identified as Mexican/Mexican-American or white.
In both the Mexico health surveys and NHANES, trained personnel used a standardized protocol to collect anthropometric measurements. Height was measured in centimeters while the participant stood without shoes, and weight was measured in kilograms while the participant stood without shoes and in light clothing. BMI was calculated as weight in kilograms over height in meters squared. WC was measured in centimeters at the midpoint between the bottom of the ribs and the top of the iliac crest. WC was not measured in the ENN 1988 survey, thus all analyses involving WC in Mexico included only the ENN 1999 and ENSANUT 2012 surveys. For descriptive purposes, BMI was used to classify participants as underweight, normal, overweight, obese, and severely obese (<18.5, 18.5–24.9, 25.0–29.9, 30.0–39.9, ≥ 40.0 kg/m2 respectively) (NHLBI 1998). WC ≥ 88 cm was used to classify participants as abdominally obese based on WHO criteria (Alberti et al. 1998). Data for the present analyses included females aged 20-49 years, excluding pregnant women, with measured data available on weight, height and WC yielding the following sample sizes across each of the surveys: ENN 1988 (n=10832), ENN 1999 (n=12530), ENSANUT 2012 (n=13754), NHANES III (n=1376 (Mexican-American), n=1454 (white)), NHANES 1999-2002 (n=747 (Mexican-American), n=1626 (white)), NHANES 2007-2010 (n=558 (Mexican-American), n=1224 (white)).
Analysis
Appropriate sampling weights were incorporated to produce national population estimates for Mexican-Americans and U.S. whites and for Mexican women in each survey period. Sampling weights accounted for unequal probabilities of selection, non-response, and non-coverage. All analyses were conducted using Stata software, version 12.1 (Stata Corp, College Station, Texas). The SVY module was used in all descriptive and linear regression analysis to account for the complex sampling design. To facilitate comparisons across survey years and across U.S. and Mexico data, descriptive estimates were age-standardized by the direct method to the year 2000 US Census population using the age groups 20-29 years, 30-39 years, and 40-49 years (Klein RJ et al. 2001).
In the first set of regression analyses, we used quantile regressions to evaluate whether BMI and WC values increased across survey years at pre-specified centiles of the sample distributions (5th, 50th, and 95th). All models were adjusted for age and age-squared (as continuous variables), and survey year (as a categorical variable). We compared BMI and WC values at each of the centiles across survey years and estimated standard errors using 1000 bootstrap replications. Statistical tests were 2-sided and a P value of less than 0.05 was considered statistically significant. Predicted values for BMI and WC at each of the centiles were calculated across survey years using model coefficients.
In a second set of analyses, we used linear regression to estimate mean difference in WC over time relative to BMI level, adjusting for age and survey year. We used graphical methods to evaluate linearity between WC and BMI and between WC and age. The relationship between WC and BMI was curvi-linear, thus we included a BMI-squared term in all models. To facilitate interpretation, age was centered to age 20 years, and BMI was centered at 25 kg/m2. We also investigated whether change in WC over time, adjusted for BMI, varied by age (categorized as 20-29 years, 30-39 years, and 40-49 years) or by BMI level. To do this, we tested interactions between age and survey year and between BMI and survey year. Since a higher WC over time for the same BMI could also be a function of increasing height, we also tested the robustness of our model results by adjusting for height in sensitivity analyses.
RESULTS
Age-adjusted mean weight, BMI, and WC increased over time among reproductive-aged women in Mexico, and among Mexican-Americans and whites in the U.S. (Table 1). Mean height also increased significantly, but only in Mexico and among U.S. white women. While Mexican-American women consistently had the highest mean BMI and WC relative to both white and Mexican women, over time, mean BMI and WC increased to the greatest extent among Mexican women. For example, mean WC increased by 9.2 cm from 1999 (82.1 cm) to 2012 (91.2 cm) among Mexican women; in the U.S., mean WC increased by about 4-5 cm in 2007-2010 compared to 1999-2002 for both Mexican-Americans and whites. Despite the large increase in mean WC among Mexican women, between 1999 and 2012, mean BMI only increased by 1.5 kg/m2 (1999: BMI=27.4 kg/m2; 2012: BMI=28.9 kg/m2). There were also considerable increases over time in obesity, severe obesity, and especially abdominal obesity in Mexican women.
Table 1.
Sample characteristics of reproductive aged Mexican, Mexican-American, and U.S. white females aged 20-49 years, Mexico 1988, 1999 and 2012 and U.S. NHANES 1988-1994, 1999-2002 and 2007-2010
| Mexico | U.S. NHANES | ||||||||
|---|---|---|---|---|---|---|---|---|---|
| 1988 | 1999 | 2012 | 1988-1994 | 1999-2002 | 2007-2010 | 1988-1994 | 1999-2002 | 2007-2010 | |
| Mexican-Americans | whites | ||||||||
| n | 10832 | 12530 | 13754 | 1376 | 747 | 558 | 1454 | 1626 | 1224 |
| Age, years | 32.4 (0.11) | 32.8 (0.12) | 34.0* (0.16) | 32.5 (0.27) | 32.6 (0.48) | 34.0* (0.46) | 34.5 (0.25) | 34.8 (0.70) | 35.5*(0.35) |
| Height (cm) | 153.1 (0.19) | 152.9 (0.13) | 154.2* (0.13) | 157.3 (0.21) | 158.3 (0.43) | 157.3 (0.25) | 163.8 (0.19) | 164.3 (0.27) | 164.8* (0.23) |
| Weight (kg) | 57.1 (0.26) | 64.0 (0.21) | 68.2* (0.27) | 70.2 (0.63) | 71.6 (0.75) | 73.2* (0.61) | 68.1 (0.53) | 71.4 (0.81) | 74.7* (0.78) |
| BMI (kg/m2) | 24.4 (0.09) | 27.4*(0.08) | 28.7* (0.10) | 28.4 (0.24) | 28.6 (0.40) | 29.5* (0.21) | 25.4 (0.20) | 26.4*(0.27) | 27.5*(0.28) |
| Obesity status | |||||||||
| Underweight: BMI < 18.5 kg/m2 |
7.4 | 1.5 | 1.4 | 1.4 | 1.5 | 0.55 | 4.3 | 3.2 | 3.6 |
| Normal: BMI 18.5- 24.9 kg/m2 |
53.8 | 33.9 | 26.4 | 32.1 | 32.5 | 26.3 | 55.4 | 49.0 | 41.7 |
| Overweight: BMI 25-29.9 kg/m2 |
27.7 | 37.2 | 35.3 | 31.2 | 31.9 | 31 | 20.1 | 24.4 | 26 |
| Obesity: BMI 30- 39.99 kg/m2 |
10.6 | 25.7 | 32.7 | 29.7 | 27.9 | 36.2 | 17 | 19.3 | 22.3 |
| Severe obesity: BMI ≥ 40 kg/m2 |
0.6 | 1.8 | 4.2 | 5.6 | 6.2 | 6 | 3.2 | 4.1 | 6.4 |
| Waist circumference (cm) |
n/a | 82.1 (0.19) | 91.2* (0.24) | 91.0 (0.57) | 91.7 (0.85) | 95.8* (0.61) | 84.5 (0.50) | 87.1*(0.66) | 91.9*(0.68) |
| Abdominal obesity (WC ≥ 88 cm) |
n/a | 28.1 | 56.5 | 56.5 | 55.7 | 66.7 | 32.4 | 40.9 | 51.4 |
BMI, body mass index; NHANES, National Health and Nutrition Examination Survey; WC, waist circumference
Estimates age-adjusted by the direct method to the year 2000 Census population using the age groups 20-29, 30-39, and 40-49
Data are means (standard errors) or %.
p<0.05, comparing means from later survey years to earliest survey year within ethnic groups
We next described changes in the distribution of BMI and WC over time in Mexico and the U.S. Predicted values at the 5th, 50th, and 95th centiles were calculated using model coefficients from quantile regression analyses and results are shown in Tables 2 (BMI) and 3 (WC) for a given Mexican, Mexican-American, and U.S. white woman at age 20 years. Among Mexican women, across all centiles, BMI values were statistically significantly higher in 2012 relative to 1988, though the magnitude of increase was largest at the 95th centile (+6.3 kg/m2, comparing survey years 2012 and 1988) (Table 2). Among Mexican-American and white women, although BMI was higher in successive years across most centiles, the magnitudes were smaller than they were for Mexican women. However both groups of U.S. women also started at higher BMI values in 1988-1994.
Table 2.
Predicted BMI (kg/m2) over time across centiles of the distribution, Mexican, Mexican-American, and U.S. white females aged 20 years
| 5th centile | 50th centile | 95th centile | |
|---|---|---|---|
| Mexico | |||
| 1988 | 16.1 | 20.5 | 28.3 |
| 1999 | 18.0 | 23.4 | 32.2 |
| 2012 | 18.7 | 24.5 | 34.6 |
| Difference (t1999-t1988) | 1.9* | 2.9* | 3.9* |
| Difference (t2012-t1999) | 0.7* | 1.1* | 2.3* |
| Difference (t2012-t1988) | 2.6* | 4.0* | 6.3* |
| United States | |||
| Mexican-Americans | |||
| 1988-1994 | 18.5 | 24.3 | 35.7 |
| 1999-2002 | 18.8 | 24.3 | 36.4 |
| 2007-2010 | 19.3 | 25.4 | 37.0 |
| Difference (t1999-t1988) | 0.3 | 0 | 0.7 |
| Difference (t2007-t1999) | 0.5 | 1.1† | 0.6 |
| Difference (t2007-t1988) | 0.8‡ | 1.1† | 1.3 |
| whites | |||
| 1988-1994 | 17.8 | 21.7 | 34.6 |
| 1999-2002 | 18.2 | 22.9 | 36.4 |
| 2007-2010 | 18.2 | 24.2 | 39.8 |
| Difference (t1999-t1988) | 0.4‡ | 1.2* | 1.8‡ |
| Difference (t2007-t1999) | 0 | 1.3* | 3.4† |
| Difference (t2007-t1988) | 0.4‡ | 2.5* | 5.2* |
Data are derived from the Mexican Health Surveys (Ensuesta Nacional de Nutricion (ENN) 1988, ENN 1999, and Encuesta Nacional de Salud y Nutricion (ENSANUT) 2012) and the U.S. National Health and Nutrition Examination Surveys (1988-1994; 1999-2002; 2007-2010). Sample includes adult, non-pregnant females aged 20-49 years.
All models adjust for age, age-squared, and survey year in quantile regression analyses.
Age centered at age 20 years
p<0.0001,
p<0.01,
p<0.05
Table 3.
Predicted waist circumference (cm) over time across centiles of the distribution, Mexican, Mexican-American, and U.S. white females aged 20 years
| 5th centile | 50th centile | 95th centile | |
|---|---|---|---|
| Mexico | |||
| 1999 | 59.6 | 73.2 | 94.7 |
| 2012 | 65.7 | 81.4 | 106.6 |
| Difference (t2012-t1999) | 6.1* | 8.2* | 11.9* |
| United States | |||
| Mexican-Americans | |||
| 1988-1994 | 66.1 | 83.8 | 105.6 |
| 1999-2002 | 66.8 | 84.8 | 107.5 |
| 2007-2010 | 69.5 | 87.9 | 113.6 |
| Difference (t1999-t1988) | 0.7 | 1.0 | 1.9 |
| Difference (t2007-t1999) | 2.7‡ | 3.1† | 6.1‡ |
| Difference (t2007-t1988) | 3.4† | 4.1* | 7.9† |
| whites | |||
| 1988-1994 | 65.0 | 74.5 | 107.1 |
| 1999-2002 | 66.9 | 78.1 | 107.8 |
| 2007-2010 | 68.2 | 82.7 | 118.5 |
| Difference (t1999-t1988) | 1.9* | 3.6* | 0.7 |
| Difference (t2007-t1999) | 1.3‡ | 4.6* | 10.7* |
| Difference (t2007-t1988) | 3.2* | 8.2* | 11.4* |
Data are derived from the Mexican Health Surveys (Ensuesta Nacional de Nutricion (ENN) 1999 and Encuesta Nacional de Salud y Nutricion (ENSANUT) 2012) and the U.S. National Health and Nutrition Examination Surveys (1988-1994; 1999-2002; 2007-2010). Sample includes adult, non-pregnant females aged 20-49 years. Waist circumference not measured in ENN 1988.
All models adjust for age, age-squared, and survey year in quantile regression analyses
Age centered at age 20 years.
p<0.0001,
p<0.01,
p<0.05
WC was statistically significantly higher over time across all centiles and across all three groups of women (Table 3). WC increased monotonically across the centiles, though the magnitude of increase was large even at the 5th centile for all women. Comparing across similar time frames (Mexico: 1999 to 2012; U.S.: 1999-2002 to 2007-2010), WC values at the 95th centile increased the most for Mexican women (+11.9 cm), followed by white (+10.7 cm) and Mexican-American women (+6.1 cm).
Table 4 presents results of linear regression models estimating mean difference in WC over time relative to BMI. The intercept represents the predicted WC for a woman aged 20 years with a BMI of 25 kg/m2 for the referent survey year (Mexico: ref=1999; U.S.: ref=1988-1994). Among Mexican women, the survey year coefficient indicates that WC was 6.7 cm higher in 2012 than in 1999, controlling for age and BMI. Patterns were similar, though smaller in magnitude for Mexican-American (β=2.72; standard error (SE)=0.37) and white women (β=2.91; SE=0.31), despite the longer time frame under study. Moreover, there was little difference in magnitude between Mexican-American and white women. Much of the increase in the U.S. was also more apparent during the period between 1999-2002 and 2007-2010 than between 1988-1994 and 1999-2002. Patterns were similar and remained statistically significant after adjustment for height in all models, though coefficients were slightly smaller after accounting for change in frame size over time (not shown).
Table 4.
Adjusted mean difference in waist circumference over time for age and BMI level, Mexican, Mexican-American, and U.S. white females aged 20-49 years.
| Mexico (n= 26284) | Mexican-Americans (n=2681) |
whites (n=4304) | |
|---|---|---|---|
| Coefficient (standard error) | |||
| Constant | 76.15 (0.20) | 83.64 (0.34) | 82.69 (0.33) |
| Age | 0.09 (0.01)* | 0.02 (0.02) | 0.098 (0.01)* |
| BMI | 1.98 (0.02)* | 2.34 (0.05)* | 2.27 (0.02)* |
| BMI-squared | -0.005 (0.002)† | -0.02 (0.005)* | -0.01 (0.003)* |
| Year | |||
| 1988-1994 | Ref | ref | |
| 1999-2002 | 0.71 (0.44) | 0.29 (0.39) | |
| 2007-2010 | 2.72 (0.37)* | 2.91 (0.31)* | |
| Year | |||
| 1999 | ref | ||
| 2012 | 6.66 (0.17)* | ||
Data are derived from the Mexican Health Surveys (Ensuesta Nacional de Nutricion (ENN) 1999 and Encuesta Nacional de Salud y Nutricion (ENSANUT) 2012) and the U.S. National Health and Nutrition Examination Surveys (1988-1994; 1999-2002; 2007-2010). Sample includes adult, non-pregnant females aged 20-49 years. Waist circumference not measured in ENN 1988.
All models adjusted for age, BMI, BMI-squared, and survey year in weighted linear regression analyses.
Age centered to age 20 years; BMI centered to BMI=25 kg/m2
p<0.0001,
p<0.01
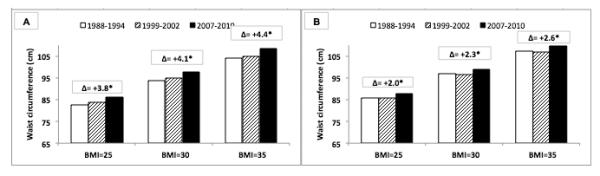
There were statistically significant interactions between age (categorized as 20-29, 30-39 and 40-49 years) and survey year for all three subpopulations of women and between BMI and survey year among Mexican women. To facilitate interpretation, predicted values for WC were computed from coefficients in models that included these interaction terms. Results are presented stratified by each of the subpopulations in Figures 1-3. Although WC adjusted for BMI was higher among women of all ages and BMI levels, in Mexico, the magnitude was significantly larger in younger women (Figures 1A and 1B). For example, at age 20-29 years and BMI=35, WC was 9.1 cm higher in 2012 (predicted WC=103.6 cm) than in 1999, whereas among 40-49 year olds, the corresponding difference was 8.0 cm. Although estimates were slightly smaller after accounting for the taller height of younger cohorts in more recent years, there was still evidence of larger, statistically significant increases in WC among younger women relative to older women (not shown). Across all ages, WC increased from 1999 to 2012 to a greater extent among women with higher BMI levels (BMI*survey year interaction: p-value <0.0001). Analogously, this interaction also indicates that a one unit increase in BMI was associated with even larger increases in WC in 2012 compared to 1999. Among U.S. women, patterns were similar though smaller in magnitude for both Mexican-Americans and whites (Figures 2 and 3). There was also no evidence of a statistically significant interaction between BMI and survey year. Nevertheless, despite smaller increases in WC over time for a given BMI than those found for Mexican women, even at a BMI of 25 kg/m2, the WC of both Mexican-American and U.S. white women was just under the 88 cm cutoff for abdominal obesity by 2007-2010.
Figure 1.

Predicted mean WC (cm) by BMI (kg/m2) in 2012 compared to 1999 using linear regression, Mexican females. A) Aged 20-29 years; B) Aged 40-49 years. Data are derived from the Mexican Health Surveys (Ensuesta Nacional de Nutricion (ENN) 1999 and Encuesta Nacional de Salud y Nutricion (ENSANUT) 2012). Panels A and B show results from single linear regression model that includes: age (categorized: 20-29, 30-39 40-49 years), BMI (continuous), BMI-squared, year, age*year, BMI*year, BMI-squared*year. For brevity, results among females aged 30-39 years omitted from figures. Age*time interaction: p<0.0001; BMI*time interaction: p<0.0001. *p<0.05, compares survey years 2012 to 1999.
Figure 3.
Predicted mean WC (cm) by BMI (kg/m2) in 2007-2010 compared to 1988-1994 using linear regression, U.S. white females. A) Aged 20-29 years; B) Aged 40-49 years. Data are derived from the U.S. National Health and Nutrition Examination Surveys (1988-1994; 1999-2002; 2007-2010). Panels A and B show results from single linear regression model that includes: age (categorized: 20-29, 30-39 40-49 years), BMI (continuous), BMI-squared, year, age*year, BMI*year, BMI-squared*year. For brevity, results among females aged 30-39 years omitted from figures. Age*time interaction: p<0.0001. *p<0.05, compares survey years 2007-2010 to 1988-1994.
Figure 2.

Predicted mean WC (cm) by BMI (kg/m2) in 2007-2010 compared to 1988-1994 using linear regression, Mexican-American females. A) Aged 20-29 years; B) Aged 40-49 years. Data are derived from the U.S. National Health and Nutrition Examination Surveys (1988-1994; 1999-2002; 2007-2010). Panels A and B show results from single linear regression model that includes: age (categorized: 20-29, 30-39 40-49 years), BMI (continuous), BMI-squared, year, age*year, BMI*year, BMI-squared*year. For brevity, results among females aged 30-39 years omitted from figures. Age*time interaction: p<0.0001. *p<0.05, compares survey years 2007-2010 to 1988-1994.
DISCUSSION
Using nationally-representative data from the U.S. and Mexico, our results indicated that BMI and WC were higher over time across all centiles of the sample distribution for Mexican women of reproductive age. These patterns were also evident, but to a smaller extent, among Mexican-American, and U.S. white women, and were more pronounced for WC than for BMI. Another key finding was that the same level of BMI corresponded to a higher mean WC in more recent years, providing evidence of a secular change in the association between BMI and WC. This pattern extended to all three subpopulations of women and was largest in magnitude among younger women, suggesting an important cohort effect with the potential for long-term cardio-metabolic complications for this segment of the population. Nevertheless, Mexican women appeared to have the largest secular increases in WC for a given BMI level, despite the shorter time period evaluated. Moreover, among only Mexican women, there was evidence that a unit increase in BMI corresponded to even larger increases in WC in more recent years.
These findings are consistent with a few recent studies that have documented a pattern of increasing WC for BMI in other countries. Janssen et al. showed that Canadian children and adults had a higher WC in 2007-2009 than similarly aged Canadians with the same BMI in 1981 (Janssen et al. 2012). In other work, Popkin and Slining documented WC increases of 2-4 cm for the same BMI over an 18 year period in China (Popkin et al. 2013). There is also evidence among U.S. adults that WC has increased more quickly than BMI, and that WC was higher between 1988-1994 and 2003-2004 across various categories of BMI (Li et al. 2007). Taken together, these results suggest that, in addition to rising BMI, an emerging global concern may be a shift to increasing abdominal adiposity – indicated by higher WC – for a given BMI.
Body fat, particularly when abdominally deposited, has been associated with type 2 diabetes and increased risk of CVD (Balkau et al. 2007). Although the physiological mechanism linking abdominal fat to CVD risk remains a subject of much research, visceral adipocytes are thought to be hormonally active, secreting inflammatory mediators that play a role in insulin resistance and endothelial dysfunction (Tchernof et al. 2013). In reproductive-aged women, abdominal obesity imposes additional burdens. Excess abdominal fat in pregnant women has been linked to gestational diabetes and other maternal/fetal complications. Research also suggests that the offspring of mothers with excess abdominal fat may be vulnerable to obesity and type 2 diabetes later in life (Leddy et al. 2008). Thus, the patterns we describe among reproductive aged women in the U.S. and Mexico may also have cardio-metabolic implications for future generations. Nonetheless, further research will be necessary to characterize the potential health implications of a higher mean WC for the same BMI, since WC does not distinguish between subcutaneous and visceral fat, the latter of which has been more closely linked to cardio-metabolic risk (Liu et al. 2010).
Our findings have important implications for the debate regarding the utility of WC for assessing CVD risk when BMI is already available. Several reviews have concluded that WC adds no additional information beyond BMI, since the two measures tend to be highly correlated (Vazquez et al. 2007; Qiao et al. 2010; Huxley et al. 2010). However, our results, and those of previous studies (Janssen et al. 2012; Popkin et al. 2013), show that the relationship between BMI and WC has been changing over time. For example in Mexico, in 1999, a BMI at the threshold for overweight (25 kg/m2) equated to a mean WC of approximately 76 cm. In 2012, that same BMI was associated with a WC of almost 83 cm, which is above the 80 cm female cutoff for abdominal obesity recommended by the International Diabetes Federation (Alberti et al. 2009), and the cutoff adopted by Mexico. Our U.S. data also indicated that in 2007-2010, a BMI of 25 kg/m2 corresponded to a mean WC that was approaching the 88 cm threshold used in the U.S. to define for abdominal obesity. If WC for BMI continues to increase at the same pace, even BMI values within the ‘normal’ range could potentially be associated with WC values that exceed thresholds for abdominal obesity. Assuming these WC cutoffs are clinically meaningful, then relying on BMI alone may underestimate future cardiovascular risk in populations where patterns of increasing WC for BMI are most prominent.
There are likely to be many reasons underlying the patterns we describe. Increases in energy intake and excessive consumption of fructose accompanied by an increasing tendency toward sedentary behavior potentially contribute to these trends (Stanhope et al. 2008; Romaguera et al. 2010; Ismail et al. 2012; Stanhope 2012). In the U.S., these changes to diet and activity have been extensively documented (Reedy et al. 2010; Krebs-Smith et al. 2010; Ng et al. 2012). In Mexico and in other countries experiencing economic development, similar changes have been noted, but at greater speeds and in earlier stages of development (Rivera et al. 2006; Popkin et al. 2004). This rapid shift in lifestyle behaviors may explain why WC relative to BMI increased to such a considerable extent in Mexican women. Other factors that promote the accumulation of abdominal fat include hormonal changes, increased stress, and genetic susceptibility (Tchernof et al. 2013). Some populations are thought to be more vulnerable to abdominal fat deposition especially in the context of unhealthy lifestyle behaviors and the environments that promote them. Ethnic differences in health risks for the same BMI have been previously noted (Diaz et al. 2007; Colin Bell et al. 2002; Zhang et al. 2009), as have ethnic differences in the components of body composition (Wells 2012; Deurenberg et al. 2002; Deurenberg-Yap et al. 2002). For example, Mexican-Americans have been shown to have a persistently higher prevalence of diabetes relative to whites, even after adjustment for BMI (Zhang et al. 2009). A greater tendency towards abdominal fat deposition among Mexican-origin individuals is one mechanism thought to underlie this pattern. However, we observed a similar pattern of increasing WC for BMI over time in both Mexican-American and white women. These findings suggest that there may be environmental factors contributing to changes in the BMI-WC association; future research will be necessary to fully identify contributing factors.
Our study had several strengths. First, our data are nationally representative of the U.S. and Mexico, and span a long period of time; the patterns we report are the patterns that were actually experienced by the populations in these countries over recent decades. Second, our anthropometric indicators were clinically measured, and so are not vulnerable to the kinds of validity and reliability problems inherent to self-reported measures. Along these lines, we also had WC measurements on a sufficiently large sample of women which is an advantage as WC is often not collected in many country-level health surveys.
There were also limitations. We only had reliable BMI and WC data over time on women of reproductive age in Mexico, precluding analyses among men or among women of other age groups. In the Mexico surveys, we also did not have data on other measures of body composition which may be more sensitive to adiposity such total body fat, % body fat, or skinfold thickness. Future studies should consider using other body composition measures if available. Although NHANES data is intended to be nationally representative, it is unclear how representative it is of all Mexican-Americans. The undocumented are estimated to constitute more than half of the Mexican immigrant population in the U.S. (Pew Hispanic Center 2011), and NHANES likely misses a large fraction of this important subgroup. Studies have also shown that immigrants regardless of status are under-represented in health surveys (Carlsson et al. 2006; Livingston et al. 1997), and subjects who do participate tend to be healthier than non-participants (Jacomb et al. 2002; Ohlson et al. 1985). If this is the case, our results may be underestimating the degree of change in WC for BMI, particularly in Mexican-Americans.
In summary, we documented a trend of increasing mean WC for a given level of BMI among Mexican-American and white women in the U.S., and among women in Mexico. This pattern was more pronounced among younger cohorts and among women in Mexico more generally. Future research will be needed to evaluate the implications for future cardiovascular risk in Mexico and the U.S., and for future generations given the risks to women of reproductive age. Research to understand the determinants of increasing WC for the same BMI will also be needed.
Acknowledgments
Funding: This research received support from the Population Research Training grant (T32 HD007168) and the Population Research Infrastructure Program (R24 HD050924) awarded to the Carolina Population Center at The University of North Carolina at Chapel Hill by the Eunice Kennedy Shriver National Institute of Child Health and Human Development.
Footnotes
Declaration of interest: The authors declare no conflict of interest.
REFERENCES
- Agyemang C, de-Graft Aikins A, Bhopal R. Ethnicity and cardiovascular health research: pushing the boundaries by including comparison populations in the countries of origin. Ethn Health. 2012;17:579–96. doi: 10.1080/13557858.2012.730607. [DOI] [PubMed] [Google Scholar]
- American Institute for Cancer Research (AICR) World Cancer Research Fund . Food, Nutrition, Physical Activity, and the Prevention of Cancer: a Global Perspective. AICR; Washington DC: 2007. [Google Scholar]
- Alberti KG, Eckel RH, Grundy SM, Zimmet PZ, Cleeman JI, Donato KA, Fruchart JC, James WP, Loria CM, Smith SC. Harmonizing the metabolic syndrome: a joint interim statement of the International Diabetes Federation Task Force on Epidemiology and Prevention; National Heart, Lung, and Blood Institute; American Heart Association; World Heart Federation; International Atherosclerosis Society; and International Association for the Study of Obesity. Circulation. 2009;120:1640–5. doi: 10.1161/CIRCULATIONAHA.109.192644. [DOI] [PubMed] [Google Scholar]
- Alberti KG, Zimmet PZ. Definition, diagnosis and classification of diabetes mellitus and its complications. Part 1: diagnosis and classification of diabetes mellitus provisional report of a WHO consultation. Diabet Med. 1998;15:539–53. doi: 10.1002/(SICI)1096-9136(199807)15:7<539::AID-DIA668>3.0.CO;2-S. [DOI] [PubMed] [Google Scholar]
- Balkau B, Deanfield JE, Despres JP, Bassand JP, Fox KA, Smith SC, Barter P, Tan CE, Van Gaal L, Wittchen HU, Massien C, Haffner SM. International Day for the Evaluation of Abdominal Obesity (IDEA): a study of waist circumference, cardiovascular disease, and diabetes mellitus in 168,000 primary care patients in 63 countries. Circulation. 2007;116:1942–51. doi: 10.1161/CIRCULATIONAHA.106.676379. [DOI] [PMC free article] [PubMed] [Google Scholar]
- Barquera S, Campos-Nonato I, Hernandez-Barrera L, Flores M, Durazo-Arvizu R, Kanter R, Rivera JA. Obesity and central adiposity in Mexican adults: results from the Mexican National Health and Nutrition Survey 2006. Salud Publica Mex. 2009;51(Suppl 4):S595–603. doi: 10.1590/s0036-36342009001000014. [DOI] [PubMed] [Google Scholar]
- Barquera S, Campos I, Rivera JA. Mexico attempts to tackle obesity: the process, results, push backs and future challenges. Obes Rev. 2013;14(Suppl 2):69–78. doi: 10.1111/obr.12096. [DOI] [PubMed] [Google Scholar]
- Carlsson F, Merlo J, Lindstrom M, Ostergren PO, Lithman T. Representativity of a postal public health questionnaire survey in Sweden, with special reference to ethnic differences in participation. Scand J Public Health. 2006;34:132–9. doi: 10.1080/14034940510032284. [DOI] [PubMed] [Google Scholar]
- Centers for Disease Control and Prevention (CDC) [accessed July 1, 2013];National Health and Nutrition Examination Survey. Website: http://www.cdc.gov/nchs/nhanes.htm.
- Colin Bell A, Adair LS, Popkin BM. Ethnic differences in the association between body mass index and hypertension. Am J Epidemiol. 2002;155:346–53. doi: 10.1093/aje/155.4.346. [DOI] [PubMed] [Google Scholar]
- Cowie CC, Rust KF, Ford ES, Eberhardt MS, Byrd-Holt DD, Li C, Williams DR, Gregg EW, Bainbridge KE, Saydah SH, Geiss LS. Full accounting of diabetes and pre-diabetes in the U.S. population in 1988-1994 and 2005-2006. Diabetes Care. 2009;32:287–94. doi: 10.2337/dc08-1296. [DOI] [PMC free article] [PubMed] [Google Scholar]
- Crespo CJ, Smit E, Andersen RE, Carter-Pokras O, Ainsworth BE. Race/ethnicity, social class and their relation to physical inactivity during leisure time: results from the Third National Health and Nutrition Examination Survey, 1988-1994. Am J Prev Med. 2000;18:46–53. doi: 10.1016/s0749-3797(99)00105-1. [DOI] [PubMed] [Google Scholar]
- Deurenberg-Yap M, Chew SK, Deurenberg P. Elevated body fat percentage and cardiovascular risks at low body mass index levels among Singaporean Chinese, Malays and Indians. Obes Rev. 2002;3:209–15. doi: 10.1046/j.1467-789x.2002.00069.x. [DOI] [PubMed] [Google Scholar]
- Deurenberg P, Deurenberg-Yap M, Guricci S. Asians are different from Caucasians and from each other in their body mass index/body fat per cent relationship. Obes Rev. 2002;3:141–6. doi: 10.1046/j.1467-789x.2002.00065.x. [DOI] [PubMed] [Google Scholar]
- Diaz VA, Mainous AG, 3rd, Baker R, Carnemolla M, Majeed A. How does ethnicity affect the association between obesity and diabetes? Diabet Med. 2007;24:1199–204. doi: 10.1111/j.1464-5491.2007.02244.x. [DOI] [PubMed] [Google Scholar]
- Flegal KM, Carroll MD, Kit BK, Ogden CL. Prevalence of obesity and trends in the distribution of body mass index among US adults, 1999-2010. Jama. 2012;307:491–7. doi: 10.1001/jama.2012.39. [DOI] [PubMed] [Google Scholar]
- Food and Agricultural Organization of the United Nations (FAO) The State of Food and Agriculture: Food Systems for a Better Nutrition. 2013.
- Fryar CD, Wright JD, Eberhardt MS, Dye BA. Trends in nutrient intakes and chronic health conditions among Mexican-American adults, a 25-year profile: United States, 1982-2006. Natl Health Stat Report. 2012:1–20. [PubMed] [Google Scholar]
- Huxley R, Mendis S, Zheleznyakov E, Reddy S, Chan J. Body mass index, waist circumference and waist:hip ratio as predictors of cardiovascular risk--a review of the literature. Eur J Clin Nutr. 2010;64:16–22. doi: 10.1038/ejcn.2009.68. [DOI] [PubMed] [Google Scholar]
- Ismail I, Keating SE, Baker MK, Johnson NA. A systematic review and meta-analysis of the effect of aerobic vs. resistance exercise training on visceral fat. Obes Rev. 2012;13:68–91. doi: 10.1111/j.1467-789X.2011.00931.x. [DOI] [PubMed] [Google Scholar]
- Jacomb PA, Jorm AF, Korten AE, Christensen H, Henderson AS. Predictors of refusal to participate: a longitudinal health survey of the elderly in Australia. BMC Public Health. 2002;2:4. doi: 10.1186/1471-2458-2-4. [DOI] [PMC free article] [PubMed] [Google Scholar]
- Janssen I, Shields M, Craig CL, Tremblay MS. Changes in the obesity phenotype within Canadian children and adults, 1981 to 2007-2009. Obesity (Silver Spring) 2012;20:916–9. doi: 10.1038/oby.2011.122. [DOI] [PubMed] [Google Scholar]
- Klein RJ, Schoenborn CA. Age adjustment using the 2000 projected U.S. population. National Center for Health Statistics; Hyattsville, MD: 2001. [Google Scholar]
- Krebs-Smith SM, Guenther PM, Subar AF, Kirkpatrick SI, Dodd KW. Americans do not meet federal dietary recommendations. J Nutr. 2010;140:1832–8. doi: 10.3945/jn.110.124826. [DOI] [PMC free article] [PubMed] [Google Scholar]
- Leddy MA, Power ML, Schulkin J. The impact of maternal obesity on maternal and fetal health. Rev Obstet Gynecol. 2008;1:170–8. [PMC free article] [PubMed] [Google Scholar]
- Lee CM, Huxley RR, Wildman RP, Woodward M. Indices of abdominal obesity are better discriminators of cardiovascular risk factors than BMI: a meta-analysis. J Clin Epidemiol. 2008;61:646–53. doi: 10.1016/j.jclinepi.2007.08.012. [DOI] [PubMed] [Google Scholar]
- Li C, Ford ES, McGuire LC, Mokdad AH. Increasing trends in waist circumference and abdominal obesity among US adults. Obesity (Silver Spring) 2007;15:216–24. doi: 10.1038/oby.2007.505. [DOI] [PubMed] [Google Scholar]
- Liu J, Fox CS, Hickson DA, May WD, Hairston KG, Carr JJ, Taylor HA. Impact of abdominal visceral and subcutaneous adipose tissue on cardiometabolic risk factors: the Jackson Heart Study. J Clin Endocrinol Metab. 2010;95:5419–26. doi: 10.1210/jc.2010-1378. [DOI] [PMC free article] [PubMed] [Google Scholar]
- Livingston PM, Lee SE, McCarty CA, Taylor HR. A comparison of participants with non-participants in a population-based epidemiologic study: the Melbourne Visual Impairment Project. Ophthalmic Epidemiol. 1997;4:73–81. doi: 10.3109/09286589709057099. [DOI] [PubMed] [Google Scholar]
- Malik VS, Willett WC, Hu FB. Global obesity: trends, risk factors and policy implications. Nat Rev Endocrinol. 2013;9:13–27. doi: 10.1038/nrendo.2012.199. [DOI] [PubMed] [Google Scholar]
- Medina C, Janssen I, Campos I, Barquera S. Physical inactivity prevalence and trends among Mexican adults: results from the National Health and Nutrition Survey (ENSANUT) 2006 and 2012. BMC Public Health. 2013;13:1063. doi: 10.1186/1471-2458-13-1063. [DOI] [PMC free article] [PubMed] [Google Scholar]
- National Heart, Lung, and Blood Institute (NHLBI) Clinical guidelines on the identification, evaluation, and treatment of overweight and obesity in adults: executive summary. Expert Panel on the Identification, Evaluation, and Treatment of Overweight in Adults. Am J Clin Nutr. 1998;68(4):899–917. doi: 10.1093/ajcn/68.4.899. [DOI] [PubMed] [Google Scholar]
- Ness-Abramof R, Apovian CM. Waist circumference measurement in clinical practice. Nutr Clin Pract. 2008;23:397–404. doi: 10.1177/0884533608321700. [DOI] [PubMed] [Google Scholar]
- Ng SW, Popkin BM. Time use and physical activity: a shift away from movement across the globe. Obes Rev. 2012;13:659–80. doi: 10.1111/j.1467-789X.2011.00982.x. [DOI] [PMC free article] [PubMed] [Google Scholar]
- Ohlson CG, Ydreborg B. Participants and non-participants of different categories in a health survey. A cross-sectional register study. Scand J Soc Med. 1985;13:67–74. doi: 10.1177/140349488501300203. [DOI] [PubMed] [Google Scholar]
- Olaiz-Fernández G, Rivera-Dommarco J, Shamah-Levy T, Rojas R, Villalpando-Hernández S, Hernández-Ávila M, Sepulveda-Amor J. Encuesta Nacional de Salud y Nutrición 2006. Instituto Nacional de Salud Pública; Cuernavaca, México: 2006. [Google Scholar]
- Pew Hispanic Center . The Mexican-American Boom: Births Overtake Immigration. Washington, D.C.: 2011. [Google Scholar]
- Popkin BM, Gordon-Larsen P. The nutrition transition: worldwide obesity dynamics and their determinants. Int J Obes Relat Metab Disord. 2004;28(Suppl 3):S2–9. doi: 10.1038/sj.ijo.0802804. [DOI] [PubMed] [Google Scholar]
- Popkin BM, Slining MM. New Dynamics in Global Obesity Facing Low- and Middle-Income Countries. Obes Rev. 2013:14. doi: 10.1111/obr.12102. [DOI] [PMC free article] [PubMed] [Google Scholar]
- Qiao Q, Nyamdorj R. Is the association of type II diabetes with waist circumference or waist-to-hip ratio stronger than that with body mass index? Eur J Clin Nutr. 2010;64:30–4. doi: 10.1038/ejcn.2009.93. [DOI] [PubMed] [Google Scholar]
- Reedy J, Krebs-Smith SM. Dietary sources of energy, solid fats, and added sugars among children and adolescents in the United States. J Am Diet Assoc. 2010;110:1477–84. doi: 10.1016/j.jada.2010.07.010. [DOI] [PMC free article] [PubMed] [Google Scholar]
- Resano-Perez E, Mendez-Ramirez I, Shamah-Levy T, Rivera JA, Sepulveda-Amor J. Methods of the National Nutrition Survey 1999. Salud Publica Mex. 2003;45(Suppl 4):S558–64. doi: 10.1590/s0036-36342003001000012. [DOI] [PubMed] [Google Scholar]
- Rivera JA, Barquera S, Campirano F, Campos I, Safdie M, Tovar V. Epidemiological and nutritional transition in Mexico: rapid increase of non-communicable chronic diseases and obesity. Public Health Nutrition. 2006;5:113–122. doi: 10.1079/PHN2001282. [DOI] [PubMed] [Google Scholar]
- Romero-Martínez M, Shamah-Levy T, Franco-Núñez A, Villalpando S, Cuevas-Nasu L, Gutiérrez JP, Rivera-Dommarco JA. Encuesta Nacional de Salud y Nutrición 2012: diseño y cobertura. Salud Publica Mex. 2013;55:S332–S340. [PubMed] [Google Scholar]
- Romaguera D, Angquist L, Du H, Jakobsen MU, Forouhi NG, Halkjaer J, Feskens EJ, van der A DL, Masala G, Steffen A, Palli D, Wareham NJ, Overvad K, Tjonneland A, Boeing H, Riboli E, Sorensen TI. Dietary determinants of changes in waist circumference adjusted for body mass index - a proxy measure of visceral adiposity. PloS One. 2010;5:e11588. doi: 10.1371/journal.pone.0011588. [DOI] [PMC free article] [PubMed] [Google Scholar]
- Stanhope KL. Role of fructose-containing sugars in the epidemics of obesity and metabolic syndrome. Annu Rev Med. 2012;63:329–43. doi: 10.1146/annurev-med-042010-113026. [DOI] [PubMed] [Google Scholar]
- Stanhope KL, Havel PJ. Endocrine and metabolic effects of consuming beverages sweetened with fructose, glucose, sucrose, or high-fructose corn syrup. Am J Clin Nutr. 2008;88:1733S–1737S. doi: 10.3945/ajcn.2008.25825D. [DOI] [PMC free article] [PubMed] [Google Scholar]
- Swinburn BA, Sacks G, Hall KD, McPherson K, Finegood DT, Moodie ML, Gortmaker SL. The global obesity pandemic: shaped by global drivers and local environments. Lancet. 2011;378:804–14. doi: 10.1016/S0140-6736(11)60813-1. [DOI] [PubMed] [Google Scholar]
- Tchernof A, Despres JP. Pathophysiology of human visceral obesity: an update. Physiol Rev. 2013;93:359–404. doi: 10.1152/physrev.00033.2011. [DOI] [PubMed] [Google Scholar]
- Vazquez G, Duval S, Jacobs DR, Jr., Silventoinen K. Comparison of body mass index, waist circumference, and waist/hip ratio in predicting incident diabetes: a meta-analysis. Epidemiol Rev. 2007;29:115–28. doi: 10.1093/epirev/mxm008. [DOI] [PubMed] [Google Scholar]
- Villalpando S, Shamah-Levy T, Rojas R, Aguilar-Salinas CA. Trends for type 2 diabetes and other cardiovascular risk factors in Mexico from 1993-2006. Salud Publica Mex. 2010;52(Suppl 1):S72–9. doi: 10.1590/s0036-36342010000700011. [DOI] [PubMed] [Google Scholar]
- Wang YC, McPherson K, Marsh T, Gortmaker SL, Brown M. Health and economic burden of the projected obesity trends in the USA and the UK. Lancet. 2011;378:815–25. doi: 10.1016/S0140-6736(11)60814-3. [DOI] [PubMed] [Google Scholar]
- World Health Organization (WHO) Physical status: the use and interpretation of anthropometry - Report of a WHO Expert Committee. Geneva: 1995. [PubMed] [Google Scholar]
- Wells JC. Ethnic variability in adiposity, thrifty phenotypes and cardiometabolic risk: addressing the full range of ethnicity, including those of mixed ethnicity. Obes Rev. 2012;13(Suppl 2):14–29. doi: 10.1111/j.1467-789X.2012.01034.x. [DOI] [PubMed] [Google Scholar]
- Zhang Q, Wang Y, Huang ES. Changes in racial/ethnic disparities in the prevalence of Type 2 diabetes by obesity level among US adults. Ethn Health. 2009;14:439–57. doi: 10.1080/13557850802699155. [DOI] [PMC free article] [PubMed] [Google Scholar]