

Abstract
Single nucleotide polymorphisms (SNPs) within the ADCY5 gene, encoding adenylate cyclase 5, are associated with elevated fasting glucose and increased type 2 diabetes (T2D) risk. Despite this, the mechanisms underlying the effects of these polymorphic variants at the level of pancreatic β-cells remain unclear. Here, we show firstly that ADCY5 mRNA expression in islets is lowered by the possession of risk alleles at rs11708067. Next, we demonstrate that ADCY5 is indispensable for coupling glucose, but not GLP-1, to insulin secretion in human islets. Assessed by in situ imaging of recombinant probes, ADCY5 silencing impaired glucose-induced cAMP increases and blocked glucose metabolism toward ATP at concentrations of the sugar >8 mmol/L. However, calcium transient generation and functional connectivity between individual human β-cells were sharply inhibited at all glucose concentrations tested, implying additional, metabolism-independent roles for ADCY5. In contrast, calcium rises were unaffected in ADCY5-depleted islets exposed to GLP-1. Alterations in β-cell ADCY5 expression and impaired glucose signaling thus provide a likely route through which ADCY5 gene polymorphisms influence fasting glucose levels and T2D risk, while exerting more minor effects on incretin action.
Introduction
Type 2 diabetes (T2D) is one of the foremost health challenges currently facing developed societies. This metabolic disease, which affects ∼8.3% of the adult population worldwide (1), usually reflects a failure of the β-cell mass to adapt output to increased peripheral insulin resistance. The resulting hyperglycemia and dyslipidemia lead to debilitating complications, ranging from kidney failure and blindness to cardiovascular disease and cancer (2). Although the maintenance of an adequate functional β-cell mass is critical for avoiding the development of diabetes (3), the molecular basis of β-cell failure is still poorly understood (4).
The mechanisms underlying glucose-stimulated insulin secretion from single β-cells involve uptake of the sugar via specific glucose transporters (5), enhanced ATP synthesis (6), and closure of ATP-sensitive K+ (KATP) channels (7). The consequent plasma membrane depolarization leads to Ca2+ influx (8) and exocytosis from secretory granules (9), both of which are further potentiated by “KATP-independent” amplifying signals (10). In addition, incretin hormones such as glucagon-like peptide 1 (GLP-1) and glucose-dependent insulinotropic peptide, released in response to food transit through the gut, potentiate insulin secretion in a glucose-dependent manner (11). Cognate receptor activation engages adenylate cyclases (ADCYs), enzymes that catalyze the generation of cAMP, a key intra- and intercellular signaling effector in the β-cell. Through its downstream interactions with protein kinase A and exchange protein activated by cAMP (Epac), cAMP drives changes including Ca2+ influx, intracellular Ca2+ mobilization (12), and the enhanced fusion competence of secretory granules (13). By contrast, glucose evokes more modest increases in intracellular cAMP (14), possibly via the stimulation of Ca2+-activated ADCYs such as ADCY1 and ADCY10 (15).
Both genetic (16) and environmental (4) risk factors conspire to determine the rate and extent of loss of insulin secretory capacity in T2D. Thus, the majority of genetic risk loci (∼70) currently identified by genome-wide association (GWAS) or familial studies alter functional β-cell mass while exerting little, or occasionally a beneficial, effect on insulin sensitivity (17). Of note, recent genetic studies have provided evidence that several pathways converging on β-cell cAMP signaling may influence T2D risk. For example, carriers of the major A-allele at rs11708067, or the C-allele at the neighboring single nucleotide polymorphism (SNP) rs2877716, lying on chromosome 3 in intron 3 of the ADCY5 gene, have an increased odds ratio of developing T2D (18). ADCY5 is a Ca2+-inhibited type III adenylate cyclase (19,20), and risk allele carriers present with elevated fasting glucose (21) but not impaired insulinogenic index or area under the curve (AUC)insulin/glucose 2-h postoral glucose load (22–25). These data strongly imply that ADCY5 activity may be required for normal insulin release in response to glucose but not incretin, the latter largely accounting for the effects of oral glucose (26). Whether and how SNPs exert control over β-cell function by influencing ADCY5 expression remain, nonetheless, unclear.
Therefore, the aims of the current study were to 1) establish a link between genotype and ADCY5 mRNA levels, 2) silence ADCY5 expression in human islets using specific short hairpin (sh)RNAs, and 3) use in situ imaging approaches and hormone release assays to establish the role of the cyclase in regulating β-cell responsiveness to glucose and incretin.
Research Design and Methods
Human Islet Isolation
Human islets were isolated from deceased heart-beating donors at transplantation facilities in Oxford, Geneva, Pisa, Edmonton, and Milan, with the relevant national and local ethics permissions, including consent from next of kin where required, and cultured as described (27). All studies involving human tissue were approved by the National Research Ethics Committee (NRES) London (Fulham), Research Ethics Committee no. 07/H0711/114.
Mouse Islet Isolation
Male and female C57BL/6 mice, 8–12 weeks of age, were killed by cervical dislocation and pancreatic islets isolated by collagenase digestion as previously described (28). Animal procedures were approved by the home office according to the Animals (Scientific Procedures) Act 1986 of the United Kingdom (PPL 70/7349).
ADCY5 Genotyping
DNA samples were genotyped for the SNP rs11708067 by restriction fragment length polymorphism analysis, as the G allele generated an HhaI site. A 250-bp region flanking the locus was amplified by PCR using Phire polymerase (Thermo) with the following primers: TCCGGAAGGCAAACACAGCA and AGCCAGGCTGCACCCAAGTG. The products were digested with HhaI and resolved by agarose gel electrophoresis.
Lentiviral Delivery of shRNA
Lentiviral particles carrying shRNA expression constructs against human ADCY5 were acquired from Sigma-Aldrich (Supplementary Table 1). Multiplicity of infection was calculated using Turbo-GFP particles on the same backbone (TRC 1.5; Sigma-Aldrich). Specificity of ADCY5 gene silencing was confirmed in both dissociated and intact islets, assuming 1,000–2,000 cells/islet for the latter. In all cases, lentiviral particles containing scrambled shRNA were used as controls (Con) and islets infected for 48–72 h.
Generation of Adenoviral Epac2-camps
cDNA encoding the cAMP sensor citrine/cerulean-Epac2-camps (29) was cloned into pShuttleCMV via HindIII and Xho1 sites before recombination with pAdEasy1 and virus production as described (6,30).
Real-Time PCR
Relative mRNA abundance was quantified by quantitative RT-PCR (qRT-PCR) using SYBR green (31). Primers (Supplementary Table 2) were designed using PerlPrimer (32), specificity validated using a dissociation curve, and amplification efficiency was determined using a dilution series. Expression of each gene was normalized to cylcophilin A (Ppia) and N-fold change in mRNA expression versus Con calculated using the 2−ΔΔCt.
ADCY5 mRNA levels were measured for expression quantitative trait locus analysis by qRT-PCR of RNA from isolated human islets as described earlier (33). The expression level of ADCY5 relative to TATA box–binding protein (TBP) was determined by qRT-PCR using Taqman primers and reagents (Supplementary Table 3) and the comparative Ct method (2−ΔΔCT) used for subsequent calculations.
Immunohistochemistry
Islets were fixed overnight at 4°C in paraformaldehyde before application of primary antibodies against ADCY5/6 (cat. no. ab66037; Abcam) (34) and either guinea pig anti-insulin 1:200 or mouse anti-glucagon 1:1,000 (both DAKO). Revelation was performed with goat anti-rabbit Alexa-Fluor 488 and either goat anti–guinea pig Alexa-Fluor 568 or goat anti-mouse Alexa-Fluor 568 antibodies (both 1:500, Invitrogen). Images were acquired as previously described (27).
Measurements of Insulin Secretion From Isolated Islets
Insulin secretion was measured from groups of five to six islets per well, incubated for 30 min in 0.5 mL Krebs-HEPES-bicarbonate (KHB) solution (130 mmol/L NaCl, 3.6 mmol/L KCl, 1.5 mmol/L CaCl2, 0.5 mmol/L MgSO4, 0.5 mmol/L NaH2PO4, 2 mmol/L NaHCO3, 10 mmol/L HEPES, and 0.1% [w/v] BSA, pH 7.4) at 37°C containing the indicated glucose and GLP-1 (7-36 human amide fragment) (Cambridge Bioscience) concentrations (35). Total islet proinsulin and insulin were measured after acid ethanol extraction and sonication using specific radioimmunoassays (EMD Millipore).
Live:dead and TUNEL Assays
Islets were incubated with 3 μmol/L calcein-AM (Life Technologies) and 2.5 μmol/L propidium iodide (Sigma-Aldrich) before detection of absorbance/emission at 491/525 nm and 561/620 nm, respectively. The islet area occupied by dead cells was expressed as a unitary ratio versus that occupied by live cells. Apoptosis was assessed using a TUNEL staining kit (Promega) according to the manufacturer’s instructions, and islets were counterstained against insulin before detection of absorbance/emission at 491/525 nm and 561/620 nm, respectively.
Calcium, ATP/ADP, and cAMP Imaging
Isolated islets were incubated (37°C, 95% O2/5% CO2) for 1 h in fluo2-AM (10 μmol/L) diluted in a bicarbonate buffer solution (120 mmol/L NaCl, 4.8 mmol/L KCl, 1.25 mmol/L NaH2PO4, 24 mmol/L NaHCO3, 2.5 mmol/L CaCl2, 1.2 mmol/L MgCl2, and 3 mmol/L d-glucose; all Sigma-Aldrich). Functional multicellular Ca2+ imaging was performed using a Nipkow spinning-disk head and the resulting traces were normalized to minimum fluorescence (Fmin) (27). A near-identical distribution of Fluo-2 intensity was detected in Con and ADCY5 shRNA-treated islets under resting (3 mmol/L glucose) conditions, indicating that basal Ca2+ levels were likely unaffected by gene knockdown, assuming similar dye loading (Supplementary Fig. 1).
For imaging of cytosolic ATP/ADP with Perceval (6) or cAMP with Epac2-camps, islets were infected for 48 h with adenoviruses at multiplicity of infection 10–100, giving infection of the first 2–3 islet cell layers. Cells were imaged using a HEPES-bicarbonate buffer (120 mmol/L NaCl, 4.8 mmol/L KCl, 24 mmol/L NaHCO3, 0.5 mmol/L Na2HPO4, 5 mmol/L HEPES, 2.5 mmol/L CaCl2, and 1.2 mmol/L MgCl2). For Perceval, absorbance/emission was 491/525 nm. For the Epac2-camps probe, excitation was delivered at 440 nm and emitted signals captured using cerulean (530 nm) and citrine (470 nm) filters. Förster resonance energy transfer (FRET) was calculated as the ratio of cerulean:citrine fluorescence and, for each experiment, expressed as a percentage of that obtained after maximal stimulation with 50 μmol/L forskolin (FSK). No differences in probe responses to FSK were detected in Con and ADCY5 shRNA-treated tissue (F/Fmin = 1.07 ± 0.01 vs. 1.06 ± 0.01 arbitrary units [AU], Con vs. ADCY5, respectively; P > 0.05).
ZIMIR Imaging
ZIMIR, a membrane-bound probe that fluoresces upon binding of zinc (Zn2+) coreleased with insulin from granules, was used to dynamically monitor insulin secretion as previously described (27,36). Briefly, islets were incubated with 10 μmol/L ZIMIR for 2 h and imaged in bicarbonate buffer supplemented with 1 μmol/L EGTA. After acquisition (absorbance/emission = 491/525 nm), islets were divided into 20 subregions before extraction of intensity over time traces and analysis of amplitude and AUC.
Total Internal Reflection of Fluorescence Microscopy
Insulin-stained PFA-fixed islets were subjected to total internal reflection of fluorescence imaging to capture a superresolution snapshot of submembrane insulin granule distribution. The evanescent field was produced using a 561-nm laser (CrystaLaser) and a 100× 1.6 NA objective (Zeiss). Insulin granule density was expressed as a unitary ratio versus the total membrane area, the latter being clearly visible between adjacent cells.
Correlation and Frequency Analysis
Correlation and frequency analyses were performed as previously detailed (27,37). Briefly, intensity over time traces were extracted for each fluo-2–loaded cell using a region of interest before manual triage for glucose responsiveness based on rises above a 25% threshold. The Pearson product moment correlation was performed for all possible cell pair combinations and significance (P < 0.05) calculated versus the expected t distribution of independent R values. Functional connectivity maps showing the location of significantly correlated cell pairs were then constructed based upon correlation strength and position within the imaged field (x–y). Phase maps were compiled by converting the normalized intensity of each cell to a value between 1 and 100% and assigning this to a color using a light-dark ramp. Ca2+-spiking frequency was measured using the fast Fourier transform.
Statistical Analysis
Data distribution was determined using D’Agostino omnibus or Shapiro-Wilk tests. Nonmultifactorial pairwise comparisons were made using Mann-Whitney U test or Student unpaired and paired t tests. Two-way ANOVA was used to assess interactions between multiple treatments (P < 0.01), and pairwise comparisons were performed using Bonferonni posttests. Expression quantitative trait locus data were stratified according to genotype, BMI, age, and sex. Factors included in the model were selected using the Akaike Information Criterion, resulting in the exclusion of age and BMI, as these were uninformative with regard to ADCY5 expression. To account for any prediction error, linear regression analyses were performed separately for both excluded variables, yielding nonsignificant relationships (P > 0.05). Owing to a significant interaction between sex and genotype in donors 22–70 years of age (P = 0.0476; two-way ANOVA), effects of genotype on mRNA abundance were assessed within sex group using one-way ANOVA. In all cases, analysis was performed using R (R Project), GraphPad Prism (GraphPad Software), IgorPro (Wavemetrics), and MATLAB (Mathworks), and results were considered significant at P < 0.05.
Results
ADCY5 Is Expressed in Human Islets at the mRNA and Protein Level
We sought firstly to characterize ADCY5 expression in tissue isolated from human and murine donors. Confirming previously published microarray data (33), SYBR Green qRT-PCR analyses revealed that ADCY5 and ADCY6 transcript levels were similar in human but not mouse islets (Fig. 1A). Immunohistochemistry using an antibody against ADCY5, and with some reported cross-reactivity against ADCY6, demonstrated the localization of both enzymes in the cytoplasm of insulin and glucagon immunopositive cells throughout individual human islets (Fig. 1B).
Figure 1.

ADCY5 is expressed in isolated human islets and affected by T2D risk alleles. A: ADCY5 and ADCY6 are expressed at similar levels in human islets (n = 4 donors). Conversely, Adcy6 mRNA expression is ∼40-fold more abundant than that of Adcy5, which is barely detectable in mouse islets (n = 3 female and 3 male animals; **P < 0.01 vs. ADCY5, Student t test). B: Immunostaining using an anti-ADCY5 immunoglobulin, with some reported cross-reactivity to ADCY6, reveals the cytoplasmic distribution of both proteins throughout the human α- and β-cell populations (DAPI, blue; scale bar, 60 µm). C: Scatter plot showing reduced ADCY5 mRNA abundance in islets from males <70 years of age who are carriers of the AA risk allele at rs11708067 (*P < 0.043 vs. AG; one-way ANOVA; n = 7 donors for each allele). Values represent mean ± SEM. D: Age of donors is not significantly correlated with ADCY5 mRNA expression (R2 = 0.21 and R2 = 0.01 for AG and AA, respectively; linear regression) (P values shown on graph). E: As for D, but BMI (R2 = 0.23 and R2 = 0.003, AG vs. AA, respectively; linear regression) (P values shown on graph).
ADCY5 mRNA Levels Are Influenced by Genotype
While GWAS provides statistically powerful information concerning associations between SNPs and T2D risk, it is unable to report on how the expression of genes at variant loci is altered in tissues implicated in glucose homeostasis. Since the elevated glucose levels associated with T2D may influence ADCY5 expression, we attempted to correlate genotype at SNP rs11708067 with ADCY5 mRNA abundance using tissue from a catalog of healthy donors. Allele frequency was close to that expected from previous studies (∼75% A) (18), and Taqman qRT-PCR analysis of RNA from isolated islets revealed approximately twofold lower mean ADCY5 expression in male AA versus AG carriers <70 years of age (Fig. 1C and Supplementary Table 4). When considered separately, neither age nor BMI significantly influenced ADCY5 expression for either genotype (Fig. 1D and E).
ADCY5 Is Required for Glucose-Stimulated Insulin Secretion
Given the above association between ADCY5 expression and fasting glucose levels and genotype in man, we next explored a role for this gene in human β-cell stimulus-secretion coupling. shRNAs directed against various sequences of the ADCY5 gene were delivered into dispersed cells or islets using replication-incompetent lentiviruses (n = 26 separate normoglycemic donors) (see Supplementary Table 5). Gene silencing efficiency was determined using qRT-PCR (Fig. 2A and B), and effects were confirmed at the protein level using immunohistochemistry and an antiserum raised against ADCY5/6 (Fig. 2C). Although mRNA levels were less affected by shRNA in intact than dissociated islets, this was most likely due to limited penetration of virus into the islet core (38); cells within the imaged layers were nevertheless typified by the near-complete absence of ADCY5 immunoreactivity. ADCY6 mRNA abundance was not altered by ADCY5 silencing, suggesting that the action of the shRNA on immunoreactivity was largely due to loss of the latter mRNA message (Fig. 2D). Cell viability and apoptosis indices were normal, excluding any effects of impaired cAMP signaling on β-cell survival (Fig. 2E and F).
Figure 2.

ADCY5 silencing inhibits glucose- but not GLP-1–stimulated insulin secretion. A and B: Lentivirus harboring shRNA against ADCY5 reduces expression by >50% in both dispersed and intact islets (**P < 0.01 vs. Con; Student paired t test; n = 3–4 donors). C: ADCY5/6 protein expression is markedly reduced in the first few cell layers of intact islets, as determined using confocal imaging (n = 6 islets from two donors). D: ADCY6 mRNA expression is unaffected by ADCY5 silencing (NS, nonsignificant vs. Con; Student paired t test; n = 4 donors). E: Dead:live cell ratio is similar in Con and shRNA-treated islets (positive Con, Triton X-100; NS, nonsignificant vs.; Mann-Whitney U test; n = 10–11 islets from three donors). F: As for E, but TUNEL assay for apoptosis (n = 9 islets from three donors). The proportion of apoptotic β-cells was expressed as a fraction area versus nonapoptotic insulin-positive cell mass (Vv). G: ADCY5 knockdown suppresses glucose-induced insulin secretory dynamics, as shown by bar graphs of AUC and amplitude of ZIMIR responses (mean traces, left panel; n = 8–9 islets from four donors) (**P < 0.01 vs. Con; Mann-Whitney U test). H: GLP-1–stimulated insulin secretory dynamics are subtly improved after ADCY5 depletion (mean traces, left panel; AUC and amplitude, right panel; n = 7 islets from three donors) (NS, nonsignificant). I: Glucose-stimulated insulin release into static culture is impaired in shRNA-treated islets, as determined using radioimmunoassay (G3 and G16.7, 3 mmol/L and 16.7 mmol/L glucose, respectively) (n = 4–8 donors). KCl 30 mmol/L was added as a Con. J: As for I, but stimulation index vs. 3 mmol/L glucose to better account for the variation between islet preparations (*P < 0.02 vs. Con at 16.7 mmol/L glucose; Mann-Whitney U test). K: As for J, but vs. 16.7 mmol/L glucose (G16.7) (*P < 0.01 vs. 16.7 mmol/L glucose for each group; Mann-Whitney U test). Values represent mean ± SEM. hr, hour.
The impact of ADCY5 silencing on glucose- or incretin-stimulated insulin secretory dynamics was subsequently assessed using Nipkow spinning-disk microscopy (27) to image Zn2+ coreleased from insulin-containing granules within individual ZIMIR-stained islets (27,36). The amplitude and AUC of glucose (11 mmol/L)-stimulated insulin release were markedly impaired in islets silenced for ADCY5 (Fig. 2G). By contrast, insulin-release dynamics in response to GLP-1 were subtly improved in tissue depleted for ADCY5, suggesting the presence of an intact incretin axis (Fig. 2H). The observations with ZIMIR were confirmed using conventional static incubation techniques followed by radioimmunoassay of supernatant, and we further detected no significant effect of gene silencing on KCl-stimulated insulin release (Fig. 2I–K). Donor variability was largely accounted for by a paired experimental design, and this was further supported by linear regression analyses, which revealed no relationship between age, BMI, and the magnitude suppression of glucose-stimulated insulin release in ADCY5-silenced islets (Supplementary Fig. 2). Insulin content was similar in Con and ADCY5 shRNA-treated islets, although there was a tendency toward an increased proinsulin-to-insulin ratio in the latter (Table 1), as expected from studies in patients harboring SNPs in or near the ADCY5 locus (25). Lastly, and in line with the secretory measures, total internal reflection of fluorescence imaging of insulin-stained islets confirmed that ADCY5 knockdown did not alter the distribution of granules located in the vicinity of the plasma membrane (Supplementary Fig. 3A and B).
Table 1.
Insulin and proinsulin content in Con and ADCY5 shRNA-treated islets (n = 4 donors)
| Con | shRNA | |
|---|---|---|
| Proinsulin content (ng/islet) | 0.82 ± 0.11 | 0.93 ± 0.07 |
| Insulin content (ng/islet) | 32.8 ± 3.5 | 29.8 ± 3.1 |
| Proinsulin:insulin (%) | 2.6 ± 0.5 | 4.0 ± 1.2 |
Data are means ± SEM.
ADCY5 Couples Glucose to cAMP Generation, Ca2+ Rises, and β-Cell Connectivity
Using Epac2-camps (29) to measure cAMP rises in β-cells (Supplementary Fig. 4), almost a threefold reduction in glucose- but not FSK-stimulated cAMP generation could be detected in ADCY5-silenced islets (Fig. 3A and B). Since cAMP elevations are linked to enhanced electrotonic coupling (39), the effects of ADCY5 depletion on the cell-cell communication processes underlying the intraislet regulation of insulin secretion were next investigated. Cytosolic free Ca2+ levels were thus used as a proxy to measure the electrical dynamics known to orchestrate Ca2+-dependent hormone secretion from the hundreds of cells residing within the first few microorgan layers; under the conditions used, Ca2+ changes chiefly reflect those within β-cells (27). In line with its dramatic effects on secretion, ADCY5 silencing suppressed both the amplitude and AUC of glucose-evoked Ca2+ rises throughout the imaged population (Fig. 3C–E and Supplementary Movies 1 and 2) (n = 3 donors; BMI range = 25.4–27.4; age range = 52–76 years). Furthermore, connectivity between individual β-cells, analyzed by large-scale mapping of long-term (∼30 min) evolutions in correlated cell-cell interactivity (40) and recently shown to be a key element in the insulin secretory response (27,41), was also reduced in ADCY5-silenced islets (Fig. 3F and G). Neither the number of responsive cells (Fig. 3H) nor the frequency of [Ca2+]i oscillations (Fig. 3I) was affected by ADCY5 knockdown, suggesting that the absence of the cyclase was unlikely to impair insulin release by targeting the rhythmicity of a β-cell subpopulation. Implying that the effects of silencing were unlikely to reflect a long-term consequence of ADCY5 depletion, a similar degree of suppression of glucose-induced Ca2+ rises was obtained using 20 μmol/L NKY80, a relatively selective chemical inhibitor of the enzyme (IC50 = 8.3 μmol/L, 132 μmol/L, and 1.7 mmol/L for ADCY5, 3, and 2, respectively) (42) (Supplementary Fig. 5A). Demonstrating the specificity of both shRNA and NKY80, the inhibitory actions of the drug were lost after ADCY5 silencing (Supplementary Fig. 5B).
Figure 3.

ADCY5 depletion suppresses glucose-induced increases in cytosolic free Ca2+. A: ADCY5 silencing decreases cystosolic cAMP levels, as determined using the recombinant probe Epac2-camps (representative traces shown; gray/black, smoothed; red, raw). B: As for A, but summary data showing a reduction in measured FRET signal versus maximal stimulation with FSK (%), as well as decreased AUC (**P < 0.01 vs. Con; Student t test; n = 12 recordings from three donors). C: ADCY5 knockdown suppresses 11 mmol/L glucose (G11)-evoked cytosolic Ca2+ rises (left panel: mean traces) (right panel: zoom-in of Ca2+ oscillations). D: AUC and amplitude of Ca2+ rises are reduced in shRNA-treated islets (right panel, **P < 0.01 vs. Con; Mann-Whitney U test; n = 10 islets from three donors). E: Pseudocolored Con and shRNA-treated human islets during exposure to 11 mmol/L glucose (recording time = 40 min; image cropped to display a single islet). F: ADCY5 is required for long-term evolutions in coordinated cell activity after exposure to elevated glucose (**P < 0.01 vs. Con; Mann-Whitney U test; n = 9–10 islets from three donors) (correlation calculated over 20–30 min; sig, significantly). G: Representative functional connectivity map depicting location, number, and strength (color-coded; 0 [blue] = lowest, 1 [red] = highest) of significantly correlated cell pairs (Pearson R coefficient, P < 0.05). Note that ADCY5 silencing decreases both the number and strength of correlations. H: Gene silencing does not significantly alter the percentage (%) of glucose (11 mmol/L)-responsive cells (NS, nonsignificant vs. Con; Mann-Whitney U test). I: The cumulative distribution of Ca2+-spiking frequencies remains similar in Con and shRNA-treated islets. Values represent mean ± SEM.
GLP-1–Stimulated β-Cell Activity Does Not Involve ADCY5
Consistent with the lack of effect of gene silencing on GLP-1–induced insulin release, loss of ADCY5 failed to impact Ca2+ changes and even appeared to augment Ca2+ increases in response to the incretin without modulating the proportion of responsive cells (Fig. 4A and B and Supplementary Movies 3 and 4). Furthermore, GLP-1–mediated increases in β-cell–β-cell connectivity, critical for generating the acute (5–10 min) bursts in coordinated activity that underlie incretin potentiation of glucose-stimulated insulin secretion (27), were unchanged after treatment with anti-ADCY5 shRNA (Fig. 4C–E). In line with this, GLP-1R mRNA expression levels were unaffected by ADCY5 silencing (Fig. 4F).
Figure 4.

ADCY5 does not mediate GLP-1–stimulated cytosolic Ca2+ increases. A: ADCY5 knockdown subtly improves GLP-1 responses (left panel: mean traces), as evidenced by increased AUC and amplitude of cytosolic Ca2+ rises in shRNA-treated islets (right panel) (**P < 0.01 vs. Con; Mann-Whitney U test; n = 10 islets from three donors). B: The proportion of GLP-1–responsive cells is similar in Con and shRNA-treated islets (NS, nonsignificant vs. Con; Mann-Whitney U test). C: ADCY5 silencing does not affect coordinated β-cell responses to 11 mmol/L glucose plus GLP-1 (representative Ca2+ traces [top panel]; gray, smoothed; red, raw) (heat map depicting minimum–maximum for each cell [bottom panel]) (n = 10 islets from three donors; correlation measured using 5-min windows). D: Histogram showing mean % significantly correlated cell pairs in Con and shRNA-treated islets before, during, and after GLP-1 application (NS, nonsignificant; two-way ANOVA). E: Representative weighted graphs demonstrating large increases in β-cell connectivity after exposure to GLP-1 in both normal and ADCY5-depleted islets (scale bar, 50 µm). F: Gene silencing does not alter GLP-1R mRNA expression (NS, nonsignificant vs. Con; Student paired t test; n = 3 donors). Values represent mean ± SEM.
Glucose Still Increases Cytosolic ATP-to-ADP Ratio After ADCY5 Silencing
We wondered whether the substantial reductions in glucose-induced Ca2+ rises and insulin release, detected in ADCY5-silenced islets, were accompanied by fulminant changes to β-cell glucose metabolism. To allow the real time recording of ATP dynamics specifically in β-cells, the expression of the recombinant probe Perceval was directed in human islets using an adenoviral vector (6,43). Confirming tropism of the virus for β-cells, as previously described in rodent islets (44), green fluorescent protein fluorescence was restricted to insulin-immunopositive cells (Fig. 5A). In response to increasing glucose concentrations (3–17 mmol/L), β-cells responded with large, coordinated, and nonoscillatory elevations in ATP-to-ADP ratio (Fig. 5B). Although significantly reduced, a glucose-induced increase in ATP-to-ADP ratio could still be detected after ADCY5 silencing (Fig. 5C). Further excluding a role for cAMP-independent effects on KATP or voltage-dependent Ca2+ channel (VDCC) activity, ADCY5 silencing did not alter Ca2+ rises induced by KCl applied in the absence and presence of the KATP channel opener, diazoxide (Supplementary Fig. 6A and B). Consistent with our previous findings in MIN6 β-cells (12), GLP-1 was able to provoke significant rises in ATP-to-ADP ratio under both low (3 mmol/L) and high (16.7 mmol/L) glucose conditions (Fig. 5D–F), as well as in the presence of ADCY5 silencing (Fig. 5G and H). Hence, an action of glucose to accelerate oxidative metabolism toward ATP synthesis is not a prerequisite for GLP-1 signaling.
Figure 5.

ADCY5 alters β-cell energetics. A: Expression of the ATP/ADP probe Perceval is predominantly restricted to β-cells, as shown using immunohistochemistry with antibodies against insulin and glucagon (scale bar, 25 µm [top panels] and 20 µm [bottom panels]). B: Glucose (17 mmol/L) (G17) still induces increases in ATP-to-ADP ratio after ADCY5 silencing (representative traces shown; gray/black, smoothed; red, raw). C: Bar graph showing a significant effect of shRNA treatment on the amplitude of cytosolic (cyt) ATP/ADP rises in response to 17 mmol/L glucose (*P < 0.05 vs. Con; Mann-Whitney U test; n = 9–10 islets from three donors). D: GLP-1 increases ATP/ADP in the presence of permissive (17 mmol/L) glucose concentrations (representative traces shown; gray/black, smoothed; red, raw). E: As for D, but in the presence of nonpermissive (3 mmol/L) glucose concentrations. F: Summary statistics demonstrate similar effects of GLP-1 on ATP/ADP in islets exposed to 3 or 17 mmol/L glucose (NS, nonsignificant vs. Con; Mann-Whitney U test; n = 10–13 recordings from five donors). G: ATP/ADP responses to GLP-1 are similar in Con and ADCY5 shRNA-treated islets (representative traces shown; gray/black, smoothed; red, raw). H: Summary statistics demonstrate no significant effect of gene silencing on GLP-1–induced ATP/ADP rises (NS, nonsignificant vs. Con; Mann-Whitney U test; n = 6 recordings from two donors). Values represent mean ± SEM.
To determine the relative contribution of metabolism to ADCY5-regulated β-cell function, ATP-to-ADP dynamics were imaged after exposure to increasing glucose concentrations. Whereas both Con and ADCY5-silenced islets responded normally to 5 and 8 mmol/L glucose (Fig. 6A), the latter failed to respond to further elevation of the sugar, and this deficit could be rescued using FSK to elevate cAMP (Fig. 6B). Cytosolic Ca2+ responses to 8 mmol/L glucose, however, remained suppressed after ADCY5 knockdown (Fig. 6C).
Figure 6.

ADCY5 targets nonmetabolic processes to alter Ca2+ responses. A: Impaired ATP/ADP responses are only present in ADCY5-silenced islets at glucose concentrations of ≥11 mmol/L (**P < 0.01 vs. Con; two-way ANOVA; n = 9 recordings from three donors). B: Elevation of cAMP using FSK rescues ATP/ADP rises in ADCY5-silenced islets after transition from 3 mmol/L to 17 mmol/L glucose (G3-G17) (**P < 0.01 vs. shRNA; one-way ANOVA; n = 9 recordings from three donors; n = 4–5 recordings). C: ADCY5 knockdown suppresses β-cell Ca2+ responses after transition from 3 mmol/L to 8 mmol/L glucose (G3-G8) (representative traces [left panel]; gray/black, smoothed; red, raw]), as evidenced by reduced amplitude (right panel) (**P < 0.01 vs. shRNA; Mann-Whitney U test; n = 8–9 recordings from three donors).
Discussion
The aim of the current study was to explore the role of ADCY5 in the regulation of insulin secretion from human islets. We show that ADCY5 is required to link glucose-derived signals to the intracellular Ca2+ rises that principally drive insulin granule exocytosis. By contrast, incretins such as GLP-1 remain competent to evoke insulin release in the face of ADCY5 silencing (Fig. 7). Providing compelling evidence that defective ADCY5 action may contribute to impaired fasting glucose were the observations that mRNA expression was reduced in islets from subjects harboring risk alleles at rs11708067. Interestingly, ADCY5 mRNA levels were also reduced in β-cells from (ungenotyped) patients with T2D versus healthy donors (33), providing a further link with disease status.
Figure 7.
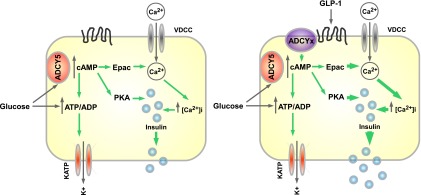
Schematic of ADCY5 function in human β-cells. Glucose-stimulated insulin secretion relies on KATP-dependent and -independent signals. The latter include cAMP generation, and this likely requires ADCY5 activation by the sugar to increase ATP generation, Ca2+ influx, and exocytosis (left panel). By contrast, incretins such as GLP-1, believed primarily to engage cAMP-signaling pathways, may potentiate insulin secretion via other ADCY isoforms (right panel). PKA, protein kinase A.
Assessed by next-generation sequencing (RNA-Seq), ADCY5 mRNA occupies the top 13th centile of all mRNAs in human islets (45) and is the most strongly expressed member of the ADCY family in this tissue, with mRNA levels approximately twofold higher than those of ADCY1, the next most abundant isoform, and 50% higher than ADCY6 mRNA. Assuming similar levels of PPIA mRNA, our qRT-PCR results in isolated human islets are broadly consistent with this observation (Fig. 1A). Of note, however, analysis of laser-capture–dissected β-cells (33) (Gene Expression Omnibus public repository, accession no. GSE20966) and a β-cell–enriched fraction from human islets (46) revealed lower levels of ADCY5 mRNA (∼50th and ∼65th centiles, respectively), being in each case ∼50% of those of ADCY6. Intriguingly, in the current study, Adcy5 mRNA was barely detectable in mouse islets, being expressed at a level ∼40-fold lower than Adcy6 (Fig. 1). A similar, though less marked (approximately eightfold), preponderance of ADCY6 over ADCY5 mRNA also exists for rat islets (47), demonstrating marked species variability in the relative abundance of ADCY isoforms within this tissue. Since these variations do not appear to reflect the greater proportion of α-cells in human (48) versus rodent (49) islets, ADCY5 may serve a nonconserved function between mammalian species.
Levels of mRNA encoding ADCY8, previously reported to be regulated by glucose in rat and human islets (50), were recently shown to be much lower in human islets than either ADCY5 or -6 (45). Confirming these findings, ADCY8 mRNA was undetectable in four out of the five independent repeats that we conducted in human islets, and in the single experiment in which an amplicon was present, Ct values were incompatible with accurate quantification (37.05 ± 0.49 cycles).
Of other genes lying 250 kb on either side of rs2877716 and rs11708067, which might also conceivably mediate the observed effects on diabetes risk, MYLK transcripts are barely detectable in human islets (45,46). On the other hand, SEC22A, PDIA, and PTPLB are each detectably expressed and so may contribute. Nonetheless, our observations on the effects of ADCY5 silencing are entirely consistent with the observed phenotype of subjects possessing risk alleles (22).
The strong dependence of glucose-stimulated insulin secretion upon ADCY5 expression in human islets is surprising given the abundant presence of ADCY6 and the redundancies inherent to the cAMP signaling cassette (51). Although the above differences at the mRNA level are not necessarily reflective of protein quantity or enzymatic activity, the observed sensitivity to ADCY5 depletion may reflect either microcompartmentalization of ADCY5-containing complexes in proximity to Ca2+ influx and release sites (52) or a requirement for ADCY5 in cAMP-independent signaling processes. Thus, while our data indicate that ADCY5 couples glucose to insulin secretion by translating a glucose signal into cAMP generation (53), GLP-1 receptors may engage alternative ADCY family members to modify cAMP dynamics. Further studies will be required to explore the latter possibility (Fig. 7). Of note, global deletion of ADCY5 in mice leads to longevity and the resistance of cardiomyocytes to oxidative stress via the upregulation of Ras-MAPK signaling (20). A similar mechanism might therefore contribute to the small but significant enhancement of GLP-1 signaling observed here in human β-cells after ADCY5 silencing.
Although ADCY5 is Ca2+ inhibited in vitro (19), the range of Ca2+ concentrations over which inhibition occurs (>10 μmol/L) comfortably exceeds normal intracellular concentrations of these ions in β-cells (8). Whether ADCY5 is therefore a direct target for activation by intracellular signals generated by glucose (ATP, etc.) or is, rather, a passive but essential element of a glucose-activated signaling pathway leading to Ca2+ influx and insulin release remains to be established.
Recent studies have shown that the intraislet regulation of cell-cell communication is critical for the proper generation of hormone release after secretagogue challenge (27). Providing further evidence that the islet context is an important player in insulin secretion was the observation in the current study that β-cell responses to glucose were less coordinated in islets depleted of ADCY5. While the mechanisms underlying this phenomenon remain obscure, cAMP has been shown to alter β-cell gap junction conductance (39), and the resultant enhanced intercellular coupling may contribute to the insulin-raising actions of cAMP-elevating agents such as glucose and incretins. Whereas we recently showed that knockdown of connexin 36 markedly reduced coordinated cell responses to incretin, more modest effects on glucose action were observed (27). The impact of cAMP on glucose-induced cell connectivity may therefore also stem from perturbed paracrine signaling circuits between β-, α-, and other cell types, in addition to enhanced electrotonic coupling. Likewise, an intriguing possibility is that ADCY5 suppression may also affect glucagon and, potentially, GLP-1 (54) secretion from neighboring α-cells to affect β-cell “glucose competence.” In any case, ADCY5-depleted islets still displayed impaired Ca2+ responses even when metabolic dysfunction was accounted for (Fig. 6B), supporting the view that other downstream processes, including cell-cell communication, are targeted by cAMP signaling.
Remarkably, GLP-1 evoked Ca2+ rises and hormone release even when glucose-stimulated insulin secretion was abolished by ADCY5 silencing. This implies that GLP-1 signaling—generally believed to hinge on increased intracellular cAMP levels (55)—is sufficient under these conditions to elicit closure of KATP and induce Ca2+ influx and exocytosis. Indeed, studies by Miki et al. (56) have demonstrated that GLP-1 is still able to evoke insulin secretion in the complete absence of KATP channels. Thus, the glucose dependency of GLP-1–induced insulin secretion is unlikely solely to reflect the effects of the sugar on oxidative metabolism and, hence, the closure of KATP channels, especially in light of data showing the absence of GLP-1–induced Ca2+ rises in human islets incubated at nonpermissive glucose concentrations (27). Rather than a simple summation of glucose and GLP-1–derived Ca2+ signals, the ATP/ADP responses to the latter, readily detectable at low glucose concentrations, may instead be converted into a depolarizing stimulus through a complex interplay between KATP-dependent and -independent pathways (10).
In summary, we describe here a novel role for the GWAS-identified gene ADCY5 in the normal regulation of insulin secretion from human islets of Langerhans. Thus, we elucidate a pathway that converts ADCY5 gene polymorphisms into defective β-cell function. Since β-cell decompensation is a hallmark of T2D pathogenesis irrespective of genotype, ADCY5 may provide a useful target for the restoration of insulin release in man.
Supplementary Material
Article Information
Acknowledgments. The authors thank Drs. Tatsuya Kin and Doug O'Gorman from the Clinical Islet Isolation Laboratory in Edmonton for providing human islets for this study.
Funding. These studies were supported by a Diabetes UK R.D. Lawrence Research Fellowship (12/0004431) to D.J.H. and by a Wellcome Trust Senior Investigator award (WT098424AIA), a Medical Research Council Programme award (MR/J0003042/1), a Diabetes UK Project grant (11/0004210), and a Royal Society Wolfson Research Merit award to G.A.R. Isolation of human islets was supported by JDRF awards (31-2008-416) to D.B. and (31-2008-413) to L.P. (European Consortium for Islet Transplantation). P.R.J. and S.J.H. were supported by grants from the National Institute for Health Research Biomedical Research Centre, Oxford. W.-H.L. was supported by grants from the JDRF (37-2011-21) and National Institutes of Health (R01-GM-077593). The work leading to this publication has received support from the Innovative Medicines Initiative Joint Undertaking under grant 155005, resources of which are composed of financial contribution from the European Union's Seventh Framework Programme (FP7/2007-2013), and European Federation of Pharmaceutical Industries and Associations companies’ in-kind contribution to G.A.R.
Duality of Interest. No potential conflicts of interest relevant to this article were reported.
Author Contributions. D.J.H. supervised the research, conceived and designed the study, performed the experiments, performed analysis, and wrote the manuscript with input from all authors. R.K.M. performed the experiments and analysis and conceived and designed the study. L.M. and T.J.P. performed the experiments and analysis. S.G.B. and F.S. performed the experiments. K.L.E., D.M.F.C., D.L., and W.-H.L. provided reagents. M.B., P.M., V.L., D.B., L.P., P.R.J., S.J.H., and A.M.J.S. isolated and provided human islets. G.A.R. jointly supervised the research, conceived and designed the study, performed analysis, and wrote the manuscript with input from all the authors. G.A.R. is the guarantor of this work and, as such, had full access to all the data in the study and takes responsibility for the integrity of the data and the accuracy of the data analysis.
Prior Presentation. Parts of this study were presented in abstract form at the 73rd Scientific Sessions of the American Diabetes Association, Chicago, IL, 21–25 June 2013.
Footnotes
This article contains Supplementary Data online at http://diabetes.diabetesjournals.org/lookup/suppl/doi:10.2337/db13-1607/-/DC1.
References
- 1.Scully T. Diabetes in numbers. Nature 2012;485:S2–S3 [DOI] [PubMed] [Google Scholar]
- 2.Smith U, Gale EA. Cancer and diabetes: are we ready for prime time? Diabetologia 2010;53:1541–1544 [DOI] [PubMed] [Google Scholar]
- 3.DeFronzo RA, Abdul-Ghani MA. Preservation of β-cell function: the key to diabetes prevention. J Clin Endocrinol Metab 2011;96:2354–2366 [DOI] [PubMed] [Google Scholar]
- 4.Rutter GA, Parton LE. The beta-cell in type 2 diabetes and in obesity. Front Horm Res 2008;36:118–134 [DOI] [PubMed] [Google Scholar]
- 5.McCulloch LJ, van de Bunt M, Braun M, Frayn KN, Clark A, Gloyn AL. GLUT2 (SLC2A2) is not the principal glucose transporter in human pancreatic beta cells: implications for understanding genetic association signals at this locus. Mol Genet Metab 2011;104:648–653 [DOI] [PubMed] [Google Scholar]
- 6.Tarasov AI, Semplici F, Ravier MA, et al. The mitochondrial Ca2+ uniporter MCU is essential for glucose-induced ATP increases in pancreatic β-cells. PLoS ONE 2012;7:e39722. [DOI] [PMC free article] [PubMed] [Google Scholar]
- 7.Ashcroft FM, Rorsman P. ATP-sensitive K+ channels: a link between B-cell metabolism and insulin secretion. Biochem Soc Trans 1990;18:109–111 [DOI] [PubMed] [Google Scholar]
- 8.Grapengiesser E, Gylfe E, Hellman B. Dual effect of glucose on cytoplasmic Ca2+ in single pancreatic beta-cells. Biochem Biophys Res Commun 1988;150:419–425 [DOI] [PubMed] [Google Scholar]
- 9.Tsuboi T, Rutter GA. Multiple forms of “kiss-and-run” exocytosis revealed by evanescent wave microscopy. Curr Biol 2003;13:563–567 [DOI] [PubMed] [Google Scholar]
- 10.Henquin JC. Regulation of insulin secretion: a matter of phase control and amplitude modulation. Diabetologia 2009;52:739–751 [DOI] [PubMed] [Google Scholar]
- 11.Campbell JE, Drucker DJ. Pharmacology, physiology, and mechanisms of incretin hormone action. Cell Metab 2013;17:819–837 [DOI] [PubMed] [Google Scholar]
- 12.Tsuboi T, da Silva Xavier G, Holz GG, Jouaville LS, Thomas AP, Rutter GA. Glucagon-like peptide-1 mobilizes intracellular Ca2+ and stimulates mitochondrial ATP synthesis in pancreatic MIN6 beta-cells. Biochem J 2003;369:287–299 [DOI] [PMC free article] [PubMed] [Google Scholar]
- 13.Shibasaki T, Sunaga Y, Fujimoto K, Kashima Y, Seino S. Interaction of ATP sensor, cAMP sensor, Ca2+ sensor, and voltage-dependent Ca2+ channel in insulin granule exocytosis. J Biol Chem 2004;279:7956–7961 [DOI] [PubMed] [Google Scholar]
- 14.Charles MA, Lawecki J, Pictet R, Grodsky GM. Insulin secretion. Interrelationships of glucose, cyclic adenosine 3:5-monophosphate, and calcium. J Biol Chem 1975;250:6134–6140 [PubMed] [Google Scholar]
- 15.Ramos LS, Zippin JH, Kamenetsky M, Buck J, Levin LR. Glucose and GLP-1 stimulate cAMP production via distinct adenylyl cyclases in INS-1E insulinoma cells. J Gen Physiol 2008;132:329–338 [DOI] [PMC free article] [PubMed] [Google Scholar]
- 16.McCarthy MI. Genomics, type 2 diabetes, and obesity. N Engl J Med 2010;363:2339–2350 [DOI] [PubMed] [Google Scholar]
- 17.da Silva Xavier G, Bellomo EA, McGinty JA, French PM, Rutter GA. Animal models of GWAS-identified type 2 diabetes genes. J Diabetes Res 2013;2013:906590 [DOI] [PMC free article] [PubMed]
- 18.Dupuis J, Langenberg C, Prokopenko I, et al. ; DIAGRAM Consortium; GIANT Consortium; Global BPgen Consortium; Anders Hamsten on behalf of Procardis Consortium; MAGIC investigators. New genetic loci implicated in fasting glucose homeostasis and their impact on type 2 diabetes risk. Nat Genet 2010;42:105–116 [DOI] [PMC free article] [PubMed] [Google Scholar]
- 19.Yoshimura M, Cooper DM. Cloning and expression of a Ca(2+)-inhibitable adenylyl cyclase from NCB-20 cells. Proc Natl Acad Sci U S A 1992;89:6716–6720 [DOI] [PMC free article] [PubMed] [Google Scholar]
- 20.Yan L, Vatner DE, O’Connor JP, et al. Type 5 adenylyl cyclase disruption increases longevity and protects against stress. Cell 2007;130:247–258 [DOI] [PubMed] [Google Scholar]
- 21.Boesgaard TW, Grarup N, Jørgensen T, Borch-Johnsen K, Hansen T, Pedersen O; Meta-Analysis of Glucose and Insulin-Related Trait Consortium (MAGIC). Variants at DGKB/TMEM195, ADRA2A, GLIS3 and C2CD4B loci are associated with reduced glucose-stimulated beta cell function in middle-aged Danish people. Diabetologia 2010;53:1647–1655 [DOI] [PubMed] [Google Scholar]
- 22.Saxena R, Hivert MF, Langenberg C, et al. ; GIANT consortium; MAGIC investigators. Genetic variation in GIPR influences the glucose and insulin responses to an oral glucose challenge. Nat Genet 2010;42:142–148 [DOI] [PMC free article] [PubMed] [Google Scholar]
- 23.Windholz J, Kovacs P, Tönjes A, et al. Effects of genetic variants in ADCY5, GIPR, GCKR and VPS13C on early impairment of glucose and insulin metabolism in children. PLoS ONE 2011;6:e22101. [DOI] [PMC free article] [PubMed] [Google Scholar]
- 24.Rees SD, Hydrie MZ, O’Hare JP, et al. Effects of 16 genetic variants on fasting glucose and type 2 diabetes in South Asians: ADCY5 and GLIS3 variants may predispose to type 2 diabetes. PLoS ONE 2011;6:e24710. [DOI] [PMC free article] [PubMed] [Google Scholar]
- 25.Wagner R, Dudziak K, Herzberg-Schäfer SA, et al. Glucose-raising genetic variants in MADD and ADCY5 impair conversion of proinsulin to insulin. PLoS ONE 2011;6:e23639. [DOI] [PMC free article] [PubMed] [Google Scholar]
- 26.Nauck MA, Homberger E, Siegel EG, et al. Incretin effects of increasing glucose loads in man calculated from venous insulin and C-peptide responses. J Clin Endocrinol Metab 1986;63:492–498 [DOI] [PubMed] [Google Scholar]
- 27.Hodson DJ, Mitchell RK, Bellomo EA, et al. Lipotoxicity disrupts incretin-regulated human β cell connectivity. J Clin Invest 2013;123:4182–4194 [DOI] [PMC free article] [PubMed] [Google Scholar]
- 28.Ravier MA, Rutter GA. Isolation and culture of mouse pancreatic islets for ex vivo imaging studies with trappable or recombinant fluorescent probes. Methods Mol Biol 2010;633:171–184 [DOI] [PubMed] [Google Scholar]
- 29.Everett KL, Cooper DMF. An improved targeted cAMP sensor to study the regulation of adenylyl cyclase 8 by Ca2+ entry through voltage-gated channels. PLoS ONE 2013;8:e75942. [DOI] [PMC free article] [PubMed] [Google Scholar]
- 30.He TC, Zhou S, da Costa LT, Yu J, Kinzler KW, Vogelstein B. A simplified system for generating recombinant adenoviruses. Proc Natl Acad Sci U S A 1998;95:2509–2514 [DOI] [PMC free article] [PubMed] [Google Scholar]
- 31.da Silva Xavier G, Loder MK, McDonald A, et al. TCF7L2 regulates late events in insulin secretion from pancreatic islet beta-cells. Diabetes 2009;58:894–905 [DOI] [PMC free article] [PubMed] [Google Scholar]
- 32.Marshall OJ. PerlPrimer: cross-platform, graphical primer design for standard, bisulphite and real-time PCR. Bioinformatics 2004;20:2471–2472 [DOI] [PubMed] [Google Scholar]
- 33.Marselli L, Thorne J, Dahiya S, et al. Gene expression profiles of Beta-cell enriched tissue obtained by laser capture microdissection from subjects with type 2 diabetes. PLoS ONE 2010;5:e11499. [DOI] [PMC free article] [PubMed] [Google Scholar]
- 34.del Puerto A, Díaz-Hernández JI, Tapia M, et al. Adenylate cyclase 5 coordinates the action of ADP, P2Y1, P2Y13 and ATP-gated P2X7 receptors on axonal elongation. J Cell Sci 2012;125:176–188 [DOI] [PubMed] [Google Scholar]
- 35.Ravier MA, Rutter GA. Glucose or insulin, but not zinc ions, inhibit glucagon secretion from mouse pancreatic alpha-cells. Diabetes 2005;54:1789–1797 [DOI] [PubMed] [Google Scholar]
- 36.Li D, Chen S, Bellomo EA, et al. Imaging dynamic insulin release using a fluorescent zinc indicator for monitoring induced exocytotic release (ZIMIR). Proc Natl Acad Sci U S A 2011;108:21063–21068 [DOI] [PMC free article] [PubMed] [Google Scholar]
- 37.Sanchez-Cardenas C, Fontanaud P, He Z, et al. Pituitary growth hormone network responses are sexually dimorphic and regulated by gonadal steroids in adulthood. Proc Natl Acad Sci U S A 2010;107:21878–21883 [DOI] [PMC free article] [PubMed] [Google Scholar]
- 38.Diraison F, Parton L, Ferre P, et al. Over-expression of sterol response element binding protein-1c or culture with 5-aminoimidazole-4-carboxamide ribonucleoside induces lipogenesis and decresaes glucose-stimulated insulin secretion from rat pancreatic islets. Diabet Med 2003;20:A77. [DOI] [PMC free article] [PubMed] [Google Scholar]
- 39.Mears D, Sheppard NF, Jr, Atwater I, Rojas E. Magnitude and modulation of pancreatic beta-cell gap junction electrical conductance in situ. J Membr Biol 1995;146:163–176 [DOI] [PubMed] [Google Scholar]
- 40.Hodson DJ, Schaeffer M, Romanò N, et al. Existence of long-lasting experience-dependent plasticity in endocrine cell networks. Nat Commun 2012;3:605DOI: 10.1038/ncomms1612.:605 10.1038/ncomms1612.:605 [DOI] [PMC free article] [PubMed] [Google Scholar]
- 41.Stožer A, Gosak M, Dolenšek J, et al. Functional connectivity in islets of Langerhans from mouse pancreas tissue slices. PLOS Comput Biol 2013;9:e1002923. [DOI] [PMC free article] [PubMed] [Google Scholar]
- 42.Onda T, Hashimoto Y, Nagai M, et al. Type-specific regulation of adenylyl cyclase. Selective pharmacological stimulation and inhibition of adenylyl cyclase isoforms. J Biol Chem 2001;276:47785–47793 [DOI] [PubMed] [Google Scholar]
- 43.Berg J, Hung YP, Yellen G. A genetically encoded fluorescent reporter of ATP:ADP ratio. Nat Methods 2009;6:161–166 [DOI] [PMC free article] [PubMed] [Google Scholar]
- 44.Diraison F, Parton L, Ferré P, et al. Over-expression of sterol-regulatory-element-binding protein-1c (SREBP1c) in rat pancreatic islets induces lipogenesis and decreases glucose-stimulated insulin release: modulation by 5-aminoimidazole-4-carboxamide ribonucleoside (AICAR). Biochem J 2004;378:769–778 [DOI] [PMC free article] [PubMed] [Google Scholar]
- 45.Eizirik DL, Sammeth M, Bouckenooghe T, et al. The human pancreatic islet transcriptome: expression of candidate genes for type 1 diabetes and the impact of pro-inflammatory cytokines. PLoS Genet 2012;8:e1002552. [DOI] [PMC free article] [PubMed] [Google Scholar]
- 46.Bramswig NC, Everett LJ, Schug J, et al. Epigenomic plasticity enables human pancreatic α to β cell reprogramming. J Clin Invest 2013;123:1275–1284 [DOI] [PMC free article] [PubMed] [Google Scholar]
- 47.Parton LE, McMillen PJ, Shen Y, et al. Limited role for SREBP-1c in defective glucose-induced insulin secretion from Zucker diabetic fatty rat islets: a functional and gene profiling analysis. Am J Physiol Endocrinol Metab 2006;291:E982–E994 [DOI] [PubMed] [Google Scholar]
- 48.Bosco D, Armanet M, Morel P, et al. Unique arrangement of alpha- and beta-cells in human islets of Langerhans. Diabetes 2010;59:1202–1210 [DOI] [PMC free article] [PubMed] [Google Scholar]
- 49.Elayat AA, el-Naggar MM, Tahir M. An immunocytochemical and morphometric study of the rat pancreatic islets. J Anat 1995;186:629–637 [PMC free article] [PubMed] [Google Scholar]
- 50.Roger B, Papin J, Vacher P, et al. Adenylyl cyclase 8 is central to glucagon-like peptide 1 signalling and effects of chronically elevated glucose in rat and human pancreatic beta cells. Diabetologia 2011;54:390–402 [DOI] [PubMed] [Google Scholar]
- 51.Willoughby D, Cooper DM. Organization and Ca2+ regulation of adenylyl cyclases in cAMP microdomains. Physiol Rev 2007;87:965–1010 [DOI] [PubMed] [Google Scholar]
- 52.Rutter GA, Tsuboi T, Ravier MA. Ca2+ microdomains and the control of insulin secretion. Cell Calcium 2006;40:539–551 [DOI] [PubMed] [Google Scholar]
- 53.Dyachok O, Isakov Y, Sågetorp J, Tengholm A. Oscillations of cyclic AMP in hormone-stimulated insulin-secreting beta-cells. Nature 2006;439:349–352 [DOI] [PubMed] [Google Scholar]
- 54.Marchetti P, Lupi R, Bugliani M, et al. A local glucagon-like peptide 1 (GLP-1) system in human pancreatic islets. Diabetologia 2012;55:3262–3272 [DOI] [PubMed] [Google Scholar]
- 55.Holz GG. Epac: A new cAMP-binding protein in support of glucagon-like peptide-1 receptor-mediated signal transduction in the pancreatic beta-cell. Diabetes 2004;53:5–13 [DOI] [PMC free article] [PubMed] [Google Scholar]
- 56.Miki T, Minami K, Shinozaki H, et al. Distinct effects of glucose-dependent insulinotropic polypeptide and glucagon-like peptide-1 on insulin secretion and gut motility. Diabetes 2005;54:1056–1063 [DOI] [PubMed] [Google Scholar]
Associated Data
This section collects any data citations, data availability statements, or supplementary materials included in this article.