Significance
What makes the difference when sound propagation is investigated in a crystal or in a glass? One hundred years ago, Debye rationalized the former case in terms of phonons. In contrast, years of effort have failed to provide a convincing picture for vibrations in disordered solids. We provide a contribution to this issue by reporting clear evidence that a mechanical feature, elastic heterogeneity at the nanoscale, profoundly affects the main properties and even the very nature of sound waves. Our picklock is the numerical study of a toy model that, at fixed macroscopic thermodynamical conditions, allows to investigate in a unified framework the perfect crystal, increasingly defective ordered phases, and the fully developed amorphous state.
Keywords: elasticity, amorphous materials, molecular dynamics simulation, vibrational properties, sound transport
Abstract
In the recent years, much attention has been devoted to the inhomogeneous nature of the mechanical response at the nanoscale in disordered solids. Clearly, the elastic heterogeneities that have been characterized in this context are expected to strongly affect the nature of the sound waves which, in contrast to the case of perfect crystals, cannot be completely rationalized in terms of phonons. Building on previous work on a toy model showing an amorphization transition, we investigate the relationship between sound waves and elastic heterogeneities in a unified framework by continuously interpolating from the perfect crystal, through increasingly defective phases, to fully developed glasses. We provide strong evidence of a direct correlation between sound wave features and the extent of the heterogeneous mechanical response at the nanoscale.
In crystals, molecules thermally oscillate around the periodic lattice sites and vibrational excitations are well understood in terms of quantized plane waves, the phonons (1). The vibrational density of states (vDOS) in the low-frequency regime is well described by the Debye model, where the vibrational modes are the acoustic phonons. In contrast, disordered solids, including structural glasses and disordered crystals, exhibit specific vibrational properties compared with the corresponding pure crystalline phases. It is not possible here to give a fair review of the extensive theoretical and experimental work generated by these issues; we therefore mention below a few facts that we consider the most relevant in the present context. The origin of the vDOS modes in excess over the Debye prediction around ω ∼1 THz, the so-called Boson peak (BP), is still debated (see, among many others, refs. 2 and 3). At the BP frequency, ΩBP, localized modes have also been observed (4). Acoustic plane waves, which are exact normal modes in crystals, can still propagate in disordered solids. Indeed, at low frequencies, Ω, and long wavelengths, Λ, acoustic sound waves do not interact with disorder and can propagate conforming to the expected macroscopic limit. However, as Ω is increased beyond the Ioffe–Regel (IR) limit, ΩIR, acoustic excitations interact with the disorder and are significantly scattered (5–7). Interestingly, this strong scattering regime occurs around the BP position, ΩIR ∼ ΩBP (8, 9). The exact origin of this phenomenon and its connection to the BP remain elusive.
A possible rationalization of the above issues is based on the existence of elastic heterogeneities (10), which can originate from structural disorder, as in structural glasses (2), or disordered interparticle potentials, even in lattice structures such as disordered colloidal crystals (11). In the heterogeneous-elasticity theory of refs. 7 and 12 this amounts to consider spatial statistical fluctuations of the shear modulus. Within the framework of jamming approaches and using effective medium theories, elastic heterogeneities are related to the proximity of local elastic instabilities (13). Recent simulation work (14–16) has clearly demonstrated their existence in disordered solids. This is at variance with the case of simple crystals, which are characterized by a fully affine response and homogeneous moduli distributions (17). More specifically, in the large length scale limit, macroscopic moduli are observed. In contrast, as the length scale is reduced, moduli heterogeneities are detected, at a typical length scale ξ ≃ 10−15σ (15), where σ is the typical atomic diameter. Breakdown of both continuum mechanics (18) and Debye approximation (5, 6) has been demonstrated at the same mesoscopic length-scale ξ, where they are still valid for crystals. Remarkably, the wave frequency corresponding to the wavelength Λ ∼ ξ is very close to ΩIR ∼ ΩBP (19). Altogether these results indicate that a close connection must exist between elastic heterogeneities and acoustic excitations. In this paper we precisely address this point.
In ref. 20 we considered a numerical model featuring an amorphization transition (21). We showed how to systematically deform the local moduli distributions, evaluated by coarse-graining the system in small domains of linear length scale w. We characterized the degree of elastic heterogeneity in terms of SD of those distributions and studied the effect on normal modes (eigenvalues of the Hessian matrix) and thermal conductivity. Building on that work, we are now in the position to investigate the relation between elastic heterogeneities and acoustic excitations, unifying in a single framework ordered and disordered solid states and considering quantities directly probed by experiments. By interpolating in a controlled way from perfect crystals, through increasingly defective phases, to fully developed amorphous structures, we (i) calculate the dynamical structure factors, extracting the relevant spectroscopic parameters; (ii) characterize the wave vector dependence of sound velocity and broadening of the acoustic excitations and clarify their nature in terms of the IR limit; and (iii) provide, for the first time to our knowledge, direct evidence of the correlation of the excitations lifetimes and ΩIR with the magnitude of the elastic heterogeneities.
Results
We study by molecular dynamics simulation in the NVT ensemble, at constant temperature T = 0.01 and number density (V being the system volume), a 50: 50 mixture, composed by N atoms with different diameters, σ1 and σ2, and same mass, m = 1. We consider two different system sizes N = 108,000 and 256,000, to improve statistics and wave vector range and confirm that results are not affected by finite-size effects. Particles interact via a soft-sphere potential, vαβ = ε(σαβ/r)12, with σαβ = (σα + σβ)/2 and α, β ∈ 1,2. The potential is cut off and shifted at r = 2.5σαβ. In a one component approximation, we define an “effective” diameter (22). Starting from a perfect face-centered cubic crystal, defects are added in the form of size disorder, by simultaneously decreasing σ1 below the initial value σ1 = 1 and increasing σ2, keeping a constant σeff ≡ 1 (21). The size ratio, λ = σ1/σ2 ≤ 1, quantifies the size disorder and is our control parameter. λ = 1 corresponds to the perfect crystal case, whereas for λ = 0.7 a completely developed amorphous structure is observed. An amorphization transition occurs at λ = λ* ≃ 0.81 (20, 21). Additional details can be found in ref. 20. Simulations have been realized by using the large-scale, massively parallel molecular dynamics computer simulation code LAMMPS (23).
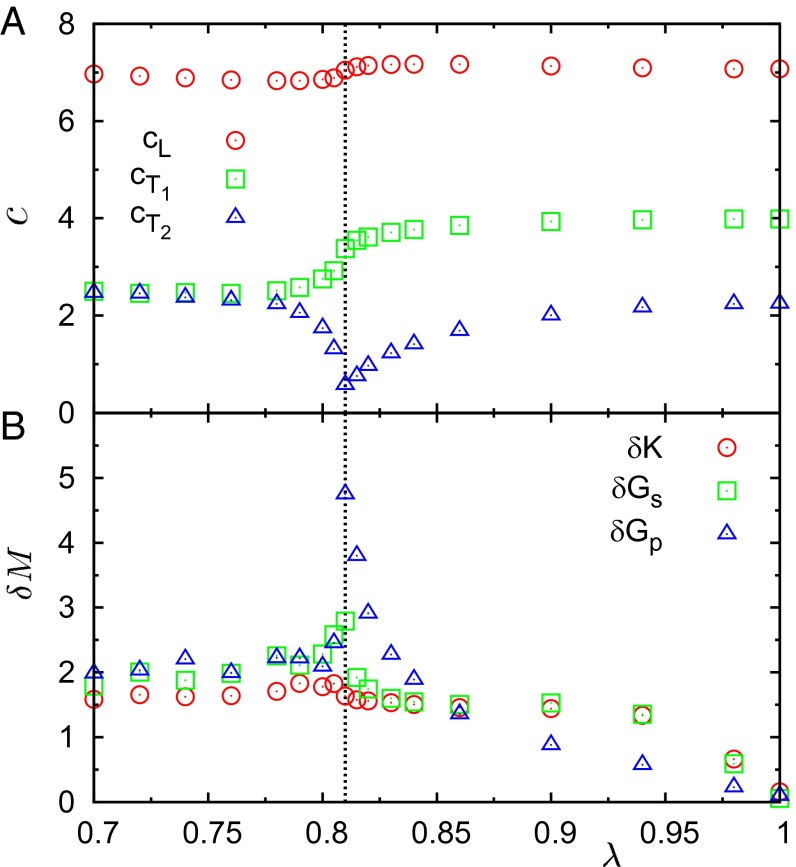
We first focus on the acoustic sound velocities in the macroscopic limit. In crystals, sound propagation depends on the direction of the wave vector, (1). This is at variance with the isotropic amorphous phases, where only the wave vector modulus is relevant. In the macroscopic limit, the q-independent sound velocity is , where ρ is the mass density and Meff is an effective macroscopic modulus that depends on both the direction of propagation and the longitudinal or transverse character of the excitation. In what follows we will consider the (110) direction, with Meff = K + Gp/3 + Gs, Gs, and Gp, for the longitudinal (L) and the two transverse (T1 and T2) branches, respectively. Here K, Gp, and Gs are the bulk, pure shear, and simple shear moduli, respectively (16). Additional results for the (100) and (111) directions are reported in Supporting Information. In Fig. 1A we show the λ dependence of c for the three branches. For λ > λ*, , and both slowly follow the decrease of λ. At λ*, , which can be associated with an elastic instability controlled by Gp (20). For λ < λ*, decreases whereas increases, and both reach the same values in the fully developed amorphous state, as expected. Note that glass and pure crystal show very similar in the macroscopic limit. Finally, in the entire λ range the overall variation of cL is very mild.
Fig. 1.
Macroscopic limit of sound velocities and width of the distributions of local elastic moduli. (A) λ dependence of the longitudinal (L) and transverse (T1 and T2) macroscopic sound velocities in the (110) direction. These data have been calculated from the effective elastic moduli K + Gp/3 + Gs, Gs, and Gp, respectively. Here K, Gp, and Gs are the bulk, pure shear, and simple shear moduli, respectively. The vertical dashed line indicates the transition point λ = λ* ≃ 0.81. (B) λ dependence of the elastic heterogeneities, δM, associated to K, Gs, and Gp. These data are the SDs of the distribution of the local elastic moduli for a coarse-graining length scale w = 3.16 (20).
In Fig. 1B we also display the λ dependence of the SD, δM, calculated from the probability distributions of the local moduli, M = K, Gs, and Gp, respectively. These can be evaluated by coarse-graining the system in little cubic domains, of linear size w = 3.16 in this case (20). Starting from a spatially homogeneous distribution at λ = 1, δGp undergoes very important modifications, strongly increasing by decreasing λ, reaching a maximum at λ*, and abruptly decreasing to a stable low value on the amorphous side. δGs follows a qualitatively similar behavior, while quantitatively less important, and the expected degeneracy is recovered in the amorphous phases. Finally, longitudinal data also undergo variations similar to those of δGs for λ ≥ 0.82, eventually staying almost unchanged across the transition.
Moving from the macroscopic limit, we now investigate the wave-vector dependence of the dynamic structure factors,
| [1] |
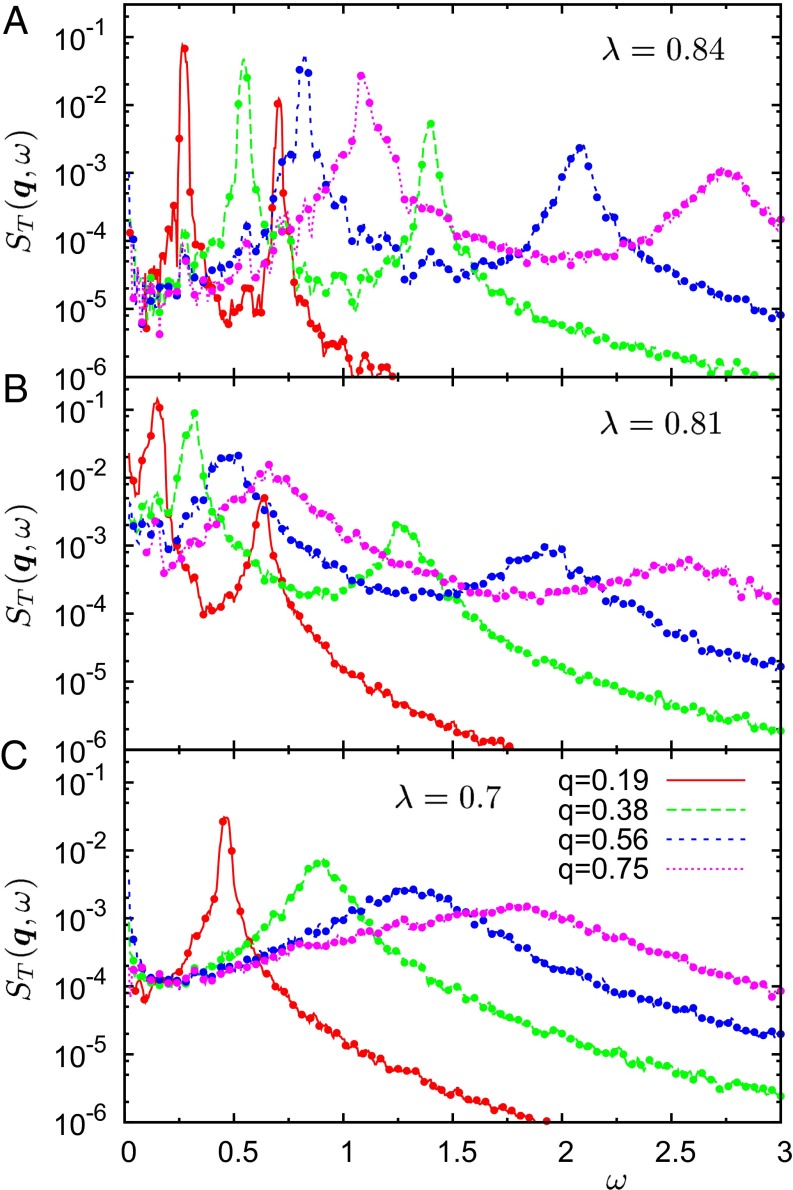
where a = L, T and and are the longitudinal and transverse momentum currents, respectively (6, 9). It is by now consensual that transverse modes play the most important role in determining anomalies in vibrational properties (9). More specifically, the transverse branch with the lowest elastic modulus has been demonstrated to be the one that correlates most to the low-frequency vibrational states (20). In what follows we therefore focus on the T2 excitations. Additional data for the T1 and L modes are included in Supporting Information. In Fig. 2 we plot at the indicated values of λ and q. For λ = 0.84 and 0.81, where the two transverse sound velocities are well separated (Fig. 1A), features two Brillouin peaks corresponding to T1 (high-ω) and T2 (low-ω) excitations, respectively. In contrast, a single Brillouin peak is visible, as expected, in the amorphous phase at λ = 0.7, where .
Fig. 2.
Transverse dynamic structure factors, , at the indicated values of the wave vector in the (110) direction, calculated from Eq. 1. Three values of λ are shown, in a defective crystal state (A), at the amorphisation transition (B), and in the fully developed glassy phase (C). Two Brillouin peaks, corresponding to the T1 and T2 branches, are visible for λ = 0.84 and 0.81. In the glassy phase (λ = 0.7) only one degenerate excitation survives.
Propagation frequency, , and line broadening, , of the sound excitations can be extracted from these data by fitting the spectral region around the Brillouin peaks to a damped harmonic oscillator model (6, 9),
| [2] |
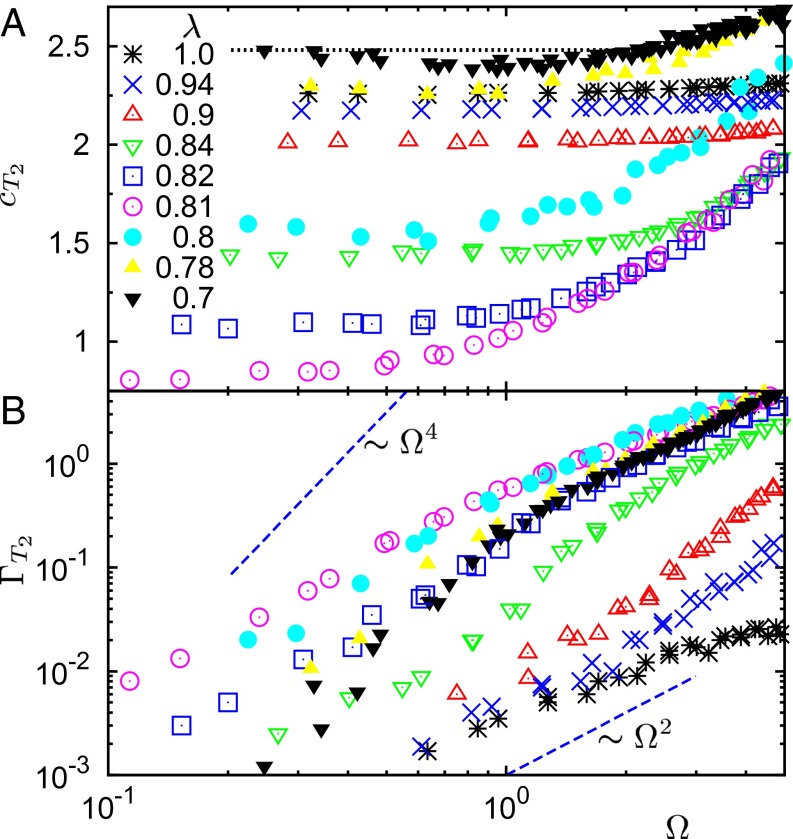
In Fig. 3 we show the sound velocity, , and broadening, , of the T2 excitations at the indicated values of the disorder parameter λ. For the sake of clarity, we consider first the isotropic amorphous case, λ = 0.7. As expected, for vanishing Ω, corresponds to the macroscopic value of Fig. 1A (horizontal dashed line), calculated directly from the value of Gp at the same λ value. Next, decreases (softening), reaches a minimum, and eventually undergoes positive dispersion at higher frequencies. In the same region where shows a minimum, a cross-over from ∼Ω2 at high frequency [which can be described by a two-mode Maxwell constitutive model (24)] to a Rayleigh-like ∼Ωα with α close to 4 at intermediate frequency is evident for around Ω ≃ 1, which corresponds to ΩBP in this case (20). Both these features are consistent with previous findings for the Lennard-Jones glass (6, 7).
Fig. 3.
Spectroscopic parameters calculated from the dynamic structure factors . (A) Transverse phase velocity, , and (B) broadening, , for the T2 excitations at the indicated values of λ. These data have been obtained by fitting the calculated to the damped harmonic oscillator line shape of Eq. 2. The horizontal dashed line in A corresponds to the macroscopic limit of the sound velocity at λ = 0.7. The dashed lines ∝ Ω2 and ∝ Ω4 in B are also guides for the eye, to emphasize the extremely complex frequency dependence of at different values of λ. A comprehensive discussion of these data is included in the text.
As λ increases, the sound velocity at a given frequency first decreases, goes through a minimum at λ* ≃ 0.81, and eventually increases steadily. We note that the maximum ratio ≃3.5 between the maximum and minimum value (as a function of frequency) is reached at λ*, whereas is essentially frequency independent at λ ≥ 0.9, where the Debye picture still holds. Therefore, mirrors at all frequencies the nonmonotonic behavior of the macroscopic limit of Fig. 1A. Sound broadening follows a quite different pattern. As λ increases from 0.7, is enhanced and reaches a maximum at λ*. Next, it is strongly suppressed for λ > λ*, converging to a very low value at λ = 1, of anharmonic origin (damping). We remark that in this case the ratio between the maximum and minimum values reached covers almost two decades at Ω ≃ 1. We will see below that this finding can be rationalized in terms of a strong correlation with the magnitude of the elastic heterogeneity associated with the appropriate modulus (Fig. 1B).
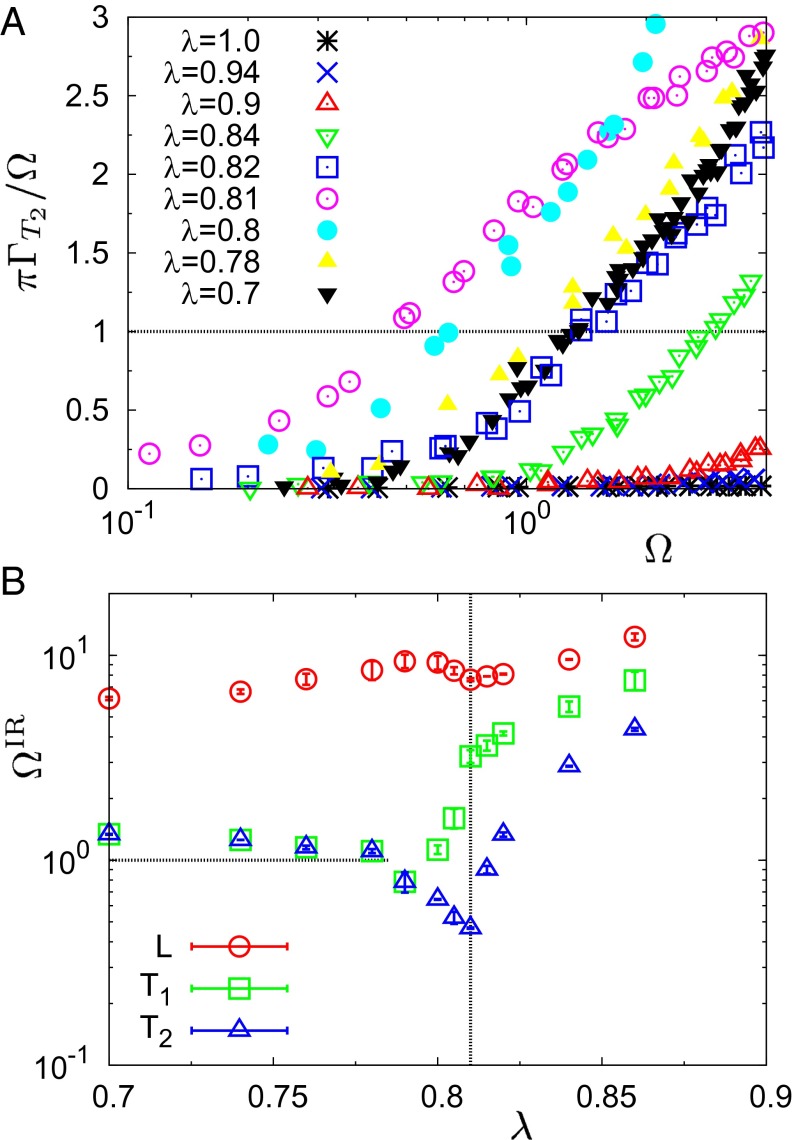
Next, we focus on the IR limit, , for all investigated λ’s. In Fig. 4A we propose a different representation of the data points of Fig. 3, as the ratio . At the IR limit, (i.e., the decay time of the excitations equals half of the corresponding vibrational period). provides an upper bound for the validity of acoustic-like descriptions of the vibrational excitations. The λ dependence of presents again an interesting nonmonotonous pattern, which we make quantitative in Fig. 4B. Here we plot the extracted from the above data, together with our results of and for the other two branches T1 and L. Starting from the pure crystal, where is expected to be comparable to the highest frequency comprised in the vDOS, the IR limit decreases steadily with λ in all cases, reaches a minimum at λ* for T2 and L (in the T1 case continuously decreases through the transition), and levels off to a constant value on the amorphous side. For the two transverse branches, this value corresponds to the ΩBP position, whereas for the longitudinal mode , as already shown in refs. 6 and 9. Note that a recent study (25) reported that the nature of the BP depends on the Poisson ratio, ν: For fragile glasses with relatively high ν > 0.25, (transverse IR limit) (6, 9), whereas for strong glasses with lower ν < 0.2, (longitudinal IR limit) (8). We have checked that our soft-sphere model is a fragile system, with ν ≃ 0.43 for λ ≤ 0.78, which is consistent with these findings. Unfortunately, for λ > λ* we were not able to determine reliably the value of ΩBP. However, in ref. 20 (Figs. 3B and 4) we showed that ΩBP shifts to lower frequencies as λ tends to λ* from above and increases back to higher frequencies below the transition. This behavior clearly mirrors the pattern followed by in Fig. 4B, implying the lowest-frequency T2 excitations are most related to the BP. Therefore, we can conjecture that above the transition also.
Fig. 4.
Characterization of the IR limit. (A) Ratio for the T2 excitations, calculated from the data of Fig. 3, at the indicated values of λ. The frequency corresponding to the intersection of each dataset with the horizontal line at the value 1 defines the IR limit, . (B) λ dependence of extracted from the above data, corresponding to the T2 branch. We also show and for the longitudinal (L) and higher transverse (T1) branches, respectively. The vertical line indicates the transition point λ* ≃ 0.81. The horizontal line corresponds to the BP position, ΩBP ≃ 1, for the amorphous phases at λ ≤ 0.78.
Discussion
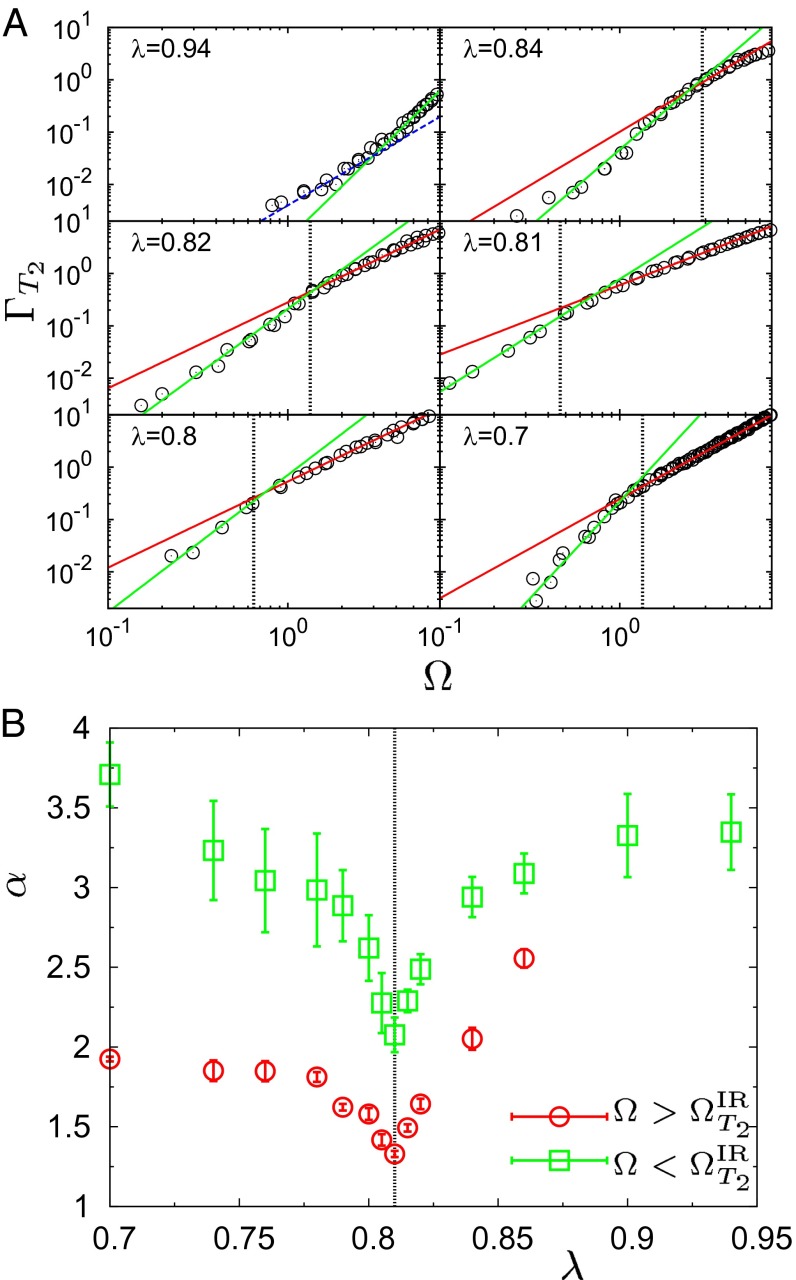
The data shown in Fig. 3B acquire even more interest in light of the above discussion of the IR limit. Indeed, the shape of the functions significantly changes with λ and follows quite complex patterns. These show, at frequencies close to , clear cross-overs between regimes with different effective exponents, α, at high and intermediate frequencies (6). The expected low-frequency cross-over to the ≃Ω2 behavior owing to anharmonicity can be recognized for λ ≥ 0.94 (also see the blue dashed line in Fig. 5A), whereas it cannot be observed for lower values of λ at the considered temperature. In Fig. 5A the red and green solid lines are the best power-law fits to the data, in the high and intermediate frequency ranges, respectively. The positions of are indicated by the vertical dashed lines, for the cases λ < 0.94. For λ = 0.94, is already close to the highest frequency comprised in the vDOS. The obtained values of the exponents α in the two regimes are shown in Fig. 5B. For , and for the deeply amorphous state λ = 0.7, α ≃ 3.7, compatible with the expected Rayleigh scattering exponent α = 4. By increasing λ, α first decreases steadily by reaching the value 2 at λ* and next increases up to a value ≃3.5 at λ = 0.94. For , we recover the expected value α = 2 in the amorphous phase (24), which decreases quite abruptly, reaching a value ≃1.5 at λ*. Subsequently, α increases to a value close to 2.5 at λ = 0.86. These data, in particular those corresponding to the high-frequency branch, provide information similar to that of ref. 26. There, it was shown by a quite involved analysis that frustration seems to control the value of α. More precisely, α ≃ 4 when frustration is absent and decreases even below the value 2 by increasing frustration. This is consistent with our findings, which, however, provide a broader picture, including predictions on the low-frequency values. Note that, at variance with ref. 26, here we can refer to topologically ordered and disordered systems described by the same family of Hamiltonians.
Fig. 5.
Frequency dependence of broadening for the T2 excitations at the investigated values of λ . (A) Ω dependence of the broadening at the indicated values of λ. Red and green solid lines are the best power-law fits of the form ≃Ωα to the data in the high and intermediate frequency ranges, respectively. is indicated by the vertical dashed lines in all cases except λ = 0.94, where is comparable to the highest frequency comprised in the vDOS. For λ = 0.94, the low-frequency cross-over to the anharmonic ≃Ω2 behavior is indicated by the blue dashed line. (B) Values of the exponents α extracted from the best fit to the data in A for the high (circles) and intermediate (squares) frequency ranges, respectively. A detailed discussion of these data is included in the text.
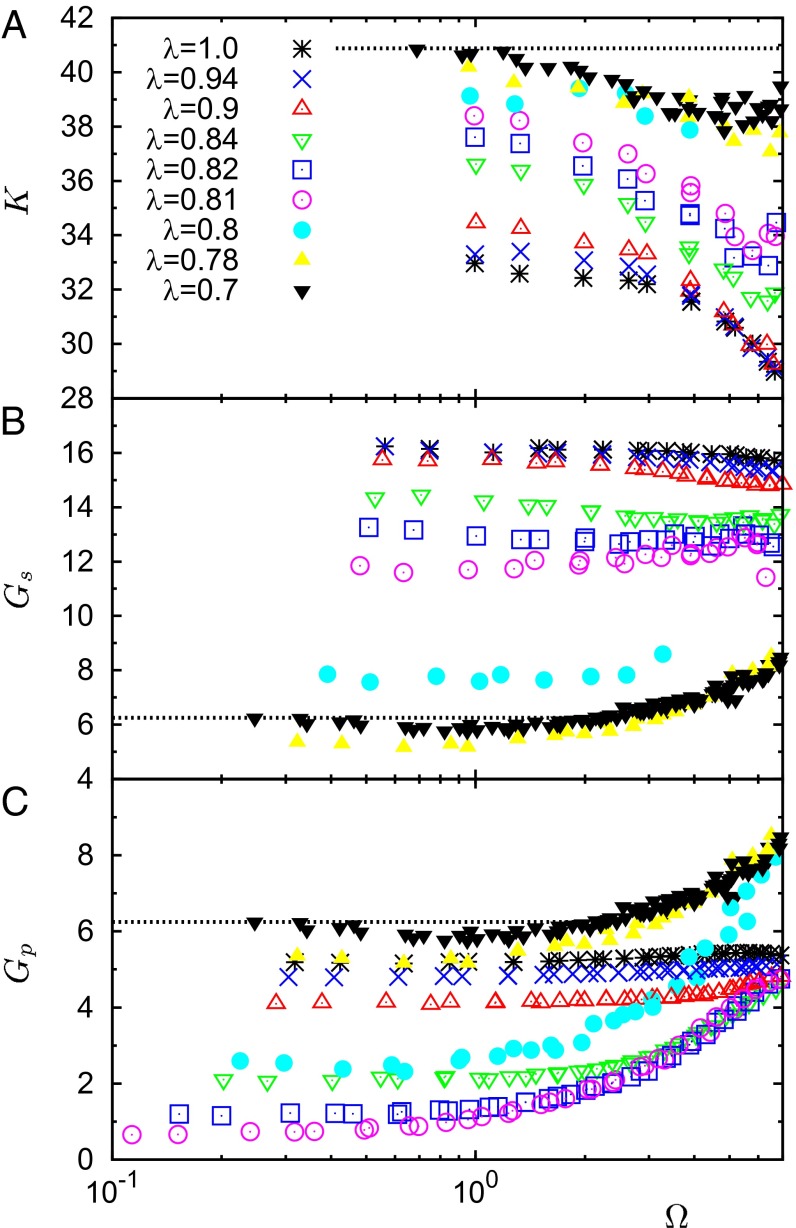
The above complex behavior of the sound velocities certainly has a nontrivial impact on the frequency-dependent macroscopic elastic response. Indeed, we plot in Fig. 6 the frequency dependence of the bulk (Fig. 6A), simple shear (Fig. 6B), and pure shear (Fig. 6C) moduli, at the indicated values of λ. These have been obtained by our data for the sound velocities as , , and , respectively. We focus on the extreme cases of the pure crystal and the completely developed glass. In the first case, the shear moduli are frequency independent, as expected, up to frequencies where they start to slightly decrease, following the bending of the respective sound velocities when approaching the first Brillouin zone. The data for the bulk modulus K follow a similar scenario with a more pronounced decrease for Ω ≥ 4. More intriguing is the result for the glass case, λ = 0.7. Here the shear moduli mirror the behavior of the respective sound velocities, with softening followed by an increase at higher frequencies. In contrast, the bulk modulus K seems to undergo a cross-over at Ω ≃ ΩBP ≃ 1 from the constant macroscopic value to a clear frequency-dependent (decreasing) behavior. This result is at variance with what was reported in refs. 6 and 7, where a frequency-independent bulk modulus was proposed. This also originated a simple scaling relation between the longitudinal and transverse sound velocities, which is not fulfilled here. This discrepancy could probably be reconciled by referring to a nontrivial role played by the details of the interaction potential, or of the implemented polydispersity. Certainly it imposes an important caveat on the universality of approaches based on the hypothesis of a spatially homogeneous bulk modulus (7, 12).
Fig. 6.
Frequency dependence of the macroscopic moduli (A) K(Ω), (B) Gs(Ω), and (C) Gp(Ω), calculated from the sound velocities, at the indicated values of λ. The horizontal dashed lines correspond to the values at Ω → 0 at λ = 0.7.
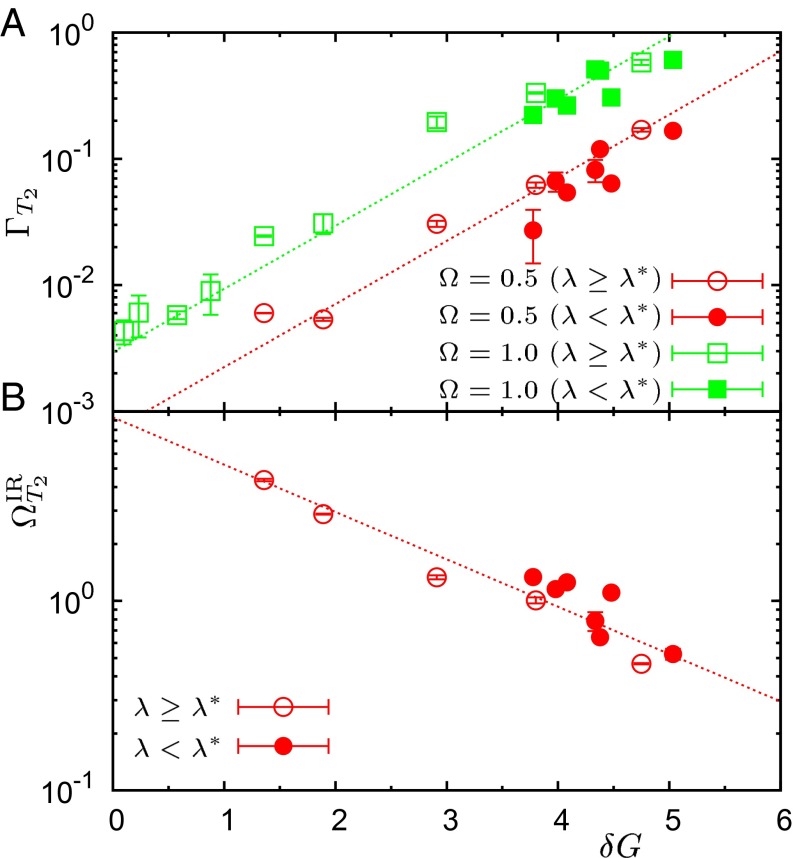
An additional challenge for future theoretical work comes from another very interesting feature emerging from our results. The total variation of the IR limit for the T2 branch on approaching λ* from above is very large (an order of magnitude), and apparently is (anti-) correlated with the elastic heterogeneities of Fig. 1B. Above λ*, we noticed that the sound broadening also has a quite large overall variation and seems to follow the evolution of the elastic heterogeneities. We make quantitative these correlations in Fig. 7, which is the most relevant result of this work. In Fig. 7A we plot on both sides of the transition, at the low frequencies Ω ≃ 0.5 and 1, and as a function of the extent of the elastic heterogeneities at the corresponding λ (Fig. 1B). Whereas in the nondegenerate cases λ > λ* (open symbols) the appropriate data to consider are δG ≃ δGp, in the amorphous cases (filled symbols), where the transverse moduli are degenerate, we assume additivity of the disorder sources and use δG ≃ δGp + δGs. Remarkably, the data follow an exponential behavior for both frequencies. Similarly, we find (Fig. 7B) for both lattice and amorphous cases. Note that no adjustable parameters are involved in these plots. We can conservatively assert that these data are the first strong evidence to our knowledge of a direct correlation of quantities related to the intrinsic nature of acoustic-like excitations in ordered/defective/amorphous phases with local mechanical properties at the nanoscale (i.e., heterogeneity of the elastic moduli). We are convinced that important theoretical work will be needed in the future to precisely understand the origin and the possible universal character of the above particular functional form.
Fig. 7.
Direct correlation of features of acoustic-like excitations with local elastic heterogeneities. Here we show the dependence on the extent of the elastic heterogeneities of (A) broadening, , and (B) IR frequency, , for the T2 acoustic excitations. Data are plotted versus the SD δG of the distribution of the relevant local elastic modulus, calculated for a coarse-graining length scale w = 3.16 (see Fig. 1B). δG ≃ δGp for λ ≥ λ* (open symbols) and δG ≃ δGp + δGs for λ < λ* in the amorphous phases (closed symbols). A discussion of this point is included in the text. In A we plot values of corresponding to two different fixed frequencies, Ω ≃ 0.5 and Ω ≃ 1. Dashed lines are guides for the eye.
Conclusions
In summary, in this work we have investigated sound wave propagation in a numerical model featuring an amorphization transition. By controlling the extent of a well-designed form of size disorder we have been able to consider a panoply of different solid states of matter, ranging from the perfect crystal and increasingly defective lattice structures to completely amorphous phases. This approach can be seen as a numerical analog of experiments that compare scattering experiments on glasses and the corresponding (poly-) crystalline polymorphs (27, 28). By calculating the appropriate dynamical structure factors, we have fully characterized transverse and longitudinal vibrational excitations in terms of sound velocities and broadening, also providing a very detailed analysis of the complex frequency dependence of the latter. The frequency behavior of the macroscopic moduli has also been scrutinized, demonstrating an interesting (and unexpected) frequency-dependent bulk modulus for frequencies larger than ΩBP. This is at variance with previous results, owing to differences of the considered interaction potentials or to hasty conclusions, based on datasets less extended than those considered in the present work. Most important, both the lifetime and the IR limit of the sound-like excitations have been shown to directly correlate with the width of the distributions of local elastic moduli, both in the cases of lattice systems with defects and isotropic amorphous structures. The fact that elastic heterogeneities correlate with sound transport properties is very often referred to as evidence in the literature, but it has never actually been demonstrated. Our results therefore provide the first direct evidence to our knowledge that elastic heterogeneities crucially influence the most puzzling features in acoustic-like excitations in disordered systems, including strong scattering and BP. They also constitute a true challenge for important theoretical work in the near future.
Supplementary Material
Acknowledgments
This work was supported by the Nanosciences Foundation of Grenoble. J.-L.B. is supported by the Institut Universitaire de France. Most of the computations presented in this paper were performed using the Froggy platform of the CIMENT infrastructure (https://ciment.ujf-grenoble.fr), which is supported by the Rhône-Alpes region (Grant CPER07_13 CIRA) and the Equip@Meso project (Reference ANR-10-EQPX-29-01) of the program Investissements d’Avenir supervised by the Agence Nationale pour la Recherche.
Footnotes
The authors declare no conflict of interest.
This article is a PNAS Direct Submission. P.H. is a guest editor invited by the Editorial Board.
This article contains supporting information online at www.pnas.org/lookup/suppl/doi:10.1073/pnas.1409490111/-/DCSupplemental.
References
- 1.Kittel C. Introduction to Solid State Physics. 7th Ed. New York: Wiley; 1996. [Google Scholar]
- 2.Buchenau U, Nücker N, Dianoux AJ. Neutron scattering study of the low-frequency vibrations in vitreous silica. Phys Rev Lett. 1984;53(24):2316–2319. [Google Scholar]
- 3.Phillips WA. Amorphous Solids: Low Temperature Properties. 3rd Ed. Berlin: Springer; 1981. [Google Scholar]
- 4.Mazzacurati V, Ruocco G, Sampoli M. Low-frequency atomic motion in a model glass. Europhys Lett. 1996;34:681. [Google Scholar]
- 5.Monaco G, Giordano VM. Breakdown of the Debye approximation for the acoustic modes with nanometric wavelengths in glasses. Proc Natl Acad Sci USA. 2009;106(10):3659–3663. doi: 10.1073/pnas.0808965106. [DOI] [PMC free article] [PubMed] [Google Scholar]
- 6.Monaco G, Mossa S. Anomalous properties of the acoustic excitations in glasses on the mesoscopic length scale. Proc Natl Acad Sci USA. 2009;106(40):16907–16912. doi: 10.1073/pnas.0903922106. [DOI] [PMC free article] [PubMed] [Google Scholar]
- 7.Marruzzo A, Schirmacher W, Fratalocchi A, Ruocco G. Heterogeneous shear elasticity of glasses: The origin of the boson peak. Sci Rep. 2013;3:1407. doi: 10.1038/srep01407. [DOI] [PMC free article] [PubMed] [Google Scholar]
- 8.Rufflé B, Guimbretière G, Courtens E, Vacher R, Monaco G. Glass-specific behavior in the damping of acousticlike vibrations. Phys Rev Lett. 2006;96(4):045502. doi: 10.1103/PhysRevLett.96.045502. [DOI] [PubMed] [Google Scholar]
- 9.Shintani H, Tanaka H. Universal link between the boson peak and transverse phonons in glass. Nat Mater. 2008;7(11):870–877. doi: 10.1038/nmat2293. [DOI] [PubMed] [Google Scholar]
- 10.Duval E, Mermet A. Inelastic x-ray scattering from nonpropagating vibrational modes in glasses. Phys Rev B. 1998;58:8159–8162. [Google Scholar]
- 11.Kaya D, Green NL, Maloney CE, Islam MF. Normal modes and density of states of disordered colloidal solids. Science. 2010;329(5992):656–658. doi: 10.1126/science.1187988. [DOI] [PubMed] [Google Scholar]
- 12.Schirmacher W, Ruocco G, Scopigno T. Acoustic attenuation in glasses and its relation with the boson peak. Phys Rev Lett. 2007;98(2):025501. doi: 10.1103/PhysRevLett.98.025501. [DOI] [PubMed] [Google Scholar]
- 13.DeGiuli E, Lerner E, Brito C, Wyart M. 2014. The distribution of forces affects vibrational properties in hard sphere glasses. arXiv:1402.3834.
- 14.Yoshimoto K, Jain TS, Van Workum K, Nealey PF, de Pablo JJ. Mechanical heterogeneities in model polymer glasses at small length scales. Phys Rev Lett. 2004;93(17):175501. doi: 10.1103/PhysRevLett.93.175501. [DOI] [PubMed] [Google Scholar]
- 15.Tsamados M, Tanguy A, Goldenberg C, Barrat JL. Local elasticity map and plasticity in a model Lennard-Jones glass. Phys Rev E Stat Nonlin Soft Matter Phys. 2009;80(2):026112. doi: 10.1103/PhysRevE.80.026112. [DOI] [PubMed] [Google Scholar]
- 16.Mizuno H, Mossa S, Barrat JL. Measuring spatial distribution of the local elastic modulus in glasses. Phys Rev E Stat Nonlin Soft Matter Phys. 2013;87(4):042306. doi: 10.1103/PhysRevE.87.042306. [DOI] [PubMed] [Google Scholar]
- 17.Wagner H, et al. Local elastic properties of a metallic glass. Nat Mater. 2011;10(6):439–442. doi: 10.1038/nmat3024. [DOI] [PubMed] [Google Scholar]
- 18.Wittmer JP, Tanguy A, Barrat JL, Lewis L. Vibrations of amorphous, nanometric structures: When does continuum theory apply? Europhys Lett. 2002;57:423. [Google Scholar]
- 19.Leonforte F, Boissière R, Tanguy A, Wittmer JP, Barrat JL. Continuum limit of amorphous elastic bodies. iii. Three-dimensional systems. Phys Rev B. 2005;72:224206. [Google Scholar]
- 20.Mizuno H, Mossa S, Barrat JL. Elastic heterogeneity, vibrational states, and thermal conductivity across an amorphisation transition. EPL. 2013;104:56001. [Google Scholar]
- 21.Bocquet L, Hansen JP, Biben T, Madden P. Amorphization of a substitutional binary alloy: A computer ‘experiment’. J Phys Condens Matter. 1992;4:2375. [Google Scholar]
- 22.Bernu B, Hansen JP, Hiwatari Y, Pastore G. Soft-sphere model for the glass transition in binary alloys: Pair structure and self-diffusion. Phys Rev A. 1987;36(10):4891–4903. doi: 10.1103/physreva.36.4891. [DOI] [PubMed] [Google Scholar]
- 23.Plimpton S. Fast parallel algorithms for short-range molecular dynamics. J Comput Phys. 1995;117:1–19. [Google Scholar]
- 24.Mizuno H, Yamamoto R. General constitutive model for supercooled liquids: Anomalous transverse wave propagation. Phys Rev Lett. 2013;110(9):095901. doi: 10.1103/PhysRevLett.110.095901. [DOI] [PubMed] [Google Scholar]
- 25.Duval E, Deschamps T, Saviot L. Poisson ratio and excess low-frequency vibrational states in glasses. J Chem Phys. 2013;139(6):064506. doi: 10.1063/1.4817778. [DOI] [PubMed] [Google Scholar]
- 26.Angelani L, Montagna M, Ruocco G, Viliani G. Frustration and sound attenuation in structural glasses. Phys Rev Lett. 2000;84(21):4874–4877. doi: 10.1103/PhysRevLett.84.4874. [DOI] [PubMed] [Google Scholar]
- 27.Chumakov AI, et al. Role of disorder in the thermodynamics and atomic dynamics of glasses. Phys Rev Lett. 2014;112(2):025502. doi: 10.1103/PhysRevLett.112.025502. [DOI] [PubMed] [Google Scholar]
- 28.Baldi G, et al. Emergence of crystal-like atomic dynamics in glasses at the nanometer scale. Phys Rev Lett. 2013;110(18):185503. doi: 10.1103/PhysRevLett.110.185503. [DOI] [PubMed] [Google Scholar]
Associated Data
This section collects any data citations, data availability statements, or supplementary materials included in this article.


