

Significance
Tradeoffs are a basic assumption in evolutionary models. Demonstrating their prevalence has been difficult, however. In this work, we used large-scale experimental evolution with bacteria to assess the prevalence of fitness tradeoffs after high-temperature stress adaptation. Combining measurements of phenotypic variation with genome-scale approaches, our work shows that some populations adapt with fitness tradeoffs at low temperatures, whereas others adapt without a measurable tradeoff. The presence or absence of tradeoffs is associated in part with two different adaptive genetic pathways to thermal stress. Overall, our work provides insights into the prevalence of tradeoffs and the underlying genetic complexities that contribute to them.
Keywords: RNA polymerase, Rho factor, genotype–phenotype associations, experimental evolution
Abstract
Fitness tradeoffs are often assumed by evolutionary theory, yet little is known about the frequency of fitness tradeoffs during stress adaptation. Even less is known about the genetic factors that confer these tradeoffs and whether alternative adaptive mutations yield contrasting tradeoff dynamics. We addressed these issues using 114 clones of Escherichia coli that were evolved independently for 2,000 generations under thermal stress (42.2 °C). For each clone, we measured their fitness relative to the ancestral clone at 37 °C and 20 °C. Tradeoffs were common at 37 °C but more prevalent at 20 °C, where 56% of clones were outperformed by the ancestor. We also characterized the upper and lower thermal boundaries of each clone. All clones shifted their upper boundary to at least 45 °C; roughly half increased their lower niche boundary concomitantly, representing a shift of thermal niche. The remaining clones expanded their thermal niche by increasing their upper limit without a commensurate increase of lower limit. We associated these niche dynamics with genotypes and confirmed associations by engineering single mutations in the rpoB gene, which encodes the beta subunit of RNA polymerase, and the rho gene, which encodes a termination factor. Single mutations in the rpoB gene exhibit antagonistic pleiotropy, with fitness tradeoffs at 18 °C and fitness benefits at 42.2 °C. In contrast, a mutation within the rho transcriptional terminator, which defines an alternative adaptive pathway from that of rpoB, had no demonstrable effect on fitness at 18 °C. This study suggests that two different genetic pathways toward high-temperature adaptation have contrasting effects with respect to thermal tradeoffs.
Despite the centrality of adaptation to evolution, surprisingly little is known about the diversity of mutations that contribute to adaptation or about their phenotypic and fitness effects (1). There are, in fact, only a few well-known examples linking genotype, phenotype, and adaptation in nature (2–4). In nature, this connection is often complicated by factors such as varying selection pressures or underlying genetic heterogeneities. Although the task is difficult, the general inability to connect phenotype to genotype in the context of environmental adaptation has been a major failing in the field of evolution (5).
Experimental evolution provides a more tractable approach to study relationships among fitness, genotype, and phenotype (5, 6). Here we explore these relationships based on our recent, large-scale evolutionary experiment (7). The experiment began with an ancestral strain of Escherichia coli B that was inoculated into ∼115 independent replicates. Each replicate was grown at high temperature (42.2 °C) for 2,000 generations. At the end of the experiment, fitness was measured at 42.2 °C for a single clone from each of 114 lineages; on average, fitness increased ∼40% during the yearlong experiment.
We sequenced the genome of these 114 clones, identifying 1,258 mutations relative to the ancestral genome (7). Broadly speaking, the mutations fell into one of two “adaptive pathways.” The first and most common pathway included mutations in the RNA polymerase (RNAP) β subunit (rpoB) gene, along with associated changes in RNAP subunit genes (rpoA, rpoC, and rpoD) and the six rod genes that affect cell shape. The second adaptive pathway included mutations in the RNAP termination factor rho, which were positively associated with knockouts of the cardiolipin synthase (cls) gene and the transcription factor gene iclR. Mutations in the rpoB and rho adaptive pathways were not mutually exclusive, but mutations in the two pathways were strongly negatively associated (7).
Our thermal stress experiment has identified many putatively beneficial mutations that lead to higher fitness under thermal stress. However, we still do not know the phenotypic consequences of these mutations or their relationship with fitness. Do the apparently distinct adaptive pathways converge on similar phenotypes? Or might the two pathways defined by rho and rpoB lead to alternative phenotypic solutions to a common selective pressure?
Here we begin to address these questions by measuring a complex phenotype: the magnitude of fitness tradeoffs across a thermal gradient. Evolutionary tradeoffs, which are defined as reduced fitness in a nonselected environment, are of great interest in their own right; they are widely observed and frequently assumed to govern and constrain trait evolution (8, 9). For example, tradeoffs are commonly assumed in models of reaction norms and niche specialization (10–14).
Tradeoffs have been examined previously in the context of experimental evolution, particularly tradeoffs with respect to thermal niche (15–18). Thermal niche has been a focus because temperature is a fundamental environmental property that affects physiological traits and often defines species’ distributions (19, 20). Most of the experimental studies of thermal niche have revealed, somewhat surprisingly, that thermal tradeoffs are general but not universal. For example, of 24 E. coli lineages adapted to low temperature (20 °C), 15 (62%) exhibit reduced fitness at high temperature (40 °C) relative to their ancestor (17). Such observations are not limited to E. coli, because studies of the vesicular stomatitis virus also suggest that fitness tradeoffs are not universal across thermal gradients (18).
At least two questions remain about thermal tradeoffs. The first is whether previous results––i.e., that fitness tradeoffs are common but not universal––are accurate. The results may be inaccurate when there has been incomplete characterization of a thermal niche, which is defined as the range of temperatures over which an organism or genotype can maintain a stable population. To see this crucial point, it is helpful to visualize a thermal performance curve and some of its potential shifts during evolution to higher temperatures (Fig. 1) (13). In the niche-shift model, the organism adapts to high temperature by a horizontal shift of its niche (Fig. 1B). In a specialist–generalist model, the organism adapts to high temperature by reducing niche breadth and increasing maximal performance (Fig. 1C). Both of these models entail thermal tradeoffs, but in the latter model the tradeoff is visible only near the lower niche limit of the ancestral strain (13). Thus, careful characterization of niche limits is a necessary precursor to studying thermal tradeoffs.
Fig. 1.

Hypothetical evolutionary responses of adaptation to high temperature. (A) The thermal dynamics of an ancestral genotype (solid line). (B) The thermal dynamics of a clone (broken line) for which adaptation to high temperature includes a shift in thermal niche (niche-shift model). (C) Adaptation to high temperature (broken line) for which adaptation to high temperature includes a reduction in thermal niche (specialist–generalist model).
The second question concerns the underlying genetic causes of tradeoffs. In theory, tradeoffs may be caused either by antagonistic pleiotropy, in which a beneficial mutation in the selected environment has deleterious effects in nonselected environments (10, 11, 21, 22), or by the accumulation of mutations that are neutral in a selected environment but deleterious in other environments. Whatever the cause, tradeoffs have rarely been linked to specific genetic variants. One exception is a study of bacteriophage, in which a single adaptive mutation caused an increase in the breadth and height of the thermal reaction norm (23).
Here we characterize the thermal niche of 114 E. coli high-temperature adapted clones. To characterize thermal niche, we have measured both relative and absolute fitnesses over a range of temperatures. With these fitness data, we address the following sets of questions: First, are fitness tradeoffs common and, if so, are they universal? That is, do thermal niches shift during adaptation to thermal stress, or do they follow alternative dynamics? Second, are any genetic variants associated with particular thermal growth dynamics? If so, do the two alternative adaptive pathways have distinct phenotypic properties? Finally, can associations be confirmed with single, engineered mutations? If not, what might this imply about the underlying genetic complexities that contribute both to the evolution of thermal niche and to links between phenotype to genotype?
Results
Relative Fitnesses.
To characterize thermal niches and fitness tradeoffs, we measured both absolute and relative fitnesses. Relative fitnesses (wr) have been estimated previously in the context of thermal tradeoffs; we use them here to facilitate comparisons to previous work. In contrast, absolute fitnesses (wa) can be assessed in a high-throughput matter, thus providing a tool to carefully measure the thermal boundaries of growth.
Relative fitnesses were measured against the ancestral clone REL1206 (24) using standard competition assays (25). The assays were performed at both 20 °C and 37 °C, two temperatures that have been assessed in previous studies of E. coli thermal tradeoffs. Each of the 114 clones was tested in triplicate, with sixfold replication of a random subset of ∼30 clones. In total, we performed >800 fitness competitions, making this one of the largest studies of its kind.
At 37 °C the mean of wr estimates across all 114 high-temperature adapted clones was 0.973 (±0.008 95% confidence interval, CI), representing a significant and general 2.7% decline in fitness across the entire experiment (P = 4.0 × 10⁻⁹). For each clone, we also calculated the average of wr estimates across replicates () and tested the null hypothesis of wr = 1.0 (Fig. 2). At 37 °C, 31% of clones had significant fitness deficits ( < 1.0) relative to the ancestor (two-tailed t, df = 2, and P < 0.05). In contrast, one clone (clone #75; clone numbers correspond to ref. 7) had a fitness improvement of = 1.085 (P < 0.05). The remaining clones (68%) exhibited no significant difference in fitness compared with the ancestor at 37 °C (Table S1).
Fig. 2.

Mean relative fitnesses of high-temperature evolved clones at 20 °C and at 37 °C. Each point represents the average of three replicate relative fitness estimates for each clone. The dotted lines in each axis represent a relative fitness equal to 1.0 (i.e., no difference between the evolved clone and ancestor). Empty circles represent clones with wr not significantly different from 1.0 at 20 °C and 37 °C. Filled symbols indicate wr significantly <1.0 at the indicated temperature(s), based on two- tailed t tests (df = 2, P < 0.05). The black line represents the linear regression fitted to the data.
Fitness tradeoffs became more evident at 20 °C (Fig. 2). Across all 114 clones, the mean of wr estimates was 0.910 (±0.015 95% CI), representing a 9.0% decline in relative fitness across the entire experiment (P < 10−15). For individual clones, 56% of clones had < 1.0 at 20 °C. For one evolved clone (#107), the fitness impairment at 20 °C was so severe that the bacteria did not grow, yielding a fitness estimate of 0.0; another clone (#66) had a significantly higher fitness than the ancestor, with = 1.033. The remaining 42% of clones had values that were not detectably different from 1.0.
The availability of values for each clone at 42.2 °C (7), 37 °C, and 20 °C permitted quantitative analyses of fitness across temperatures. The values were not strongly correlated between 42.2 °C and either 20 °C (R2 = −0.009, P = 0.820) or 37 °C (R2 = 0.015, P = 0.101), suggesting that increases in wr at 42.2 °C are not necessarily associated with commensurate decreases in fitness at lower temperatures. In contrast, values were positively and significantly correlated between 20 °C and 37 °C (R = 0.208, P = 0.027; Fig. 2).
Characterization of Niche Boundaries.
The results suggest that tradeoffs are common but not universal, but does not provide information about the boundaries of the thermal niche. We therefore measured growth of the 114 clones at temperatures characteristic of the upper and lower niche boundaries. At each temperature, we measured bacterial density at the end of a daily growth cycle for four consecutive days and replicated the experiment three times. From these data, we estimated the absolute fitness () of each clone as the slope of fitted linear regression between time (day) and the natural logarithm of the density. We concluded that the bacterial populations “persisted” when the slope was not significantly <0.00.
Under our assay conditions, the ancestor persisted at 18 °C and 19 °C but not 17 °C (Table S2 and Fig. S1). Thus, the lower boundary of the ancestor’s thermal niche was between 17 °C and 18 °C. This lower boundary varied among the 114 high-temperature adapted clones (Fig. 3 and Table S2): 52% of clones were like the ancestor in their ability to persist at 18 °C; 35% had a lower growth limit at 19 °C; and 13% had a lower limit of 20 °C. As mentioned, clone #107 was unable to grow at 20 °C, representing a shift of >2 °C in its lower thermal niche. Note that at 20 °C was correlated with at 18 °C (R2 = 0.44, P = 4 × 10⁻¹⁶) and 19 °C (R2 = 0.40; P = 2 × 10⁻¹⁴), indicating that at 20 °C provides indirect information about lower niche boundaries.
Fig. 3.
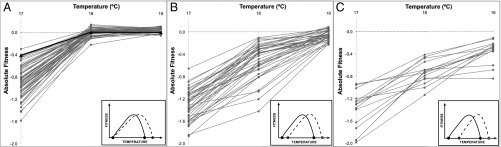
Mean absolute fitnesses of the ancestor and each of 114 high-temperature adapted clones at 17 °C, 18 °C, and 19 °C. (A) The ancestor (represented as a solid black line) and 59 evolved clones persist at 18 °C and 19 °C but not at 17 °C (absolute fitnesses <0.00). (B) The subset of clones that do not persist at 18 °C but maintain a stable population at 19 °C. (C) The 15 clones with absolute fitnesses <0.00 at all three temperatures. (Insets) Inferred thermal niche for each set of clones, based on the schema defined in Fig. 1.
For completeness, we also explored the upper niche boundary. All of the high-temperature adapted clones persisted at 43 °C, and 96% (109 of 114) persisted at 45 °C (Table S2 and Fig. S1). There was, however, no significant correlation between the relative fitness at 42.2 °C and the absolute fitness at 45 °C (R2 = −0.008, P = 0.730). This lack of correlation may partially reflect difficulties in measuring the upper niche limit. These difficulties were especially prevalent for the ancestral clone, which persisted at 42 °C but not at 43 °C ( = −0.133; 95% upper CI = −0.088) or 44 °C ( = −0.297; 95% upper CI = −0.116). Based on this information, we concluded that the upper thermal boundary of the ancestral REL1206 clone is ∼42 °C. Surprisingly, however, of the ancestor was negative ( = −0.290) but not significantly <0.00 at 45.0 °C (Table S2 and Fig. S1). This unexpected behavior was caused by the occasional sudden recovery of populations whose densities had initially declined markedly, a phenomenon known as the “Lazarus effect” (15, 26) (Fig. S2 and Discussion).
Genotype and Thermal Niche.
Our fitness assays characterize a complex phenotypic outcome to thermal stress. All of the evolved clones have expanded their upper niche boundary relative to the ancestor, and 49% exhibit a commensurate upward shift in their lower niche boundary. A remaining question is whether phenotypic variation in growth and fitness at low temperatures is associated with specific mutations.
To begin to address this question, we conducted an observational analysis to associate with genotypic variation. Recall that the genotypic data included full genomes with a total of >1,000 mutations, most of which were identified in only a single clone. Low-frequency mutations contain little information for associations, so we focused our analyses on the five most common mutations, which were found in ≥14 clones (Table 1 and Fig. S3). We associated the genotype for each mutation with at 18 °C. We chose 18 °C both because this temperature had the most variability in among our assay temperatures (Fig. S1 and Table S2) and because it clearly delineated two groups of clones: those that survive and those that decline to extinction (Fig. S4).
Table 1.
Five most common mutations and their associated effects on absolute fitness at 18.0 °C
| Mutation | Genomic position | Gene(s) affected | No.b | Coefficient (95% CI)c |
| rho I15Na | 3921335 | rho | 14 | 0.011 (−0.156, 0.177) |
| rpoB I966Sa | 4156827 | rpoB | 15 | −0.845 (−1.191, −0.500) |
| 23164 bp deletion | 2032562 | Multigenic | 21 | 0.016 (−0.203, 0.235) |
| 1 bp deletion | 2131465 | Intergenic | 25 | −0.004 (−0.240, 0.241) |
| 71416 bp deletion | 547700 | Multigenic | 35 | −0.011 (−0.351, 0.328) |
Nonsynonymous point mutation.
The number of times the mutation was found in 114 independently evolved clones.
The coefficient represents the contribution of the mutation to the absolute fitness; it is provided along with an associated 95% confidence interval.
For all five mutations, we fitted a linear regression model that controls for the presence of cooccurring mutations (i.e., background effects; SI Materials and Methods). Applying this approach, we found that the rpoB I966S mutation contributed to the model; its presence was associated with a significant decrease in relative to lines that do not have this mutation (Table 1). Indeed, 10 of 15 clones that harbored this mutation had significantly <0.0 at 18 °C (Fig. S5). Interestingly, three rpoB I966S clones contained a second mutation in rpoB (T539P). Two of these lines were persistent at 18 °C, and as a group the three rpoB I966S/T539P clones had a higher average , at −0.233, than the remaining 11 rpoB I966S lines at −0.538. These observations suggest that the rpoB T539P mutation has a compensatory effect on rpoB I966S.
Of the remaining four mutations, none yielded a significant association with decreased at 18 °C (Table 1 and Fig. S5). However, we believe the lack of association to be meaningful for rho I15N, because 13 of 14 clones that harbored this mutation persisted at 18 °C (Fig. S5). The probability of randomly choosing a set of 14 clones––without respect to genotype and for which 13 or more do not exhibit a 18 °C tradeoff––is small (P ∼ 0.001).
Direct Tests of Genotype–Phenotype Associations.
Association analyses suggest that fitness tradeoffs at 18 °C are associated with the rpoB I966S mutation but not with the rho I15N mutation. Can a single mutation lead to a thermal shift? And, do mutations that define alternative adaptive pathways lead to different thermal tradeoff dynamics? To address these questions, we engineered rpoB I966S and rho I15N mutations into the REL1206 background. For each of the two mutants, we assessed at 20 °C, 37 °C, and 42.2 °C, and at 18 °C (Table 2). The results indicate that the rpoB I996S mutant has: (i) a lowered and borderline significant inability to persist at 18 °C ( = −0.035; upper CI = 0.043), as suggested by our association analyses, (ii) a decreased at 20 °C ( = 0.929; P = 0.046), (iii) a strong benefit (= 1.373) at 42.2 °C, and (iv) no detectable effect on relative fitness at 37 °C ( = 0.990; P = 0.793). These observations are consistent with this single mutation conferring a shift in thermal niche. In contrast, we could not detect a thermal tradeoff for the rho I15N mutation at any temperature nor, in fact, could we detect a fitness benefit at 42.2 °C (Table 2).
Table 2.
Fitness estimates for single mutations
| Mutant | Fitness estimate | |||
| 18 °Ca | 20 °Cb | 37 °Cb | 42 °Cb | |
| rpoB I966S | −0.035 (0.043) | 0.929 (±0.068)* | 0.990 (±0.155) | 1.373 (±0.188)* |
| rpoB I572F | −0.206 (-0.089)* | 0.910 (±0.060)* | 0.956 (±0.117) | 1.170 (±0.135)* |
| rpoB I572L | −0.308 (-0.132)* | 0.928 (±0.047)* | 0.954 (±0.067)• | 1.176 (±0.138)* |
| rpoB I572N | −0.229 (-0.073)* | 0.946 (±0.074)• | 1.003 (±0.104) | 1.172 (±0.154)* |
| rho I15N | 0.022 (0.091) | 1.018 (±0.079) | 1.000 (±0.010) | 0.949 (±0.272) |
Mean absolute fitness with 95% upper limit CI. An asterisk corresponds to an absolute fitness significantly <0.00.
Mean relative fitness ± 95% CI. The asterisks represent significant deviation from the null hypothesis that mean fitness equals 1.0, with one asterisk denoting significance at P < 0.05 and a dot denoting 0.05 < P < 0.1.
Because the rpoB I966S mutation yielded tradeoff dynamics, we questioned whether the effect was specific to the I966S mutation or perhaps a general property of mutations within the rpoB gene. To address this issue, we measured fitnesses for three additional rpoB single mutants: rpoB I527F, rpoB I527N, and rpoB I572L (27). As a group, these three mutations were found in 12 of the 114 clones, with the 2 most common found in 5 clones (7). Each of the three clones with a mutation in codon 572 exhibited decreased persistence at 18 °C as well as < 1.0 at 20 °C (Table 2).
Discussion
Tradeoffs are often assumed to be a ubiquitous feature of adaptation (10–12). Of course ubiquity is difficult to test precisely, because in theory tradeoffs may affect a wide range of unknown or unsuspected phenotypes. The characterization of tradeoffs is nonetheless important, both because they may constrain evolutionary trajectories and because they also potentially affect the “evolvability” of a system (28–30). Here we have examined fitness tradeoffs across a thermal gradient, based on 114 E. coli clones that are adapted to high temperature (42.2 °C). These clones have been shown to adapt through mutations in two adaptive pathways, one defined by mutations in RNAP subunits and another typified by mutations in the Rho termination factor (7). An open question is whether these alternative adaptive pathways converge on the same phenotypes, including the same types and magnitudes of tradeoffs.
Shifts and Expansions of Thermal Niche.
To characterize tradeoffs and thermal niches, we have examined both relative and absolute fitnesses across a range of temperatures. We detect 2.7% and 9.0% decreases in relative fitness at 37 °C and 20 °C, respectively, across the combined sample of 114 clones. Although these values signal a general tradeoff effect, our results also suggest variance among clones. At 37 °C, for example, tradeoffs in relative fitness are common but not universal; 31% of clones exhibit values significantly <1.0. The results at 20 °C are similar to those at 37 °C but exaggerated, in that a higher proportion of clones (56%) exhibit statistically significant reductions in relative fitness. Both of these proportions could be underestimates because our assays were based on a number of replicates (n = 3) that may limit statistical power. When we assess this proportion with more replication (n = 6) for a subset of 30 lines, we detect slightly higher proportions, at 32% and 73% for 37 °C and 20 °C, respectively. Overall, however, our results support previous conclusions that thermal tradeoffs are general but not universal (17).
Full categorization of tradeoffs requires characterization of niche boundaries, because models of niche evolution predict tradeoffs close to these boundaries (10–13, 31) (Fig. 1). Empirical data have demonstrated this as well. For example, when the performance of bacteriophages ϕX174 and G4 were measured over a wider temperature range than initial work, additional tradeoffs were discovered (16). We have therefore assessed the thermal boundaries of the 114 clones.
At the upper end of the thermal niche, most (>95%) of the clones persist at 45 °C, signaling an expansion of their niche at least 2 °C beyond that of the ancestor (Fig. 1B). This observation contrasts with a previous study in which only one of six 42 °C-adapted lines expanded their upper thermal limit (15) but suggests a degree of “preadaptation” to temperatures beyond the clones’ immediate experience. Above 45 °C the analyses become complicated by the Lazarus effect, in which declining populations suddenly recover, presumably due to major effect mutations. Indeed, the ancestral clone, which is habituated to laboratory conditions of 37 °C, does not persist at 43 °C but often recovers at 45 °C (Fig. S2). We do not yet know the molecular processes underlying the Lazarus effect, but two seem possible: either the fitness effects of mutations change as a function of the intensity of stress (32, 33) or the mutation rate increases under high stress (33, 34). We do not yet know which of these two mechanisms predominates.
We also assessed persistence at lower temperatures. We have found, similar to a previous study (15), that our REL1206 ancestor persists at 18 °C but not 17 °C, and thus its lower niche boundary is ∼18 °C in our culture conditions. Like the ancestor, none of the 114 clones persists at 17 °C, but 52% persist at 18 °C. This group of evolved clones exhibits an expansion of their thermal range relative to the ancestor, because their lower limit is unchanged but their upper limit has shifted by at least two degrees.
Niche expansions in constant environments are generally not predicted by evolutionary theory (13). Models such as the niche-shift model and the specialist–generalist model (Fig. 1) assume that the total area under the fitness function is constant (10, 11). Therefore, if there is an expansion, it should be associated with decreased performance throughout much of the thermal gradient (11, 13, 35). We do observe some such decreases in at 20 °C, which is consistent with these predictions, but we do not detect fitness decreases at 37 °C for the majority of clones. Moreover, the subset of clones with an expanded thermal range did not consistently have the lowest relative fitness values at 20 °C, 37 °C, or 42.2 °C, as is expected under these models (11). Finally, niche models predict a quantitative relationship between the magnitude of improvement at high temperature (42.2 °C) and the magnitude of tradeoffs at lower temperatures. We tested for correlations in fitness between high and lower temperatures but did not detect the expected correlations.
The remaining subset of 48% clones has shifted, rather than expanded, their thermal niche by increasing both their upper and lower thermal limits (Fig. 1B). Such niche shifts have been predicted by evolutionary theory (13) and imply the existence of tradeoffs, which we demonstrated directly by showing that a shift in lower thermal limit is correlated with relative fitness tradeoffs at 20 °C. Surprisingly, although most clones have either shifted or expanded their thermal niche, only one clone (#107) has reduced thermal range (Fig. 1C).
Genetics, Adaptive Pathways, and Thermal Tradeoffs.
Broadly speaking, we have found two phenotypes among our 114 clones: niche shift vs. niche expansion. For a subset of clones the difference between these two phenotypes is explained by single mutations. Niche shift is associated with mutations in rpoB, and niche expansion may be associated with at least one mutation in rho. As mentioned, these two genes typify alternative adaptive pathways in our thermal stress experiment (7). Taken together, these results imply that the two adaptive pathways define (and constrain) alternative fitness trajectories. Consistent with this conjecture, fitnesses at low temperatures vary significantly between the set of 60 and 26 clones containing rpoB and rho mutations, respectively. For example, wa at 18 °C has an average value of −0.370 across rpoB clones and −0.138 for rho clones (P = 0.014); similarly, average wr at 20 °C is 0.892 for the set of rpoB mutants and 0.946 for the rho mutants (P = 0.015).
Thus, the two alternative adaptive pathways confer different tradeoff effects, but questions about mechanisms remain. Because the elongation speed of RNAP increases with increasing temperature (36), we hypothesize that adaptive mutations in rpoB slow RNAP transcription under thermal stress, leading to increased termination efficiency (37). We have no direct evidence of this effect for the rpoB I966S mutation, which is located in one of the two parallel α-helices of the Eco flap domain (Fig. S6) (38). However, mutations in other locations of RNAP, including residues in rpoB codon 572, have been linked to changes in termination efficiency (39, 40).
The rho I15N mutation is located in the second α-helix from the N terminus (Fig. S6). No mutations have been observed in this residue, but a mutation in a nearby residue (L3F) has been linked to an increase of termination efficiency of the Rho protein (41). We therefore hypothesize that I15N also increases termination efficiency. If true, this implies that increased termination efficiency can be achieved either by slowing RNAP (via mutations in rpoB) or by enhancing Rho termination. Under this scenario, negative epistasis between rho and rpoB mutations (7) may be explained by the sets of mutations “overtuning” termination (39).
This conjecture does not readily explain the difference in tradeoff dynamics between rpoB and rho mutants (Table 2). The explanation may lie with pleiotropic effects. RNAP mutants have the capacity to affect the expression of every gene, but rho influences termination in a subset of 20–50% of E. coli genes (42, 43). Because rpoB has the potential for more pleiotropic interactions, it likely also has a higher probability to generate fitness tradeoffs via antagonistic pleiotropy.
Background Effects and Epistasis.
Although the precise mechanism of adaptation remains uncertain, our studies show that adaptive trajectories are profoundly affected by the identity of individual mutations and by interactions among these mutations. For example, the three alternative amino acid replacements within rpoB codon 572 vary in fitness effects among one another, across nutrient conditions, and against genetic backgrounds (27, 30, 32, 44). The background effect is particularly dramatic: when these mutations are introduced into E. coli K12, they are strongly disadvantageous at 42.2 °C (27) but confer ∼20% fitness benefits in REL1206 (Table 2). Background effects need not be driven by differences as pronounced as those between E. coli B and K12. For example, our association analyses suggest that the tradeoff bestowed by rpoB I966S may be compensated by a single additional rpoB mutation (T539P). Although the potential compensatory effects of the T539P mutation have not yet been confirmed by functional analyses, our results suggest that the presence, absence, and potential compensation of thermal tradeoffs may be encoded by single nucleotide mutations.
It is somewhat puzzling that we do not detect a beneficial effect of the rho I15N mutation (Table 2), because the presence of this mutation across 14 of 114 lines argues strongly that it is advantageous under the conditions of the thermal stress experiment. One explanation may be statistical power––i.e., the mutation may be beneficial but at a level too low to be detected in a single competition assay. However, given that we detect differences of <3% in this study and also that the estimate of at 42.2 °C is <1.00 (Table 2), we do not believe that statistical power is the sole explanation. Instead, we hypothesize that rho I15N may not be beneficial by itself, as studied here, but rather beneficial only in the presence of other interacting mutations. In short, we predict sign epistasis between rho I15N and associated mutations. A likely candidate for positive epistatic interactions is the cls gene, which was mutated in 11 of the 14 rho I15N containing lines. Mutations within cls significantly increase membrane fluidity (45), but it is difficult to hypothesize how this phenotype might interact with rho mutations. Although the presence of sign epistasis between mutations is common (46, 47), our predictions about epistatic interactions between rho and cls need to be followed by functional studies.
Overall, our experiments demonstrate dramatic phenotypic variation with respect to thermal niche and fitness tradeoffs in 114 clones that have been subjected to thermal stress for 2,000 generations. We have also shown that some of these phenotypes can be recapitulated with single base substitutions and that therefore at least some tradeoffs are generated by antagonistic pleiotropy. Although it thus seems that the genetics underlying fitness tradeoffs are straightforward in this system, our data hint at much additional genetic complexity that includes: (i) similar but slightly different tradeoffs encoded by different mutations in the same gene (e.g., rpoB I572N vs. I966S; Table 2), (ii) mutations that may compensate for pleiotropic tradeoffs, (iii) widespread epistatic interactions, and (iv) alternative fitness trajectories defined by different adaptive pathways. Given the breadth of these complexities in a well-controlled experimental system, it is no wonder that the mapping of genotype, phenotype, and fitness continues to be a daunting task in natural populations.
Materials and Methods
Fitness Estimates.
We examined the 114 adapted clones from ref. 7 and estimated relative fitness for each clone at 20 °C and 37 °C, following ref. 25. We performed two-tailed t tests to test for a fitness difference relative to the ancestor. Absolute fitness (wa) was estimated at 17 °C, 18 °C, 19 °C, 43 °C, and 45 °C using a protocol similar to ref. 15 (SI Materials and Methods). Clones were propagated daily by serial transfer (100-fold dilution) for 4 d at the assay temperature. Bacterial density was measured each day by Coulter count. Absolute fitness was calculated as the slope of the fitted linear regression between the natural logarithm of the density against time, based on three replicates. If wa was significantly <0.0, based on a one-sided 95% CI, we concluded that the clone was declining toward extinction. In contrast, if wa was not significantly <0.0, we concluded that the clone could persist at that temperature.
Strain Construction and Confirmation of Recombinants.
Single mutations were introduced into the rpoB and rho genes of the ancestral strain REL1206 using a recombineering plasmid similar to pKD46 (48). Because the rpoB (I966S) and the rho (I15N) mutations lack a selectable phenotype, we cointroduced one selectable marker (Ara+) with the nonselectable mutation and used the Ara+ marker as a first-pass selective screen on minimal medium supplemented with arabinose (Table S3). The presence of the second, nonselectable mutation in the rpoB or rho gene was monitored with Sanger sequencing. Additional details are provided in SI Materials and Methods.
Genetic Associations.
Associations were based on the dataset of mutations from ref. 7. Our approach was first to identify the clones that harbor our focal set of the most common mutations. We then defined clusters of mutations that cooccur with the focal set. Given these clusters, we fit a fixed effects linear model by combining a cluster incidence matrix with absolute fitness data from 18 °C (Fig. S7). The model fitted a regression line for each clone, with the slope of the regression given by the sum of the individual slope coefficients of the cooccurring mutations in that clone. We selected a final model based the lowest Akaike Information Criterion score. The model yielded both , a measure of the effect of the presence of mutation on absolute fitness, and a 95% CI of the estimate. All numerical and statistical analyses were performed using R version 3.0.2. Additional details are provided in SI Materials and Methods.
Supplementary Material
Acknowledgments
We thank P. McDonald and R. Gaut for technical assistance; O. Tenaillon, A. Long, and S. Hug for discussion; and two anonymous reviewers for comments. This work was supported by National Science Foundation Grant DEB-0748903 and by University of California Institute for Mexico and the United States-Consejo Nacional de Ciencia y Technología (Mexico) Fellowships to A.R.-V., D.C.-C., and A.G.-G.
Footnotes
The authors declare no conflict of interest.
*This Direct Submission article had a prearranged editor.
This article contains supporting information online at www.pnas.org/lookup/suppl/doi:10.1073/pnas.1406886111/-/DCSupplemental.
References
- 1.Orr HA. The genetic theory of adaptation: a brief history. Nat Rev Genet. 2005;6(2):119–127. doi: 10.1038/nrg1523. [DOI] [PubMed] [Google Scholar]
- 2.Peichel CL, et al. The genetic architecture of divergence between threespine stickleback species. Nature. 2001;414(6866):901–905. doi: 10.1038/414901a. [DOI] [PubMed] [Google Scholar]
- 3.Hoekstra HE, Hirschmann RJ, Bundey RA, Insel PA, Crossland JP. A single amino acid mutation contributes to adaptive beach mouse color pattern. Science. 2006;313(5783):101–104. doi: 10.1126/science.1126121. [DOI] [PubMed] [Google Scholar]
- 4.Reed RD, et al. optix drives the repeated convergent evolution of butterfly wing pattern mimicry. Science. 2011;333(6046):1137–1141. doi: 10.1126/science.1208227. [DOI] [PubMed] [Google Scholar]
- 5.Barrett RDH, Hoekstra HE. Molecular spandrels: tests of adaptation at the genetic level. Nat Rev Genet. 2011;12(11):767–780. doi: 10.1038/nrg3015. [DOI] [PubMed] [Google Scholar]
- 6.Rose MR, Nusbaum T, Chippendale A. Laboratory Evolution: The Experimental Wonderland and the Cheshire Cat. Adaptation. San Diego: Academic; 1996. pp. 221–241. [Google Scholar]
- 7.Tenaillon O, et al. The molecular diversity of adaptive convergence. Science. 2012;335(6067):457–461. doi: 10.1126/science.1212986. [DOI] [PubMed] [Google Scholar]
- 8.Roff DA, Fairbairn DJ. The evolution of trade-offs: where are we? J Evol Biol. 2007;20(2):433–447. doi: 10.1111/j.1420-9101.2006.01255.x. [DOI] [PubMed] [Google Scholar]
- 9.Shoval O, et al. Evolutionary trade-offs, Pareto optimality, and the geometry of phenotype space. Science. 2012;336(6085):1157–1160. doi: 10.1126/science.1217405. [DOI] [PubMed] [Google Scholar]
- 10.Levins R. Evolution in Changing Environments: Some Theoretical Explorations. Princeton: Princeton Univ Press; 1968. [Google Scholar]
- 11.Lynch M, Gabriel W. Environmental tolerance. Am Nat. 1987;129(2):283–303. [Google Scholar]
- 12.Futuyma DJ, Moreno G. The evolution of ecological specialization. Annu Rev Ecol Syst. 1988;19:207–233. [Google Scholar]
- 13.Huey RB, Kingsolver JG. Evolution of thermal sensitivity of ectotherm performance. Trends Ecol Evol. 1989;4(5):131–135. doi: 10.1016/0169-5347(89)90211-5. [DOI] [PubMed] [Google Scholar]
- 14.Angilletta MJ, Wilson RS, Navas CA, James RS. Tradeoffs and the evolution of thermal reaction norms. Trends Ecol Evol. 2003;18(5):234–240. [Google Scholar]
- 15.Bennett AF, Lenski RE. Evolutionary adaptation to temperature II. Thermal niches of experimental lines of Escherichia coli. Evolution. 1993;47(1):1–12. doi: 10.1111/j.1558-5646.1993.tb01194.x. [DOI] [PubMed] [Google Scholar]
- 16.Holder KK, Bull JJ. Profiles of adaptation in two similar viruses. Genetics. 2001;159(4):1393–1404. doi: 10.1093/genetics/159.4.1393. [DOI] [PMC free article] [PubMed] [Google Scholar]
- 17.Bennett AF, Lenski RE. An experimental test of evolutionary trade-offs during temperature adaptation. Proc Natl Acad Sci USA. 2007;104(Suppl 1):8649–8654. doi: 10.1073/pnas.0702117104. [DOI] [PMC free article] [PubMed] [Google Scholar]
- 18.Alto BW, Wasik BR, Morales NM, Turner PE. Stochastic temperatures impede RNA virus adaptation. Evolution. 2013;67(4):969–979. doi: 10.1111/evo.12034. [DOI] [PubMed] [Google Scholar]
- 19.Somero GN. Temperature adaptation of enzymes: Biological optimization through structure-function compromises. Annu Rev Ecol Syst. 1978;9:1–29. [Google Scholar]
- 20.Cooper VS, Bennett AF, Lenski RE. Evolution of thermal dependence of growth rate of Escherichia coli populations during 20,000 generations in a constant environment. Evolution. 2001;55(5):889–896. doi: 10.1554/0014-3820(2001)055[0889:eotdog]2.0.co;2. [DOI] [PubMed] [Google Scholar]
- 21.Elena SF, Lenski RE. Evolution experiments with microorganisms: the dynamics and genetic bases of adaptation. Nat Rev Genet. 2003;4(6):457–469. doi: 10.1038/nrg1088. [DOI] [PubMed] [Google Scholar]
- 22.MacLean RC, Bell G, Rainey PB. The evolution of a pleiotropic fitness tradeoff in Pseudomonas fluorescens. Proc Natl Acad Sci USA. 2004;101(21):8072–8077. doi: 10.1073/pnas.0307195101. [DOI] [PMC free article] [PubMed] [Google Scholar]
- 23.Knies JL, Izem R, Supler KL, Kingsolver JG, Burch CL. The genetic basis of thermal reaction norm evolution in lab and natural phage populations. PLoS Biol. 2006;4(7):e201. doi: 10.1371/journal.pbio.0040201. [DOI] [PMC free article] [PubMed] [Google Scholar]
- 24.Bennett AF, Lenski RE, Mittler JE. Evolutionary adaptation to temperature. I. Fitness responses of Escherichia coli to changes in its thermal environment. Evolution. 1992;46(1):16–30. doi: 10.1111/j.1558-5646.1992.tb01981.x. [DOI] [PubMed] [Google Scholar]
- 25.Lenski RE, Rose MR, Simpson SC, Tadler SC. Long-term experimental evolution in Escherichia-coli.1. adaptation and divergence during 2,000 generations. Am Nat. 1991;138:1315–1341. [Google Scholar]
- 26.Mongold JA, Bennett AF, Lenski RE. Evolutionary adaptation to temperature. VII. Extension of the upper thermal limit of Escherichia coli. Evolution. 1999;53(2):386–394. doi: 10.1111/j.1558-5646.1999.tb03774.x. [DOI] [PubMed] [Google Scholar]
- 27.Rodríguez-Verdugo A, Gaut BS, Tenaillon O. Evolution of Escherichia coli rifampicin resistance in an antibiotic-free environment during thermal stress. BMC Evol Biol. 2013;13(50):1–11. doi: 10.1186/1471-2148-13-50. [DOI] [PMC free article] [PubMed] [Google Scholar]
- 28.Woods RJ, et al. Second-order selection for evolvability in a large Escherichia coli population. Science. 2011;331(6023):1433–1436. doi: 10.1126/science.1198914. [DOI] [PMC free article] [PubMed] [Google Scholar]
- 29.Pigliucci M. Is evolvability evolvable? Nat Rev Genet. 2008;9(1):75–82. doi: 10.1038/nrg2278. [DOI] [PubMed] [Google Scholar]
- 30.Barrick JE, Kauth MR, Strelioff CC, Lenski RE. Escherichia coli rpoB mutants have increased evolvability in proportion to their fitness defects. Mol Biol Evol. 2010;27(6):1338–1347. doi: 10.1093/molbev/msq024. [DOI] [PMC free article] [PubMed] [Google Scholar]
- 31.Kingsolver JG. The well-temperatured biologist. (American Society of Naturalists Presidential Address) Am Nat. 2009;174(6):755–768. doi: 10.1086/648310. [DOI] [PubMed] [Google Scholar]
- 32.Trindade S, Sousa A, Gordo I. Antibiotic resistance and stress in the light of Fisher’s model. Evolution. 2012;66(12):3815–3824. doi: 10.1111/j.1558-5646.2012.01722.x. [DOI] [PubMed] [Google Scholar]
- 33.Hietpas RT, Bank C, Jensen JD, Bolon DNA. Shifting fitness landscapes in response to altered environments. Evolution. 2013;67(12):3512–3522. doi: 10.1111/evo.12207. [DOI] [PMC free article] [PubMed] [Google Scholar]
- 34.Al Mamun AAM, et al. Identity and function of a large gene network underlying mutagenic repair of DNA breaks. Science. 2012;338(6112):1344–1348. doi: 10.1126/science.1226683. [DOI] [PMC free article] [PubMed] [Google Scholar]
- 35.Angilletta MJ, Jr, Niewiarowski PH, Navas CA. The evolution of thermal physiology in ectotherms. J Therm Biol. 2002;27:249–268. [Google Scholar]
- 36.Ryals J, Little R, Bremer H. Temperature dependence of RNA synthesis parameters in Escherichia coli. J Bacteriol. 1982;151(2):879–887. doi: 10.1128/jb.151.2.879-887.1982. [DOI] [PMC free article] [PubMed] [Google Scholar]
- 37.Jin DJ, Burgess RR, Richardson JP, Gross CA. Termination efficiency at rho-dependent terminators depends on kinetic coupling between RNA polymerase and rho. Proc Natl Acad Sci USA. 1992;89(4):1453–1457. doi: 10.1073/pnas.89.4.1453. [DOI] [PMC free article] [PubMed] [Google Scholar]
- 38.Opalka N, et al. Complete structural model of Escherichia coli RNA polymerase from a hybrid approach. PLoS Biol. 2010;8(9):e1000483. doi: 10.1371/journal.pbio.1000483. [DOI] [PMC free article] [PubMed] [Google Scholar]
- 39.Jin DJ, Walter WA, Gross CA. Characterization of the termination phenotypes of rifampicin-resistant mutants. J Mol Biol. 1988;202(2):245–253. doi: 10.1016/0022-2836(88)90455-x. [DOI] [PubMed] [Google Scholar]
- 40.Zhou YN, et al. Isolation and characterization of RNA polymerase rpoB mutations that alter transcription slippage during elongation in Escherichia coli. J Biol Chem. 2013;288(4):2700–2710. doi: 10.1074/jbc.M112.429464. [DOI] [PMC free article] [PubMed] [Google Scholar]
- 41.Mori H, Imai M, Shigesada K. Mutant rho factors with increased transcription termination activities. II. Identification and functional dissection of amino acid changes. J Mol Biol. 1989;210(1):39–49. doi: 10.1016/0022-2836(89)90289-1. [DOI] [PubMed] [Google Scholar]
- 42.Peters JM, et al. Rho directs widespread termination of intragenic and stable RNA transcription. Proc Natl Acad Sci USA. 2009;106(36):15406–15411. doi: 10.1073/pnas.0903846106. [DOI] [PMC free article] [PubMed] [Google Scholar]
- 43.Hollands K, Sevostiyanova A, Groisman EA. Unusually long-lived pause required for regulation of a Rho-dependent transcription terminator. Proc Natl Acad Sci USA. 2014;111(19):E1999–E2007. doi: 10.1073/pnas.1319193111. [DOI] [PMC free article] [PubMed] [Google Scholar]
- 44.Reynolds MG. Compensatory evolution in rifampin-resistant Escherichia coli. Genetics. 2000;156(4):1471–1481. doi: 10.1093/genetics/156.4.1471. [DOI] [PMC free article] [PubMed] [Google Scholar]
- 45.Sleight SC, Orlic C, Schneider D, Lenski RE. Genetic basis of evolutionary adaptation by Escherichia coli to stressful cycles of freezing, thawing and growth. Genetics. 2008;180(1):431–443. doi: 10.1534/genetics.108.091330. [DOI] [PMC free article] [PubMed] [Google Scholar]
- 46.Silva RF, et al. Pervasive sign epistasis between conjugative plasmids and drug-resistance chromosomal mutations. PLoS Genet. 2011;7(7):e1002181. doi: 10.1371/journal.pgen.1002181. [DOI] [PMC free article] [PubMed] [Google Scholar]
- 47.Chou HH, Delaney NF, Draghi JA, Marx CJ. Mapping the fitness landscape of gene expression uncovers the cause of antagonism and sign epistasis between adaptive mutations. PLoS Genet. 2014;10(2):e1004149. doi: 10.1371/journal.pgen.1004149. [DOI] [PMC free article] [PubMed] [Google Scholar]
- 48.Datsenko KA, Wanner BL. One-step inactivation of chromosomal genes in Escherichia coli K-12 using PCR products. Proc Natl Acad Sci USA. 2000;97(12):6640–6645. doi: 10.1073/pnas.120163297. [DOI] [PMC free article] [PubMed] [Google Scholar]
Associated Data
This section collects any data citations, data availability statements, or supplementary materials included in this article.