

Abstract
Background
Early-life exposure to environmental microbial agents may be associated with the development of allergies. The aim of the study was to identify better ways to characterize microbial exposure as a predictor of respiratory symptoms and allergies.
Methods
A birth cohort of 410 children was followed up until 6 years of age. Bacterial endotoxin, 3-hydroxy fatty acids, N-acetyl-muramic acid, fungal extracellular polysaccharides (EPS) from Penicillium and Aspergillus spp., β-D-glucan, ergosterol, and bacterial or fungal quantitative polymerase chain reactions (qPCRs) were analyzed from dust samples collected at 2 months of age. Asthma, wheezing, cough, and atopic dermatitis were assessed using repeated questionnaires. Specific IgEs were determined at the age of 1 and 6 years.
Results
Only few associations were found between single microbial markers and the studied outcomes. In contrast, a score for the total quantity of microbial exposure, that is, sum of indicators for fungi (ergosterol), Gram-positive (muramic acid) bacteria, and Gram-negative (endotoxin) bacteria, was significantly (inverted-U shape) associated with asthma incidence (P < 0.001): the highest risk was found at medium levels (adjusted odds ratio (aOR) 2.24, 95% confidence interval (95% CI) 0.87–5.75 for 3rd quintile) and the lowest risk at the highest level (aOR 0.34, 95% CI 0.09–1.36 for 5th quintile). The microbial diversity score, that is, sum of detected qPCRs, was inversely associated with risk of wheezing and was significantly (inverted-U shape) associated with sensitization to inhalant allergens.
Conclusion
Score for quantity of microbial exposure predicted asthma better than single microbial markers independently of microbial diversity and amount of dust. Better indicators of total quantity and diversity of microbial exposure are needed in studies on the development of asthma.
Keywords: asthma, atopy, children, microbial exposure, respiratory tract disease
Microbial exposure may contribute to the development of allergic diseases, but the role of different agents and mechanisms are still unknown (1). Most epidemiological studies with microbial exposure assessment among children have been restricted to studies on endotoxin (2) or have used only a limited set of microbial markers (3–7). These microbial markers reflect typically only a narrow part of the total microbial exposure. Recently, some studies have applied combined indicators of microbial exposure (8, 9), like diversity of microbes, which appears to have a protective effect on the development of asthma (8). Thus, there is a clear need to use combined indicators and other new approaches to describe exposure to environmental microbes.
The objective of this study was therefore to study prospectively the associations between several markers of environmental microbial exposure—including their combinations—and the development of doctor-diagnosed asthma, respiratory symptoms, atopic dermatitis, and sensitization up to the age of 6 years.
Methods
The study population consisted of children born in Eastern and Middle Finland: the first half of the study population (N = 214) belongs to a European birth cohort (PASTURE) (10) among farmers and nonfarmers, while the second half of the cohort is an extension to unselected children (N = 228) (11). Pregnant women were recruited, whose children were born between September 2002 and May 2005. The study protocol was approved by a local ethics committee in Finland (11). A written informed consent was obtained from the parents.
Follow-up
The first questionnaire was administered during the third trimester of pregnancy (11). The follow-up questionnaires (at the age of 2, 12, 18, and 24 months, and thereafter annually), except the questionnaire at 2 months, enquired about any wheezing, other respiratory symptoms apart from cold (wheezing, cough, nocturnal cough), and confounders for the time period after the preceding questionnaire. ‘Asthma ever’ was defined as first parent-reported doctor-diagnosed asthma and/or second diagnoses of asthmatic (or obstructive) bronchitis. ‘Current asthma’ was defined as those asthma ever cases who also reported the use of asthma medication and/or wheezing in past 12 months in the 6-year follow-up. ‘Atopic dermatitis ever’ was defined as first parent-reported doctor-diagnosed atopic dermatitis during the follow-up.
House dust samples
The protocols for dust collection are explained in detail in the Supplementary material. Briefly, in the Finnish PASTURE study, fieldworkers took two samples from living room floors for the present report. The first samples were processed without sieving at Utrecht University, where they were extracted and analyzed for endotoxin (as a marker of Gram-negative bacteria) and EPS as described previously (12), and the stored residue after extraction was later analyzed for β(1,3)-glucans (as a marker of fungal biomass) by heat extraction and inhibition enzyme immunoassay (EIA) (13). The second samples were processed and analyzed at National Institute for Health and Welfare (THL), where they were sieved to remove larger particles, dried, split and then stored, and finally analyzed for muramic acid (as a marker of Gram-positive bacteria), ergosterol (as a marker of fungal biomass), and lipopolysaccharide (LPS10:0–16:0) (as a marker of Gram-negative bacteria) by gas chromatography tandem mass spectrometry (GC-MS–MS) (14) and by quantitative polymerase chain reaction (qPCR) for microbial DNA (15–17).
In the extended cohort, results from only one dust sample from the living room floor collected by the families are used in the present report. The sample was sieved and dried at THL, then split in aliquots for various analyses: One aliquot was sent to Utrecht where it was extracted and analyzed for endotoxin, EPS, and β(1,3)-glucans (13), and other aliquots were analyzed for the chemical markers (muramic acid, ergosterol, LPS10:0–16:0) (14) and microbial DNA (15–17).
Quantitative polymerase chain reaction (qPCR) (15–17) was used to determine microbes that have been suggested to be common in moisture-damaged buildings: two genera of Gram-positive bacteria, Mycobacterium spp. and Streptomyces spp., and six fungal species, genera, or groups: the assay group for Aspergillus fumigatus/Neosartorya fischeri (AspNeo group); Cladosporium spp.; the combined assay group for Penicillium spp., Aspergillus spp., and Paecilomyces variotii (PenAsp group); Stachybotrys chartarum; Trichoderma viride/atroviride/koningii (Trichoderma viride group); and Wallemia sebi.
Exposure to all markers was expressed as loads, that is, the amount per m2 sampling surface. As the laboratory procedures determine concentrations (agents per mg dust), loads are calculated by multiplying the concentrations with the measured dust weight per m2. However, as endotoxin, EPS, and glucans in the PASTURE samples were determined in nonsieved dust, while all other analyses were performed with sieved dust, we calculated loads for the former parameters by multiplying with the load of sieved dust in the parallel sample taken for the other analyses. Weights for these parallel sieved and nonsieved dust samples in the Finnish PASTURE study showed a fair correlation (Spearman r = 0.7), but with a systematic difference: as expected, sieved dust samples contained on average 60% (95% CI 57, 64) less dust. Mean concentrations in sieved and nonsieved dust from nonfarm homes were, however, very similar, which suggests that endotoxin, EPS, or glucans are not preferentially bound to the smaller (sieved) or larger (removed by sieving) particle fractions.
Blood sampling
Venous blood samples collected at one (N = 374) and at 6 years of age (N = 304) were analyzed for specific immunoglobulin E (sIgE) to 13 inhalant (Dermatophagoides pteronyssinus, D. farinae, alder, birch, European hazel, grass pollen mixture, rye, mugwort, plantain, cat, horse and dog dander, and Alternaria alternata) and 6 food allergens (hen's egg, cow's milk, peanut, hazelnut, carrot, and wheat) (Mediwiss Analytic, Moers, Germany) (18). The cutoff levels for sIgE concentrations were 0.35 kU/l at one and 0.70 kU/l at 6 years of age. The higher cutoff was used at the age of 6 years due to high prevalence of sensitization (Table 1).
Table 1.
Incidence of doctor-diagnosed asthma and atopic dermatitis and the point prevalence of respiratory symptoms during the first 6 years and prevalence of sensitization to inhalant allergens at the age of 1 and 6 years
| At 1 year | At 1.5 years | At 2 years | At 3 years | At 4 years | At 5 years | At 6 years | |||||||||||||||
|---|---|---|---|---|---|---|---|---|---|---|---|---|---|---|---|---|---|---|---|---|---|
| N | n | % | N | n | % | N | n | % | N | n | % | N | n | % | N | n | % | N | n | % | |
| Asthma ever* | 389 | 6 | 1.5 | 353 | 9 | 2.6 | 332 | 14 | 4.2 | 291 | 15 | 5.2 | 271 | 9 | 3.3 | 257 | 6 | 2.3 | 247 | 3 | 1.2 |
| Current asthma† | 353 | 3 | 0.9 | 331 | 7 | 2.1 | 315 | 8 | 2.5 | 290 | 7 | 2.4 | 281 | 3 | 1.1 | 274 | 4 | 1.5 | 270 | 3 | 1.1 |
| Wheezing | |||||||||||||||||||||
| Apart from cold | 391 | 41 | 10.5 | 358 | 24 | 6.7 | 358 | 25 | 7.0 | 338 | 23 | 6.8 | 358 | 29 | 8.1 | 346 | 22 | 6.4 | 357 | 25 | 7.0 |
| Any | 391 | 91 | 23.3 | 358 | 58 | 16.2 | 358 | 67 | 18.7 | 339 | 65 | 19.2 | 358 | 68 | 19.0 | 348 | 46 | 13.2 | 357 | 51 | 14.3 |
| Cough | |||||||||||||||||||||
| Apart from cold | 391 | 98 | 25.1 | 358 | 66 | 18.4 | 358 | 85 | 23.7 | 338 | 80 | 23.7 | 357 | 91 | 25.5 | 348 | 87 | 25.0 | 357 | 94 | 26.3 |
| Nocturnal | 386 | 18 | 4.7 | 358 | 47 | 13.1 | 358 | 76 | 21.2 | 338 | 63 | 18.6 | 357 | 78 | 21.9 | 348 | 59 | 17.0 | 357 | 79 | 22.1 |
| Atopic dermatitis ever‡ | 390 | 61 | 15.6 | 300 | 24 | 8.0 | 265 | 12 | 4.5 | 230 | 14 | 6.1 | 211 | 9 | 4.3 | 199 | 7 | 3.5 | 188 | 2 | 1.1 |
| Sensitization to inhalant allergens§ | 374 | 78 | 20.9 | 304 | 115 | 37.8 | |||||||||||||||
N = in respirtory symptoms: total number of children with information on given symptom at each follow-up; in sensitization: total number of children with IgE results at a given time point; in asthma ever: total number of children at each follow-up who has information on asthma ever at each follow-up and has not censored from the follow-up due to onset of asthma ever; in current asthma: total number of children at each follow-up who has information on asthma ever and asthma medication/any wheezing at each follow-up and has not censored from the follow-up due to onset of current asthma; in atopic dermatitis ever: total number of children at each follow-up who has information on atopic dermatitis at each follow-up and has not censored from the follow-up due to onset of atopic dermatitis. n = the number of children with the presence of wheezing/cough symptom or with positive IgE result, or the number of newly diagnosed asthma/current asthma/atopic dermatitis cases at each follow-up.
Doctor-diagnosed asthma ever is defined as doctor-diagnosed asthma at least once and/or doctor-diagnosed asthmatic bronchitis more than once during the 6-year follow-up.
Current asthma is defined as asthma ever with asthma medication and/or wheezing symptom past 12 months at the age of 6 years.
Atopic dermatitis ever is defined as docotor-diagnosed astopic dermatitis during the follow-up.
Atopic sensitization is defined as any inhalant sIgE ≥0.35 kU/l at the age of 1 year and ≥0.70 kU/l at the age of 6 years.
Statistical analyses
Generalized estimating equations (GEE) with an exchangeable correlation structure to account for correlation between repeated measures within subjects were used to determine associations between microbial exposure and repeated measures of parent-reported wheezing and cough at different ages. Survival analyses (discrete-time hazard models) were used in analyzing asthma ever, current asthma, and atopic dermatitis ever. Logistic regression was used to analyze sensitization to inhalant allergens. The results are presented as adjusted odds ratios (aORs) and their 95% confidence intervals (95% CI).
In the analysis of single microbial markers, the amounts of dust and microbial markers were generally divided into three categories using tertiles as cutoffs. For Wallemia sebi, the lowest category consisted of levels below the limit of detection (37.4%) and the rest of the values were evenly divided into two groups (medium and high). Stachybotrys chartarum and AspNeo group were dichotomized at the detection level due to high numbers of nondetected values. Microbial diversity score was defined as the sum of all the detected qPCR markers (range 0–8). Due to a low number of observations with low and high diversity, the variable was categorized into four classes: 0–4, 5, 6, and 7–8.
Total microbial quantity score was calculated as the sum of three markers for the three different microbial groups, that is, for fungi, Gram-negative bacteria, and Gram-positive bacteria (one marker per group). Single markers were first divided into five groups using quintiles as cutoffs with scores 0, 1, 2, 3, and 4 from lowest to highest and then summed. All possible combinations with measured microbial markers were used to create four different total quantity scores for microbial exposure: (1) ergosterol, endotoxin, and muramic acid; (2) β-D-glucan, endotoxin, and muramic acid; (3) ergosterol, LPS10:0-16:0, and muramic acid; and (4) β-D-glucan, LPS10:0-16:0, and muramic acid. The created variables, with ranges from 0 to 12, were divided into five groups using quintiles as cutoffs for statistical analyses. Linear and quadratic trends in the associations between microbial diversity or total quantity scores and health outcomes were tested using polynomial contrasts (19).
All models were adjusted for study cohort, farming, and well-known risk factors for asthma (maternal history of allergic diseases, gender, number of older siblings, smoking during pregnancy). The models of total microbial quantity score (ergosterol, endotoxin, and muramic acid) and asthma ever, atopic dermatitis ever, and sensitization to inhalant allergen were carefully tested for 20 additional confounding factors, which have been described earlier (12). If a confounder changed the estimates of the total microbial quantity score by more than 10%, all the models of the outcome were adjusted for the factor. All the models of respiratory symptoms and current asthma were adjusted for the same confounding factors as in the asthma ever models. Given an exposure prevalence of 25%, power calculations (β = 80%, α = 0.05) show that with these data, we can detect an odds ratio of 2.52 for asthma ever with a population prevalence of 14%. The data were analyzed using SAS 9.2 for Windows (SAS lnc., Cary, NC, USA).
Results
The present analyses included all those 410 children with data on at least one microbial marker available in any of the quantity scores. Of those, 341 (83%) had the results of all microbial determinations. During the 6-year follow-up, 62 of 389 children with data on asthma developed asthma, and of those children, 35 still had current asthma at the age of 6 years (Table 1). Distributions of all microbial markers are shown in Table 2.
Table 2.
Levels of microbial markers
| Percentiles | |||||||
|---|---|---|---|---|---|---|---|
| N | <LOD* | (%) | 25th | Median | 75th | 95th | |
| Amount of dust (mg/m2)† | 410 | 0 | 173 | 311 | 587 | 1332 | |
| Gram-positive bacteria or marker of Gram-positive bacteria | |||||||
| Mycobacterium (cells/m2) | 399 | 21 | (5.3) | 186 857 | 641 427 | 1 753 136 | 7 041 045 |
| Streptomyces (cells/m2) | 399 | 7 | (1.8) | 3923 | 13 089 | 45 939 | 462 289 |
| Muramic acid (ng/m2) | 386 | 7 | (1.8) | 3122 | 6616 | 13 713 | 34 852 |
| Marker of Gram-negative bacteria | |||||||
| LPS 10:0–16:0 (nmol/m2) | 398 | 2 | (0.5) | 3 | 8 | 15 | 46 |
| Endotoxin (EU/m2) | 372 | 0 | 2668 | 6253 | 13 485 | 66 569 | |
| Fungi or marker of fungi | |||||||
| PenAsp group (cells/m2) | 399 | 3 | (0.8) | 13 580 | 59 405 | 233 616 | 1 282 236 |
| Trichoderma viride group (cells/m2) | 400 | 62 | (15.5) | 340 | 2028 | 9906 | 153 816 |
| Wallemia sebi (cells/m2) | 400 | 152 | (38.0) | 0 | 883 | 11 541 | 152 041 |
| Cladosporium (cells/m2) | 399 | 50 | (12.5) | 3652 | 25 683 | 104 690 | 982 138 |
| AspNeo group (cells/m2) | 400 | 320 | (80.0) | 0 | 0 | 0 | 14 254 |
| Stachybotrys chartarum (cells/m2) | 400 | 390 | (97.5) | 0 | 0 | 0 | 0 |
| EPS (EPSU/m2) | 374 | 15 | (2.1) | 7079 | 15 312 | 38 025 | 126 107 |
| β-D-glucan (μg/m2) | 376 | 0 | 511 | 970 | 1818 | 4066 | |
| Ergosterol (ng/m2) | 401 | 0 | 1473 | 3015 | 7040 | 21 978 | |
| Quantity scores | |||||||
| Ergosterol, endotoxin, and muramic acid | 347 | 3 | 6 | 9 | 12 | ||
| β-D-glucan, endotoxin, and muramic acid | 352 | 3 | 6 | 9 | 12 | ||
| Ergosterol, LPS10:0–16:0, and muramic acid | 380 | 3 | 6 | 9 | 12 | ||
| β-D-glucan, LPS10:0–16:0, and muramic acid | 354 | 3 | 7 | 9 | 12 | ||
| Diversity score‡ | 399 | 5 | 6 | 6 | 7 | ||
LOD = the level of detection, percentage of samples under detection level from analyzed samples (%).
The amount of dust refers to dust samples used for analyses of qPCRs, ergosterol, muramic acid, and LPS (sieved).
The number of detected 6 fungal or 2 bacterial qPCRs.
Most correlations between the amount of house dust and single microbial markers as well as intercorrelations between two microbial markers together were between 0.30 and 0.85 (Table S1). Total microbial quantity scores were correlated with each other (around r = 0.90) and also with amount of dust (around r = 0.85), but correlations between total microbial quantity scores and qPCR results were lower (around r = 0.30), except for Mycobacterium and the PenAsp group (around r = 0.50). Diversity score had low correlations with amount of dust, all microbial markers, and total microbial quantity scores (around r = 0.20), but higher with Wallemia sebi (r = 0.66).
In general, the associations of single microbial markers with asthma ever and respiratory symptoms were mostly nonsignificant, while the shape of the association varied (Fig. 1). Total microbial quantity score had a significant inverted-U-shaped association with asthma ever: the highest risk for asthma ever was found with the medium level of total microbial quantity score and the lowest risk with the highest quantity score (Fig. 2, Table 3). The association was independent of the diversity score. The associations were quite similar to current asthma (Table 3) and when using other microbial markers than ergosterol, endotoxin, and muramic acid to create the total microbial quantity score (Table S2) as well as when using EPS as a marker of fungi (data not shown). Total microbial quantity scores tended to be inversely associated with respiratory symptoms (Table S2). The inverted-U-shaped association between total microbial quantity score and asthma ever tended to be stronger after adjusting for the amount of dust (data not shown). Adjustment for dust also strengthened the associations between asthma, and Streptomyces, endotoxin, PenAsp group, β-D-glucan and ergosterol, but not the other single microbial markers (data not shown).
Figure 1.

Adjusted associations between amount of dust and bacterial (A) and fungal (B) exposure at the age of 2 months and asthma and respiratory symptoms during the first 6 years of life and sensitization to inhalant allergen at the age of 6 years. Models are adjusted for study cohort, farming status, gender, maternal history of allergic diseases (hay fever, atopic dermatitis, and/or asthma), smoking during pregnancy, the number of older siblings, and living area of the home. Models of sensitization to inhalant allergens (cut point ≥0.70 kU/l) are additionally adjusted for floor type of dust sampling.
Figure 2.
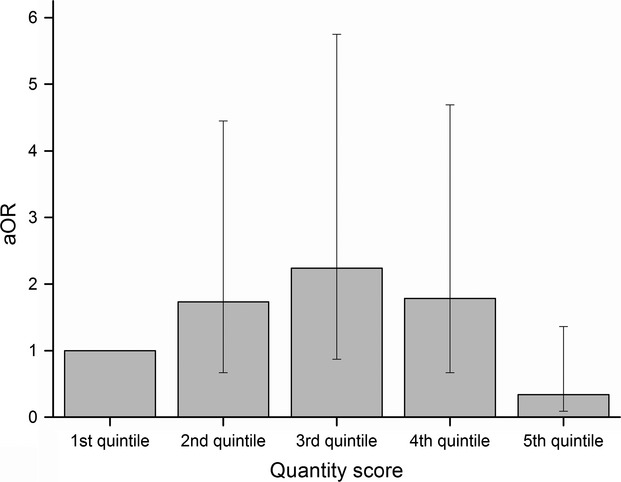
Risk of asthma in relation to total microbial quantity score in quintiles (sum of ergosterol, endotoxin, and muramic acid) (aOR). Model is adjusted for study cohort, farming status, gender, maternal history of allergic diseases (hay fever, atopic dermatitis, and/or asthma), smoking during pregnancy, the number of older siblings, living area of the home, and diversity score.
Table 3.
Adjusted associations between microbial quantity or diversity scores and asthma or respiratory symptoms up to the age of 6 years and current asthma and sensitization to inhalant allergen at 6 years of age
| Asthma ever | Current asthma | Any wheezing¥ | Nocturnal cough¥ | Sensitization to inhalant allergens at 6 years¤ | |||||||||
|---|---|---|---|---|---|---|---|---|---|---|---|---|---|
| N# | n | N‡ | aOR (95% CI) | N# | n | N‡ | aOR (95% CI) | aOR (95% CI) | aOR (95% CI) | N | n | aOR (95% CI) | |
| Quantity score£ | |||||||||||||
| Reference (1st quintile) | 63 | 8 | 354 | 1 | 56 | 5 | 352 | 1 | 1 | 1 | 53 | 19 | 1 |
| 2nd quintile | 73 | 12 | 390 | 1.73 (0.67–4.45) | 63 | 6 | 380 | 1.32 (0.38–4.61) | 0.65 (0.35–1.22) | 0.68 (0.39–1.21) | 57 | 26 | 2.19 (0.92–5.23) |
| 3rd quintile | 62 | 13 | 300 | 2.24 (0.87–5.75)∧ | 57 | 7 | 297 | 2.01 (0.59–6.79) | 0.89 (0.49–1.62) | 0.86 (0.48–1.55) | 44 | 17 | 1.42 (0.55–3.64) |
| 4th quintile | 56 | 11 | 311 | 1.78 (0.67–4.69) | 53 | 7 | 318 | 1.86 (0.55–6.32) | 0.98 (0.55–1.75) | 0.70 (0.40–1.24) | 47 | 17 | 1.32 (0.51–3.40) |
| 5th quintile | 75 | 3 | 438 | 0.34 (0.09–1.36) | 67 | 2 | 409 | 0.39 (0.07–2.11) | 0.73 (0.43–1.24) | 0.68 (0.38–1.20) | 57 | 20 | 1.50 (0.61–3.70) |
| P-value | <0.001¶ | 0.03¶ | 0.95¶ | 0.74¶ | 0.46¶ | ||||||||
| Diversity score§ | |||||||||||||
| Reference (0–4) | 45 | 9 | 232 | 1 | 37 | 8 | 215 | 1 | 1 | 1 | 33 | 11 | 1 |
| 5 | 108 | 13 | 566 | 0.69 (0.27–1.78) | 95 | 7 | 557 | 0.30 (0.10–0.89)* | 0.68 (0.38–1.20) | 0.90 (0.50–1.62) | 81 | 36 | 2.10 (0.84–5.27) |
| 6 | 133 | 22 | 736 | 1.03 (0.43–2.49) | 122 | 10 | 731 | 0.35 (0.12–0.94)* | 0.54 (0.30–0.97)* | 1.23 (0.71–2.15) | 108 | 46 | 2.16 (0.86–5.45) |
| 7–8 | 43 | 3 | 259 | 0.64 (0.15–2.76) | 42 | 2 | 253 | 0.40 (0.07–2.29) | 0.14 (0.06–0.32)** | 1.21 (0.58–2.50) | 36 | 6 | 0.42 (0.12–1.50) |
| P-value | 0.67† | 0.31† | <0.001† | 0.45† | 0.001¶ | ||||||||
Sum of quintiles of loads of ergosterol, endotoxin, and muramic acid.
Number of detected qPCRs.
Models are adjusted for time, study cohort, farming status, gender, maternal history of allergic diseases (hay fever, atopic dermatitis, and/or asthma), smoking during pregnancy, the number of older siblings, living area of the home, and either diversity score or quantity score.
N# Total number of children in the beginning of follow-up, n = number of cases in each category.
N‡ Subjects contributed up to seven repeated observations to this survival analysis using discrete-time hazard models (DTH).
Subjects contributed up to seven repeated observations to this analysis using generalized estimating equations.
Models are additionally adjusted for floor type of dust sampling.
P-value ∧<0.1, *<0.05, **<0.01, †P-value for linear trend test, ¶P-value for quadratic trend test.
The associations between total microbial quantity score and any wheezing were similar among children who were sensitized against at least one of the tested inhalant or food allergens at the age of 6 years and who were not sensitized (P-value = 0.66 for interaction term). In contrast, in the stratified analyses, the inverted-U-shaped associations between the quantity scores and asthma ever were always stronger among nonatopic than among atopic children, but the P-values for interaction ranged between 0.08 and 0.28 (data not shown). There were no interactions with birth cohorts (P-values ≥ 0.27 for interaction terms). Associations between total microbial quantity score and any wheezing were also similar in farms and in rural/suburban areas (P-value = 0.58 for interaction term). Due to the low numbers of children with asthma ever among farmers, interaction tests between total microbial quantity score and farming on asthma ever could not be performed.
Diversity score was associated with a decreased risk of any wheezing, and a similar tendency was seen with asthma ever and current asthma (Table 3). The association with asthma ever was, however, fairly sensitive to different adjustments, especially adjustment for farming. The association with any wheezing was similar among children from farms and from rural/suburban areas as well as children who were sensitized against at least one of the tested inhalant or food allergens at the age of 6 years and who were not sensitized (P-values ≥ 0.4 for interaction terms) (data not shown).
Most of the associations between single microbial markers and atopic dermatitis and sensitization to inhalant allergens at the age of 1 (Table S3) and 6 years (Fig. 1) were nonsignificant. Total microbial quantity score was not associated with atopic dermatitis or sensitization to inhalant allergen at the age of either 1 year (data not shown) or 6 years (Table 3). Diversity score was significantly (inverted-U shape) associated with sensitization to inhalant allergen at the age of 6 years (Table 3), while similar tendency, though nonsignificant, was seen with sensitization to inhalant allergen at 1 year (Table S4). No association was found between diversity score and atopic dermatitis (Table S4).
Discussion
The present study suggests that an index of total quantity of environmental microbial exposure may predict asthma better than single microbial markers, independently of microbial diversity score and amount of dust. The diversity score decreased the risk of wheezing and was significantly (inverted-U shape) associated with sensitization to inhalant allergens. Only a few associations were observed between single microbial markers and the outcomes studied.
This is the first study using an index of total microbial quantity score when studying the risk of asthma. Previously, one cross-sectional study found a tendency of inverse association between microbial quantity score (LPS10:0–16:0, ergosterol, and muramic acid) and allergic sensitization (9). Typically, epidemiological studies have used only one microbial marker as a surrogate for total microbial exposure. However, it is clear that such assessments provide an incomplete picture of the total quantity and quality of human microbial exposure. Due to high correlations, a major difficulty of earlier studies has been to separate the effects of single microbial markers from each other and from the effect of the amount of dust (5, 20). In the present study, total microbial quantity score predicted the risk of asthma independently of microbial diversity and amount of dust.
The reason behind the observed association between total microbial quantity score and asthma is unclear. A potential explanation is that different components of microbial groups or genera share common antigen or molecule structures on their cell wall surface, which are detected by pattern recognition receptors in innate immunity cells and have a profound influences on the immune system (21). If total exposure to such structures is the main causal factor explaining the association between microbial exposure and lower risk of allergic diseases, then total microbial quantity score is likely to better reflect this exposure than single microbial markers. Varying correlations of single microbial markers with total microbial exposure would then explain the often weak and conflicting findings from earlier studies. In addition, some studies have shown synergistic interactions between different exposing agents (22), and an index of total microbial quantity score may capture such synergistic effects. Data from deep sequencing of microbial exposure (23) will give opportunities to explore further the above potential mechanisms.
Total microbial quantity score had an inverted-U-shaped association with asthma. Previous studies have suggested that the immune system may react first with enhanced response and subsequently with tolerance (24). Associations of similar shape have also been reported earlier between allergen levels and β-D-glucan, and risk of asthma, wheezing, or atopic sensitization (25–27). The shape of the association in the present study may also relate to some unknown characteristics of the present study, given that some single microbial markers also showed an association of a similar shape. Further studies in larger cohorts and in different settings are needed to better define the shape of the association between total microbial quantity score and risk of asthma.
We found a similar inverse association between measured microbial diversity score and wheezing, as has been reported with asthma in two recent cross-sectional studies (8). The association with asthma was nonsignificant, though in the same direction. There were differences in the microbiological methods used between the present study and previous studies. We used qPCR, a method that quantitatively describes the presence of specific viable and nonviable organisms of prior chosen microbes (28). The previous studies either cultivated viable microbes (GABRIELA study) or used single-strand conformation polymorphism analyses, which is a qualitative rather than quantitative method (PARSIFAL study) (8). We calculated a diversity score based on 6 fungal and 2 bacterial qPCR assays representing either microbial species, genera, or groups, which hence only provides a suggestive and rough estimate of the overall microbial diversity. Nonetheless, the results are in line with previous studies (8) targeting a broader spectrum of microbes. Taken together, the studies suggest that microbial diversity score may predict asthma and may be a useful marker to describe the quality of microbial exposure.
The observed associations between studied health outcomes and single microbial markers should be interpreted with caution, as no adjustments for multiple testing were done. The most interesting findings were maybe the protective associations in the case of Gram-positive bacteria (Mycobacterium spp., Streptomyces spp., and muramic acid), which have been reported earlier for muramic acid (6, 29).
The main strengths of the present study are the prospective birth cohort design with high participation rate (varied between 80% and 95% in each follow-up) and a good variety of measured markers of exposure to environmental microbes. The small size of our study cohort is the main limitation of the study, and the results need to be confirmed in further studies. The microbial markers and combinations of those used to build total microbial quantity scores in the present study do not measure total microbial exposure without error, for example using muramic acid together with endotoxin overestimates the amount of Gram-negative bacteria, because muramic acid is found also in Gram-negative bacteria, although to a lesser extent (30). These weaknesses do not, however, appear to be a major problem, as the different quantity scores used in the present study showed very similar associations.
In conclusion, our indicator for total quantity of microbial exposure predicted asthma better than single microbial markers. Detected associations were independent of the measured microbial diversity and amount of dust. Better indicators of total quantity and diversity of microbial exposure are needed in studies on the development of asthma.
Acknowledgments
We would like to thank the families for their participation in the study and study nurses Raija Juntunen, Riikka Juola, and Seija Antikainen for field work; Hanna Leppänen, Katja Saarnio, Heli Martikainen, Susanne van den Brink, Timmoty Wigboldus, Mirian Boeve, Siegfried de Wind, and Jack Spithoven for microbiological analyses; Pekka Tiittanen for support in statistical analyses and data management; Hanna-Mari Takkinen for illustrations, Asko Vepsäläinen and Timo Kauppila for data management; and Mark Phillips for revising the language of this manuscript.
Glossary
- EPS
fungal extracellular polysaccharide antigens of Penicillium and Aspergillus species
- GC-MS–MS
gas chromatography tandem mass spectrometry
- LPS
lipopolysaccharide
- LPS10:0-:16:0:0
amount (mol) of LPS in each sample. The number of mol of 3-hydroxy fatty acids of C10:0 to C16:0 carbon chain length divided by 4
- qPCR
quantitative polymerase chain reaction
- PASTURE
Protection against Allergy STUdy in Rural Environments
- OR
odds ratio
- aOR
adjusted odds ratio
- sIgE
specific immunoglobulin E
- kU/L
kilo units per liter
- GEE
general estimating equations
- EIA
inhibition enzyme immunoassay
Funding
This study was supported by research grants from the European Union QLK4-CT-2001-00250; Graduate School in Environmental Health (SYTYKE); EVO-funding; Farmers’ Social Insurance Institution (Mela); the Academy of Finland (grant 139021); the Juho Vainio Foundation; the European commission as part of HITEA (Health Effects of Indoor Pollutants: Integrating microbial, toxicological and epidemiological approaches), Grant agreement no. 211488 under the Seventh Framework Programme, Topic ENV.2007.1.2.1.1. ‘Indoor air pollution in Europe: An emerging environmental health issue’; and by the National Institute for Health and Welfare, Finland.
Author contributions
All authors approved the submitted version. Karvonen involved in statistical data analyses, data collecting, manuscript preparation, and drafting. Hyvärinen and Rintala involved in dust sampling assessment, microbial analyses, and manuscript preparation. Korppi and Remes involved in authority on pediatric issues and manuscript preparation. Tàubel, Keski-Nisula, and Lampi involved in manuscript preparation. Doekes and Gehring involved in microbial analyses and manuscript preparation. Renz and Pfefferle involved in IgE measurements and manuscript preparation. Genuneit involved in data management and manuscript preparation. von Mutius and Pekkanen involved in study concept and design, and manuscript preparation.
Conflicts of interest
The authors declare that they have no conflicts of interest.
Supporting Information
Additional Supporting Information may be found in the online version of this article:
Table S1. Spearman correlations of microbial markers per sampled area (/m2).
Table S2. Adjusted associations between quantity or diversity scores and asthma or respiratory symptoms.
Table S3. Adjusted associations between microbial exposure and atopic dermatitis up to the age of 6 years and sensitization to inhalant allergen at the age of 1 year.
Table S4. Associations between microbial diversity and atopic dermatitis ever until the age of 6 years and sensitization to inhalant allergen at the age of 1 and 6 years.
References
- 1.von Mutius E. Asthma and allergies in rural areas of Europe. Proc Am Thorac Soc. 2007;4:212–216. doi: 10.1513/pats.200701-028AW. [DOI] [PubMed] [Google Scholar]
- 2.Mendy A, Gasana J, Vieira ER, Forno E, Patel J, Kadam P, et al. Endotoxin exposure and childhood wheeze and asthma: a meta-analysis of observational studies. J Asthma. 2011;48:685–693. doi: 10.3109/02770903.2011.594140. [DOI] [PubMed] [Google Scholar]
- 3.Schram-Bijkerk D, Doekes G, Douwes J, Boeve M, Riedler J, Ublagger E, et al. Bacterial and fungal agents in house dust and wheeze in children: the PARSIFAL study. Clin Exp Allergy. 2005;35:1272–1278. doi: 10.1111/j.1365-2222.2005.02339.x. [DOI] [PubMed] [Google Scholar]
- 4.Douwes J, Siebers R, Wouters IM, Doekes G, Fitzharris P, Crane J. Endotoxin, (1 -> 3)-beta-D-glucans and fungal extra-cellular polysaccharides in New Zealand homes: a pilot study. Ann Agric Environ Med. 2006;13:361–365. [PubMed] [Google Scholar]
- 5.Gehring U, Heinrich J, Hoek G, Giovannangelo M, Nordling E, Bellander T, et al. Bacteria and mould components in house dust and children's allergic sensitisation. Eur Respir J. 2007;29:1144–1153. doi: 10.1183/09031936.00118806. [DOI] [PubMed] [Google Scholar]
- 6.Sordillo JE, Hoffman EB, Celedon JC, Litonjua AA, Milton DK, Gold DR. Multiple microbial exposures in the home may protect against asthma or allergy in childhood. Clin Exp Allergy. 2010;40:902–910. doi: 10.1111/j.1365-2222.2010.03509.x. [DOI] [PMC free article] [PubMed] [Google Scholar]
- 7.Hyvärinen A, Sebastian A, Pekkanen J, Larsson L, Korppi M, Putus T, et al. Characterizing microbial exposure with ergosterol, 3-hydroxy fatty acids, and viable microbes in house dust: determinants and association with childhood asthma. Arch Environ Occup Health. 2006;61:149–157. doi: 10.3200/AEOH.61.4.149-157. [DOI] [PubMed] [Google Scholar]
- 8.Ege MJ, Mayer M, Normand AC, Genuneit J, Cookson WO, Braun-Fahrlander C, et al. Exposure to environmental microorganisms and childhood asthma. N Engl J Med. 2011;364:701–709. doi: 10.1056/NEJMoa1007302. [DOI] [PubMed] [Google Scholar]
- 9.von Hertzen L, Hyvarinen A, Laatikainen T, Makela MJ, Nevalainen A, Vartiainen E, et al. Risk of atopy associated with microbial components in house dust. Ann Allergy Asthma Immunol. 2010;104:269–270. doi: 10.1016/j.anai.2010.01.008. [DOI] [PubMed] [Google Scholar]
- 10.von Mutius E, Schmid S. The PASTURE project: EU support for the improvement of knowledge about risk factors and preventive factors for atopy in Europe. Allergy. 2006;61:407–413. doi: 10.1111/j.1398-9995.2006.01009.x. [DOI] [PubMed] [Google Scholar]
- 11.Karvonen AM, Hyvarinen A, Roponen M, Hoffmann M, Korppi M, Remes S, et al. Confirmed moisture damage at home, respiratory symptoms and atopy in early life: a birth-cohort study. Pediatrics. 2009;124:e329–e338. doi: 10.1542/peds.2008-1590. [DOI] [PubMed] [Google Scholar]
- 12.Karvonen AM, Hyvarinen A, Gehring U, Korppi M, Doekes G, Riedler J, et al. Exposure to microbial agents in house dust and wheezing, atopic dermatitis and atopic sensitization in early childhood: a birth cohort study in rural areas. Clin Exp Allergy. 2012;42:1246–1256. doi: 10.1111/j.1365-2222.2012.04002.x. [DOI] [PubMed] [Google Scholar]
- 13.Schram D, Doekes G, Boeve M, Douwes J, Riedler J, Ublagger E, et al. Bacterial and fungal components in house dust of farm children, Rudolf Steiner School children and reference children - the PARSIFAL Study. Allergy. 2005;60:611–618. doi: 10.1111/j.1398-9995.2005.00748.x. [DOI] [PubMed] [Google Scholar]
- 14.Lappalainen MH, Hyvärinen A, Hirvonen MR, Rintala H, Roivainen J, Renz H, et al. High indoor microbial levels are associated with reduced Th1 cytokine secretion capacity in infancy. Int Arch Allergy Immunol. 2012;159:194–203. doi: 10.1159/000335596. [DOI] [PubMed] [Google Scholar]
- 15.Rintala H, Nevalainen A. Quantitative measurement of streptomycetes using real-time PCR. J Environ Monit. 2006;8:745–749. doi: 10.1039/b602485h. [DOI] [PubMed] [Google Scholar]
- 16.Torvinen E, Torkko P, Rintala AN. Real-time PCR detection of environmental mycobacteria in house dust. J Microbiol Methods. 2010;82:78–84. doi: 10.1016/j.mimet.2010.04.007. [DOI] [PubMed] [Google Scholar]
- 17.Haugland RA, Varma M, Wymer LJ, Vesper SJ. Quantitative PCR analysis of selected Aspergillus, Penicillium and Paecilomyces species. Syst Appl Microbiol. 2004;27:198–210. doi: 10.1078/072320204322881826. [DOI] [PubMed] [Google Scholar]
- 18.Herzum I, Blumer N, Kersten W, Renz H. Diagnostic and analytical performance of a screening panel for allergy. Clin Chem Lab Med. 2005;43:963–966. doi: 10.1515/CCLM.2005.165. [DOI] [PubMed] [Google Scholar]
- 19.Davis MJ. Contrast coding in multiple regression analysis: strengths, weaknesses, and utility of popular coding structures. Journal of Data Science. 2010;8:61–73. [Google Scholar]
- 20.Douwes J, van Strien R, Doekes G, Smit J, Kerkhof M, Gerritsen J, et al. Does early indoor microbial exposure reduce the risk of asthma? The Prevention and Incidence of Asthma and Mite Allergy birth cohort study. J Allergy Clin Immunol. 2006;117:1067–1073. doi: 10.1016/j.jaci.2006.02.002. [DOI] [PubMed] [Google Scholar]
- 21.Palm NW, Medzhitov R. Pattern recognition receptors and control of adaptive immunity. Immunol Rev. 2009;227:221–233. doi: 10.1111/j.1600-065X.2008.00731.x. [DOI] [PubMed] [Google Scholar]
- 22.Huttunen K, Pelkonen J, Nielsen KF, Nuutinen U, Jussila J, Hirvonen MR. Synergistic interaction in simultaneous exposure to Streptomyces californicus and Stachybotrys chartarum. Environ Health Perspect. 2004;112:659–665. doi: 10.1289/ehp.6701. [DOI] [PMC free article] [PubMed] [Google Scholar]
- 23.Margulies M, Egholm M, Altman WE, Attiya S, Bader JS, Bemben LA, et al. Genome sequencing in microfabricated high-density picolitre reactors. Nature. 2005;437:376–380. doi: 10.1038/nature03959. [DOI] [PMC free article] [PubMed] [Google Scholar]
- 24.Liu AH. Endotoxin exposure in allergy and asthma: reconciling a paradox. J Allergy Clin Immunol. 2002;109:379–392. doi: 10.1067/mai.2002.122157. [DOI] [PubMed] [Google Scholar]
- 25.Tovey ER, Almqvist C, Li Q, Crisafulli D, Marks GB. Nonlinear relationship of mite allergen exposure to mite sensitization and asthma in a birth cohort. J Allergy Clin Immunol. 2008;122:114–118. doi: 10.1016/j.jaci.2008.05.010. [DOI] [PubMed] [Google Scholar]
- 26.Platts-Mills T, Vaughan J, Squillace S, Woodfolk J, Sporik R. Sensitisation, asthma, and a modified Th2 response in children exposed to cat allergen: a population-based cross-sectional study. Lancet. 2001;357:752–756. doi: 10.1016/S0140-6736(00)04168-4. [DOI] [PubMed] [Google Scholar]
- 27.Iossifova YY, Reponen T, Bernstein DI, Levin L, Kalra H, Campo P, et al. House dust (1-3)-beta-D-glucan and wheezing in infants. Allergy. 2007;62:504–513. doi: 10.1111/j.1398-9995.2007.01340.x. [DOI] [PMC free article] [PubMed] [Google Scholar]
- 28.Hirvonen MR, Ruotsalainen M, Savolainen K, Nevalainen A. Effect of viability of actinomycete spores on their ability to stimulate production of nitric oxide and reactive oxygen species in RAW264.7 macrophages. Toxicology. 1997;124:105–114. doi: 10.1016/s0300-483x(97)00141-8. [DOI] [PubMed] [Google Scholar]
- 29.van Strien RT, Engel R, Holst O, Bufe A, Eder W, Waser M, et al. Microbial exposure of rural school children, as assessed by levels of N-acetyl-muramic acid in mattress dust, and its association with respiratory health. J Allergy Clin Immunol. 2004;113:860–867. doi: 10.1016/j.jaci.2004.01.783. [DOI] [PubMed] [Google Scholar]
- 30.Brock TD, Madigan MT, Martinko JM, Parker J. Biology of microorganisms. 7th edn. New Jersey, USA: Prentice-Hall International Inc; 1994. [Google Scholar]
Associated Data
This section collects any data citations, data availability statements, or supplementary materials included in this article.
Supplementary Materials
Table S1. Spearman correlations of microbial markers per sampled area (/m2).
Table S2. Adjusted associations between quantity or diversity scores and asthma or respiratory symptoms.
Table S3. Adjusted associations between microbial exposure and atopic dermatitis up to the age of 6 years and sensitization to inhalant allergen at the age of 1 year.
Table S4. Associations between microbial diversity and atopic dermatitis ever until the age of 6 years and sensitization to inhalant allergen at the age of 1 and 6 years.