Abstract
Proinflammatory cytokines play important roles in insulin resistance. Here we report that mice with a T-cell-specific conditional knockout of HGK (T-HGK cKO) develop systemic inflammation and insulin resistance. This condition is ameliorated by either IL-6 or IL-17 neutralization. HGK directly phosphorylates TRAF2, leading to its lysosomal degradation and subsequent inhibition of IL-6 production. IL-6-overproducing HGK-deficient T cells accumulate in adipose tissue and further differentiate into IL-6/IL-17 double-positive cells. Moreover, CCL20 neutralization or CCR6 deficiency reduces the Th17 population or insulin resistance in T-HGK cKO mice. In addition, leptin receptor deficiency in T cells inhibits Th17 differentiation and improves the insulin sensitivity in T-HGK cKO mice, which suggests that leptin cooperates with IL-6 to promote Th17 differentiation. Thus, HGK deficiency induces TRAF2/IL-6 upregulation, leading to IL-6/leptin-induced Th17 differentiation in adipose tissue and subsequent insulin resistance. These findings provide insight into the reciprocal regulation between the immune system and the metabolism.
 HGK kinase is involved in signalling in many cell types but its function in T cells remains unclear. Here, using T-cell-specific HGK knockout mice, the authors show that HGK prevents the development of systemic inflammation and insulin resistance by inhibiting production of the proinflammatory cytokines IL-6 and IL-17.
T-helper 17 (Th17) cells, a subset of T-helper (CD4+) cells, mainly produce interleukin (IL)-17, IL-17F, IL-21 and IL-22. IL-6-, IL-21- or IL-23-induced STAT3 (signal transducer and activator of transcription 3) activation facilitates Th17 differentiation1,2. IL-6 stimulation induces IL-21 production and an IL-21 self-amplifying loop; IL-23 further helps expansion and stabilization of Th17 population1,2. Conversely, the transforming growth factor-β (TGF-β)-Smad pathway limits Th1 and Th2 differentiation through downregulation of T-bet/GATA-3 expression, leading to increased Th17 differentiation. The recruitment of Th17 cells to different tissues is mediated by CCL20 and CCL22, along with their respective cognate chemokine receptors CCR6 and CCR4 (refs 3, 4). The proinflammatory cytokines IL-17 and IL-22 secreted by infiltrating Th17 cells can cause tissue damages2. Th17 cells are involved in many autoimmune diseases or inflammatory diseases, such as systemic lupus erythematosus, rheumatoid arthritis, multiple sclerosis, asthma, inflammatory bowel disease and type 2 diabetes (T2D)5,6,7.
HPK1/GCK-like kinase (HGK), also named MAP4K4 (mitogen-actiavted protein kinase kinase kinase kinase 4), is a kinase that belongs to the mammalian Ste20-like family of serine/threonine kinases8. Whole-body HGK-deficient mice show early embryonic lethality9, implicating that HGK has an important function in embryonic development. Earlier studies using cultured cells show that HGK has various cellular functions. Tumour necrosis factor-α (TNF-α)-stimulated HGK induces JNK (c-Jun N-terminal kinase) activation through MKK4 and MKK7 in 293T cells8, while HGK inhibits adipose lipogenesis in an AMPK- and mammalian target of rapamycin-dependent but JNK-independent pathway10. HGK also impairs insulin signalling/glucose uptake in adipocytes and skeletal muscle cells, leading to insulin resistance11,12. Moreover, HGK protects pancreatic β-cells from the reduction of insulin secretion by TNF-α13. HGK small interfering RNA knockdown in murine macrophages inhibits lipopolysaccharide-induced septic shock by downregulating IL-1β and TNF-α production14. In addition, HGK has been identified as a promigratory kinase by a small interfering RNA screening15. Consistently, HGK expression is also associated with worse prognosis of pancreatic ductal adenocarcinoma, colorectal cancer and lung adenocarcinoma16,17,18. Recent report also shows that the interaction of HGK with Pyk2 contributes to glioma cell migration19. Taken together, HGK is involved in multiple physiological functions in different cell types.
Our previous studies indicate that two other MAP4K family kinases, HPK1 (MAP4K1)20 and GLK (MAP4K3)21, play important roles in T-cell receptor signalling and T-cell-mediated immune responses22,23. To date, the roles of HGK in lymphocyte signalling have not been investigated. In this report, we studied the in vivo roles of HGK in T-cell signalling and immune regulation by generating T-cell-specific HGK conditional knockout (T-HGK cKO) mice. We found that HGK downregulates IL-6 production in T cells through direct phosphorylation and degradation of TNF receptor-associated factor 2 (TRAF2), leading to the suppression of Th17 cell-mediated insulin resistance.
Results
T-HGK cKO mice show inflammation-associated disorders
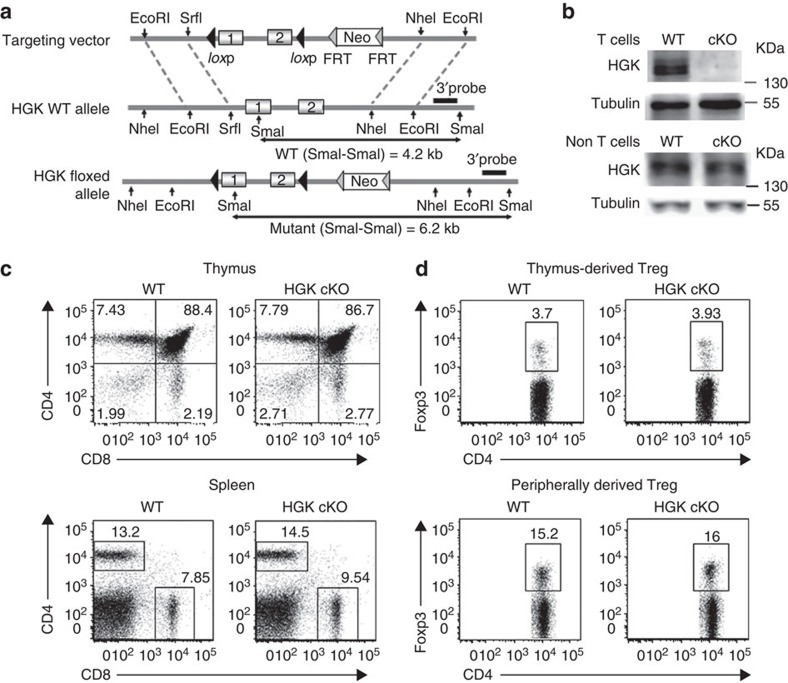
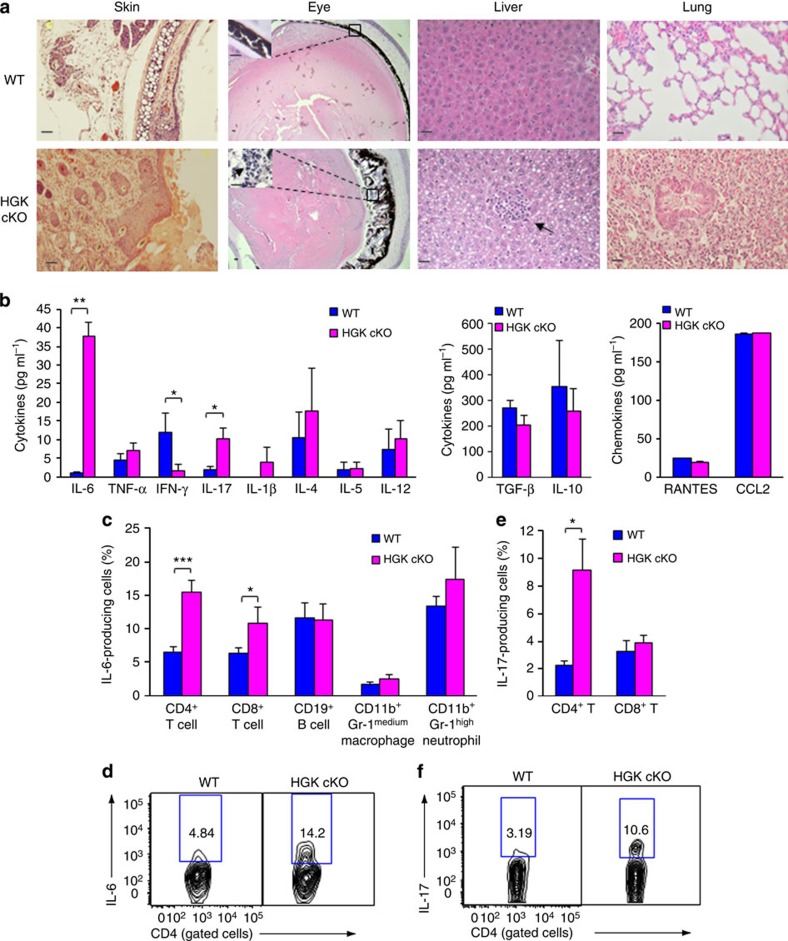
The specific deletion of HGK in T cells from T-HGK cKO mice (Fig. 1a) was confirmed by immunoblotting analyses (Fig. 1b). T-HGK cKO mice displayed normal development of T cells, B cells, neutrophils and macrophages (Fig. 1c and Supplementary Fig. 1a,b), as well as normal development and function of Treg cells (Fig. 1d and Supplementary Fig. 1c,d). T-HGK cKO mice showed severe dermatitis and cataracts starting between 12 and 23 weeks of age. These mice also showed hepatosplenomegaly, along with enlargements of lymph nodes and kidneys. Histology staining indicated that T-HGK cKO mice developed hepatic steatosis (fatty liver) and pneumonia starting from 16 weeks of age (Fig. 2a). Histology data also showed infiltration of immune cells in the skin, eyes, liver and lung (Fig. 2a). These data suggest that T-HGK cKO mice may develop systemic inflammation. The proinflammatory cytokines IL-6 and IL-17, but not interferon-γ (IFN-γ) or TNF-α, were significantly increased in the sera from T-HGK cKO mice (Fig. 2b). Intracellular staining of IL-6-producing cells in the peripheral blood showed that T cells (mostly CD4+ T cells) were the major source of serum IL-6 in T-HGK cKO mice (Fig. 2c,d). In addition, IL-17-producing CD4+ T (Th17) cells but not CD8+ T cells were also significantly increased in the blood of T-HGK cKO mice (Fig. 1e,f).
Figure 1. Normal T-cell development in T-HGK cKO mice.
(a) Schematic diagram of the mouse HGK WT allele, the gene targeting vector and the targeted HGK floxed allele. (b) T-cell-specific deletion of HGK in T-HGK cKO mice. T cells were purified from the spleen of mice. The remaining cells (non-T cells) were studied as a control. The expression of HGK and tubulin in T cells and non T cells was determined by immunoblotting analyses. (c,d) Flow cytometry analyses of T cells (c) and Treg cells (d) from the thymus and spleen of 5-week-old WT and T-HGK cKO mice. WT, littermate controls (HGKf/f mice or CD4-Cre mice); HGK cKO, T-HGK cKO mice. Data shown are representatives of three independent experiments.
Figure 2. T-HGK cKO mice show inflammation-associated disorders and IL-6/IL-17 induction.
(a) Haematoxylin and eosin-stained sections of organs from 16-week-old mice. Arrows, infiltrating immune cells. Scale bar, 100 μm. WT, littermate controls (HGKf/f mice or CD4-Cre mice); HGK cKO, T-HGK cKO mice. (b) The levels of serum cytokines from 8-week-old mice were determined by ELISA assays. n=20. Means±s.e.m. are shown. (c) Statistical analyses of IL-6-producing cells in the peripheral blood of 8-week-old mice. The frequency of IL-6-producing cells was normalized to the total number of each cell type. n=8. Means±s.e.m. are shown. (d) The representative flow cytometry data of IL-6-producing T cells from peripheral blood of mice. (e) Statistical analyses of IL-17-producing peripheral blood T cells from 8-week-old mice. The frequency of IL-17-producing T cells was normalized to the total number of T-cell subsets. n=8. Means±s.e.m. are shown. (f) Representative flow cytometry data of IL-17-producing T cells from peripheral blood of mice. WT, littermate controls (HGKf/f mice or CD4-Cre mice); HGK cKO, T-HGK cKO mice. Data shown (a,b) are representatives of three independent experiments. *P-value<0.05; **P-value<0.01; ***P-value<0.005 (two-tailed Mann–Whitney U-test).
IL-6 reduction by HGK through TRAF2 phosphorylation and degradation
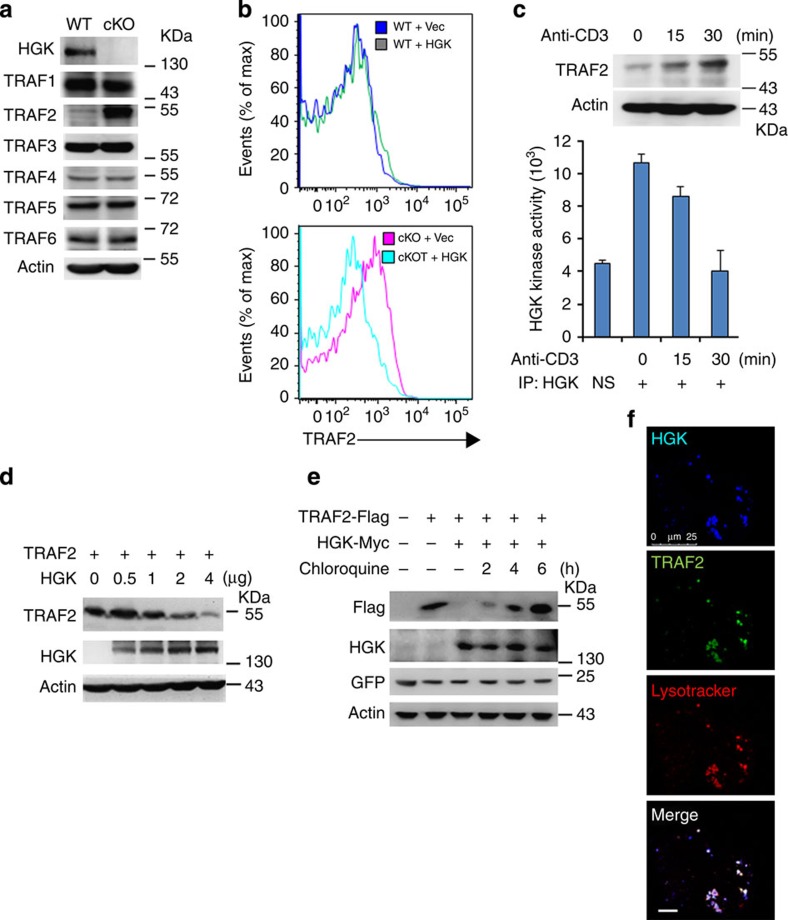
HGK interacts with TRAFs24; and overexpression of TRAFs enhances IKK/nuclear factor-κB activation and IL-6 production25,26. Thus, we examined whether HGK negatively regulates IL-6 production through targeting TRAFs. The basal levels of TRAF2 were drastically enhanced in HGK cKO T cells (Fig. 3a), as well as in CD4+ and CD8+ T cells (Supplementary Fig. 2a). The protein levels of TRAF2 in T-HGK cKO T cells were abolished after HGK restoration (Fig. 3b). In addition, HGK was constitutively activated in T cells (Fig. 3c). During T-cell receptor signalling, HGK kinase activity was decreased with a concomitant induction of TRAF2 protein levels (Fig. 3c). Conversely, TRAF2 levels were decreased by ectopically expressed HGK in an overexpression system (Fig. 3d). This HGK-mediated TRAF2 degradation was abolished by the lysosome inhibitor chloroquine but not by the proteasome inhibitor MG132 (Fig. 3e and Supplementary Fig. 2b). The colocalization between HGK and TRAF2 in lysosome was highly visible (Fig. 3f).
Figure 3. HGK induces the lysosomal degradation of TRAF2.
(a) Immunoblotting analyses of HGK and TRAFs in primary splenic T cells of WT and T-HGK cKO mice. (b) Flow cytometry analyses of TRAF2-positive cells from WT and HGK cKO (cKO) T cells transfected with empty vector (Vec, encoding CFP alone) or vector encoding HGK tagged with CFP. Means±s.e.m. are shown. (c) Immunoblotting analyses of TRAF2 and actin in Jurkat T cells stimulated with anti-CD3 antibodies (upper panel). In vitro kinase assays of the endogenous HGK proteins immunoprecipitated from lysates of Jurkat T cells stimulated with anti-CD3 antibodies (lower panel). NS, normal serum. n=3. Means±s.e.m. are shown. (d) Immunoblotting analyses of indicated molecules in lysates of HEK293T cells transfected with TRAF2 (2 μg) and HGK (various amounts) plasmids. (e) Immunoblotting analyses of indicated molecules in lysates of HEK293T cells transfected with TRAF2 and/or HGK, and treated with the lysosome inhibitor chloroquine. (f) Confocal microscopy analyses of co-localization of HGK-CFP (blue), TRAF2-YFP (green) and lysosome (lysotracker; red) in HEK293T cells treated with chloroquine. Original magnification, × 630; scale bar, 10 μm. Data shown are representatives of three independent experiments.
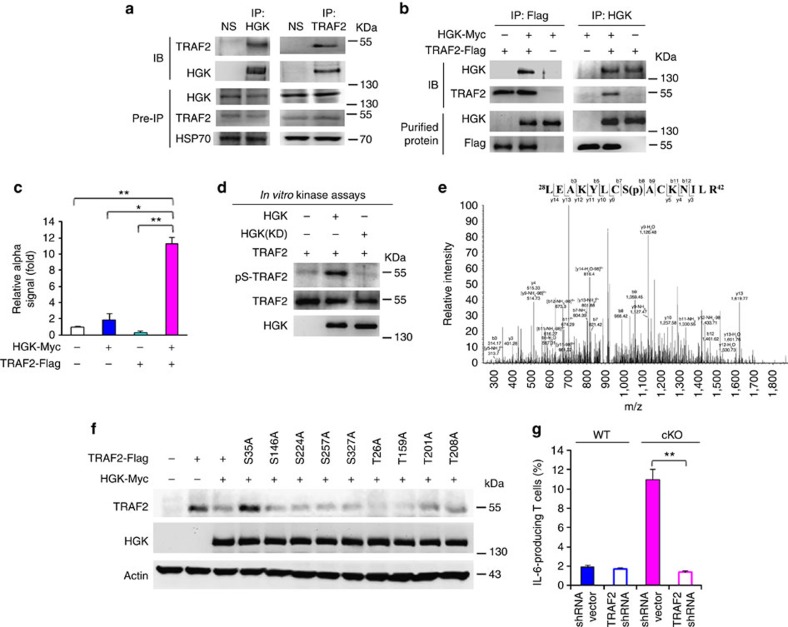
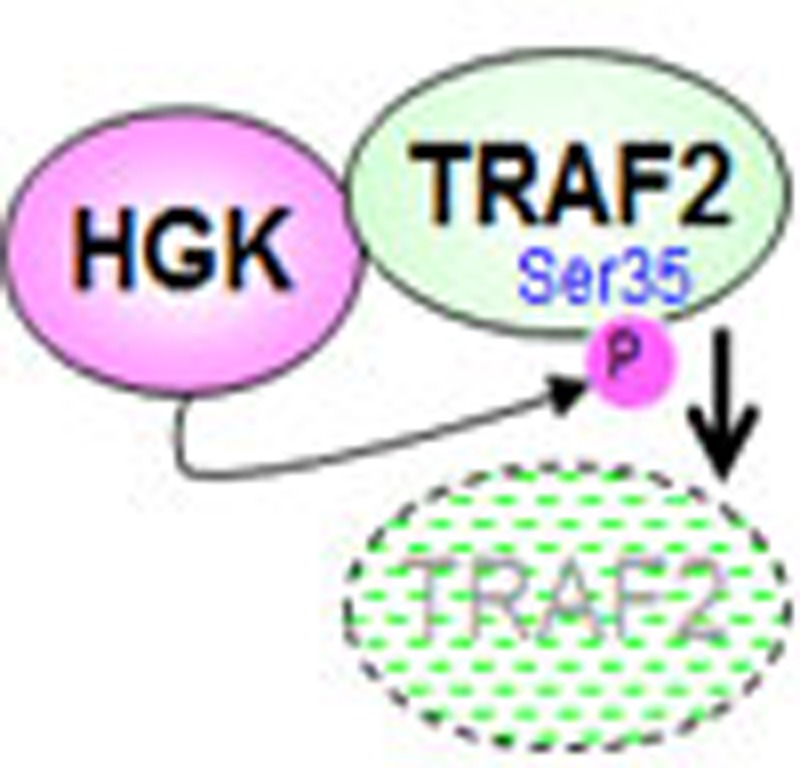
To determine whether HGK directly phosphorylates TRAF2, we first examined the interaction between these two molecules. HGK constitutively interacted with endogenous TRAF2 in primary T cells (Fig. 4a). In vitro binding assays with purified HGK and TRAF2 proteins and protein–protein interaction/α-technology assays with specific donor/acceptor beads further showed a direct interaction between these two proteins (Fig. 4b,c). In vitro kinase assays with purified proteins showed that serine phosphorylation of TRAF2 was increased by HGK, but not by HGK kinase-dead mutant (Fig. 4d). To identify TRAF2 phosphorylation site(s), we isolated in vitro phosphorylated Flag-tagged TRAF2, followed by mass spectrometry analyses. Ser35 was identified as the HGK-targeted TRAF2 phosphorylation site (Fig. 4e). Unlike eight other serine/threonine mutants, TRAF2 S35A mutant was resistant to degradation induced by HGK (Fig. 4f). Moreover, IL-6 overproduction of HGK cKO T cells was significantly reduced by TRAF2 short hairpin RNA (Fig. 4g), suggesting that HGK downregulation induces IL-6 overproduction through TRAF2. These results indicate that loss of HGK prevents TRAF2 from its lysosomal degradation, resulting in subsequent IL-6 overproduction.
Figure 4. HGK directly phosphorylates TRAF2 at serine 35 that mediates TRAF2 degradation.
(a) Co-immunoprecipitations (IP) of endogenous HGK with TRAF2 in lysates of mouse primary splenic T cells treated with chloroquine. NS, normal serum. IB, immunoblotting. (b) In vitro binding assays of purified HGK-Myc and Flag-TRAF2 proteins. (c) Signals of the interaction between HGK-Myc and TRAF2-Flag in lysates of HEK293T cells determined by amplified luminescent proximity homogeneous assays (α). Means±s.e.m. are shown. (d) In vitro kinase assays using purified HGK-Myc and Flag-TRAF2 proteins. (e) Mass spectrometry (MS)/MS fragmentation spectra of the tryptic peptides of TRAF2 contain the phosphorylation of Ser35. In vitro phosphorylated Flag-tagged TRAF2 was isolated, digested with trypsin and subjected to LC-MS/MS analyses. (f) Immunoblotting analyses of indicated molecules in lysates of HEK293T cells transfected with WT TRAF2 or TRAF2 mutants in the presence or absence of HGK plasmids. (g) IL-6 production in the mouse primary splenic T cells. T cells were transfected with GFP-TRAF2 short hairpin RNA (shRNA) and a control GFP vector. The transfected T cells were stimulated with PMA plus ionomycin for 3 h and then determined by flow cytometry at day 3 after transfection. Data show the percentages of IL-6 producing T cells (green fluorescent protein (GFP)-gated) and presented as mean±s.e.m. from triplicate experiments. WT, littermate controls (HGKf/f mice); HGK cKO, T-HGK cKO mice. Data shown are representatives of three (a–d,g) and two (e,f) independent experiments. *P-value<0.05; **P-value<0.01 (two-tailed Mann–Whitney U-test).
T-HGK cKO mice spontaneously develop insulin resistance
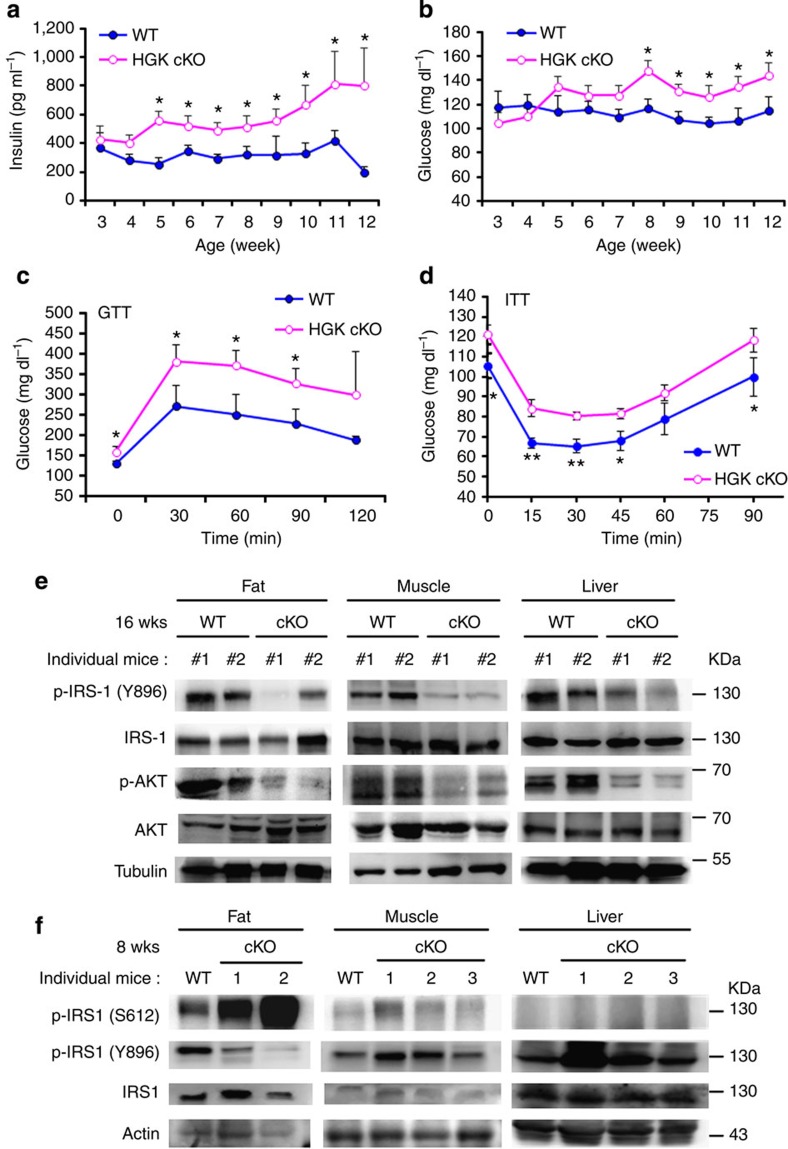
IL-6 is involved in T2D in human patients27. To study whether T-HGK cKO mice develop T2D, we monitored serum levels of fasting insulin, glucose and triglyceride in T-HGK cKO and control mice. There were significantly increased levels of insulin (starting from 5 weeks), triglyceride (starting from 6 weeks) and glucose (starting from 8 weeks) (Fig. 5a,b and Supplementary Fig. 3b) in sera of T-HGK cKO mice over time. Starting at 5 weeks of age, T-HGK cKO mice showed an 18% increase in body weight compared with wild-type (WT) control mice (Supplementary Fig. 3a,c); however, the body weights of T-HGK cKO mice decreased after 24 weeks of age. The modest increase of body weight may be a consequence of higher insulin levels28. In addition, food intake levels of T-HGK cKO mice were normal (Supplementary Fig. 3c). The respiratory exchange ratio was significantly increased in T-HGK cKO mice, indicating that carbohydrates rather than fatty acids were preferentially used (Supplementary Fig. 3d), which in turn may contribute to fat accumulation. Glucose tolerance test (GTT) and insulin tolerance test (ITT) showed that T-HGK cKO mice had significant decreases in glucose tolerance and insulin sensitivity (Fig. 5c,d). The phenotypes of T-HGK cKO mice were sex independent. The numbers and sizes of pancreatic islets in T-HGK cKO mice were not decreased, and the levels of inflammatory cytokines in the pancreas of these mice were not increased (Supplementary Fig. 4a–c). Furthermore, insulin signalling29,30 was impaired in three insulin-targeted tissues (adipose tissue, muscles and the liver) of aged T-HGK cKO mice (Fig. 5e), indicating that HGK cKO mice develop insulin resistance. Interestingly, insulin signalling was initially downregulated only in adipose tissue, but not in muscles or the liver of young T-HGK cKO mice (Fig. 5f). The levels of inflammatory cytokines were increased in the liver and the muscle of aged T-HGK cKO mice but not young mice (Supplementary Fig. 5), supporting the conclusion that inflammation may cause insulin resistance in the liver and muscle of aged T-HGK cKO mice. These data suggest that adipocytes may be the first to be regulated in T-HGK cKO mice. Taken together, these results suggest that T-HGK cKO mice develop T2D.
Figure 5. T-HGK cKO mice develop insulin resistance mediated by IL-6 and IL-17.
(a,b) Fasting insulin (a) and glucose levels (b) in the sera of WT and T-HGK cKO mice. n, at least 18. (c) GTT tests were performed on 12-week-old WT and T-HGK cKO mice. Glucose levels were plotted versus time post glucose injection. n=6. (d) ITT tests were performed on 12-week-old mice. Blood glucose levels were measured at indicated time periods post insulin injection. n=6. (e,f) Immunoblotting analyses of p-IRS-1 (Y896 or S612), IRS-1, p-AKT, AKT or tubulin/actin in hepatocytes, skeletal muscle cells and adipocytes of 16-week-old (e) or 8-week-old (f) WT and T-HGK cKO mice. Mice were injected with 2 g kg−1 glucose for 1 h after 16-h fasting. WT, littermate controls (HGKf/f mice or CD4-Cre mice); HGK cKO, T-HGK cKO mice. *P-value<0.05; **P-value<0.01 (a–d, two-tailed Student’s t-test).
HGK-deficient Th17 cells are pathogenic for insulin resistance
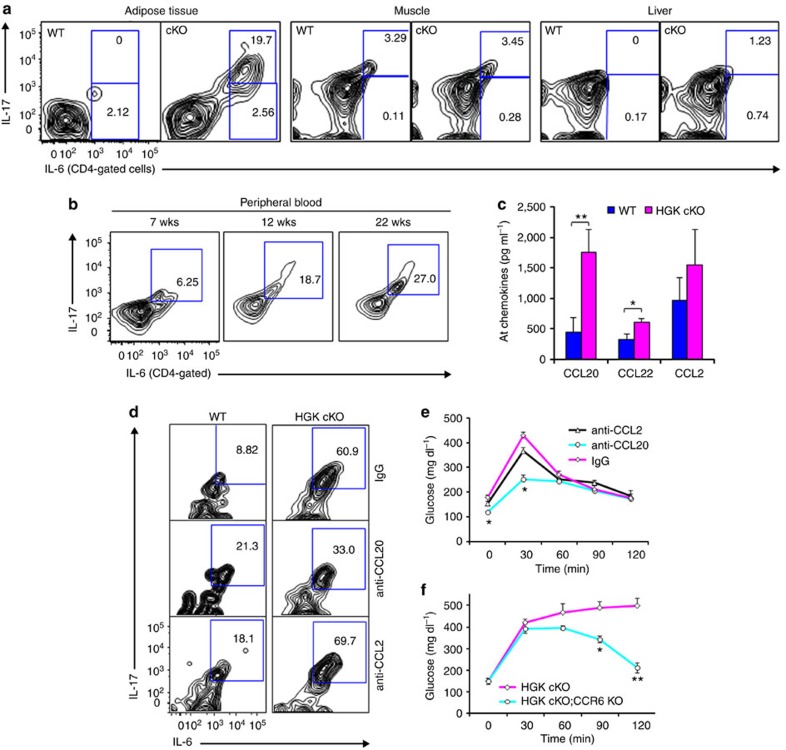
To study whether HGK-deficient IL-6- or IL-17-producing T cells are responsible for insulin resistance, we first analysed infiltrating T cells from insulin-targeted tissues. IL-6-producing CD4+ T cells were increased in adipose tissue of the young T-HGK cKO mice (Fig. 6a). Furthermore, most of the IL-6-producing CD4+ T cells in the adipose tissue of T-HGK cKO mice were IL-17 positive (Fig. 6a). These IL-6 and IL-17 double-positive CD4+ T (IL-6+ Th17) cells were also present in the peripheral blood of T-HGK cKO mice, and the percentages of Th17 cells in T-HGK cKO mice increased with age (Fig. 6b). In addition, the percentages of infiltrating neutrophils, macrophages and CD8+ T cells but not CD4+ T cells were increased in the liver of aged T-HGK cKO mice (Supplementary Fig. 6), suggesting that the liver inflammation and steatosis in T-HGK cKO mice may be due to the enhancement of circulating cytokines or Th17 cells. As the Th17 chemoattractant CCL20 were the most increased in adipose tissue (Fig. 6c), we studied the effect of CCL20 on the accumulation of Th17 cells in adipose tissue using CCL20 neutralization. After CCL20 neutralization, the Th17 population was decreased in adipose tissue and the glucose intolerance was ameliorated in T-HGK cKO mice (Fig. 6d,e). To further demonstrate the involvement of CCL20, we bred T-HGK cKO mice with the knockout mice for CCR6, the CCL20 receptor. Consistently, CCR6-deficient T-HGK cKO (CD4-Cre;HGKf/f;CCR6−/−) mice displayed the enhancement of glucose tolerance during GTT tests (Fig. 6f). These data suggest that the recruitment of Th17 cells to adipose tissue of T-HGK cKO mice induce insulin resistance.
Figure 6. Accumulation of IL-6/IL-17 double-positive T cells in adipose tissue mediated by CCL20-CCR6 interactions.
(a) Cells were isolated from adipose tissue of 8-week-old WT or T-HGK cKO mice. Cells (without stimulation) were stained for expression of IL-6, IL-17, CD3, CD4 or CD45, and then cells were analysed by flow cytometry. Representative contour plots show percentages of IL-6- and IL-17-producing, non-stimulated CD4+ T cells in the insulin-targeted tissues. (b) The peripheral blood of T-HGK cKO mice at indicated ages were isolated, stained for IL-6+ and IL-17+ CD4+ T cells and analysed by flow cytometry. wks, weeks. (c) The levels of indicated chemokines from adipose tissue (AT) of WT or T-HGK cKO mice were determined by ELISA assays. (d) Cells were isolated from adipose tissue of mice at day 2 after CCL20 or CCL2 neutralization. Cells (without stimulation) were stained for expression of IL-6, IL-17, CD4 or CD45, and then cells were analysed by flow cytometry. (e) GTT tests were performed on T-HGK cKO mice at day 2 after CCL2 or CCL20 neutralization. Glucose levels were plotted versus time post glucose injection. n=5 per group. (f) GTT tests were performed on 18-week-old T-HGK cKO (CD4-Cre;HGKf/f) mice (n=6) and CCR6 KO/T-HGK cKO (CD4-Cre;HGKf/f;CCR6−/−) mice (n=5). Glucose levels were plotted versus time post glucose injection. Means±s.e.m. are shown. Glucose levels were plotted versus time. Data shown are representatives of three (a,d) and two (c,b,e,f) independent experiments. Means±s.e.m. are shown. *P-value<0.05; **P-value<0.01 (two-tailed Mann–Whitney U-test).
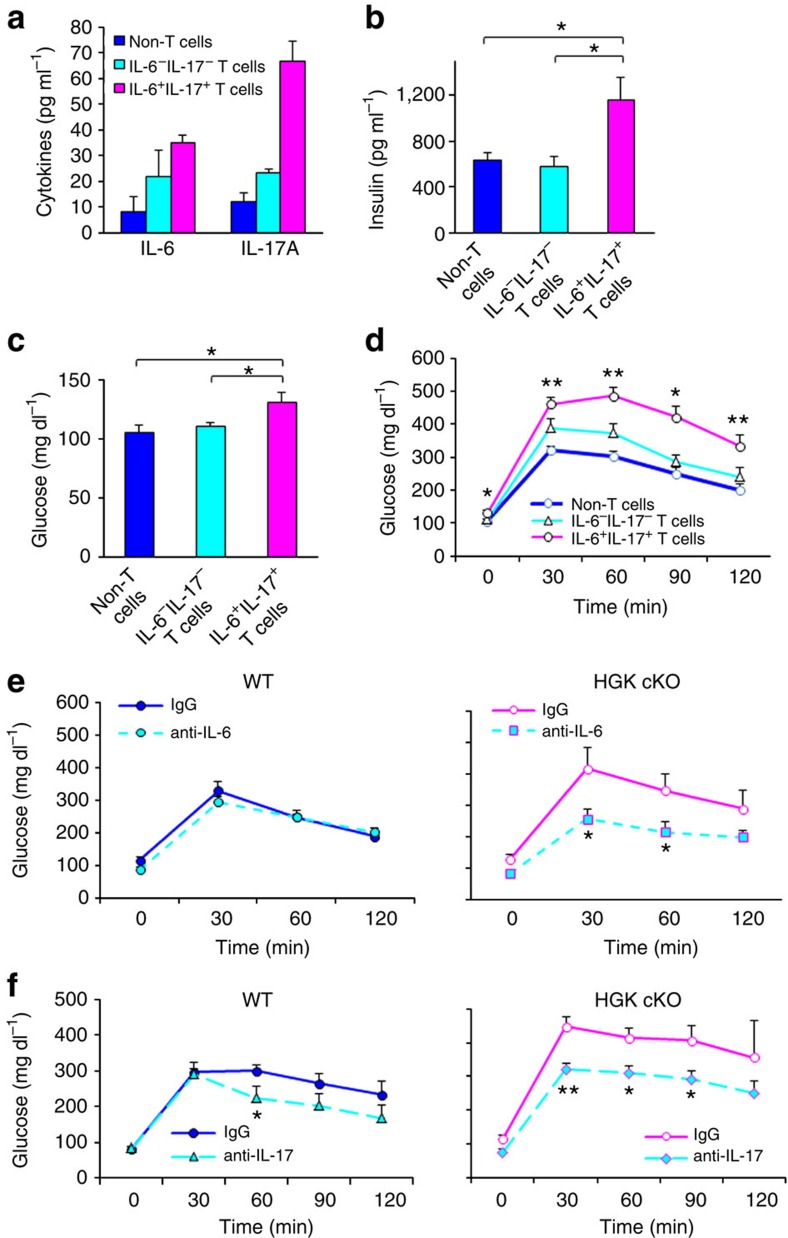
To verify the role of Th17 cells in the induction of insulin resistance in T-HGK cKO mice, these T cells were isolated from T-HGK cKO mice and then transferred to WT recipients. Two weeks after the adoptive transfer, the cells had populated the fat tissue of recipients. Serum levels of fasting insulin, fasting glucose, IL-6 and IL-17 were significantly increased after IL-6+IL-17+ HGK-deficient T-cell transfer but only modestly enhanced by HGK-deficient IL-6−IL-17− T-cell transfer (Fig. 7a–c). Moreover, IL-6+IL-17+ HGK-deficient T cell-transferred recipients displayed insulin resistance during GTT tests (Fig. 7d). These results indicate that HGK-deficient Th17 cells are pathogenic cells causing diabetes.
Figure 7. IL-6/IL-17 double-positive T cells are pathogenic.
ELISA assay of fasting (a) IL-6/IL-17, (b) insulin and (c) glucose levels in the sera of indicated recipients 14 days after adoptive transfer. n=3 in (a); n, at least 5 (b,c). (d) GTT tests were performed on indicated recipients at 14 days after adoptive transfer. n, at least 5. (e,f) GTT tests of 12-week-old mice at day 2 after IL-6 (e) or IL-17 (f) neutralization. Glucose levels were plotted versus time post glucose injection. n=6 per group. Data shown are representatives of two independent experiments. Means±s.e.m. are shown. WT, littermate controls (HGKf/f mice or CD4-Cre mice); HGK cKO, T-HGK cKO mice. *P-value<0.05; **P-value<0.01 (two-tailed Mann–Whitney U-test).
As serum IL-6 and IL-17 levels were elevated in T-HGK cKO mice (Fig. 2b) and IL-6 is known to be involved in T2D27, we studied whether Th17-produced IL-6 or IL-17 mediates the induction of insulin resistance in T-HGK cKO mice. The glucose tolerance in T-HGK cKO mice was significantly restored after IL-6 neutralization (Fig. 7e), indicating that IL-6 contributes to insulin resistance in T-HGK cKO mice. Similar to IL-6 neutralization, IL-17 neutralization also significantly decreased the glucose levels in T-HGK cKO mice during GTT tests, indicating an improvement of insulin sensitivity (Fig. 7f). Taken together, these data indicate that Th17-produced IL-6 and IL-17 play critical roles in the development of insulin resistance in T-HGK cKO mice.
IL-6 facilitates Th17 differentiation in T-HGK cKO mice
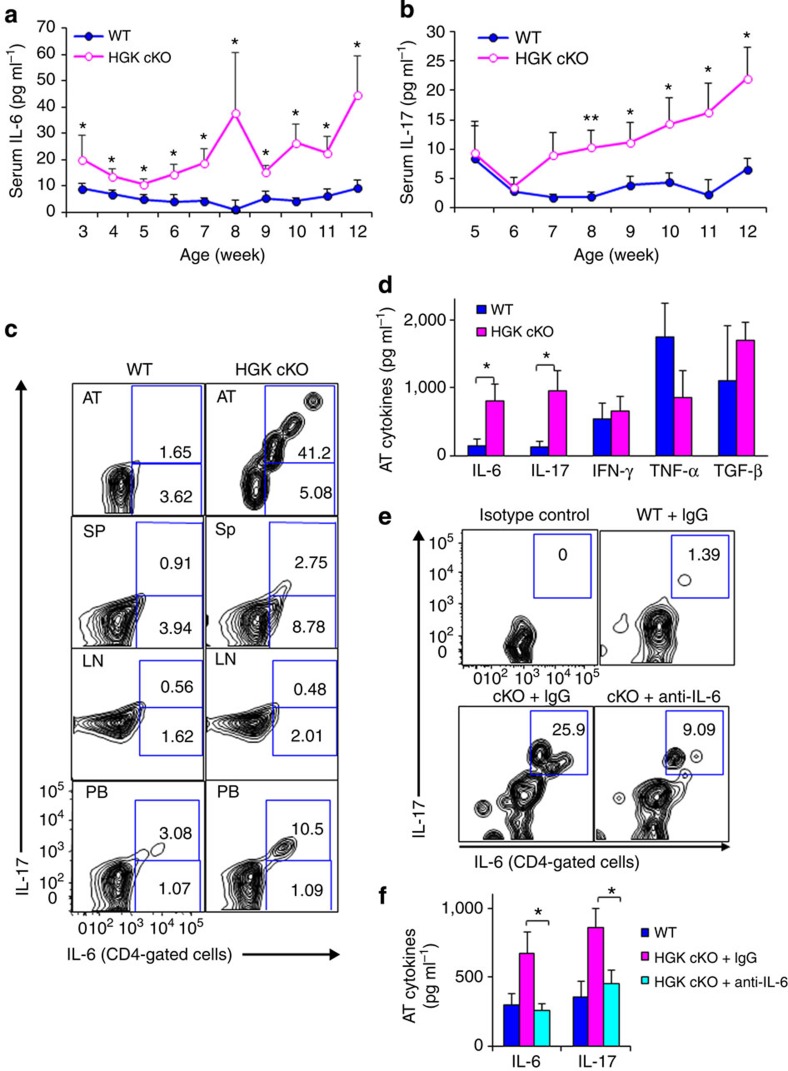
IL-6 is an important stimulator for the differentiation of Th17 (IL-17-producing CD4+ T cells)1. Consistently, IL-6 was induced early in T-HGK cKO mice starting at 3 weeks of age, followed by the induction of IL-17 (starting from 8 weeks; Fig. 8a,b). IL-6 production from HGK-deficient T cells preceded IL-17 production, suggesting that autocrine/paracrine IL-6 from HGK-deficient T cells induces Th17 differentiation in T-HGK cKO mice. Next, we study where Th17 cells were differentiated. Surprisingly, IL-6+IL-17+ double-positive T cells were not accumulated in the spleen and lymph nodes, but were gathered in adipose tissue and the peripheral blood of T-HGK cKO mice (Fig. 8c). It is likely to be that these peripheral blood Th17 cells in T-HGK cKO mice are released from adipose tissue. IL-6 neutralization was used again to verify the role of IL-6 in adipose tissue-induced Th17 differentiation. The percentages of IL-6+IL-17+ double-positive CD4+ T cells and levels of IL-17 in adipose tissue were decreased in 10-week-old T-HGK cKO mice after IL-6 neutralization (Fig. 8d–f). These results support the conclusion that IL-6 is an important factor for Th17 differentiation in adipose tissue of T-HGK cKO mice.
Figure 8. IL-6 promotes Th17 differentiation in adipose tissue of T-HGK cKO mice.
(a) Fasting IL-6 and (b) IL-17 levels in mouse sera were measured by ELISA assays. n=18–23. (c) The percentages of IL-6- and IL-17-producing, non-stimulated CD4+ T cells in the adipose tissue (AT), spleen (Sp), lymph nodes (LN) and peripheral blood (PB) of 10-week-old mice were analysed by flow cytometry. (d) The levels of indicated cytokines from adipose tissue of mice were determined by ELISA assays. (e) Contour plots show the percentages of IL-6- and IL-17-producing, non-stimulated CD4+ T cells from adipose tissue of mice at 2 days after IL-6 neutralization. n=5. (f) The levels of IL-6 and IL-17 from adipose tissue of mice at 2 days after IL-6 neutralization. Data shown are representatives of three (c) and two (e,f) independent experiments. Data are expressed as mean±s.e.m. WT, littermate controls (HGKf/f mice); HGK cKO, T-HGK cKO mice. *P-value<0.05; **P-value<0.01 (a,b, two-tailed Student’s t-test; d,f, two-tailed Mann–Whitney U-test).
Adipose tissue microenvironment promotes Th17 differentiation
It is noticeable that adipose tissue contains a much higher frequency of Th17 cells compared with peripheral blood of T-HGK cKO mice regardless of systemic increase of IL-6 in these mice (Fig. 8c). These data suggest that the adipose tissue microenvironment may have a specific role in promoting Th17 differentiation. Th17-promoting cytokines, such as TGF-β and IL-6, are produced by adipose tissue. However, adipose tissue of T-HGK cKO mice did not secrete more TGF-β (Fig. 8d); moreover, the systemic increase of IL-6 did not significantly increase Th17 cells in the spleen of T-HGK cKO mice (Fig. 8c). These data suggest that adipose tissue secretes something that induces Th17 differentiation.
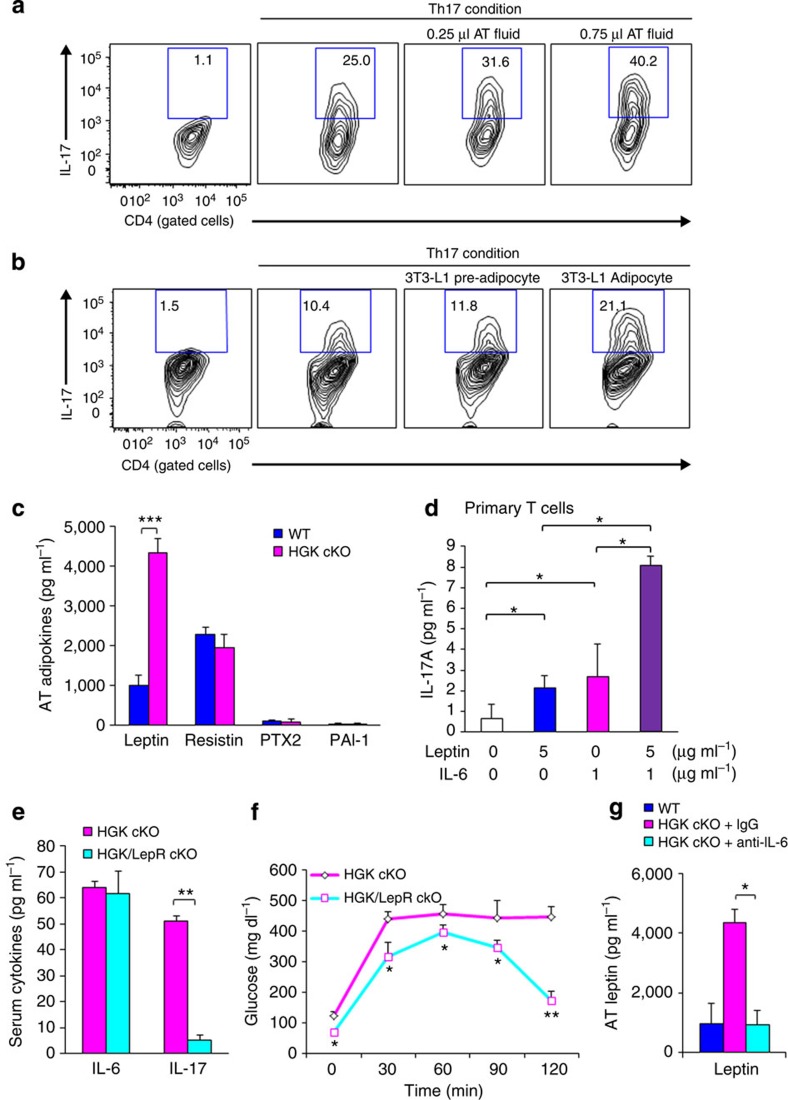
Adipokines are soluble bioactive mediators that are produced mainly by adipose tissue. To study whether adipose tissue-secreted adipokines promoted Th17 differentiation, adipose tissue fluid was used to induce a Th17 population in vitro. The percentage of Th17 was increased by adding adipose tissue fluid under in vitro Th17 differentiation conditions (Fig. 9a). In the absence of adipose tissue fluid, in vitro Th17 differentiation of T-HGK cKO T cells was higher than that of WT T cells (Supplementary Fig. 7); this result may be due to overproduction of IL-6 or other unknown factors secreted from T-HGK cKO T cells. As adipose tissue contains multiple cell types, we next used adipocyte cell lines to rule out contribution from other types of cells in adipose tissue. Similar to adipose tissue fluid, conditioned medium from mature 3T3-L1 adipocytes, but not 3T3-L1 pre-adipocytes, enhanced Th17 differentiation (Fig. 9b). Thus, the adipokines in adipose tissue of T-HGK cKO mice may drive Th17 development from IL-6-producing HGK-deficient T cells in situ. These results indicate that both IL-6 and adipokines are important for Th17 differentiation in adipose tissue.
Figure 9. Leptin cooperates with IL-6 to promote Th17 differentiation.
(a,b) CD4+CD25− T cells were purified from spleens of WT mice and cultured for 4 days under Th17 differentiation conditions in the presence or absence adipose tissue fluids (a) or 3T3-L1 adipocyte conditioned medium (b). After Th17 differentiation, T cells were stimulated with PMA and ionomycin, and analysed for IL-17 expression by intracellular staining. Contour plots depict IL-17-producing CD4 T cells. Numbers indicate the percentages of cells in the quadrants. (c) The levels of indicated adipokines from adipose tissue of WT and T-HGK cKO mice were determined by ELISA assays. (d) The IL-17 levels in supernatants of the primary T cells stimulated with leptin and/or IL-6 for 3 days were determined by ELISA assays. (e) IL-6 and IL-17 levels in the sera of 16-week-old T-HGK cKO (CD4-Cre;HGKf/f) mice and T-HGK/LepR cKO (CD4-Cre;HGKf/f;leptin receptorf/f) mice were measured by ELISA assays. n=6. (f) GTT tests were performed on 16-week-old T-HGK cKO mice and T-HGK/LepR cKO mice. Glucose levels were plotted versus times post glucose injection. (g) The leptin levels in adipose tissue of mice after IL-6 neutralization. Data shown are representatives of three (a,b,d) and two (c,e,f,g) independent experiments. Data are expressed as mean±s.e.m. *P-value<0.05; **P-value<0.01; ***P-value<0.001 (two-tailed Mann–Whitney U-test).
The adipokine array showed four adipokines that were potentially increased in adipose tissue fluid from HGK cKO mice (Supplementary Fig. 8a). Data of enzyme-linked immunosorbent assay (ELISA) assays further confirmed that adipose tissue of T-HGK cKO mice indeed secreted more leptin (Fig. 9c). Consistently, the increase of serum leptin levels preceded the induction of serum IL-17 levels in T-HGK cKO mice (Fig. 8b and Supplementary Fig. 8b). Leptin induced IL-17 production from in vitro-cultured primary CD4+ T cells (Fig. 9d) as reported31. Furthermore, leptin synergized with IL-6 in inducing IL-17 production from CD4+ T cells (Fig. 9d). The adipose tissue fluid-induced Th17 differentiation was reduced by adding anti-leptin neutralizing antibodies (Supplementary Fig. 8c). Thus, the increase of IL-6 and leptin in adipose tissue of T-HGK cKO mice may drive Th17 development from IL-6-producing HGK-deficient T cells in situ. Leptin receptor is ubiquitously expressed in many tissues such as the hypothalamus, liver, ovarian and adipocytes32. To further demonstrate the role of leptin in promoting Th17 differentiation in adipose tissue of T-HGK cKO mice, floxed leptin receptor mice were used to knock out leptin receptor specifically in T cells. Serum IL-17 levels were drastically reduced in T-HGK/LepR cKO (CD4-Cre;HGKf/f;leptin receptorf/f) mice, whereas serum IL-6 levels were unaffected by leptin receptor deficiency (Fig. 9e). Moreover, the glucose levels were decreased in T-HGK/LepR cKO mice during GTT tests (Fig. 9f). The data strongly indicate that leptin plays a critical role in the differentiation of Th17 cells from IL-6-producing T cells in T-HGK cKO mice. Moreover, leptin levels were also decreased in adipose tissue after IL-6 neutralization (Fig. 9g). These results indicate that IL-6 secretion from HGK-deficient T cells induces leptin overproduction, which in turn cooperates with IL-6 in promoting Th17 differentiation in adipose tissue (Fig. 10). As leptin deficiency enhances Treg proliferation33, we also studied whether Treg proliferation is reduced by leptin in adipose tissue of T-HGK cKO mice. The cell number of Treg cells in adipose tissue was not significantly decreased in T-HGK cKO mice compared with that in WT mice (Supplementary Fig. 9).
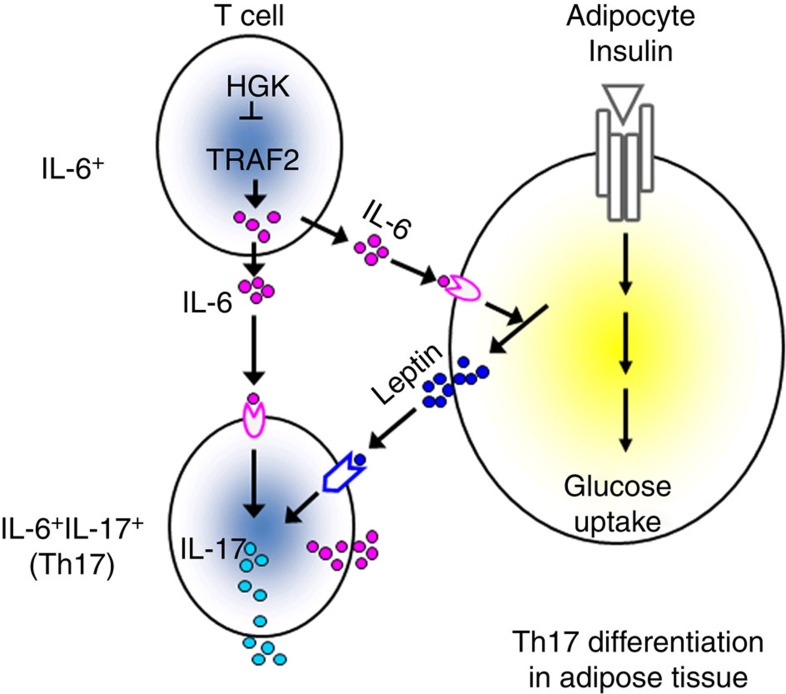
Figure 10. Schematic diagram of HGK-mediated reciprocal regulation between T cells and adipocytes.
HGK deficiency leads to constitutive TRAF2 overexpression and IL-6 overproduction in T cells. The circulating IL-6-producing T cells infiltrate to adipose tissue and enhance the production of leptin, which in turn cooperates with IL-6 to induce Th17 differentiation. The induction of adipose tissue Th17 cells leads to insulin resistance.
Discussion
A key finding of our study is that HGK induces lysosomal degradation of TRAF2 by directly phosphorylating TRAF2 Ser35. Previous reports indicate that TRAF2 overexpression induces IL-6 production25; our results showed that HGK deficiency resulted in constitutive overexpression of TRAF2, and that IL-6 overproduction in HGK-deficient T cells was mediated by TRAF2. The RING finger domain of TRAF2 is responsible for lysosomal degradation34,35. Our results showed that Ser35 phosphorylation at the RING domain of TRAF2 by HGK played a critical role in controlling TRAF2 levels through lysosomal, but not proteasomal, degradation. Thus, HGK is a key kinase that phosphorylates TRAF2, resulting in constitutive degradation of TRAF2 and negative regulation of IL-6 production in resting T cells. Nevertheless, it remains possible that HGK may be involved in other signalling pathways.
The results of IL-6 neutralizations suggest that IL-6 overproduction by T cells may contribute to insulin resistance. In vitro studies show that IL-6 directly suppresses insulin signalling and glucose uptake in hepatocytes36 and adipocytes37,38, and that long-term IL-6 treatment inhibits insulin signalling in skeletal muscle cells39,40. The in vivo roles of IL-6 are much more complex41. Acutely elevated IL-6 enhances insulin secretion from the pancreas and improves glucose tolerance in mice42, whereas chronic IL-6 infusion causes hepatic insulin resistance in mice43. Global deletion of IL-6 in mice leads to mature-onset obesity and glucose intolerance via the effect of IL-6 on the brain44, while IL-6 knockout mice display either higher or lower insulin levels45,46. These conflicting results could be due to the difference in mouse genetic backgrounds or housing conditions45. In addition, the development of insulin resistance also depends on where IL-6 acts and how the target cells response to IL-6 (refs 47, 48, 49, 50). Myeloid cell-specific IL-6 receptor knockout mice display M1 macrophage-mediated inflammation and insulin resistance47, while IL-6 overexpression in the brain and lung of the transgenic mice results in increased insulin sensitivity via enhancing leptin action in hypothalamus48. Liver-specific IKK transgenic mice develop IL-6-dependent hepatic insulin resistance49, while skeletal muscle-specific IL-6 electro-transferred mice display insulin resistance50. Our results indicate that IL-6-overproducing T cells in adipose tissue induce insulin resistance. Taken together, insulin resistance may be determined by whether high levels of IL-6 are induced in the microenvironment of insulin target tissues.
The results of adoptive transfer experiments and IL-17 neutralizations indicate that IL-6-producing Th17 cells contribute to the pathogenesis of T2D. Our finding is consistent with a previous report that IL-17 inhibits glucose uptake51. Our results also showed that the body weights of T-HGK cKO mice were slightly increased and even decreased after 24 weeks of age, which may be due to the inhibition of adipogenesis by IL-17 (ref. 51). Furthermore, IL-17-negative IL-6+ T cells were detected in T-HGK cKO mice before 7 weeks of age, preceding hyperglycemia induction. These data suggest that induction of Th17 differentiation from IL-6+ T cells is a critical mechanism in the pathogenesis of insulin resistance.
Although increased IL-6-producing T cells were circulating in T-HGK cKO mice, adipose tissue was the initial target for insulin resistance. This result indicates that IL-6-producing HGK−/− T cells act locally in adipose tissue. IL-6 neutralization suppressed the secretion of leptin and IL-17, as well as the population of Th17 in adipose tissue. It is known that IL-6 plus glucocorticoid stimulates leptin production in adipocytes52, and that leptin promotes Th17 differentiation53,54. In this report, we showed that leptin receptor deficiency in T cells resulted in the inhibition of Th17 differentiation and the enhancement of insulin sensitivity in T-HGK cKO mice. Moreover, leptin synergized with IL-6 in inducing IL-17 production from T cells. Our data indicate that IL-6 cooperates with leptin in induction of Th17 differentiation in adipose tissue. Taken together, our data support the model of reciprocal regulation between T cells and adipocytes: the circulating IL-6-producing T cells infiltrate adipose tissue and induce leptin secretion from adipocytes, which in turn provides an appropriate microenvironment for Th17 differentiation. Thus, the induction of adipose tissue IL-6+IL-17+ double-positive Th17 cells leads to insulin resistance.
Our results derived from T-HGK cKO mice suggest that HGK deficiency-induced IL-6 overproduction in T cells may be involved in T2D pathogenesis. Through screening 1,769 DNA samples from the peripheral blood of prediabetic Europeans, a previous study found that two singlenucleotide polymorphisms (SNPs) in the HGK locus are associated with increased glucose levels in patients; moreover, one of these two HGK SNPs and a third SNP are associated with enhanced serum IL-6 but not with TNF-α levels55. Thus, this report and our findings support the idea that HGK downregulation or dysfunction in blood cells is important for the pathogenesis of T2D.
In summary, loss of HGK in T cells results in TRAF2 overexpression and IL-6 overproduction, which further induces Th17 differentiation; these Th17 cells cause insulin resistance. Our report unveils critical molecular and cellular mechanisms of insulin resistance and provides a novel insight in the reciprocal regulation between the immune system and metabolism. Moreover, T-cell-specific HGK conditional knockout mice provide a novel animal model for studying T2D.
Materials and methods
Mice
A mouse HGK floxed allele (HGKflox) was generated in which exon 1 and exon 2 of HGK are flanked by loxP sites (Fig. 1a). Mice homozygous for HGK floxed allele were bred with CD4-Cre transgenic mice. As CD4 was expressed in double-positive (CD4+CD8+) phase during T-cell development, Cre recombinase driven by the CD4 promoter induced the excision of the floxed HGK gene in double-positive thymocytes and mature CD4+ or CD8+ T cells. Mice were backcrossed to C57BL/6 background for five generations (F5; B97%) and F10. Sex-matched littermate HGKf/f and CD4-Cre transgenic mice were used as control mice in all experiments; the serum glucose/cytokine levels in these control mice were similar to those in WT B6 mice. The data presented in this study were performed on sex-matched, 2- to 26-week-old littermates. For body weight measurement, 2-week-old sex-matched mice were monitored for 24 weeks. For GTT and ITT experiments, 12-week-old, sex-matched mice were used. For cell transfer experiments, 16-week-old T-HGK cKO mice and 10-week-old WT mice were used. Mice were randomly assigned to in vivo animal experiments. Floxed leptin receptor mice56 (JAX008327) and CCR6 knockout mice57 (JAX013061) were purchased from the Jackson Laboratory. Mice were maintained in temperature-controlled and pathogen-free cages. All mice were used according to the protocols and guidelines approved by the Institutional Animal Care and Use Committee of the National Health Research Institutes.
Cell lines
Human Jurkat T leukemia cells (American Type Cell Culture: TIB-152) were cultured in RPMI-1640 medium (Invitrogen) containing 10% FCS (Invitrogen) plus penicillin (10 units ml−1) and streptomycin (10 mg ml−1) (Invitrogen). HEK293T cells (American Type Cell Culture: CRL-11268) were cultured in DMEM medium (Invitrogen) containing 10% FCS plus penicillin (10 units ml−1) and streptomycin (10 mg ml−1). The cells were free of mycoplasma contamination.
Reagents and plasmids
HGK antibody was generated by immunization of rabbits with individual peptides (HGK epitope: HAPEPKPHYDPADRAREV). Anti-actin and anti-tubulin antibodies were purchased from Sigma. Anti-p-IRS-1 (S612; 2386), anti-p-IRS-1 (Y896; 3070) and anti-IRS-1 (#2382) antibodies were purchased from Cell Signaling. Anti-TRAF1 (H-3), anti-TRAF2 (H-10), anti-TRAF3 (M-51), anti-TRAF4 (C-20), anti-TRAF5 (C-19) and anti-TRAF6 (D-10) antibodies were purchased from Santa Cruz. All first antibodies for immunoblotting were used in 1:1,000 dilution. The expression plasmids for HGK and HGK kinase-dead mutant were as described previously8. CFP-tagged HGK, Flag-tagged TRAF2 and YFP-tagged TRAF2 were constructed by subcloning the individual complementary DNA into pCMV6-AC-CFP, pCMV6-AC-Flag and pCMV6-AC-YFP vectors (OriGene Technologies), respectively. The TRAF2 short hairpin RNA plasmid was established by the National RNAi Core Facility (Taiwan) and its repeat insertion (5′-GCGATCTTCATCAAAGCTATT-3′) was subcloned into pSUPER-GFP vector (OligoEngine, Inc.). Lysotracker was purchased from Molecular Probes.
Immunoblotting analysis
The kinase reaction mixtures or cell extracts were fractionated on 6–8% SDS–polyacrylamide gels and transferred onto polyvinylidene difluoride membranes. The membranes were incubated with individual primary antibodies and then with horseradish peroxidase-conjugated secondary antibodies. The horseradish peroxidase substrate reaction was performed using chemiluminescence detection system and detected by charge coupled device camera (BioSpectrum 500 imaging system). Full blots are shown in Supplementary Fig. 10.
Glucose tolerance and insulin tolerance tests
For GTT tests, mice were intraperitoneally injected with 2 g kg−1 glucose after 16 h fasting. Glucose and insulin levels were measured from blood samples collected from mouse tails. For ITT tests, mice were injected intraperitoneally with 0.75 U kg−1 insulin after 16 h fasting, followed by measurement of blood glucose levels every 15 min. Blinding experiments were done in GTT and ITT tests.
IL-6 neutralization
Mice at 8 weeks of age were injected via tail veins with 50 μg anti-IL-6 antibodies (MP5-20F3; BioLegend) or control IgG antibodies (RTK2071; BioLegend) every other day for 10 days, followed by GTT tests at day 12. In the case of Fig. 8e,f, IL-6 neutralization was conducted in mice at 8 weeks of age.
IL-17 neutralization
Mice at 10 weeks of age were injected via tail veins with 45 μg anti-IL-17 antibodies (MAB421; R&D) or control IgG antibodies (MAB006; R&D) every other day for 10 days, followed by GTT tests 2 days after the last injection.
Cell transfer experiment
Mouse CD3+ T cells were negatively selected from the spleen, lymph nodes and peripheral blood of 16-week-old mice. Most (>90%) of IL-6+IL-17+ T cells from T-HGK cKO mice expressed both CCR4 and CCR6. In the second round of purification, IL-6+IL-17+ T cells were isolated from the CD3+ T cells using magnetically coupled antibodies against mouse CCR4. The remaining population was used as control cells. Cells were labelled with the cytosolic dye carboxyfluorescein succinimidyl ester (CFSE) and then injected into 10-week-old WT mice (2.5 × 10⁶ cells per mouse) intravenously.
Measurements of glucose and cytokines
Blood glucose concentrations were measured using ACCU-CHEK Active test strips and blood glucose meter (Roche). Serum insulin concentrations were measured by solid phase two-site enzyme immunoassays (Mercodia). Adipokines were measured by ELISA assay (R&D). Cytokines and chemokines were assayed by ELISA assay. The RANTES ELISA kit was from Proteck; the TGF-β ELISA kit was from R&D; the rest was from eBioscience.
Flow cytometry analyses
For the staining of cell surface markers, cells were harvested, washed with 2% fetal bovine serum (FBS in PBS), and stained with individual antibodies (1:100 dilution) for 30 min at room temperature. For intracellular staining, peripheral blood cells were permeabilized in 200 μl Cytofix/Cytoperm buffer (BD Biosciences) for 16 h and washed with Perm-Wash buffer, and then incubated with individual antibodies (1:50 dilution) for 2 h. For peripheral blood leukocytes isolated from human subjects, cells were immediately treated with Golgi-stop before staining. Data were collected with FACSCanto II (BD Biosciences) and analysed using FlowJo software.
The antibodies used for staining are as follows: anti-mCD4-FITC (GK1.5), anti-mCD8-APC-Cy7 (53-6.7), anti-mB220 (RA3-6B2), anti-mCD4-Pacific blue (RM4-5), anti-mCD11b-APC (M1/70), anti-mIFN-γ-FITC (XMG1.2) and anti-mIL-17-Alex 647 (BL168) antibodies, which were purchased from BioLegend; anti-mGr-1-PerCP-Cy5.5 (RB6-8C5) and anti-mIL-6-PE (MP5-20F3) antibodies, which were purchased from BD Biosciences.
Transient transfection of primary T cells
For transient transfection assays, primary T cells were transfected using the Neon Transfection System (Invitrogen Corp.). The settings for human or mouse primary T cells (1 × 10⁷) were 2,200 V, duration of 20 ms and 1 pulse. To induce cytokine production of 3-day-cultured T cells, the primary T cells were stimulated with 5 μg ml−1 PMA plus ionomycin (Sigma) for 3 h at 37 °C.
α-Technology/protein–protein interaction assays
Amplified luminescent proximity homogeneous assays (α) technology experiments were performed according to the manufacturer’s protocol (Perkin Elmer Life Sciences). HEK293T cells were co-transfected with Myc-HGK plus either Flag-TRAF2 or Myc/Flag vector for 24 h. The cells were lysed in lysis buffer (50 mM Tris–HCl, 125 mM NaCl, 5% glycerol, 0.2% NP40, 1.5 mM MgCl2, 25 mM NaF and 1 mM Na3VO4). The transfectant lysates were incubated with acceptor beads (AlphaScreen ani-Myc beads, Perkin Elmer) for 60 min and then incubated with donor beads (AlphaLISA anti-Flag beads, Perkin Elmer) for another 60 min. If the donor–acceptor pair is within 200 nm, a chemiluminescent signal (α-signal) will be generated58. The α-signal was determined by EnVision 2104 Multilabel Reader (Perkin Elmer).
CCL2 and CCL20 neutralization
Mice at 12 weeks of age were injected via tail veins with 45 μg neutralizing antibodies or control IgG antibodies (AB-108-C; R&D) every other day for 10 days, followed by GTT tests 2 days after the fifth (final) injection. The neutralizing antibodies used were anti-CCL2 antibodies (AB-479-NA; R&D) and anti-CCL20 antibodies (AF760; R&D).
Preparation of mouse tissue immune cells and fluids
Tissues were homogenized by gentleMACS Dissociator (Miltenyi Biotec) to obtain single-cell suspension. After incubation in RIMP medium with collagenase II (Sigma) at 37 °C for 15 min, cell mixtures were homogenized again and washed with 15 ml PBS. Immune cells were enriched by Ficoll extraction. For tissue fluid collection, tissues were extirpated, rinsed with saline to remove blood from the surface and blotted gently with tissue paper. Tissues weighing 0.2 g were transferred intact to Eppendorf tubes. Tissues were roughly torn on ice using curved forceps. Tissue fluids were isolated immediately by centrifugation at 13,000 r.p.m. at 4 °C for 20 min, and then fluids without cells were collected.
In vitro Th17 differentiation
CD4+CD25− cells were purified from lymph node of mice. Cells (2.5 × 10⁵) were cultured in 500 μl medium in 48-well plates coated with anti-CD3 (2 μg ml−1) and anti-CD28 (3 μg ml−1) antibodies. For Th17 differentiation, cells were cultured in medium containing 10 ng ml−1 IL-6, 2.5 ng ml−1 TGF-β, 25 ng ml−1 IL-23, 2.5 μg ml−1 anti-IL-4 and 2.5 μg ml−1 anti-IFN-γ antibodies.
3T3-L1 adipocyte differentiation
3T3-L1 fibroblasts were cultured in six-well plates in 2 ml DMEM supplemented with 10% (v/v) FBS. At 2 days post seeding, cells were induced to differentiate into adipocytes with DMEM supplemented with 10% FBS, 1 μg ml−1 insulin (Novo Nordisk), 1 μM dexamethasone (Sigma), 0.5 mM isobutylmethylxanthine (Sigma) and 1 μM dexamethasone (Sigma). After 3 days, the media were replaced with 10% FBS DMEM. The cells were subsequently re-fed every 48 h with 10% FBS DMEM. The supernatants were collected at 9 days post differentiation.
Liquid chromatography–mass spectrometry
Specific protein bands from Instant blue-stained SDS–PAGE gels were excised, destained and digested with trypsin. The resulting peptide mixtures were loaded on a nano Acquity system (Waters, Milford, MA) connected to an LTQ-Orbitrap XL hybrid mass spectrometer (Thermo Fisher Scientific, Bremen, Germany) equipped with a nanospray interface (Proxeon, Odense, Denmark). Peptide mixtures were loaded onto a 75-μm ID, 25-cm length C18 BEH column (Waters) packed with 1.7 μm particles with a pore width of 130 Å and were separated using a segmented gradient (5–40% solvent B in 60 min) at a flow rate of 300 nl min−1 and a column temperature of 35 °C. Solvent A was 0.1% formic acid in water. The mass spectrometer was operated in data-dependant mode. Briefly, full-scan mass spectrometry (MS) spectra were acquired in the orbitrap (m/z 350–1,600) with the resolution set to 60,000 at m/z 400 and automatic gain control target at 106. The ten most intense ions were sequentially isolated for CID MS/MS fragmentation and detection in the linear ion trap (automatic gain control target at 7,000) with previously selected ions dynamically excluded for 90 s. Ions with singly and unrecognized charge state were also excluded. To improve the fragmentation spectra of the phosphopeptides, ‘multistage activation’ at 97.97, 48.99 and 32.66 Thomson relative to the precursor ion was enabled in all MS/MS events. All the measurements in the orbitrap were performed with the lock-mass option for internal calibration.
Statistical analyses
All experiments were repeated at least three times. Data are presented as mean±s.e.m. Kolmogorov–Smirnov and Shapiro–Wilk tests for normality of each column data were performed using SPSS 19 software. The statistical significance between two unpaired groups was analysed using two-tailed Student’s t-test for normally distributed data or using the two-tailed Mann–Whitney U-test for non-normally distributed data. Power calculations were performed using G*Power 3.1.6 software (available at http://www.psycho.uniduesseldorf.de/abteilungen/aap/gpower3/ download-and-register). The statistical analyses were independently verified by two senior biostatisticians.
Author contributions
H.-C.C. designed and performed experiments, analysed and interpreted data, and wrote the manuscript. W.-H.H.S. provided technical and material support. Y.-T.L., C.-Y.T., C.-Y.Y., Y.-J.C, P.-Y.H., J.-P.L. and L.-L.C. performed experiments; X.W. assisted in the experimental design and manuscript writing. M.X. and M.D.S. generated the T-HGK cKO mice. T.-H.T. conceived the study, supervised experiments, and wrote the manuscript.
Additional information
How to cite this article: Chuang, H.-C. et al. HGK/MAP4K4 deficiency induces TRAF2 stabilization and Th17 differentiation leading to insulin resistance. Nat. Commun. 5:4602 doi: 10.1038/ncomms5602 (2014).
Supplementary Material
Supplementary Figures 1-10
Acknowledgments
We thank the Core Facilities and the Laboratory Animal Center of the National Health Research Institutes (NHRI, Taiwan) for tissue sectioning/haematoxylin and eosin staining and triglyceride measuring, respectively. We thank NHRI’s Core Facilities for confocal microscopy. We also thank the Taiwan Mouse Clinic, which is supported by the National Science Council of Taiwan’s National Research Program for Biopharmaceuticals (NRPB), for technical support with the food intake and respiratory exchange ratio experiments. We thank Academia Sinica’s Institute of Biological Chemistry for use of its LTQ-Orbitrap XL hybrid mass spectrometer to analyse the proteomics data. We also thank the biostatisticians Dr Hsiao-Hui S. Tsou (at NHRI) and Dr Kuang-Hsi Chang (at Taichung Veterans General Hospital) for assistance in statistical analyses. This work was supported by NHRI, Taiwan, grant 98A1-IMPP01-014 (to T.-H. T), by Taichung Veterans General Hospital, Taiwan, grant TCVGH-NHRI07 (to W.H-H.S) and by National Institutes of Health, USA, grant RO1 HL52555 (to M.D.S.).
References
- Korn T., Bettelli E., Oukka M. & Kuchroo V. K. IL-17 and Th17 Cells. Annu. Rev. Immunol. 27, 485–517 (2009). [DOI] [PubMed] [Google Scholar]
- Muranski P. & Restifo N. P. Essentials of Th17 cell commitment and plasticity. Blood 121, 2402–2414 (2013). [DOI] [PMC free article] [PubMed] [Google Scholar]
- Singh S. P., Zhang H. H., Foley J. F., Hedrick M. N. & Farber J. M. Human T cells that are able to produce IL-17 express the chemokine receptor CCR6. J. Immunol. 180, 214–221 (2008). [DOI] [PubMed] [Google Scholar]
- Lim H. W., Lee J., Hillsamer P. & Kim C. H. Human Th17 cells share major trafficking receptors with both polarized effector T cells and FOXP3+ regulatory T cells. J. Immunol. 180, 122–129 (2008). [DOI] [PubMed] [Google Scholar]
- Weaver C. T., Elson C. O., Fouser L. A. & Kolls J. K. The Th17 pathway and inflammatory diseases of the intestines, lungs, and skin. Annu. Rev. Pathol. 8, 477–512 (2013). [DOI] [PMC free article] [PubMed] [Google Scholar]
- Tesmer L. A., Lundy S. K., Sarkar S. & Fox D. A. Th17 cells in human disease. Immunol. Rev. 223, 87–113 (2008). [DOI] [PMC free article] [PubMed] [Google Scholar]
- Jagannathan-Bogdan M. et al. Elevated proinflammatory cytokine production by a skewed T cell compartment requires monocytes and promotes inflammation in type 2 diabetes. J. Immunol. 186, 1162–1172 (2011). [DOI] [PMC free article] [PubMed] [Google Scholar]
- Yao Z. et al. A novel human STE20-related protein kinase, HGK, that specifically activates the c-Jun N-terminal kinase signaling pathway. J. Biol. Chem. 274, 2118–2125 (1999). [DOI] [PubMed] [Google Scholar]
- Xue Y. et al. Mesodermal patterning defect in mice lacking the Ste20 NCK interacting kinase (NIK). Development 128, 1559–1572 (2001). [DOI] [PubMed] [Google Scholar]
- Danai L. V. et al. MAP4K4 suppresses Srebp-1 and adipocyte lipogenesis independent of JNK signaling. J. Lipid Res. 54, 2697–2707 (2013). [DOI] [PMC free article] [PubMed] [Google Scholar]
- Tang X. et al. An RNA interference-based screen identifies MAP4K4/NIK as a negative regulator of PPARγ, adipogenesis, and insulin-responsive hexose transport. Proc. Natl Acad. Sci. USA 103, 2087–2092 (2006). [DOI] [PMC free article] [PubMed] [Google Scholar]
- Bouzakri K. & Zierath J. R. MAP4K4 gene silencing in human skeletal muscle prevents tumor necrosis factor-α-induced insulin resistance. J. Biol. Chem. 282, 7783–7789 (2007). [DOI] [PubMed] [Google Scholar]
- Bouzakri K., Ribaux P. & Halban P. A. Silencing mitogen-activated protein 4 kinase 4 (MAP4K4) protects β cells from tumor necrosis factor-α-induced decrease of IRS-2 and inhibition of glucose-stimulated insulin secretion. J. Biol. Chem. 284, 27892–27898 (2009). [DOI] [PMC free article] [PubMed] [Google Scholar]
- Aouadi M. et al. Orally delivered siRNA targeting macrophage MAP4K4 suppresses systemic inflammation. Nature 458, 1180–1184 (2009). [DOI] [PMC free article] [PubMed] [Google Scholar]
- Collins C. S. et al. A small interfering RNA screen for modulators of tumor cell motility identifies MAP4K4 as a promigratory kinase. Proc. Natl Acad. Sci. USA 103, 3775–3780 (2006). [DOI] [PMC free article] [PubMed] [Google Scholar]
- Liang J. J. et al. Expression of MAP4K4 is associated with worse prognosis in patients with stage II pancreatic ductal adenocarcinoma. Clin. Cancer Res. 14, 7043–7049 (2008). [DOI] [PubMed] [Google Scholar]
- Hao J. M. et al. A five-gene signature as a potential predictor of metastasis and survival in colorectal cancer. J. Pathol. 220, 475–489 (2010). [DOI] [PubMed] [Google Scholar]
- Qiu M. H. et al. Expression and prognostic significance of MAP4K4 in lung adenocarcinoma. Pathol. Res. Pract. 208, 541–548 (2012). [DOI] [PubMed] [Google Scholar]
- Loftus J. C. et al. A novel interaction between Pyk2 and MAP4K4 is integrated with glioma cell migration. J. Signal Transduct. 2013, 956580 (2013). [DOI] [PMC free article] [PubMed] [Google Scholar]
- Hu M. C., Qiu W. R., Wang X., Meyer C. F. & Tan T. H. Human HPK1, a novel human hematopoietic progenitor kinase that activates the JNK/SAPK kinase cascade. Genes Dev. 10, 2251–2264 (1996). [DOI] [PubMed] [Google Scholar]
- Diener K. et al. Activation of the c-Jun N-terminal kinase pathway by a novel protein kinase related to human germinal center kinase. Proc. Natl Acad. Sci. USA 94, 9687–9692 (1997). [DOI] [PMC free article] [PubMed] [Google Scholar]
- Shui J. W. et al. Hematopoietic progenitor kinase 1 negatively regulates T cell receptor signaling and T cell-mediated immune responses. Nat. Immunol. 8, 84–91 (2007). [DOI] [PubMed] [Google Scholar]
- Chuang H. C. et al. The kinase GLK controls autoimmunity and NF-κB signaling by activating the kinase PKC-θ in T cells. Nat. Immunol. 12, 1113–1118 (2011). [DOI] [PubMed] [Google Scholar]
- Liu H., Su Y. C., Becker E., Treisman J. & Skolnik E. Y. A Drosophila TNF-receptor-associated factor (TRAF) binds the Ste20 kinase Misshapen and activates Jun kinase. Curr. Biol. 9, 101–104 (1999). [DOI] [PubMed] [Google Scholar]
- Takeuchi M., Rothe M. & Goeddel D. V. Anatomy of TRAF2. Distinct domains for nuclear factor-κB activation and association with tumor necrosis factor signaling proteins. J. Biol. Chem. 271, 19935–19942 (1996). [DOI] [PubMed] [Google Scholar]
- Walsh M. C., Kim G. K., Maurizio P. L., Molnar E. E. & Choi Y. TRAF6 autoubiquitination-independent activation of the NFκB and MAPK pathways in response to IL-1 and RANKL. PLoS ONE 3, e4064 (2008). [DOI] [PMC free article] [PubMed] [Google Scholar]
- Bastard J. P. et al. Adipose tissue IL-6 content correlates with resistance to insulin activation of glucose uptake both in vivo and in vitro. J. Clin. Endocrinol. Metab. 87, 2084–2089 (2002). [DOI] [PubMed] [Google Scholar]
- Chakrabarti P. & Kandror K. V. Adipose triglyceride lipase: a new target in the regulation of lipolysis by insulin. Curr. Diabetes. Rev. 7, 270–277 (2011). [DOI] [PubMed] [Google Scholar]
- Morino K. et al. Muscle-specific IRS-1 Ser->Ala transgenic mice are protected from fat-induced insulin resistance in skeletal muscle. Diabetes 57, 2644–2651 (2008). [DOI] [PMC free article] [PubMed] [Google Scholar]
- Copps K. D. et al. Irs1 serine 307 promotes insulin sensitivity in mice. Cell Metab. 11, 84–92 (2010). [DOI] [PMC free article] [PubMed] [Google Scholar]
- Won H. Y. et al. Prominent bone loss mediated by RANKL and IL-17 produced by CD4+ T cells in TallyHo/JngJ mice. PLoS One 6, e18168 (2011). [DOI] [PMC free article] [PubMed] [Google Scholar]
- Tartaglia L. A. et al. Identification and expression cloning of a leptin receptor, OB-R. Cell 83, 1263–1271 (1995). [DOI] [PubMed] [Google Scholar]
- Procaccini C. et al. An oscillatory switch in mTOR kinase activity sets regulatory T cell responsiveness. Immunity 33, 929–941 (2010). [DOI] [PMC free article] [PubMed] [Google Scholar]
- Vince J. E. et al. TWEAK-FN14 signaling induces lysosomal degradation of a cIAP1-TRAF2 complex to sensitize tumor cells to TNFα. J. Cell Biol. 182, 171–184 (2008). [DOI] [PMC free article] [PubMed] [Google Scholar]
- Li L., Soetandyo N., Wang Q. & Ye Y. The zinc finger protein A20 targets TRAF2 to the lysosomes for degradation. Biochim. Biophys. Acta 1793, 346–353 (2009). [DOI] [PMC free article] [PubMed] [Google Scholar]
- Senn J. J., Klover P. J., Nowak I. A. & Mooney R. A. Interleukin-6 induces cellular insulin resistance in hepatocytes. Diabetes 51, 3391–3399 (2002). [DOI] [PubMed] [Google Scholar]
- Rotter V., Nagaev I. & Smith U. Interleukin-6 (IL-6) induces insulin resistance in 3T3-L1 adipocytes and is, like IL-8 and tumor necrosis factor-α, overexpressed in human fat cells from insulin-resistant subjects. J. Biol. Chem. 278, 45777–45784 (2003). [DOI] [PubMed] [Google Scholar]
- Lagathu C. et al. Chronic interleukin-6 (IL-6) treatment increased IL-6 secretion and induced insulin resistance in adipocyte: prevention by rosiglitazone. Biochem. Biophys. Res. Commun. 311, 372–379 (2003). [DOI] [PubMed] [Google Scholar]
- Kim H. J. et al. Differential effects of interleukin-6 and -10 on skeletal muscle and liver insulin action in vivo. Diabetes 53, 1060–1067 (2004). [DOI] [PubMed] [Google Scholar]
- Nieto-Vazquez I., Fernandez-Veledo S., de Alvaro C. & Lorenzo M. Dual role of interleukin-6 in regulating insulin sensitivity in murine skeletal muscle. Diabetes 57, 3211–3221 (2008). [DOI] [PMC free article] [PubMed] [Google Scholar] [Retracted]
- Glund S. & Krook A. Role of interleukin-6 signalling in glucose and lipid metabolism. Acta Phys. 192, 37–48 (2008). [DOI] [PubMed] [Google Scholar]
- Ellingsgaard H. et al. Interleukin-6 enhances insulin secretion by increasing glucagon-like peptide-1 secretion from L cells and alpha cells. Nat. Med. 17, 1481–1489 (2011). [DOI] [PMC free article] [PubMed] [Google Scholar]
- Klover P. J., Clementi A. H. & Mooney R. A. Interleukin-6 depletion selectively improves hepatic insulin action in obesity. Endocrinology 146, 3417–3427 (2005). [DOI] [PubMed] [Google Scholar]
- Wallenius V. et al. Interleukin-6-deficient mice develop mature-onset obesity. Nat. Med. 8, 75–79 (2002). [DOI] [PubMed] [Google Scholar]
- Matthews V. B. et al. Interleukin-6-deficient mice develop hepatic inflammation and systemic insulin resistance. Diabetologia 53, 2431–2441 (2010). [DOI] [PubMed] [Google Scholar]
- Park E. J. et al. Dietary and genetic obesity promote liver inflammation and tumorigenesis by enhancing IL-6 and TNF expression. Cell 140, 197–208 (2010). [DOI] [PMC free article] [PubMed] [Google Scholar]
- Mauer J. et al. Signaling by IL-6 promotes alternative activation of macrophages to limit endotoxemia and obesity-associated resistance to insulin. Nat. Immunol. 15, 423–430 (2014). [DOI] [PMC free article] [PubMed] [Google Scholar]
- Sadagurski M. et al. Human IL6 enhances leptin action in mice. Diabetologia 53, 525–535 (2010). [DOI] [PMC free article] [PubMed] [Google Scholar]
- Cai D. et al. Local and systemic insulin resistance resulting from hepatic activation of IKK-beta and NF-kappaB. Nat. Med. 11, 183–190 (2005). [DOI] [PMC free article] [PubMed] [Google Scholar]
- Franckhauser S. et al. Overexpression of Il6 leads to hyperinsulinaemia, liver inflammation and reduced body weight in mice. Diabetologia 51, 1306–1316 (2008). [DOI] [PubMed] [Google Scholar]
- Zuniga L. A. et al. IL-17 regulates adipogenesis, glucose homeostasis, and obesity. J. Immunol. 185, 6947–6959 (2010). [DOI] [PMC free article] [PubMed] [Google Scholar]
- Trujillo M. E. et al. Interleukin-6 regulates human adipose tissue lipid metabolism and leptin production in vitro. J. Clin. Endocrinol. Metab. 89, 5577–5582 (2004). [DOI] [PubMed] [Google Scholar]
- Galgani M. et al. Leptin modulates the survival of autoreactive CD4+ T cells through the nutrient/energy-sensing mammalian target of rapamycin signaling pathway. J. Immunol. 185, 7474–7479 (2010). [DOI] [PubMed] [Google Scholar]
- Yu Y. et al. Cutting edge: Leptin-induced RORγt expression in CD4+ T cells promotes Th17 responses in systemic lupus erythematosus. J. Immunol. 190, 3054–3058 (2013). [DOI] [PMC free article] [PubMed] [Google Scholar]
- Sartorius T. et al. Association of common genetic variants in the MAP4K4 locus with prediabetic traits in humans. PLoS ONE 7, e47647 (2012). [DOI] [PMC free article] [PubMed] [Google Scholar]
- Cohen P. et al. Selective deletion of leptin receptor in neurons leads to obesity. J. Clin. Invest. 108, 1113–1121 (2001). [DOI] [PMC free article] [PubMed] [Google Scholar]
- Kucharzik T., Hudson J. T. 3rd, Waikel R. L., Martin W. D. & Williams I. R. CCR6 expression distinguishes mouse myeloid and lymphoid dendritic cell subsets: demonstration using a CCR6 EGFP knock-in mouse. Eur. J. Immunol. 32, 104–112 (2002). [DOI] [PubMed] [Google Scholar]
- Eglen R. M. et al. The use of AlphaScreen technology in HTS: current status. Curr. Chem. Genomics 1, 2–10 (2008). [DOI] [PMC free article] [PubMed] [Google Scholar]
Associated Data
This section collects any data citations, data availability statements, or supplementary materials included in this article.
Supplementary Materials
Supplementary Figures 1-10


