Abstract
We describe preparation and use of the quaternary ammonium-based α-iodoacetamide QDE and its isotopologue *QDE as reagents for chemoselective derivatization of cellular thiols. Direct addition of the reagents to live cells followed by adduct extraction into n-butanol and analysis by FT-ICR-MS provided a registry of matched isotope peaks from which molecular formulae of thiol metabolites were derived. Acidification to pH 4 during cell lysis and adduct formation further improves the chemoselectivity for thiol derivatization. Examination of A549 human lung adenocarcinoma cells using this approach revealed cysteine, cysteinylglycine, glutathione, and homocysteine as principal thiol metabolites as well as the sulfinic acid hypotaurine. The method is also readily applied to quantify the thiol metabolites, as demonstrated here by the quantification of both glutathione and glutathione disulfide in A549 cells at concentrations of 34.4±11.5 and 10.1± 4.0 nmol/mg protein, respectively.
Keywords: Chemoselective, Metabolomics, Iodoacetamide, Hypotaurine, Oxidative stress, Cysteine
Introduction
Cellular thiol-containing metabolites, such as cysteine and glutathione, are crucially important for maintaining and regulating redox homeostasis in addition to protein functions [1, 2]. For example, the reduced form of cellular glutathione (GSH) is oxidized to its dimer glutathione disulfide (GSSG) in response to oxidative stress as a means to minimize cellular damage from reactive oxygen species [3, 4]. Since many diseases are linked to high levels of oxidative stress, the intracellular levels of GSH and GSSG can be indicative of cell pathogenesis [5–7]. Indeed, studying the ratio of GSH to GSSG and quantifying the dysregulation of GSH and GSSG levels are keys to understanding oxidative stress and the etiology of many important human diseases including cancer and type 2 diabetes [8–10]. To profile cellular thiols, chemoselective (CS) reagents for reaction with the sulfhydryl (–SH) moiety have been developed [11, 12]. These CS approaches can enable faster as well as more sensitive and selective analyses of thiol metabolites directly in crude extracts, and this, in turn, can improve the understanding of metabolite roles in human disease development.
Several methods, such as fluorescent detection [13, 14], colorimetric assays [15–17], capillary electrophoresis [18], electrochemical detection [19], SALDI-MS [20], and chromatographic methods coupled with mass spectrometry (GC-MS [21], LC-MS [22]) have been reported for the quantification of glutathione. The reported colorimetric and fluorometric probes are all designed to covalently modify (i.e., tag) glutathione for detection and quantification, and these assays also are useful for quantification of known metabolites using reference standards. However, they are unsuited for quantifying metabolites when no reference standards are available or in cases where isotopic tracers are employed to deduce metabolic pathways or flux; nor can they be used for elucidating new thiol adducts structures.
Another strategy common in proteomic as well as metabolomic studies features the alkylation of thiol groups using isotopic reagents followed either by affinity chromatography (e.g., biotin-avidin [23]) or liquid chromatography prior to analysis by mass spectrometry [24, 25]. S-alkylation using reagent isotopologues in a 1:1 ratio provides thiol adducts with nearly identical LC-MS retention times and generates isotopic peak pairs in the mass spectrum. These methods are expressly designed to increase the dynamic range for low abundance metabolites or low-level degradation products and to reduce ionization suppression [26]. While these approaches are effective for thiol metabolite identification as well as for determination of GSH/GSSG concentrations, the reliance on separation techniques can be tedious for high-throughput applications and in some cases unnecessary, particularly with ultra-high resolution MS instruments [27]. Furthermore, since the alkylations are conducted at high pH (8–9) in these approaches, the chemoselectivity for thiols is compromised due to competing alkylations of cellular amines, phenols, and carboxylate salts leading to false positives in the identification of cellular thiols [28]. For applications in metabolomics, this can be a severe constraint due to interference across the many other metabolite classes that must also be analyzed for metabolic networks.
As part of our ongoing efforts to develop reliable CS approaches for metabolite profiling [29], we describe here a chemoselective method for the identification and quantification of thiol metabolites by direct infusion FT-ICR-MS using GSH and GSSG as an example. The thiol-reactive, iodoacetamide-based probe QDE (Fig. 1) was synthesized for thiol-selective adduct formation. This probe also features a hydrophobic domain to facilitate rapid extraction of adducts from the aqueous extracts to minimize matrix interference for accurate quantification. Moreover, the probe contains a permanent positive charge (quaternary ammonium moiety) to greatly enhance ionization and subsequent detection of even low abundant thiol adducts by [+]-ion electrospray mass spectrometry. The ultra high-resolution and accuracy mass capabilities of FT-ICR-MS enable simultaneous detection of many thousands of metabolite ions while providing credible molecular formula information, thus circumventing the need for chromatographic separations for the majority of metabolites. To further streamline the detection of thiol adducts, we developed a convenient protocol that employed both QDE and its 13CD3 isotopologue in acetonitrile to lyse cells at pH 4 or 7.4 for effectively tagging GSH and other thiol metabolites as isotopic pairs. We found that derivatization at pH 4 improved the chemoselectivity, which together with the presence of isotopic pairs facilitated the identification of thiol metabolites directly from crude cell extracts. Importantly, the relatively mild conditions did not degrade non-thiol metabolites for their simultaneous or subsequent detection.
Fig. 1.
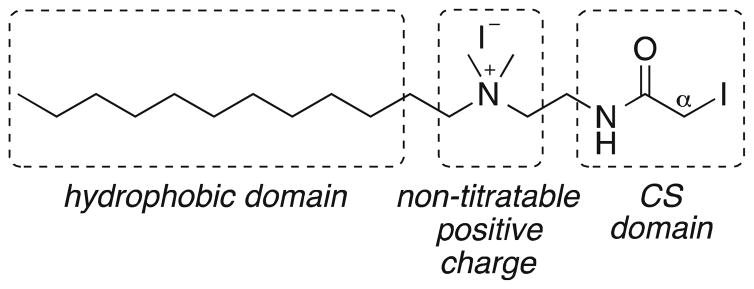
Structure and functional domains of CS reagent QDE
Materials and methods
Synthesis of CS probe QDE and *QDE
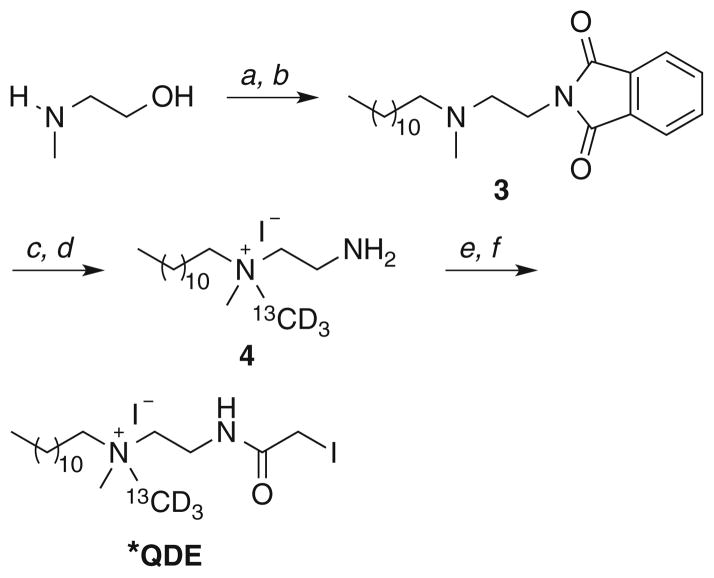
QDE and *QDE (13CD3-labeled QDE) were prepared as outlined in Schemes 1 and 2, respectively. Full experimental and characterization details are provided in the Electronic Supplementary Material.
Scheme 1.
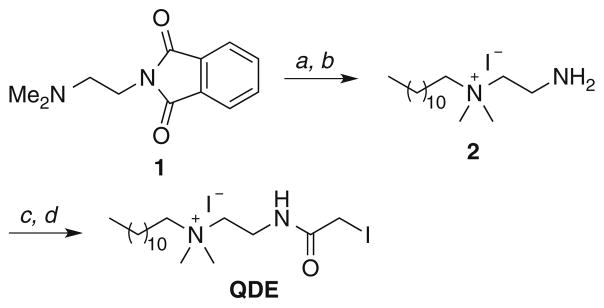
Reagents and conditions: a 1-iodododecane, CH3CN, 100 °C, 20 h; b H2NNH2·H2O, EtOH, 40 °C, 12 h, 83 % (two steps); c chloroacetyl chloride, K2CO3, CH2Cl2, rt, 12 h; d NaI, acetone, 65 °C (sealed tube), 20 h, 78 % (two steps)
Scheme 2.
Reagents and conditions: a 1-bromododecane, Na2CO3,
Optimizations of adduct formation and extraction
Optimization of QDE:thiol ratio for adduct formation
A 1:1 mixture of QDE (200 μL of a 100-μM solution in 1:1 H2O:CH3CN) and L-cysteine (200 μL of a 100-μM solution in H2O) was prepared in a microfuge vial and agitated for 12 h in the dark at room temperature. The reaction mixture was dried using a vacuum centrifuge and reconstituted in 1 mL MeOH. Aliquots of this solution (15 μL) were then analyzed by FT-ICR-MS. The [QDE-Cys]+ adduct was confirmed at m/z=418.30981. The above experiment was repeated using three equivalents of QDE per cysteine (this ratio was sufficient to completely consume all cysteine, as confirmed by negative mode FT-ICR-MS). Also, unreacted QDE was observed in the spectrum.
EtOH, reflux, 24 h; b phthalimide, PPh3, DIAD, THF, 0 °C to rt, 12 h, 29 % (two steps); c 13CD3I, 50 °C (sealed tube), 3 h; d H2NNH2·H2O, EtOH, 40 °C, 12 h, 93 % (two steps); e chloroacetyl chloride, K2CO3, CH2Cl2, rt, 12 h; f NaI, acetone, 65 °C (sealed tube), 20 h, 32 % (two steps)
Solvent optimization for adduct extraction
A solution of L-cysteine (200 μL of a 20 mM solution in H2O) was combined with a solution of QDE (200 μL of 48-mM solution in 1:1 H2O:CH3CN) in a microfuge vial and the resultant solution was agitated on a shaker for 12 h in the dark at room temperature. The reaction mixture was then dried using a vacuum centrifuge and multiply extracted (0.5 mL×5) with EtOAc. The organic layer from each individual extraction was isolated in a separate microfuge vial and dried using a vacuum centrifuge. Each dried extract was then reconstituted in 1 mL MeOH and vortex mixed. One hundred microliter of each extract solution was further diluted to 1 mL with MeOH, vortex mixed, centrifuged at 13,000 rpm for 10 min at 4 °C. Aliquots (15 μL) of the solutions were analyzed by FT-ICR-MS. This process was repeated using the following solvents: methylene chloride, n-butanol, toluene, chloroform, and diethyl ether.
Examination of alkylation pH
A solution of QDE (150 μL of a 10-μM solution in 1:1 H2O:CH3CN) and a solution of L-cysteine (50 μL of 10-μM solution in H2O) were added to pH 5.8 K-phosphate buffer (100 μL) in a microfuge vial. The mixture was agitated for 12 h at room temperature in the dark. The reaction solution was then dried using a vacuum centrifuge and extracted with n-BuOH (0.2 mL×3). The combined extract was dried using a vacuum centrifuge and then reconstituted in 1 mL MeOH followed by vortex mixing and centrifugation (10 min, 130,00 rpm) at 4 °C. Aliquots (15 μL) of this solution were analyzed by FT-ICR-MS. In similar fashion, solutions of QDE (100 μL of a 10-μM solution in 1:1 H2O:CH3CN) and L-glutathione (50 μL of a 10-μM solution in H2O) were added to pH 8 K-phosphate buffer (100 μL) in a microfuge vial. Work-up and analysis of the reaction were performed as described above. The reaction of cys at pH 5.8 showed that the alkylation is possible at lower pH, whereas the reaction of GSH at pH 8.0 was carried out to evaluate multiple alkylations by QDE.
Cell culture experimentation
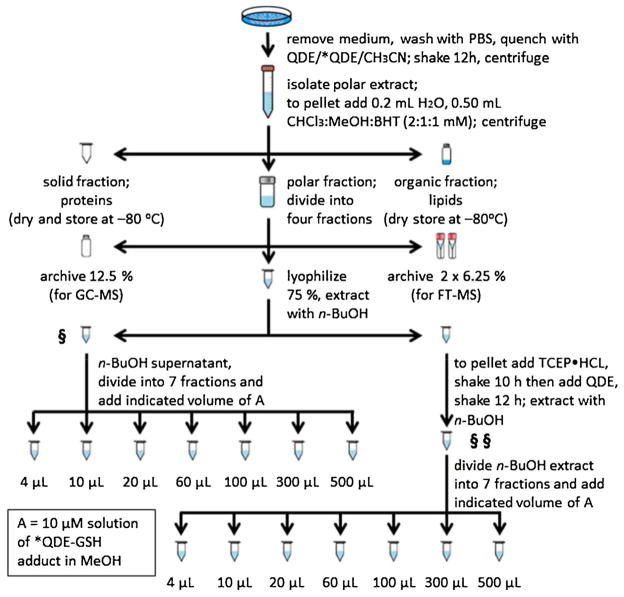
The protocols for metabolic quenching, adduct formation, extraction, and quantification of QDE-thiol adducts are summarized in Fig. 2; detailed procedures are given in the Electronic Supplementary Material Section III.
Fig. 2.
Protocols for cellular extraction and analysis of [QDE/*QDE-thiol]+ adducts including quantification of cellular GSH and GSSG. For detailed procedures, see Electronic Supplementary Material
FT-ICR-MS analyses and informatics
FT-ICR-MS analyses
A hybrid linear ion trap (LIT) FT-ICR mass spectrometer (LTQ-FT, Thermo Electron, Bremen, Germany) equipped with a TriVersa NanoMate ion source (Advion BioSciences, Ithaca, NY) with an “A” electrospray chip (nozzle inner diameter 5.5 μm) was used for mass spectral analysis. The TriVersa NanoMate was operated in positive ion mode by applying 1.40 kV with 0.3 psi head pressure. MS runs were recorded over an m/z range from 305 to 1,000 Da using optimized ion abundance targets enabled for the selected mass range. Initially, low-resolution LIT-MS scans were acquired for 0.50 min to track the stability of the ion spray, after which high mass accuracy data were collected using the FT-ICR-MS analyzer where MS scans were acquired for 14 min at a target resolving power of m/Δm=200,000 at m/z=400 (10 % valley). Five “microscans” (ICR-MS transients) were accumulated before Fourier transformation to produce each saved spectrum; thus the cycle time for each transformed, saved spectrum was about 5 s. The LTQ-FT was tuned and calibrated according to the manufacturer’s default standard recommendations, which typically achieved better than 0.5 ppm mass accuracy at a resolving power of 200,000 at m/z=400. FT-ICR-MS mass spectra were centroided by Xcalibur and exported as exact mass lists into an Excel file using QualBrowser 2.0 SR2 (all software from Thermo Electron, “Bremen” version for the LTQ-FT).
Mass corrections and global assignments of peak pairs
Peaks were exported as numerical values of exact masses and ion counts into an Excel 2010 file and those with ion counts less than 150 were excluded as noise. All peak pairs (m/z; m/z+ 4.02188) representing QDE and *QDE adducts of given metabolites were selected using an in-house program (PRecalculated Exact Mass Isotopologue Search Engine; PREMISE) [30]. Only peak pairs with intensity ratios from 0.7 to 1.3 were used for further analyses. This list was manually checked to ensure the accuracy of the PREMISE program. The masses were compared across four experiments performed at both pH 4 and 7.4, and those persistently present in at least 50 % of the experiments were retained. In the final step, (QDE—I) was subtracted from all monoisotopic peaks and the mass of a proton was added to obtain molecular formulae of metabolites and compared against HMDB [31, 32].
Results and discussion
CS probe design
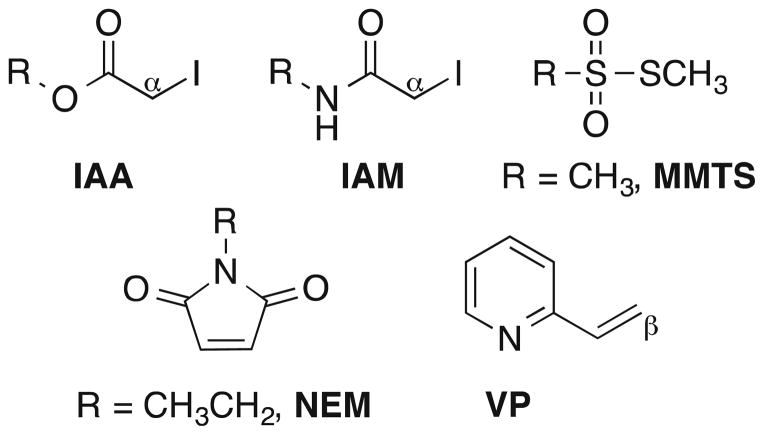
Optimal properties of CS reagents for reaction with thiol-containing substrates include the ability to alkylate a thiol moiety with high efficiency and selectivity while imparting stability to the resultant adduct for subsequent MS analysis. Several reagents for derivatizing thiol metabolites have been developed, and the most common of these contain the thiol-reactive motifs depicted in Fig. 3. Of these, the maleimide moiety, such as in the reagent N-ethylmaleimide (NEM) [33], is among the most reactive toward thiol groups, but its propensity to undergo hydrolysis or transamidation after conjugation with thiol metabolites often complicates MS analyses of the adducts [34–36]. In contrast, α-iodo carbonyl motifs, such as in iodoacetic acid (IAA) reagents or iodoacetamide (IAM) reagents, readily alkylate thiols via nucleophilic displacement of iodide and are comparatively stable over a wide range of pH [37], with the IAM adducts being more robust due to the more stable amide linkage. The IAM motif has been reported to react faster with protein thiols than the IAA motif [38]. The drawback of these α-iodo motifs is that they react with amines and other nucleophilic groups (albeit slowly) at higher pH and thus their chemoselectivity may be compromised [39, 40] unless precautions are taken. Thiols also react with vinylpyridine (VP) at its β-position to afford corresponding thioether adducts. The rate of this reaction is considerably slower compared to thiol alkylations involving IAA, IAM, or NEM reagents [41, 42]. Finally, thiosulfonate-based alkylating agents, such as methyl methanethiosulfonate (MMTS; Fig. 3), also have been used to label –SH groups; however, this approach adds complexity to the matrix by liberating thiols during the alkylation stage as a result of reversible disulfide formation [43, 44].
Fig. 3.
Structural motifs and representative reagents for the select derivatization of thiols
Given our aim of developing an experimentally straightforward approach for quantifying GSH using FT-ICR-MS, and understanding that rapid alkylation of GSH is necessary to halt any conversion to glutathione disulfide during cell lysis and subsequent analysis [45], we selected the iodoacetamide motif as our reactive, chemoselective probe for in situ thiol capture. In addition to this feature, our QDE probe (Fig. 1) contains a C12-hydrocarbon chain to enhance the partitioning of [QDE-GSH]+, and other [QDE-thiol]+ adducts, into an organic phase for rapid separation from polar, non-thiol metabolites and cellular salts. QDE also contains a quaternary ammonium moiety as a nontitratable positive charge to greatly improve the detection limits of QDE adducts by FT-ICR-MS. Furthermore, the ammonium nitrogen serves as a convenient site for synthesis of stable isotope-encoded isotopologues of QDE. We synthesized *QDE, a 13C12H3-isotopologue of QDE, in this way (Scheme 2) by N-alkylation using labeled iodomethane. This route is amenable to the synthesis of numerous C and H isotopologues for eventual use in multiplexed analyses by exploiting the ultra-high resolving power of the FT-ICR-MS. For example, the availability of an m/z (QDE) and m/z+4.02188 (*QDE) isotopic pair of reagents is key to rapid and automated identification of thiol adducts [23]. Namely, cells treated with a 1:1 mixture of QDE and *QDE can be expected to produce respective adducts in a similar ratio. Thus, the presence of an equi-intensity m/z+4.02188 peak for any peak observed in the FT-ICR-MS spectrum of the organic phase extract (c.f. §, Fig. 2) is a primary selection criterion to identify true adducts as opposed to underivatized cell components. Finally, the availability of an isotopically labeled probe enables the synthesis of labeled adducts for use as standards to quantify particular thiols (e.g., quantification of GSH using [*QDE-GSH]+; see §§, Fig. 2).
CS probe reactivity
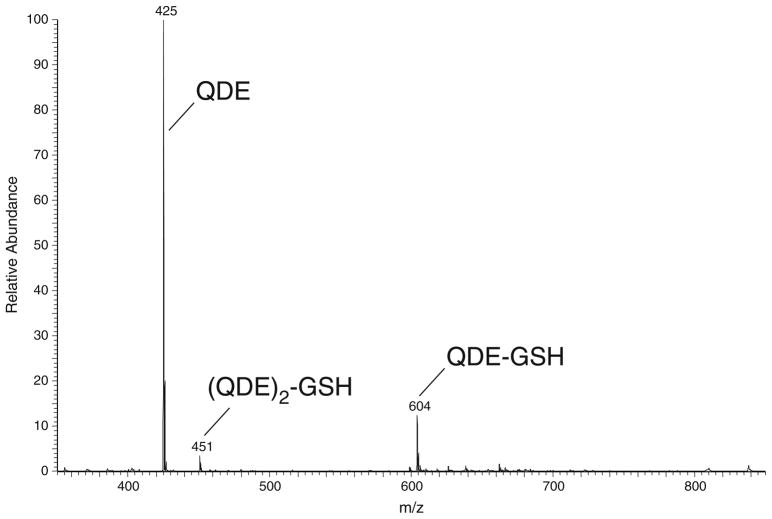
We examined several parameters for reaction of QDE with the representative biological thiols L-glutathione and L-cysteine. Initially, reactions were performed at pH 5.8 and 8. At pH 5.8 (potassium phosphate buffer in acetonitrile), a 3:1 molar excess of QDE to thiol enabled the thiol to be completely consumed within 12 h at room temperature. However, at pH 8, we also noted the bisalkylation of GSH, presumably due to GSH amine alkylation at this pH (Fig. 4). Reactions of α-iodoacetamide reagents, such as QDE, with cellular amines [46, 39, 40], phenols, and carboxylate salts have been noted previously under alkaline pH conditions [28]. Although at low pH, the reaction of thiols with the α-iodoacetamide moiety is slow [37], the chemoselectivity is very high because amine and carboxylate alkylations are deterred. Consequently, for our cell experimentation, we implemented thiol derivatization with QDE/*QDE at pH 4 to improve chemoselectivity for the thiol group.
Fig. 4.
Ion trap mass spectrum of product mixture obtained from reaction of QDE with GSH in pH 8 potassium phosphate buffer for 12 h
Regarding adduct isolation, extensive studies with solvents revealed that n-BuOH was the most effective solvent at extracting [QDE-thiol]+ adducts from an aqueous phase—for example, more than 95 % of the [QDE-Cys]+ adduct was recovered within the first two extractions. These results closely mirror our earlier observations [29] on the extraction of structurally analogous aminooxy probe (QDA)-carbonyl metabolite adducts.
Profiling thiol metabolites in A549 cells
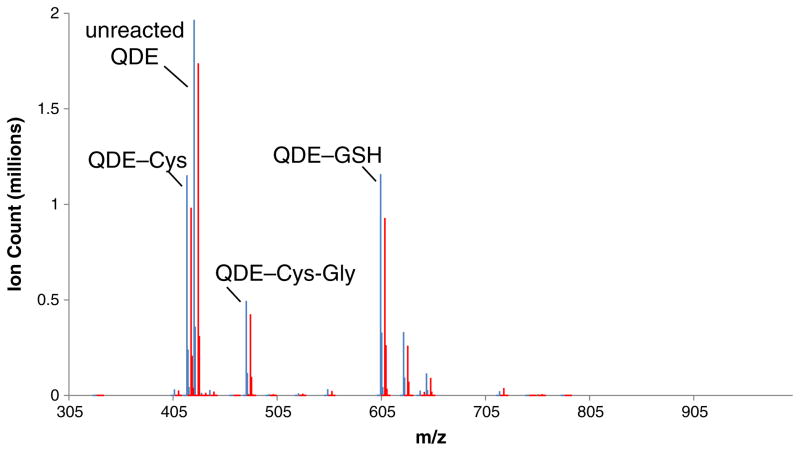
Human lung adenocarcinoma A549 cells were simultaneously quenched and derivatized with equimolar mixtures of QDE and *QDE in acetonitrile at pH 4 and 7.4 and then analyzed as described in the “Materials and methods” section. This direct, in situ quench approach allows for the rapid S-alkylation of labile thiols prior to their oxidations to corresponding disulfides. Analyses of the FT-ICR-MS data of the adducts after applying the described filters (noise removal and similar ion counts of m/z and m/z+4.02188) provided a list of accurate masses of QDE adducts from which metabolite formulae were obtained and then used to query the HMDB database. The profiling experiments were performed 4× for each pH condition. We identified 12 metabolite masses that passed the filter criteria in at least two out of four experiments at a given pH, which are listed in Table 1. The structural assignments for the highest ion count metabolites (entries 1–3) are in agreement with the chemoselectivity of QDE, namely the 4/4 hit rate at pH 4 strongly supports the thiol assignments. Indeed, CID MS/MS analyses confirmed the structural assignments as cysteine, cysteinylglycine, and glutathione (Fig. 5), respectively, see Electronic Supplementary Material Figs. S17 and S20. These thiols have been documented previously as major thiol metabolites [47]. Their relative abundance is nearly tenfold higher than that of other thiol metabolites, as can be seen in a representative mass spectrum (Fig. 6) that shows the ion count matching of the QDE and *QDE adduct pairs. Due to the high ion count of these metabolites, we were able to confirm the 34S isotope incidences at ~4 % of the respective 32S adducts. The sodiated C-terminal peaks for the glutathione adduct were also observed.
Table 1.
Metabolite molecular formulae identified using paired QDE/*QDE approacha
| Entry | Metabolite MF | pH 4.0b | pH 7.4b | Metabolite massc | Mass errord | Ion counte | Metabolite assignment |
|---|---|---|---|---|---|---|---|
| Thiol metabolites (high ion count abundance)f | |||||||
| 1 | C3H7NO2S | 4 | 4 | 121.01884 | 0.00091 | 1,200,443 | Cysteine |
| 2 | C5H10N2O3S | 4 | 4 | 178.04046 | 0.00077 | 494,591 | Cysteinylglycine |
| 3 | C10H17N3O6S | 4 | 4 | 307.08321 | 0.00061 | 1,492,062 | Glutathione |
| Thiol or sulfinic metabolites (moderate to low ion count abundance)f | |||||||
| 4 | C2H7NO2S | 4 | 4 | 109.01886 | 0.00090 | 32,595 | Hypotaurine |
| 5 | C4H9NO2S | 3 | 4 | 135.03451 | 0.00090 | 23,527 | Homocysteine |
| 6 | C11H19N3O7S | 2 | 1 | 337.09397 | 0.00042 | 14,746 | Tripeptide comprised of Cys, Gln, and Ser |
| 7 | C12H21NO4S2 | 0 | 2 | 307.09109 | 0.00084 | 56,570 | Succinyldihydrolipoamideg |
| Carboxylic acid or amine metabolitesg | |||||||
| 8 | C5H9NO4S | 0 | 4 | 179.02439 | 0.00085 | 36,528 | S-carboxymethylcysteine |
| 9 | C6H10O6 | 0 | 2 | 178.04711 | 0.00064 | 82,132 | Ketodeoxygluconic acid; deoxyglucuronic acid |
| 10 | C6H13NO2S | 0 | 2 | 163.06593 | 0.00078 | 27,324 | S-(2-carboxypropyl)cysteamine; S-propylcysteine |
| Unassigned metabolite | |||||||
| 11 | C14H28O2 | 0 | 3 | 228.20821 | 0.00073 | 11,379 | >10 Possibilities |
| 12 | –h | 2 | 2 | 345.03918 | – | – | – |
Only metabolite adducts registering a minimum of 10K ion counts and occurring in at least two out of four experiments under either the pH 4 or 7.4 conditions are tabulated
Number of times the metabolite adduct was observed in four experiments at the indicated pH
Adduct m/z—(QDE–iodide)+H
Actual metabolite mass computed from MF minus measured metabolite mass
Highest ion count observed at either pH condition
Ion count abundance categorized either as high (>100K), moderate (>50K), or low (<50K)
Putative metabolite assignment(s)
>5 Molecular formulae fit this mass±0.0015 amu
Fig. 5.
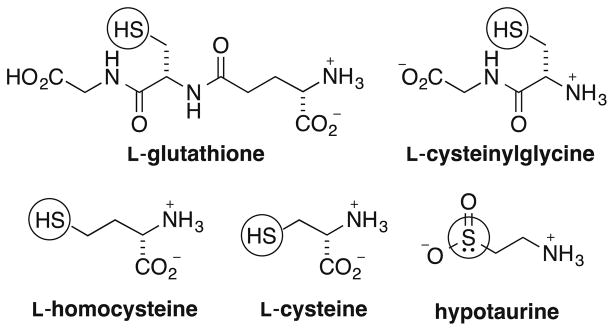
Confirmed thio-metabolites identified using the paired QDE/*QDE approach (neutral configurations depicted, nucleophilic center indicated)
Fig. 6.
Mass spectrum obtained from n-BuOH extract of A549 cells treated with QDE/*QDE (blue=[QDE-thiol]+ adduct, red=[*QDE-thiol]+ adduct) at pH 7.4. The three high ion count abundant [QDE-thiol]+ adducts are identified
Entries 4–6 (Table 1) are low-to-moderate abundant metabolites that were also assigned as containing nucleophilic sulfur based on the observed reactivity with QDE at pH 4. Whereas hypotaurine (Fig. 5), a sulfinic acid intermediate of taurine biosynthesis [48], is not a thiol, it reacts similarly due to the nucleophilicity of the sulfinic sulfur atom [49]. The assignments of hypotaurine and homocysteine (entries 4 and 5) were confirmed using CID MS/MS analysis, see Electronic Supplementary Material Figs. S18 and S19. Interestingly, the lack of adduct formation at pH 4 for the metabolites of entry 7 is consistent with the highly labile nature of succinyldihydrolipoamide, an intermediate involved in the transfer of a succinyl group from oxoglutarate via the oxoglutarate dehydrogenase complex (α-ketoglutarate dehydrogenase complex) [50]. This adduct was registered only under pH 7.4 conditions at which thiol alkylation occurs readily, while at pH 4, this reaction occurred at a slower rate and presumably hydrolysis of the labile thioester bond in succinyldihydrolipoamide prevented the buildup of the adducts to detectable levels. The lack of QDE adduct formation at pH 4 for the metabolites of entries 8–11 suggests that these are either highly labile metabolites or, more likely, non-thiol metabolites. The most probable HMDB-based assignments for these entries are given except for entry 11 for which more than ten possibilities exist. The value of performing thiol profiling at both pH 4 and 7.4 is further noted when comparing the reactivity of the entry 8 metabolite—the lack of adduct appearance at pH 4 suggests that the sulfur in this C5H9NO4S metabolite is not a free sulfhydryl. Rather, adduct formation is likely a result of carboxylate alkylation, hence its putative assignment as the S-ether [51, 52]. The same is true for the C6H13NO2S metabolites of entry 10, also putatively assigned as S-alkylated thiols [53, 54].
Quantification of cellular glutathione
To illustrate the value of the QDE/*QDE technique in quantifying biological thiols, we selected glutathione as a representative example. The challenge in accurately quantifying glutathione is to measure both its oxidized and reduced states, and to do this, it is necessary to both quench any artifactual oxidation of GSH to GSSH by direct in situ derivatization as illustrated above, and to exhaustively reduce GSSG. For the latter, commonly used reducing agents include TCEP·HCl [55, 56], dithiothreitol (DTT) [57], trialkylphosphines [58], NaBH4 [59], and occasionally sulfites, cyanides, or some enzymes. We selected the TCEP·HCl reagent because it eliminates the complication of added thiol reagents, as with the use of DTT, and the possibility of overreduction, as often the case with using NaBH4. We were gratified to find an added benefit in using TCEP·HCl in that it reacted with the iodoacetamide group of QDE to form the adduct of iodide displacement [60, 61]. Thus, after reduction of glutathione disulfide using TCEP·HCl, excess QDE was added to capture the newly reduced GSH as well as to consume the excess TCEP·HCl. The resultant [QDE-TCEP]+ adduct (m/z 547.3512) was readily eliminated at the ion trap stage of the FT-ICR-MS thus enabling tuning of the ion abundance targets (called AGC targets) to optimize the spectra.
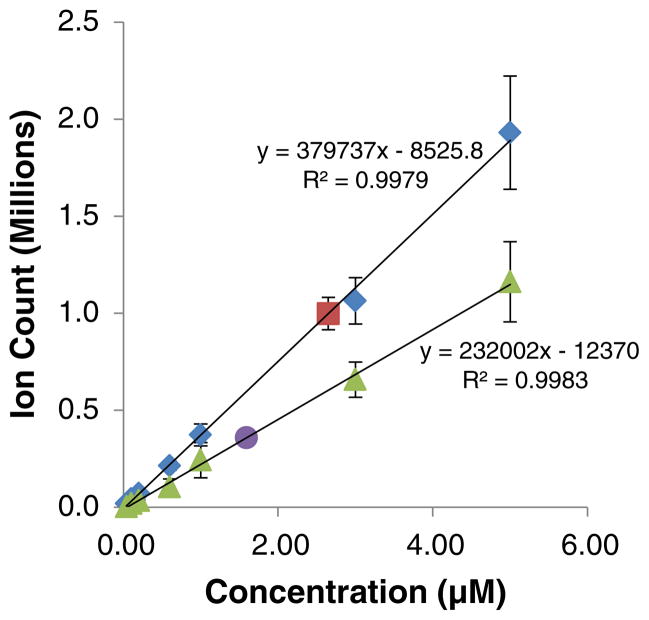
We also prepared [*QDE-GSH]+ to serve as an isotopic internal standard for intensity normalization and quantification purposes. Increasing concentrations of [*QDE-GSH]+ were added to the cellular extracts to establish calibration curves while nullifying interferences from cell matrices. This also accommodated for any sodiation of the adduct in the extracts being analyzed. We found the linear range for quantification to be between 0.04 and 5.00 μM of [*QDE-GSH]+ with regression (R2) values consistently over 99 % for three replicate experiments (Fig. 7). The quantification of GSH and GSSG was thus carried out within this range. Three plates were analyzed and each extract was quantified three times to ensure reproducibility of the quantification results. Total concentrations of [GSH] and [GSSG] were determined as 34.4± 11.5 and 10.1±4.0 nmol/mg protein, respectively. Whereas the GSSG concentration in A549 cells has not been reported previously, our measured GSH concentration in this cell line agrees with the GSH concentration of 30.1±1.5 nmol/mg protein recently reported by Spadaro et al. [62]. In contrast, the GSH concentrations measured in surgically resected human lung tumors of eight patients, also adenocarcinoma, averaged 8.8±1.0 nmol/mg protein [63]. The lower value in this case is not unexpected due to the likely factors of cancerous cell heterogeneity in tumor tissues and/or the rapid GSH/GSSG perturbations during cell lysis that were not taken into consideration. The direct in situ quench method shown here avoids such perturbations and allows for more accurate quantification. Our results matched the quantification figures obtained by Spadaro et al. who also took special care to avoid GSH/GSSG perturbations during cell lysis.
Fig. 7.
Quantification of GSH and GSSG in A549 cells. Linear ranges for detection of GSH (◆) and GSSG (▲) were established using [*QDE-GSH]+ adduct as a standard. The [GSH] (■) and [GSSG] (●) concentrations were measured (n=3) from 145 μL aliquots taken from the n-BuOH supernatants at stages § and §§ (Fig. 2) for GSH and GSSG, respectively
Conclusion
We have illustrated an experimentally convenient approach to profile cellular thiols with structural confirmation. Addition of the ammonium α-iodoacetamide reagent QDE and its isotopologue *QDE directly to live cells followed by n-BuOH extraction and direct electrospray FT-ICR-MS analysis provides a registry of isotopologue pairs. The probe design and experimental protocol coupled with the high mass accuracy and ultra-high resolution of FT-ICR-MS enable determination of metabolite molecular formulae. Equally important is the enhanced chemoselectivity of QDE when cell extracts were reacted at pH 4, thereby better delineating thiol from non-thiol metabolites. Our analysis of A549 cell extracts revealed the major thiols to be glutathione, cysteine, and cysteinylglycine. We also observed, for the first time, S-alkylated hypotaurine. Finally, QDE and *QDE were readily applied for thiol quantification, such as demonstrated for the quantifications of glutathione and glutathione disulfide. We showed this approach to be sensitive at the 40-nM range and linear in the concentration range of 0.04 to 5.0 μM with >99 % accuracy. In summary, the present approach should enable high sample and information throughput for profiling cellular thiols as well as facilitate their quantification.
Supplementary Material
Acknowledgments
This work was supported by grants from NIH (1 R01 ES022191-01, 3R01CA118434-02S1, and 1R01CA118434-01A2). The FT-ICR-MS instrumentation at the Center for Regulatory and Environmental Analytical Metabolomics mass spectrometry facility was funded by an NSF/EPSCoR grant (EPS-0447479). We also acknowledge the insightful contributions on data analysis from Mr. James Carrier and Dr. Hunter Moseley (Department of Molecular and Cellular Biochemistry, University of Kentucky), and we thank Ms. Stephanie Mattingly for her advice on how to best operate the FT-ICR-MS for isotopologue pairs of quaternary ammonium derivatives. We also thank Ms. Ramya Balasubramaniam for providing cultured cells.
Footnotes
Electronic supplementary material The online version of this article (doi:10.1007/s00216-014-7810-z) contains supplementary material, which is available to authorized users.
Contributor Information
Sadakatali S. Gori, Department of Chemistry, University of Louisville, Louisville, KY 40292, USA
Pawel Lorkiewicz, Department of Chemistry, University of Louisville, Louisville, KY 40292, USA, Center for Regulatory and Environmental Analytical Metabolomics (CREAM), University of Louisville, Louisville, KY 40292, USA.
Daniel S. Ehringer, Department of Chemistry, University of Louisville, Louisville, KY 40292, USA
Alex C. Belshoff, Department of Pharmacology and Toxicology, University of Louisville, Louisville, KY 40292, USA
Richard M. Higashi, Department of Chemistry, University of Louisville, Louisville, KY 40292, USA, Center for Regulatory and Environmental Analytical Metabolomics (CREAM), University of Louisville, Louisville, KY 40292, USA, Graduate Center of Toxicology and Markey Cancer Center, University of Kentucky, Lexington, KY 40536, USA
Teresa W.-M. Fan, Email: t.fan@uky.edu, Department of Chemistry, University of Louisville, Louisville, KY 40292, USA, Center for Regulatory and Environmental Analytical Metabolomics (CREAM), University of Louisville, Louisville, KY 40292, USA, Graduate Center of Toxicology and Markey Cancer Center, University of Kentucky, Lexington, KY 40536, USA
Michael H. Nantz, Email: michael.nantz@louisville.edu, Department of Chemistry, University of Louisville, Louisville, KY 40292, USA
References
- 1.Sies H. Free Radic Biol Med. 1999;27:916–921. doi: 10.1016/s0891-5849(99)00177-x. [DOI] [PubMed] [Google Scholar]
- 2.Moran LK, Gutteridge JM, Quinlan GJ. Curr Med Chem. 2001;8:763–772. doi: 10.2174/0929867013372904. [DOI] [PubMed] [Google Scholar]
- 3.Pompella A, Visvikis A, Paolicchi A, De Tata V, Casini AF. Biochem Pharmacol. 2003;66:1499–1503. doi: 10.1016/s0006-2952(03)00504-5. [DOI] [PubMed] [Google Scholar]
- 4.Halliwell B. Biochem J. 2007;401:1–11. doi: 10.1042/BJ20061131. [DOI] [PubMed] [Google Scholar]
- 5.Valko M, Leibfritz D, Moncol J, Cronin MT, Mazur M, Telser J. Int J Biochem Cell Biol. 2007;39:44–84. doi: 10.1016/j.biocel.2006.07.001. [DOI] [PubMed] [Google Scholar]
- 6.Boskovic M, Vovk T, Kores Plesnicar B, Grabnar I. Curr Neuropharmacol. 2011;9:301–312. doi: 10.2174/157015911795596595. [DOI] [PMC free article] [PubMed] [Google Scholar]
- 7.Dean OM, van den Buuse M, Berk M, Copolov DL, Mavros C, Bush AI. Neurosci Lett. 2011;499:149–153. doi: 10.1016/j.neulet.2011.05.027. [DOI] [PubMed] [Google Scholar]
- 8.Masella R, Di Benedetto R, Vari R, Filesi C, Giovannini C. J Nutr Biochem. 2005;16:577–586. doi: 10.1016/j.jnutbio.2005.05.013. [DOI] [PubMed] [Google Scholar]
- 9.Ruderman NB, Carling D, Prentki M, Cacicedo JM. J Clin Invest. 2013;123:2764–2772. doi: 10.1172/JCI67227. [DOI] [PMC free article] [PubMed] [Google Scholar]
- 10.Bhat HK, Calaf G, Hei TK, Loya T, Vadgama JV. Proc Natl Acad Sci U S A. 2003;100:3913–3918. doi: 10.1073/pnas.0437929100. [DOI] [PMC free article] [PubMed] [Google Scholar]
- 11.Wang J, Zhang J, Arbogast B, Maier CS. J Am Soc Mass Spectrom. 2011;22:1771–1783. doi: 10.1007/s13361-011-0192-y. [DOI] [PMC free article] [PubMed] [Google Scholar]
- 12.Camera E, Picardo M. J Chromatogr B. 2002;781:181–206. doi: 10.1016/s1570-0232(02)00618-9. [DOI] [PubMed] [Google Scholar]
- 13.Katritzky AR, Ibrahim TS, Tala SR, Abo-Dya NE, Abdel-Samii ZK, El-Feky SA. Synthesis. 2011;9:1494–1500. [Google Scholar]
- 14.Yi L, Li H, Sun L, Liu L, Zhang C, Xi Z. Angew Chem Int Ed. 2009;48:4034–4037. doi: 10.1002/anie.200805693. [DOI] [PubMed] [Google Scholar]
- 15.Chen Z, He Y, Luo S, Lin H, Chen Y, Sheng P, Li J, Chen B, Liu C, Cai Q. Analyst. 2010;135:1066–1069. doi: 10.1039/b925683k. [DOI] [PubMed] [Google Scholar]
- 16.Huo F-J, Sun Y-Q, Su J, Chao J-B, Zhi H-J, Yin C-X. Org Lett. 2009;11:4918–4921. doi: 10.1021/ol901951h. [DOI] [PubMed] [Google Scholar]
- 17.Wang SP, Deng WJ, Sun D, Yan M, Zheng H, Xu JG. Org Biomol Chem. 2009;7:4017–4020. doi: 10.1039/b909760k. [DOI] [PubMed] [Google Scholar]
- 18.Carlucci F, Tabucchi A. J Chromatogr B. 2009;877:3347–3357. doi: 10.1016/j.jchromb.2009.07.030. [DOI] [PubMed] [Google Scholar]
- 19.Sakhi AK, Russnes KM, Smeland S, Blomhoff R, Gundersen TE. J Chromatogr A. 2006;1104:179–189. doi: 10.1016/j.chroma.2005.11.129. [DOI] [PubMed] [Google Scholar]
- 20.Chiang CK, Lin YW, Chen WT, Chang HT. Nanomedicine. 2010;6:530–537. doi: 10.1016/j.nano.2010.01.006. [DOI] [PubMed] [Google Scholar]
- 21.Wang Q, Chong JM, Pawliszyn J. Flavour and Fragr J. 2006;21:385–394. [Google Scholar]
- 22.Seiwert B, Karst U. Anal Chem. 2007;79:7131–7138. doi: 10.1021/ac071016b. [DOI] [PubMed] [Google Scholar]
- 23.Yi EC, Li XJ, Cooke K, Lee H, Raught B, Page A, Aneliunas V, Hieter P, Goodlett DR, Aebersold R. Proteomics. 2005;5:380–387. doi: 10.1002/pmic.200400970. [DOI] [PubMed] [Google Scholar]
- 24.Williams DK, Jr, Meadows CW, Bori ID, Hawkridge AM, Comins DL, Muddiman DC. J Am Chem Soc. 2008;130:2122–2123. doi: 10.1021/ja076849y. [DOI] [PubMed] [Google Scholar]
- 25.Sethuraman M, Clavreul N, Huang H, McComb ME, Costello CE, Cohen RA. Free Radic Bio Med. 2007;42:823–829. doi: 10.1016/j.freeradbiomed.2006.12.012. [DOI] [PMC free article] [PubMed] [Google Scholar]
- 26.Yu X, Warme C, Lee D, Zhang J, Zhong W. Anal Chem. 2013;85:8964–8967. doi: 10.1021/ac401911n. [DOI] [PubMed] [Google Scholar]
- 27.Fan TW-M, Lorkiewicz PK, Sellers K, Moseley HNB, Higashi RM, Lane AN. Pharmacol Ther. 2012;133:366–391. doi: 10.1016/j.pharmthera.2011.12.007. [DOI] [PMC free article] [PubMed] [Google Scholar]
- 28.Yang Z, Attygalle AB. J Mass Spectrom. 2007;42:233–243. doi: 10.1002/jms.1157. [DOI] [PubMed] [Google Scholar]
- 29.Mattingly SJ, Xu T, Nantz MH, Higashi RM, Fan TW. Metabolomics. 2012;8:989–996. doi: 10.1007/s11306-011-0395-z. [DOI] [PMC free article] [PubMed] [Google Scholar]
- 30.Lane AN, Fan TW, Xie Z, Moseley HN, Higashi RM. Anal Chim Acta. 2009;651:201–208. doi: 10.1016/j.aca.2009.08.032. [DOI] [PMC free article] [PubMed] [Google Scholar]
- 31.Wishart DS, Knox C, Guo AC, Eisner R, Young N, Gautam B, Hau DD, Psychogios N, Dong E, Bouatra S, Mandal R, Sinelnikov I, Xia J, Jia L, Cruz JA, Lim E, Sobsey CA, Shrivastava S, Huang P, Liu P, Fang L, Peng J, Fradette R, Cheng D, Tzur D, Clements M, Lewis A, De Souza A, Zuniga A, Dawe M, Xiong Y, Clive D, Greiner R, Nazyrova A, Shaykhutdinov R, Li L, Vogel HJ, Forsythe I. Nucleic Acids Res. 2009;37:D603–D610. doi: 10.1093/nar/gkn810. [DOI] [PMC free article] [PubMed] [Google Scholar]
- 32.Wishart DS, Jewison T, Guo AC, Wilson M, Knox C, Liu Y, Djoumbou Y, Mandal R, Aziat F, Dong E, Bouatra S, Sinelnikov I, Arndt D, Xia J, Liu P, Yallou F, Bjorndahl T, Perez-Pineiro R, Eisner R, Allen F, Neveu V, Greiner R, Scalbert A. [Accessed 10 Oct 2013];Nucleic Acids Res. 2013 41:D801–807. doi: 10.1093/nar/gks1065. http://www.hmdb.ca. [DOI] [PMC free article] [PubMed] [Google Scholar]
- 33.Rogers LK, Leinweber BL, Smith CV. Anal Biochem. 2006;358:171–184. doi: 10.1016/j.ab.2006.08.020. [DOI] [PubMed] [Google Scholar]
- 34.Mozziconacci O, Kerwin BA, Schöneich C. J Phys Chem B. 2010;114:3668–3688. doi: 10.1021/jp910789x. [DOI] [PubMed] [Google Scholar]
- 35.Gregory JD. J Am Chem Soc. 1955;77:3922–3923. [Google Scholar]
- 36.Smyth DG, Nagamatsu A, Fruton JS. J Am Chem Soc. 1960;82:4600–4604. [Google Scholar]
- 37.Hill BG, Reily C, Oh J-Y, Johnson MS, Landar A. Free Radic Bio Med. 2009;47:675–683. doi: 10.1016/j.freeradbiomed.2009.06.012. [DOI] [PMC free article] [PubMed] [Google Scholar]
- 38.Hansen RE, Winther JR. Anal Biochem. 2009;394:147–158. doi: 10.1016/j.ab.2009.07.051. [DOI] [PubMed] [Google Scholar]
- 39.Boja ES, Fales HM. Anal Chem. 2001;73:3576–3582. doi: 10.1021/ac0103423. [DOI] [PubMed] [Google Scholar]
- 40.Crestfield AM, Stein WH, Moore S. J Biol Chem. 1963;238:2413–2419. [PubMed] [Google Scholar]
- 41.Gorin G, Martic PA, Doughty G. Arch Biochem Biophys. 1966;115:593–597. doi: 10.1016/0003-9861(66)90079-8. [DOI] [PubMed] [Google Scholar]
- 42.Lindorff-Larsen K, Winther JR. Anal Biochem. 2000;286:308–310. doi: 10.1006/abio.2000.4807. [DOI] [PubMed] [Google Scholar]
- 43.Peaper DR, Wearsch PA, Cresswell P. Embo J. 2005;24:3613–3623. doi: 10.1038/sj.emboj.7600814. [DOI] [PMC free article] [PubMed] [Google Scholar]
- 44.Karala AR, Ruddock LW. Antioxid Redox Signal. 2007;9:527–531. doi: 10.1089/ars.2006.1473. [DOI] [PubMed] [Google Scholar]
- 45.Haberhauer-Troyer C, Delic M, Gasser B, Mattanovich D, Hann S, Koellensperger G. Anal Bioanal Chem. 2013;405:2031–2039. doi: 10.1007/s00216-012-6620-4. [DOI] [PubMed] [Google Scholar]
- 46.Cotner RC, Clagett CO. Anal Biochem. 1973;54:170–177. doi: 10.1016/0003-2697(73)90260-1. [DOI] [PubMed] [Google Scholar]
- 47.Isokawa M, Funatsu T, Tsunoda M. Analyst. 2013;138:3802–3808. doi: 10.1039/c3an00527e. [DOI] [PubMed] [Google Scholar]
- 48.Stipanuk MH, Ueki I, Dominy JE, Jr, Simmons CR, Hirschberger LL. Amino Acids. 2009;37:55–63. doi: 10.1007/s00726-008-0202-y. [DOI] [PMC free article] [PubMed] [Google Scholar]
- 49.Wu J-P, Emeigh J, Su X-P. Org Lett. 2005;7:1223–1225. doi: 10.1021/ol0474554. [DOI] [PubMed] [Google Scholar]
- 50.Przybyla-Zawislak B, Gadde DM, Ducharme K, McCammon MT. Genetics. 1999;152:153–166. doi: 10.1093/genetics/152.1.153. [DOI] [PMC free article] [PubMed] [Google Scholar]
- 51.Zeng J, Dunlop RA, Rodgers KJ, Davies MJ. Biochem J. 2006;398:197–206. doi: 10.1042/BJ20060019. [DOI] [PMC free article] [PubMed] [Google Scholar]
- 52.Rabbani N, Thornalley PJ. Biochem Soc Trans. 2008;36:1045–1050. doi: 10.1042/BST0361045. [DOI] [PMC free article] [PubMed] [Google Scholar]
- 53.Ishigure K, Shimomura Y, Murakami T, Kaneko T, Takeda S, Inoue S, Nomoto S, Koshikawa K, Nonami T, Nakao A. Clin Chim Acta. 2001;312:115–121. doi: 10.1016/s0009-8981(01)00597-6. [DOI] [PubMed] [Google Scholar]
- 54.Speir TW, Barnsley EA. Biochem J. 1971;125:267–273. doi: 10.1042/bj1250267. [DOI] [PMC free article] [PubMed] [Google Scholar]
- 55.Glowacki R, Bald E. J Chromatogr B Analyt Technol Biomed Life Sci. 2009;877:3400–3404. doi: 10.1016/j.jchromb.2009.06.012. [DOI] [PubMed] [Google Scholar]
- 56.Park JB, Bae SH, Jang SM, Noh WJ, Hong JH, Yoon KD, Kang HC, Bae SK. J Sep Sci. 2013;36:2306–2314. doi: 10.1002/jssc.201300332. [DOI] [PubMed] [Google Scholar]
- 57.Dalle-Donne I, Giustarini D, Colombo R, Milzani A, Rossi R. Free Radic Biol Med. 2005;38:1501–1510. doi: 10.1016/j.freeradbiomed.2005.02.019. [DOI] [PubMed] [Google Scholar]
- 58.Rao Y, Xiang B, Bramanti E, D’Ulivo A, Mester Z. J Agric Food Chem. 2010;58:1462–1468. doi: 10.1021/jf903485k. [DOI] [PubMed] [Google Scholar]
- 59.Kuśmierek K, Głowacki R, Bald E. Anal Bioanal Chem. 2006;385:855–860. doi: 10.1007/s00216-006-0454-x. [DOI] [PubMed] [Google Scholar]
- 60.Shafer DE, Inman JK, Lees A. Anal Biochem. 2000;282:161–164. doi: 10.1006/abio.2000.4609. [DOI] [PubMed] [Google Scholar]
- 61.Tyagarajan K, Pretzer E, Wiktorowicz JE. Electrophoresis. 2003;24:2348–2358. doi: 10.1002/elps.200305478. [DOI] [PubMed] [Google Scholar]
- 62.Spadaro A, Ronsisvalle G, Pappalardo M. J Pharm Sci Res. 2011;3:1637–1641. [Google Scholar]
- 63.Cook JA, Pass HI, Iype SN, Friedman N, DeGraff W, Russo A, Mitchell JB. Cancer Res. 1991;51:4287–4294. [PubMed] [Google Scholar]
Associated Data
This section collects any data citations, data availability statements, or supplementary materials included in this article.


