

Abstract
Compared to small chemical molecules, monoclonal antibodies and Fc-containing derivatives (mAbs) have unique pharmacokinetic behaviour characterised by relatively poor cellular permeability, minimal renal filtration, binding to FcRn, target-mediated drug disposition, and disposition via lymph. A minimal physiologically based pharmacokinetic (PBPK) model to describe the pharmacokinetics of mAbs in humans was developed. Within the model, the body is divided into three physiological compartments; plasma, a single tissue compartment and lymph. The tissue compartment is further sub-divided into vascular, endothelial and interstitial spaces. The model simultaneously describes the levels of endogenous IgG and exogenous mAbs in each compartment and sub-compartment and, in particular, considers the competition of these two species for FcRn binding in the endothelial space. A Monte-Carlo sampling approach is used to simulate the concentrations of endogenous IgG and mAb in a human population. Existing targeted-mediated drug disposition (TMDD) models are coupled with the minimal PBPK model to provide a general platform for simulating the pharmacokinetics of therapeutic antibodies using primarily pre-clinical data inputs. The feasibility of utilising pre-clinical data to parameterise the model and to simulate the pharmacokinetics of adalimumab and an anti-ALK1 antibody (PF-03446962) in a population of individuals was investigated and results were compared to published clinical data.
Electronic supplementary material
The online version of this article (doi:10.1208/s12248-014-9640-5) contains supplementary material, which is available to authorized users.
KEY WORDS: monoclonal antibody, PBPK, pharmacokinetics, simulation
INTRODUCTION
Monoclonal antibodies and their Fc-containing derivatives (mAbs) represent a growing segment of the pharmaceutical development pipeline (1) and are increasingly being used as therapeutic agents. The processes determining the fate of mAbs within the body are very different to those that govern the disposition of small molecule drugs. For instance, the diffusion of mAbs across lipid bilayers is limited and distribution into the interstitial space of tissues depends on two non-specific mechanisms. The first is convection through pores in the endothelial vasculature of the tissue and the second is transcytosis. Transcytosis is one outcome of a complex biological pathway involving membrane invagination of plasma components (fluid-phase endocytosis), binding within the endosome and subsequent sorting processes that result in either transport to the interstitial space or, recycling to the blood, or degradation within the lysosome. The neonatal Fc receptor (FcRn) plays a key role in protecting IgG from lysosomal degradation following fluid-phase endocytosis and is the main reason that IgG has a prolonged half-life in the circulation (∼21 days).
Physiologically based pharmacokinetic (PBPK) models are being used increasingly to describe the disposition and interactions of small molecule drugs in different ethnic and disease populations (2). Similar approaches have also been used to develop PBPK models for protein therapeutics. The first PBPK model for mAbs was developed by Covell et al. in 1986 (3). Their mouse model for IgG and its fragments (F(ab′)2 and Fab′) included both diffusion and convection across the vascular membrane as well as convective flow into lymph. In 1994, Baxter and co-workers (4,5) published a mouse PBPK model and adapted the two-pore model for transcapillary exchange, that had originally been proposed by Rippe and Haraldsson (6), to account for movement of IgG, F(ab) and F(ab′)2 from the vascular to the interstitial space. This PBPK model also incorporated a tumor compartment to account for specific mAb binding to target. However, a number of important processes including the binding to FcRn and subsequent recycling to the blood or transcytosis were omitted from both of these models. In 2005, Ferl et al. (7) integrated the FcRn recycling mechanism into a two-pore mouse PBPK model for mAbs, although the FcRn recycling mechanism was only considered in the skin and muscle (as a single compartment called carcass). In 2007, Garg and Balthasar (8) published a mouse PBPK model for mAbs where FcRn recycling was considered in all tissue compartments reflecting the widespread expression of FcRn in endothelial cells (9). Features of the model included the uptake of IgG by convective transport and endocytosis and division of each organ into three sub-compartments (vascular, endosomal and interstitial) (10). More recently, other PBPK models have been published with similar compartmental structures to those described above (see Dostalek et al., for more details (1)). The PBPK models to date have generally focussed on describing the pharmacokinetics of mAbs in rats or mice, although some studies have proposed strategies to scale to humans. Shah and Betts (11) used a platform approach whereby simulations for a single mAb could be performed for multiple species. Given the structural complexity and number of parameters needed for full PBPK models, initially a minimal PBPK model approach was chosen for this study (12). The concept of minimal PBPK models is not novel and “hybrid PBPK models” (13,14) or minimal PBPK models (12) have been used to describe the disposition of small chemical molecules. These concepts have been recently extended to the modelling of mAbs for mice (15) and for both mice and humans (12,16), but FcRn-mediated distribution and elimination are not explicitly taken account of in these minimal versions of PBPK model for mAbs.
In this study, the compartmental structure previously described by Garg and Balthasar (8) in a full PBPK model for mice was used as a basis for development of the minimal PBPK model in humans. The body tissues were represented as a single compartment, further sub-divided into vascular, endothelial and interstitial spaces with additional compartments representing the lymph node and plasma (Fig. 1). Within the endothelial space, a previously published model of FcRn recycling (8) was included and competition of endogenous IgG and mAb for FcRn binding was modelled. Targeted-mediated drug disposition (TMDD) models were coupled to the minimal PBPK model to allow the effects of target binding in the plasma or interstitial space on pharmacokinetics to be simulated. In the final model, the parameters describing the behaviour of endogenous IgG are fixed. The feasibility of using in vitro/pre-clinical data to parameterise the model (i.e. for binding affinity to FcRn and pharmacological target together with an estimate of in vivo abundance of the pharmacological target) for a novel mAb was investigated using adalimumab and the anti-ALK1 antibody (PF-03446962) as examples.
Fig. 1.
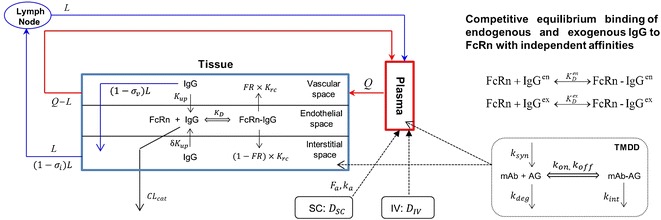
The model structure of the minimal PBPK model for mAbs with competitive equilibrium binding of endogenous and exogenous IgG to FcRn and the coupling with target-mediated drug disposition (TMDD) models
METHODS
Simulations were conducted using the mechanistic minimal PBPK model for mAbs implemented within the Simcyp simulator (V13 release 2). Some of the model analyses were performed in Matlab (version R2012a). In the remainder of the manuscript, endogenous IgG refers to the levels of IgG in an individual subject, governed by the synthesis and degradation processes, and mAb is used to describe any exogenously injected IgG molecules.
Model Parameters
Within the framework of the minimal PBPK model, the parameters governing the disposition of endogenous IgG and mAb can be defined separately. This flexibility allows the effect of varying a particular parameter for the mAb to be studied without assuming a concomitant change in the parameter for endogenous IgG. The modelling approach taken was to define the parameters for the minimal PBPK model for endogenous IgG, and then to use these as baseline values for simulating the pharmacokinetics of mAbs. The sources of many of the physiological parameters used in building the mAb model (plasma volume and flow, body weight, height, surface area, etc.) and their distribution within the population have been described previously (17,18). The specific parameters that needed to be defined to allow simulations of mAb pharmacokinetics along with typical values of the parameters are listed in Table I.
Table I.
Physiological Parameters Used Within the Minimal PBPK Model for mAbs
| Parameter | Definition | Mean value | Unit | CV (%) | Source |
|---|---|---|---|---|---|
| Q | Plasma flow rate | 2.94 | L/kg/h | (11) | |
| L | Lymph flow rate | 0.0017 | L/kg/h | 5 | (48) |
| V V | Volume of vascular space | 0.023 | L/kg | (11) | |
| V E | Volume of endothelial space | 0.5% of total tissue volume | (8) | ||
| V I | Volume of interstitial space | 0.16 | L/kg | (11) | |
| V L | Volume of lymph node compartment | 0.00386 | L/kg | 30 | (11) |
| C enp | Endogenous IgG concentration | 12.1 | mg/ml | 12.6 | (19) |
| [FcRn]T | Total effective concentration of FcRn | 40 | μM | (7) | |
| σ env | Vascular reflection coefficient for endogenous IgG | 0.62 | Fitted—based on endogenous IgG data | ||
| σ eni | Lymphatic reflection coefficient for endogenous IgG | 0.2 | (8) | ||
| K enup | Endothelial uptake rate for endogenous IgG | 0.0298 | h−1 | (40) | |
| K enrc | Rate of recycling of bound endogenous IgG | 0.587 | h−1 | Fitted – based on endogenous IgG data | |
| FR | Recycling fraction of FcRn bound IgG | 0.715 | (8) | ||
| δ | Ratio of uptake rates in luminal and abluminal sides | 1 | |||
| K enD | Equilibrium dissociation constant for endogenous IgG and FcRn binding | 0.728 | μM | 10 | (25) |
| CL encat | Intrinsic clearance of endogenous IgG from endothelial space | 0.0175 | L/h | 10 | Fitted—based on endogenous IgG data |
The parameters characterising endogenous IgG kinetics and mAb were based on literature sources with the exception of catabolic clearance CLencat, vascular reflection coefficient σenv, and recycling rate constant Kenrc. These three parameters were obtained by manually varying the parameters within the model until results consistent with the observed data (a mean half-life of 21 days, a mean IgG synthesis rate of 34 mg/kg/day, and a realistic fold reduction in IgG concentration when FcRn is absent (19,20)) for the endogenous pharmacokinetics of IgG were obtained.
Population Simulations
To simulate pharmacokinetics in populations of individuals rather than in a single subject the following approach is taken. Demographics, anatomical (e.g. height, body weight, age etc.) and biological characteristics of each subject are assigned based upon the known distributions and correlations of these parameters within the population of interest. These data are incorporated in PBPK models as described previously (17,18,21). Lastly, parameters specific for the disposition of endogenous IgG and the mAb for which the relevant covariates are not known are assigned randomly using log-normal distributions.
Simulations were conducted for adalimumab and an anti-human activin receptor-like kinase 1 (anti-ALK1) antibody (PF-03446962) and the outcomes were compared with observed clinical data from Weisman et al. (22), den Broeder et al. (23) and Luu et al. (24).
For adalimumab, the effect of using the same KD as for endogenous IgG (728 nM) or an in vitro measured value for adalimumab (672 nM) (25) was investigated, all other parameters were the same as those in the baseline model developed for endogenous IgG. Data describing the binding of adalimumab to TNF-α (kon 6,080 μM−1 h−1, koff 0.17 h−1; CV = 30% for both parameters) were taken from the literature (26). The baseline plasma level of TNF-α in subjects with rheumatoid arthritis (Rmax = 4.4E–6 μM; CV 30%) and values for the degradation rate of TNF-α (kdeg) (0.877 1/h; CV 30%) were taken from published values (27,28). The TNF-α synthesis rate (ksyn) was calculated for each subject using the relationship Rmax × kdeg, and the degradation of the adalimumab-TNF-α complex was assumed to be the same as the degradation rate of endogenous TNF-α.
Simulations including TMDD parameters were also performed for the anti-ALK1 antibody (PF-03446962). This was chosen as an example as the values used to define the parameters for the TMDD model were largely derived from in vitro data. The parameters used to define the binding to target and elimination of the drug-target complex were taken from Luu et al. (24) (kon = 3,132 μM−1 h−1; koff = 1.08 h−1; kint = 0.1821 h−1; CV = 25% on each parameter) as were the parameters describing the level of ALK-1 (Rmax = 0.00174 μM; kdeg = 0.223 h−1; CV = 20% on each parameter), the affinity to FcRn and CLcat were assumed to be the same as those of endogenous IgG (0.728 μM; CV = 25% and 0.0175 L/h; CV = 25%), respectively.
RESULTS
Model Development
The following features of endogenous IgG disposition were incorporated in the model, (i) entry of IgG into the tissue vascular space is determined by arterial plasma flow (Q) and exit of IgG from the vascular space by venous plasma flow (Q-L); (ii) from the vascular space, IgG distributes to the interstitial space by convective transport that is governed by lymph flow (L) and by the vascular reflection coefficient (σv); (iii) IgG moves from the vascular and/or interstitial space to the endothelial space by fluid-phase endocytosis (Kup); (iv) it is assumed that intact IgG in the endothelial space interacts with FcRn (KD); (v) unbound IgG within the endothelial space can be cleared from the system (CLcat); (vi) IgG bound to FcRn recycles either to the vascular or interstitial space by exocytosis (FR,Krc); (vii) IgG moves from the interstitial space to the lymph node by convection dependent on lymph flow (L) and the lymphatic reflection coefficient (σi).
Using the proposed model structure the concentrations of endogenous IgG (Cen) in the various compartments are governed by the following set of equations:
| 1 |
| 2 |
| 3 |
| 4 |
| 5 |
Here CP and CV are free IgG concentrations in plasma and tissue vascular space, respectively, CTE is the total IgG concentration in the endothelial space, CI is the free IgG concentration in the interstitial space and CL is the free IgG concentration in lymph node tissue. Vx is the volume of compartment x and other terms are as shown in Fig. 1.
A similar set of equations governs the concentrations of mAb (Cex):
| 6 |
| 7 |
| 8 |
| 9 |
| 10 |
Here In(t) is the infusion rate and R0 the mass flux produced by IV bolus or subcutaneous administration route (details of how these terms are treated are defined later).
The two sets of equations for endogenous and mAb are coupled through the unbound fractions of endogenous IgG and mAb in the endothelial compartment, fenu and fexu, respectively. In the endosome, the two species compete for binding to FcRn, according to the equilibrium binding schemes shown in the top right panel of Fig. 1. Therefore, at each integration time step, Eq. (11) is solved to determine the free fraction of FcRn binding sites within the endosomal space, x
| 11 |
where
| 12 |
Here [FcRn] and [FcRn]T are free and total concentrations of FcRn binding sites in the endothelial space, respectively; while KenD and KexD are the equilibrium dissociation constants of endogenous IgG and mAb to FcRn (at pH 6), respectively.
After x is obtained, the fractions of unbound IgG in the endothelial space are calculated by
| 13 |
A detailed mathematical formulation is given in Appendix A of the supplementary material, along with a general algorithm for computing fenuand fexu at each integration time step.
Dosing
Within the model mAb is dosed by either intravenous (IV) or subcutaneous (SC) injection. For the latter route a first-order absorption model is used (Eq. 14)
| 14 |
where Ad represents the amount of free drug in absorption site and ka is the first-order absorption constant. Therefore, R0 in Eq. (6) is defined by
| 15 |
where Fa is the fraction of dose absorbed.
In(t) in Eq. (6) represents an IV infusion rate, defined by
| 16 |
where T(t) is the infusion period. Intravenous bolus administration can be modelled either by (16) with a short infusion period or by defining the initial conditions as described below.
Initial Conditions
The initial conditions for mAb are given by Eq. (17).
| 17 |
The initial conditions for endogenous IgG are set as the steady-state solution of Eqs. (1–5), assuming the absence of mAb. To define the initial conditions for a population of individuals the following approach was adopted. Each individual in a population was assigned randomly a baseline IgG plasma level by sampling from the log-normal distribution of endogenous IgG concentrations (defined by a mean and CV; for a healthy population values of mean and CV were 12.1 mg/ml and 12.6%, respectively (20)). Using the assigned value of CenP,SS, the solution of the algebraic equations derived by setting the left hand of Eqs. (1–5) to zero can be calculated, to give values of CenV,SS, CenTE,SS, CenI,SS, and CenL,SS. These values are then taken as the initial values for the assigned CenP,SS (details of the steady-state solutions and their derivation are given in Appendix B of the supplementary material).
Thus at time 0
| 18 |
Target-Mediated Drug Disposition
Within the minimal PBPK model the binding of the mAb to its pharmacological target was considered to occur either within the plasma or within the interstitial space of the tissue compartment. This is a simplification of reality where the target could exist as a membrane bound target, and simultaneously as a shed or secreted soluble receptor in the interstitial space and in the plasma (29). Nevertheless, this simplified model allowed the effects of target binding on pharmacokinetics to be considered in a physiological context. If the target is expressed within the interstitial space then the concentration within that space will change as mAb binds to the target. Thus, Eq. (9) is modified to Eq. (19) to account for this using the full TMDD model described by Mager and Jusko (30).
| 19 |
Here kon is the association rate constant of drug and target, koff is the dissociation rate constant of drug-target complex, [R] is the concentration of the free target and [RCexI] is the concentration of the mAb-receptor complex. Equations (20) and (21) describe the concentrations of free target [R] and complex [RCexI], respectively.
| 20 |
| 21 |
The initial conditions for Eqs. (20) and (21) are given by Eq. (22).
| 22 |
Similar equations can also be written for the case where targets are located in plasma. Specifically, the driving concentration for target binding is the plasma concentration, and Eq. 6 is modified as
| 23 |
coupled with (20) and (21), replacing the driving concentration CexI by CexP.
The minimal PBPK model was built by finding estimates for as many parameters as possible using literature sources. The values used are listed in Table I and the justification for the choice of parameters is given in the “Discussion” section. At the end of this process, there were still three parameters that needed to be identified CLcat, Krc and the reflection coefficient σv. Various values of σv were tried in the model. With the values used for lymph flow in the model it was found that a value of 0.62 was needed for this parameter to give a reasonable interstitial concentration of endogenous IgG (steady-state interstitial space: plasma ratio of 0.17) compared with experimental data (27,31).
This left two parameters that needed to be identified and attempts were made to obtain estimates of these parameters by adjusting the model parameters so that the simulation results were close to observed values for endogenous IgG in vivo (plasma half-life, synthetic rate and fold change in half-life in the absence of FcRn). It became apparent during the exercise that CLencat, and Kenrc were not uniquely identifiable and different pairs of values could give very similar plasma and interstitial concentration profiles. We found two pairs of CLencat and Kenrc values of 0.0175 L/h and 0.587 h−1 or 8 L/h and 5.544 h−1, giving similar plasma and interstitial concentration profiles. Here CLencat represents the intrinsic catabolic clearance of IgG by lysosomes in endothelial cells. It was reported in (32) that the average lysosomal half-life of ingested proteins is about 8 min. If we take this value for IgG catabolism in lysomoses and assume that the volume of lysosome is 1% of cell volume (33), and the total endothelial cell volume is 0.5% of total tissue volume (8), then an estimate of CLencat is 0.0182 L/h for a 73-kg man, which is very close to the value in the lower pair (0.0175 L/h).
Additional support for using the lower pair of values comes from the simulation study for intravenous immunoglobulin (IVIG) therapy, where administration of higher doses of mAb (2,000 mg/kg) resulted in competition between endogenous IgG and mAb for FcRn binding and endogenous IgG levels significantly decreased during the time course of the simulation. The simulation showed that for the lower pair, mean endogenous IgG concentration decreased from 12.1 mg/ml at the start of the simulation to a minimum value of 5.3 mg/ml before returning to baseline values; while with the higher pair of values less competition between endogenous IgG and mAb for FcRn binding was seen such that mean endogenous IgG concentration decreased from 12.1 mg/ml at the start of the simulation to a minimum value of 11 mg/ml before returning to baseline values (data not shown). Data in subjects with calcium-channel autoantibodies showed a 35% decrease in levels of the autoantibodies 4 weeks after a total dose of 2 g/kg of IVIG (34).
Taken together, the final model employs the low pair of values. The simulated plasma concentration-time profile of mAb (1 mg/kg IV) in a single human subject is shown in Fig. 2a. The plasma concentration vs time profile showed a bi-exponential decline with a terminal half-life of ∼20 days. The concentrations of mAb in the interstitial space of the tissue attained maximum concentrations slowly (Tmax = 70.8 h) and then decreased.
Fig. 2.
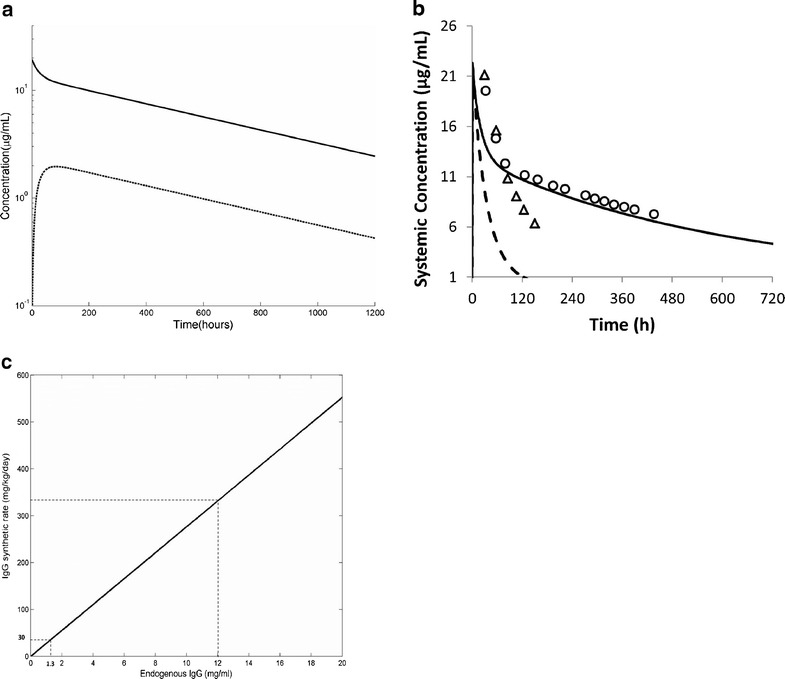
a Simulated plasma (solid line) and interstitial space (dashed line) concentration versus time profile for IgG following a 1 mg/kg intravenous bolus dose (administered over 30 s). Simulations were performed using model parameters as described in Table I. b Simulated plasma concentrations of exogenously administered IgG dosed to a healthy volunteer (solid line) and an individual lacking functional FcRn (dashed line). The symbols represent the actual measured concentrations in the study (20). c The relationship between steady-state endogenous IgG concentration and IgG synthetic rate in individuals that lack functional FcRn
The initial concentrations of endogenous IgG in the plasma, interstitial and endothelial compartments were 12.1, 2.1 and 12 mg/ml and the calculated IgG synthetic rate was 33.3 mg/kg/day.
In contrast to the findings in individuals expressing FcRn, increasing the concentration of mAb in individuals who lack FcRn produced no changes in the plasma concentrations of endogenous IgG (data not shown). Figure 2b shows simulations performed in a virtual subject where the effective FcRn concentration was set to be close to zero to mimic what would happen in an individual who lacked functional FcRn. The half-life of mAb decreased to 1.8 days. This compares to the actual measured half-lives of 3 days in subjects without functional FcRn (20). When FcRn is not included in the model, an IgG synthetic rate of about 30 mg/kg/day gives concentrations of endogenous IgG about nine-fold lower than those seen in an individual with normal levels of FcRn (1.3 vs 12 mg/ml) (Fig. 2c). This is consistent with reported IgG levels in three patients with FcRn deficiency (20) who had measured IgG synthetic rates of 29 ± 19 mg/kg/day, and serum IgG levels of 2.3 ± 1.8 mg/ml, respectively.
Simulations of IgG Kinetics Within a Population of Individuals
Although the minimal PBPK model was able to simulate the pharmacokinetics of IgG in an individual subject and to capture some of the key features of endogenous IgG pharmacokinetics, initial attempts to use the model to predict IgG pharmacokinetics in populations resulted in unrealistic variability between individuals. An example is shown in Fig. 3a where simulations were performed for a population of 100 individuals with the only variability being that in baseline IgG level. The range of simulated plasma concentrations between individuals was very large, with half-lives ranging from ∼6 to over 60 days.
Fig. 3.
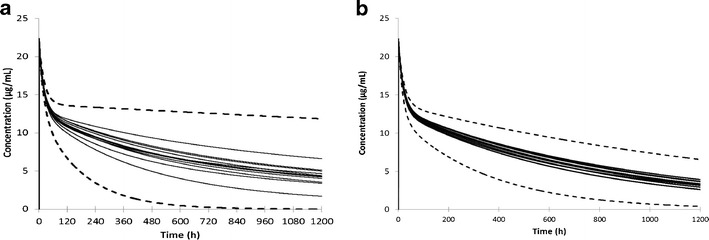
a Simulated plasma concentrations in a population of 100 individuals (10 trials of 10) using CLcat = 0.0175 L/h and Krc = 0.587 h−1. The solid lines represent the mean values from each of the 10 trials and the dashed lines the concentrations in the individuals with highest and lowest clearance of exogenous IgG. In this simulation, the only variability that was considered was in the baseline level of endogenous IgG (mean 12.1 mg/ml; CV = 12.6%). b Simulated plasma concentrations in a population of 100 individuals (10 trials of 10) using CLcat = 0.0175 L/h and Krc = 0.587 h−1. The solid lines represent the mean values from each of the 10 trials and the dashed lines the concentrations in the individuals with highest and lowest clearance of exogenous IgG. In this simulation, the following parameters were used α = 0.93, IgG (mean 12.1 mg/ml; CV = 12.6%), IgG K enD (0.728 μM; CV = 10%), IgG K exD (0.728 μM; CV = 10%), IgG CL encat (0.0175 L/h; CV = 10%), IgG CL excat (0.0175 L/h; CV = 10%), lymph flow rate (0.00169 L/kg/h), lymph node volume (0.00386 L/kg; CV = 30%)
Various approaches were tried to modify the model to recover a more realistic range of half-life values when population simulations were conducted. Of the many possibilities that were tried, one condition that gave a reasonable range of half-life values was when a correlation was assumed between the baseline endogenous IgG level and the individualized effective concentration of FcRn binding sites for IgG in the endosomal space. Specifically, the following correlation was imposed
| 24 |
Where [FcRn]ref and [IgG]ref are the reference concentrations of FcRn and IgG, respectively. If [IgG] = [IgG]ref, then [FcRn] = [FcRn]ref. The restriction on α between 0 and 1 is based on the observation that the relative increase in FcRn should be less than that in IgG so that increasing IgG concentration eventually leads to saturation of FcRn binding as observed by Waldmann et al. (19).
The simulated relationships between endogenous IgG concentration and its half-life for different values of α are shown in Fig. 4a. When α has a value in the range 0.88–0.93, the simulations match reasonably well with the observed data from Waldmann (19). The relationship between fractional catabolic rate (FCR, defined as IgG synthetic rate divided by total amount of IgG in plasma (19)) and serum IgG concentration for various values of α are shown in Fig. 4b. The simulations produce results that are consistent with the findings of Waldmann et al. (19) in that FCR increases with increasing concentrations of IgG, and is significantly reduced in patients with a low serum IgG concentration.
Fig. 4.
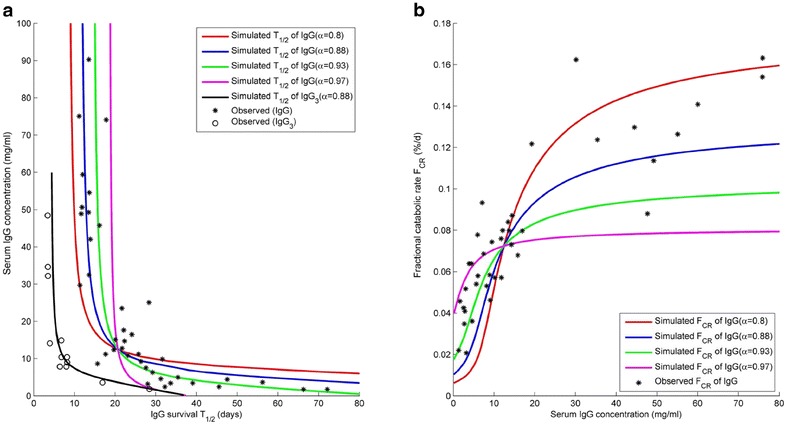
a Relationship between baseline plasma IgG concentration and half-life of intravenously administered exogenous IgG when a correlation between plasma IgG concentration and FcRn concentration is assumed. The relationship for different values of α are shown. The stars represent measured data in patients with a wide range of IgG concentrations digitised from the original publication by Waldmann et al. (19). b Relationship between Fractional catabolic rate and baseline serum IgG concentration for differing values of α (range 0.80–0.97). Using the minimal PBPK model exogenous IgG was simulated to have a half-life of 6.5 days if either the recycling rate of exogenous IgG was decreased 4.5-fold or the catabolic rate of IgG was increased 4-fold. Using a correlation coefficient α = 0.88 between endogenous IgG and effective FcRn concentration with either the reduced recycling or the increased catabolic rate it was possible to simulate a relationship between serum IgG concentration and IgG3 half-life that matches the observed relationship between these parameters reported by Morell et al. (47)
Population simulations were performed using an assumed value for α of 0.93, with baseline IgG concentrations of 12.1 mg/ml (CV 12.6%) with variability incorporated on to all of the other parameter values as indicated in the legend of Fig. 3. Assuming a relationship between baseline IgG concentration and FcRn concentration results in a more realistic range of half-lives across the population (13 to 33 days) (Fig. 3b).
The Relationship Between IgG-FcRn KD and Simulated Half-Life
As the affinity of IgG to FcRn is increased there is a large non-linear increase in the simulated half-life. However, the corresponding dimensionless relation, i.e., the relation between the fold change in affinity (μM) and fold change in half-life (days), is linear and independent of the endogenous IgG level (data not shown).
The Effect of Changing Endosomal Uptake or Recycling Rate on the Elimination Half-Life of IgG
Changing the endosomal uptake rate of a mAb also influences the simulated pharmacokinetics. A higher uptake rate leads to more mAb in the endothelial cell and a faster clearance of the mAb from plasma and a resultant shorter half-life while a lower uptake rate has the opposite effect (data not shown).
Simulations of Adalimumab and PF-03446962 Kinetics in Population
Simulated plasma concentrations of adalimumab in 100 individuals at doses of (0.5, 1, 3 and 5 mg/kg) are shown in Fig. 5 along with mean observed concentration from two clinical studies (22,23). The simulated clearance and half-life at the 3 mg/kg dose were 0.11 ± 0.049 (ml/h/kg) and 528 ± 248 h, respectively. This compares with observed clearances (0.225 ± 0.061 and 0.131 ± 0.044 ml/h/kg) and half-life (267 ± 90; 455 ± 139 h). As can be seen from the concentration-time profiles and the calculated values for CL and half-life, when an in vitro measured value of FcRn KD (0.672 nM) is used there is a tendency to underpredict CL and hence to over predict the value of half-life. Figure 6 shows a series of sensitivity analyses where the value of four parameters Kup, Krc, CLcat and FcRn KD were varied and the plasma concentrations compared with the observed data. For this exercise, the 3 mg/kg dose level was used and the original values were independently varied over a 10-fold higher and 10-fold lower range. As can be seen in Fig. 6, by varying any of these parameters, it is possible to cover the range of plasma concentrations observed in the clinical study.
Fig. 5.
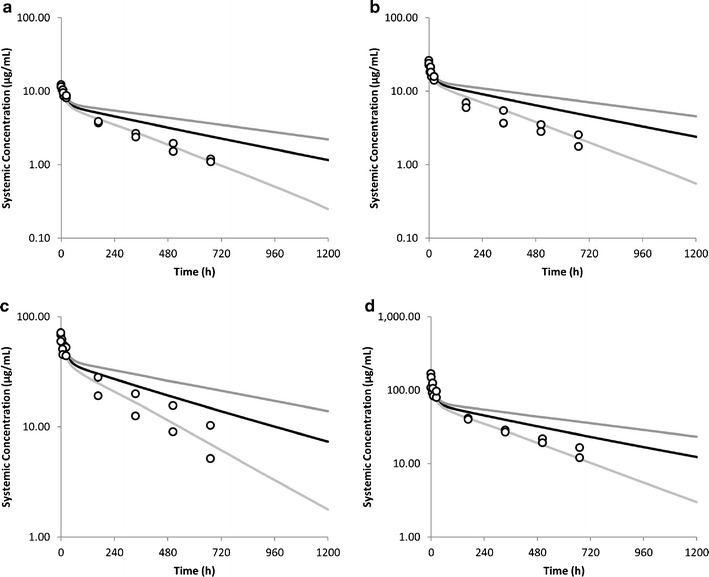
Simulated and observed plasma concentrations of adalimumab following intravenous dosing. a 0.5 mg/kg, b 1 mg/kg, c 3 mg/kg, d 5 mg/kg. The black line represents the population mean simulation and the grey lines the 5th and 95th percentiles of the population
Fig. 6.
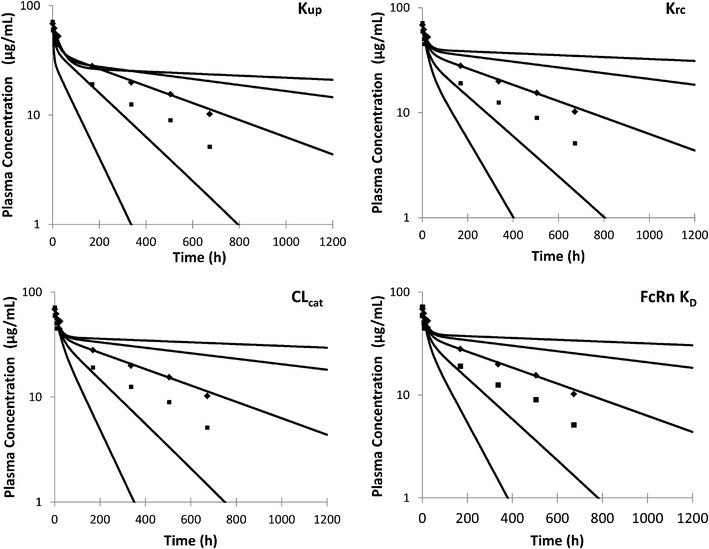
The sensitivity of the model to various parameters was assessed by changing the values in the baseline model over a 10-fold higher and lower range (100-fold range in total). Simulations were performed with a dose of 3 mg/kg adalimumab and the simulated plasma concentrations at each parameter value are shown by lines with the clinical data from Weisman et al. (22) and den Broeder et al. (23) shown as dots
Simulated plasma concentrations of anti-ALK1 antibody PF-03446962 in 100 individuals dosed at doses between 0.5 and 4.5 mg/kg are shown in Fig. 7.
Fig. 7.
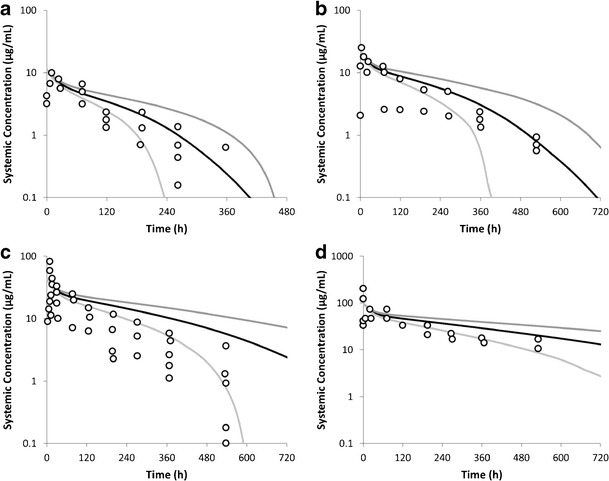
Simulated and observed plasma concentrations of PF-03446962. The average simulated data (100 subjects) are shown as a black line with the 5th and 95th percentiles indicated as grey lines. The circles represent the clinical data reported by Luu et al. (24). a 0.5 mg/kg, b 1 mg/kg, c 2 mg/kg, d 4.5 mg/kg
DISCUSSION
Minimal PBPK models can act as a bridge between top-down compartmental pharmacokinetic models and full PBPK models by incorporating some features of physiologically based models in a simplified structural framework that reduces the complexity associated with full PBPK models (16). Minimal PBPK models have been constructed for small molecule compounds previously (12) and the formal basis for lumping tissue/organ compartments together has been discussed by Nestorov et al. (35) and Pilari and Huisinga (36). In general, small molecule minimal PBPK models include only the key tissue compartments of interest and the rest of the tissues are lumped together into two groups representing rapidly equilibrating and slowly equilibrating tissues. The situation should be less complicated for mAbs as these compounds have poor vascular and cellular permeability and elimination is thought to occur largely in the tissue endosomal space. Therefore, a minimal PBPK model with all of the tissue compartments lumped into a single compartment was developed and used to simulate the pharmacokinetics of IgG, mAbs and Fc-fusion proteins. The major mechanistic features incorporated in the minimal PBPK model are (i) competition for binding to FcRn between endogenous and exogenous IgG; (ii) incorporation of TMDD models in either the interstitial space of the tissue compartment or plasma (iii) utilisation of in vitro data inputs to simulate the pharmacokinetics of monoclonal antibodies and (iv) adaptation of the model to allow simulations to be made in virtual populations as well as in a single individual.
To describe the pharmacokinetics of IgG, information on a number of physiological parameters are needed. In addition to information on tissue/body weight and blood/plasma flow needed for all PBPK models specific information is needed to construct a mechanistic PBPK model for IgG including information on (i) the reflection coefficient describing the relationship between movement of IgG and bulk fluid from the vascular to the tissue interstitial space, (ii) the rate of endosomal uptake, (iii) the abundance of FcRn, (iv) parameters describing the binding of IgG to FcRn, (v) an estimate of the catabolic clearance of IgG in the endosomal space and (vi) the rate and extent of recycling of the IgG-FcRn complex to the vascular and interstitial spaces and (vii) the level of endogenous IgG. The choice of values for these parameters is critical; the rationale for the choice of some of these key parameters in the model and their influence on the outcomes of the simulations are discussed below.
In the minimal PBPK model developed in this study, the steady-state ratio of endogenous IgG in the interstitial space to that in the plasma was simulated to be 0.17. By making the assumption that the concentrations in the lymph and the interstitial space are the same, this simulated ratio can be compared to reported values for the lymph: plasma ratio of IgG. Literature values for this ratio in humans range from 0.17 to 0.51 in the subcutaneous space, with values of 0.17 and 0.19–0.22 reported in the muscle and skin, respectively (31,27). In order to achieve a steady-state interstitial space: plasma ratio as high as 0.17 it was necessary to use a reflection coefficient of 0.62. This value is lower than typically used in published PBPK models for mAbs but in the described model using higher values for the reflection coefficient resulted in very low interstitial space: plasma ratios. In a minimal PBPK model with the tissues represented as a single compartment, the reflection coefficient needs to account for movement of IgG from the plasma to interstitial space in tissues with fairly leaky endothelial membranes, such as the liver and bone marrow, as well as tissues with less permeable endothelial membranes such as the muscle and brain. In addition to the reflection coefficient, the interstitial concentration is also influenced by the value of lymph flow used in the simulations. In some earlier studies where higher values of reflection coefficients have been used the values used for lymph flow are very high (2–4% of plasma flow) and outside the normal range of lymphatic flow in humans.
It was also possible to achieve an interstitial space: plasma ratio over 0.17 using a higher value for the reflection coefficient (0.85) if it was assumed that a portion of the interstitial space is not accessible to the endogenous IgG (five-fold reduction in interstitial volume VI). This decrease in interstitial volume is higher than the reported exclusion volume for macromolecules such as albumin in the interstitial space (37). To capture other known pharmacokinetic properties of IgG using the higher values for reflection coefficients, it was also necessary to decrease the recycling rate constant and this strategy was not used in the final model.
Shah and Betts (38) indicated that a linear relationship exists between plasma and tissue concentrations of mAbs (when high affinity and high capacity binding to specific targets was not a factor), and that this relationship would be constant irrespective of absolute mAb concentration, time (excluding the period immediately after dosing), and animal species. They extended this concept by calculating antibody biodistribution coefficients (ABC) for each organ (defined as the ratio of the tissue to plasma mAb concentrations). The average ABC calculated based on Shah and Betts study was 0.058. This compares favourably with the ABC observed (0.057) in simulations of endogenous IgG using the minimal PBPK model.
IgG uptake into the endosomal space is believed to occur by non-specific fluid-phase pinocytosis rather than by receptor-mediated endocytosis. The main reasons for this are (i) there is a limited surface expression of FcRn (ii) the extracellular pH does not appear to allow significant FcRn binding and (iii) the plasma concentration of IgG is high enough (about 12 mg/ml) for significant uptake of IgG to occur by this pathway (39). Alterations in the rate of mAb uptake could result in changes in mAb pharmacokinetics with a higher uptake rate leading to more IgG in the endothelial cell and a faster clearance from plasma.
The rate of endosomal uptake rate used for the simulations is a key parameter so it is important to have a realistic estimate of this rate. The reported value of pinocytosis in vitro is 0.0375 L/h/L cells (40). This value is similar to that estimated by Shah and Betts (11) (0.0366 L/h/L) by fitting their PBPK model to observed data (11). Assuming that 1 μl of volume contains 106 cells (41) this gives a pinocytosis rate of 37.5 nl/h per 106 cells. Using this in vitro data, the rate of pinocytosis in mouse is calculated to be 3.1 × 10⁻⁵ L/h (41). By making the assumption that the endothelial volume is constant per unit body weight between species, and correcting for differences in body weight, an estimated pinocytosis rate of 0.094 L/h in humans is obtained. The mean plasma volume in a simulation with 1,500 people in the Simcyp simulator was 3.1 L. Taking into account the rate of pinocytosis (0.0298 h−1) used in the minimal PBPK model, this gives an estimated plasma uptake clearance by endocytosis of ∼0.09 L/h, which is close to the calculated value for mouse and consistent with the measured rate in vitro and the estimated value from Shah and Betts (11).
Both the abundance of FcRn within the endosomal space and the parameters describing the binding of IgG to FcRn are key determinants of the simulated pharmacokinetics of IgG in the minimal PBPK model. There are no published measurements of the abundance of FcRn protein within the endosomal space of tissues and also information on how this parameter varies between individuals is lacking. As a result, the value estimated by Ferl for FcRn abundance in mice (4 × 10⁻⁸ mol/ml = 40 μM) was used (7). This value has the same order of magnitude to the estimate in humans made by Garg (33 μM) (42) and to the fitted value of 4.98 × 10⁻⁵ M (CV% = 11.1) obtained by Shah and Betts (11) for different species including human. Because the described minimal PBPK model uses an estimated FcRn concentration we purposely used the phrase ‘effective concentration of FcRn’, rather than ‘FcRn abundance’.
The measurement of FcRn abundance is a key requirement to enable improvements in the modelling of mAb pharmacokinetics. Progress in this area has been made by Chen et al. (43) who used quantitative PCR to measure mRNA levels of FcRn in different tissues of mice. However, as the relationship between mRNA and protein level and whether or not there are species differences in abundance of FcRn are not known and questions about the true abundance and variability of FcRn protein in humans remain.
The affinity of binding of the mAb to FcRn is another key parameter defining the pharmacokinetic behaviour of mAbs in the minimal PBPK model. The binding of human IgG to human FcRn has been measured using a variety of techniques and widely different estimates are reported in the literature (KD pH 6.0 estimates range from 10 to 2,527 nM) (44,45). The wide range of values reported in the literature for this parameter and the fact that this is a sensitive parameter in the model pose some problems in using the model to simulate different studies. We have used FcRn KD values from a single study (25). An alternative approach to allow simulation of other mAbs would be to use a calibration approach whereby the affinity of the mAb of interest and wild type endogenous IgG are measured in the same experiment and the value for the mAb of interest is calculated from KD = 0.728 × (mAb KD/WT KD), where 0.728 (μM) is the assumed FcRn KD value of intact IgG in this minimal PBPK model.
As the affinity of mAb to FcRn decreases (KD increases) the predicted change in half-life tends towards a limit value of 0.087, which corresponds to a half-life of 1.8 days and is consistent with that reported in patients with FcRn deficiency (3 days) (20).
One further limitation of the model described in this paper is that, as the affinity of the binding of the mAb to FcRn at pH 6.0 increases (KD decreases), the model predicts that there is an increase in the half-life of the mAb. This increase is much larger than has been observed to date in studies of the effect of FcRn binding on mAb pharmacokinetics ((41); (39)). There are several possible reasons for this. Chen and Balthasar have shown that the predicted increase in half-life with changes in FcRn binding affinity are markedly less if the model incorporates the pH changes that occur as a mAb is trafficked through the endosome (41).
Initial efforts to make the model suitable for simulations in populations rather than just in a single individual were not successful. Ultimately, it was necessary to assume a linear correlation between baseline endogenous IgG level and effective FcRn concentration to obtain successful population simulation using these parameter values. Operationally, this assumption serves to maintain the relationship between fu in the endothelial space and catabolic clearance within a reasonable range and allowed the variability in IgG half-life across a wide range of baseline IgG concentrations observed by Waldmann et al. (19) to be captured (Fig. 4). However, it is not ideal to have to impose a correlation between the baseline IgG and FcRn concentration without some experimental evidence to support it. Experiments in transgenic animals with overexpression of FcRn have shown that they have higher levels of circulating IgG and improved immune function (46), suggesting higher levels of FcRn can result in higher plasma IgG levels. However, information on FcRn abundance and the variability within the human population and the correlation of the FcRn abundance with the steady-state IgG level is needed to further refine the minimal PBPK model.
A recent publication by Cao et al. (16) presented an alternative minimal PBPK model to describe the pharmacokinetics of mAbs in humans. The model lumped the body into two compartments consisting of leaky (reflection coefficients 0.31–0.84) and tight tissues (reflection coefficient (0.88–0.99)). In addition they looked at the ability of the model to predict pharmacokinetics if the CL was assumed to occur in the plasma compartment or in the interstitial compartment. Overall, the model performed well and was able to fit the data for a number of mAbs in humans. There were some differences in approach between the paper described by Cao et al. and the work in the current manuscript, the main one was that the approach described by Cao et al. was a top-down fitting approach with reflection coefficients and clearance being optimised individually for each compound. The approach adopted in the current manuscript was to try and use an approach where the majority of parameters were fixed based on the behaviour of endogenous IgG and in vitro values of FcRn KD and in vitro/pre-clinical data was used to parameterise the TMDD aspects of the model and to predict the pharmacokinetics of the compound in a population. This worked reasonably well in describing the kinetics of PF-03446962 but would have required some additional fitting to accurately describe the kinetics of adalimumab.
CONCLUSION
Application of simple two-compartmental models remains the standard approach for fitting pharmacokinetics of mAbs even though physiological parameters and intracellular processes governing clearance and disposition of IgG are ignored in these models. The proposed minimal PBPK model offers an alternative approach for simulating pharmacokinetics of mAbs by incorporating information on the in vitro/pre-clinical behaviour of a novel mAb with information related to the pharmacokinetic behaviour of endogenous IgG, and information on the binding and abundance of pharmacological targets to enable prediction of mAb pharmacokinetics in human populations.
Electronic Supplementary Material
(PDF 285 kb)
Acknowledgments
We thank Professor Geoff Tucker (Simcyp Limited, A Certara Company, Blades Enterprise Centre, John Street, Sheffield S2 4SU, U.K.) for his thorough review of the manuscript and constructive comments.
Conflict of Interest
Linzhong Li, Iain Gardner, and Masoud Jamei are employees of Simcyp (a Certara company). Miroslav Dostalek was employed at Simcyp (a Certara company) at the time of work on minimal PBPK model. The findings and the conclusions in this report are those of the authors and do not necessarily represents the view of Simcyp (a Certara company) and F. Hoffmann-La Roche AG.
References
- 1.Dostalek M, et al. Pharmacokinetics, pharmacodynamics and physiologically-based pharmacokinetic modelling of monoclonal antibodies. Clin Pharmacokinet. 2013;52(2):83–124. doi: 10.1007/s40262-012-0027-4. [DOI] [PubMed] [Google Scholar]
- 2.Nestorov I. Whole body pharmacokinetic models. Clin Pharmacokinet. 2003;42(10):883–908. doi: 10.2165/00003088-200342100-00002. [DOI] [PubMed] [Google Scholar]
- 3.Covell DG, et al. Pharmacokinetics of monoclonal immunoglobulin G1, F(ab′)2, and Fab′ in mice. Cancer Res. 1986;46(8):3969–78. [PubMed] [Google Scholar]
- 4.Baxter LT, et al. Physiologically based pharmacokinetic model for specific and nonspecific monoclonal antibodies and fragments in normal tissues and human tumor xenografts in nude mice. Cancer Res. 1994;54(6):1517–28. [PubMed] [Google Scholar]
- 5.Baxter LT, Zhu H, Mackensen DG, Butler WF, Jain RK. Biodistribution of monoclonal antibodies: scale-up from mouse to human using a physiologically based pharmacokinetic model. Cancer Res. 1995;55(20):12. [PubMed] [Google Scholar]
- 6.Rippe B, Haraldsson B. Transport of macromolecules across microvascular walls: the two-pore theory. Physiol Rev. 1994;74(1):163–219. doi: 10.1152/physrev.1994.74.1.163. [DOI] [PubMed] [Google Scholar]
- 7.Ferl GZ, Wu AM, DiStefano JJ., 3rd A predictive model of therapeutic monoclonal antibody dynamics and regulation by the neonatal Fc receptor (FcRn) Ann Biomed Eng. 2005;33(11):1640–52. doi: 10.1007/s10439-005-7410-3. [DOI] [PubMed] [Google Scholar]
- 8.Garg A, Balthasar JP. Physiologically-based pharmacokinetic (PBPK) model to predict IgG tissue kinetics in wild-type and FcRn-knockout mice. J Pharmacokinet Pharmacodyn. 2007;34(5):687–709. doi: 10.1007/s10928-007-9065-1. [DOI] [PubMed] [Google Scholar]
- 9.Ghetie V, Ward ES. FcRn: the MHC class I-related receptor that is more than an IgG transporter. Immunol Today. 1997;18(12):592–8. doi: 10.1016/S0167-5699(97)01172-9. [DOI] [PubMed] [Google Scholar]
- 10.Urva SR, Yang VC, Balthasar JP. Physiologically based pharmacokinetic model for T84.66: a monoclonal anti-CEA antibody. J Pharm Sci. 2010;99(3):1582–600. doi: 10.1002/jps.21918. [DOI] [PubMed] [Google Scholar]
- 11.Shah DK, Betts AM. Towards a platform PBPK model to characterize the plasma and tissue disposition of monoclonal antibodies in preclinical species and human. J Pharmacokinet Pharmacodyn. 2012;39(1):67–86. doi: 10.1007/s10928-011-9232-2. [DOI] [PubMed] [Google Scholar]
- 12.Cao Y, Jusko WJ. Applications of minimal physiologically-based pharmacokinetic models. J Pharmacokinet Pharmacodyn. 2012;39(6):711–23. doi: 10.1007/s10928-012-9280-2. [DOI] [PMC free article] [PubMed] [Google Scholar]
- 13.Gallo JM, et al. Pharmacokinetic model-predicted anticancer drug concentrations in human tumors. Clin Cancer Res. 2004;10(23):8048–58. doi: 10.1158/1078-0432.CCR-04-0822. [DOI] [PubMed] [Google Scholar]
- 14.Rocci ML, Jr, et al. Prednisolone metabolism and excretion in the isolated perfused rat kidney. Drug Metab Dispos. 1981;9(3):177–82. [PubMed] [Google Scholar]
- 15.Fronton L, Pilari S, Huisinga W. Monoclonal antibody disposition: a simplified PBPK model and its implications for the derivation and interpretation of classical compartment models. J Pharmacokinet Pharmacodyn. 2014;41(2):87–107. doi: 10.1007/s10928-014-9349-1. [DOI] [PubMed] [Google Scholar]
- 16.Cao Y, Balthasar JP, Jusko WJ. Second-generation minimal physiologically-based pharmacokinetic model for monoclonal antibodies. J Pharmacokinet Pharmacodyn. 2013;40(5):597–607. doi: 10.1007/s10928-013-9332-2. [DOI] [PMC free article] [PubMed] [Google Scholar]
- 17.Jamei M, Dickinson GL, Rostami-Hodjegan A. A framework for assessing inter-individual variability in pharmacokinetics using virtual human populations and integrating general knowledge of physical chemistry, biology, anatomy, physiology and genetics: a tale of ‘bottom-up’ vs ‘top-down’ recognition of covariates. Drug Metab Pharmacokinet. 2009;24(1):53–75. doi: 10.2133/dmpk.24.53. [DOI] [PubMed] [Google Scholar]
- 18.Jamei M, et al. The Simcyp population-based ADME simulator. Expert Opin Drug Metab Toxicol. 2009;5(2):211–23. doi: 10.1517/17425250802691074. [DOI] [PubMed] [Google Scholar]
- 19.Waldmann TA, Strober W. Metabolism of immunoglobulins. Prog Allergy. 1969;13:1–110. doi: 10.1159/000385919. [DOI] [PubMed] [Google Scholar]
- 20.Waldmann TA, Terry WD. Familial hypercatabolic hypoproteinemia. A disorder of endogenous catabolism of albumin and immunoglobulin. J Clin Invest. 1990;86(6):2093–8. doi: 10.1172/JCI114947. [DOI] [PMC free article] [PubMed] [Google Scholar]
- 21.Rostami-Hodjegan A. Physiologically based pharmacokinetics joined with in vitro-in vivo extrapolation of ADME: a marriage under the arch of systems pharmacology. Clin Pharmacol Ther. 2012;92(1):50–61. doi: 10.1038/clpt.2012.65. [DOI] [PubMed] [Google Scholar]
- 22.Weisman MH, et al. Efficacy, pharmacokinetic, and safety assessment of adalimumab, a fully human anti-tumor necrosis factor-alpha monoclonal antibody, in adults with rheumatoid arthritis receiving concomitant methotrexate: a pilot study. Clin Ther. 2003;25(6):1700–21. doi: 10.1016/S0149-2918(03)80164-9. [DOI] [PubMed] [Google Scholar]
- 23.den Broeder A, et al. A single dose, placebo controlled study of the fully human anti-tumor necrosis factor-alpha antibody adalimumab (D2E7) in patients with rheumatoid arthritis. J Rheumatol. 2002;29(11):2288–98. [PubMed] [Google Scholar]
- 24.Luu KT, et al. A model-based approach to predicting the human pharmacokinetics of a monoclonal antibody exhibiting target-mediated drug disposition. J Pharmacol Exp Ther. 2012;341(3):702–8. doi: 10.1124/jpet.112.191999. [DOI] [PubMed] [Google Scholar]
- 25.Suzuki T, et al. Importance of neonatal FcR in regulating the serum half-life of therapeutic proteins containing the Fc domain of human IgG1: a comparative study of the affinity of monoclonal antibodies and Fc-fusion proteins to human neonatal FcR. J Immunol. 2010;184(4):1968–76. doi: 10.4049/jimmunol.0903296. [DOI] [PubMed] [Google Scholar]
- 26.Kaymakcalan Z, et al. Comparisons of affinities, avidities, and complement activation of adalimumab, infliximab, and etanercept in binding to soluble and membrane tumor necrosis factor. Clin Immunol. 2009;131(2):308–16. doi: 10.1016/j.clim.2009.01.002. [DOI] [PubMed] [Google Scholar]
- 27.Olszewski WL, et al. Lymph draining from foot joints in rheumatoid arthritis provides insight into local cytokine and chemokine production and transport to lymph nodes. Arthritis Rheum. 2001;44(3):541–9. doi: 10.1002/1529-0131(200103)44:3<541::AID-ANR102>3.0.CO;2-6. [DOI] [PubMed] [Google Scholar]
- 28.Stepensky D. Local versus systemic anti-tumour necrosis factor-alpha effects of adalimumab in rheumatoid arthritis: pharmacokinetic modelling analysis of interaction between a soluble target and a drug. Clin Pharmacokinet. 2012;51(7):443–55. doi: 10.2165/11599970-000000000-00000. [DOI] [PubMed] [Google Scholar]
- 29.Li L, et al. Incorporating target shedding into a minimal PBPK-TMDD model for monoclonal antibodies. CPT Pharmacometrics Syst Pharmacol. 2014;3:e96. doi: 10.1038/psp.2013.73. [DOI] [PMC free article] [PubMed] [Google Scholar]
- 30.Mager DE, Jusko WJ. General pharmacokinetic model for drugs exhibiting target-mediated drug disposition. J Pharmacokinet Pharmacodyn. 2001;28(6):507–32. doi: 10.1023/A:1014414520282. [DOI] [PubMed] [Google Scholar]
- 31.Granger DN, Taylor AE. Permeability of intestinal capillaries to endogenous macromolecules. Am J Physiol. 1980;238(4):H457–64. doi: 10.1152/ajpheart.1980.238.4.H457. [DOI] [PubMed] [Google Scholar]
- 32.Stehle G, et al. Plasma protein (albumin) catabolism by the tumor itself–implications for tumor metabolism and the genesis of cachexia. Crit Rev Oncol Hematol. 1997;26(2):77–100. doi: 10.1016/S1040-8428(97)00015-2. [DOI] [PubMed] [Google Scholar]
- 33.Logan R, Kong A, Krise JP. Evaluating the roles of autophagy and lysosomal trafficking defects in intracellular distribution-based drug-drug interactions involving lysosomes. J Pharm Sci. 2013;102(11):4173–80. doi: 10.1002/jps.23706. [DOI] [PubMed] [Google Scholar]
- 34.Bain PG, et al. Effects of intravenous immunoglobulin on muscle weakness and calcium-channel autoantibodies in the Lambert-Eaton myasthenic syndrome. Neurology. 1996;47(3):678–83. doi: 10.1212/WNL.47.3.678. [DOI] [PubMed] [Google Scholar]
- 35.Nestorov IA, et al. Lumping of whole-body physiologically based pharmacokinetic models. J Pharmacokinet Biopharm. 1998;26(1):21–46. doi: 10.1023/A:1023272707390. [DOI] [PubMed] [Google Scholar]
- 36.Pilari S, Huisinga W. Lumping of physiologically-based pharmacokinetic models and a mechanistic derivation of classical compartmental models. J Pharmacokinet Pharmacodyn. 2010;37(4):365–405. doi: 10.1007/s10928-010-9165-1. [DOI] [PubMed] [Google Scholar]
- 37.Richter W et al. Mechanistic determinants of biotherapeutics absorption following SC administration. AAPS J. 2012;14(3):559–570. [DOI] [PMC free article] [PubMed]
- 38.Shah DK, Betts AM. Antibody biodistribution coefficients: inferring tissue concentrations of monoclonal antibodies based on the plasma concentrations in several preclinical species and human. MAbs. 2013;5(2). [DOI] [PMC free article] [PubMed]
- 39.Brian Gurbaxani MD, Gardner IB. Are endosomal trafficking parameters better targets for improving mAb pharmacokinetics than FcRn binding affinity? Mol Immunol. 2013;56(4):660–74. doi: 10.1016/j.molimm.2013.05.008. [DOI] [PubMed] [Google Scholar]
- 40.Haigler HT, McKanna JA, Cohen S. Rapid stimulation of pinocytosis in human carcinoma cells A-431 by epidermal growth factor. J Cell Biol. 1979;83(1):82–90. doi: 10.1083/jcb.83.1.82. [DOI] [PMC free article] [PubMed] [Google Scholar]
- 41.Chen Y, Balthasar JP. Evaluation of a catenary PBPK model for predicting the in vivo disposition of mAbs engineered for high-affinity binding to FcRn. AAPS J. 2012;14(4):850–9. doi: 10.1208/s12248-012-9395-9. [DOI] [PMC free article] [PubMed] [Google Scholar]
- 42.Garg A. Investigation of the role of FcRn in the absorption, distribution, and elimination of monoclonal antibodies. In Department of Pharmaceutical Sciences. 2007. PhD. Faculty of the Graduate School of State University of New York at Buffalo.
- 43.Chen N, Wang W, Faulty S, Fang Y, Lu P, Hamuro L, Hussain A, Prueksaritanant T. The impact of FcRn on tissue distribution of IgG1 in mice. In: AAPS, San 902 Diego, CA, USA; 2012.
- 44.Bitonti AJ, et al. Pulmonary delivery of an erythropoietin Fc fusion protein in non-human primates through an immunoglobulin transport pathway. Proc Natl Acad Sci U S A. 2004;101(26):9763–8. doi: 10.1073/pnas.0403235101. [DOI] [PMC free article] [PubMed] [Google Scholar]
- 45.Dall’Acqua WF, et al. Increasing the affinity of a human IgG1 for the neonatal Fc receptor: biological consequences. J Immunol. 2002;169(9):5171–80. doi: 10.4049/jimmunol.169.9.5171. [DOI] [PubMed] [Google Scholar]
- 46.Vegh A, et al. FcRn overexpression in transgenic mice results in augmented APC activity and robust immune response with increased diversity of induced antibodies. PLoS One. 2012;7(4):e36286. doi: 10.1371/journal.pone.0036286. [DOI] [PMC free article] [PubMed] [Google Scholar]
- 47.Morell A, Terry WD, Waldmann TA. Metabolic properties of IgG subclasses in man. J Clin Invest. 1970;49(4):673–80. doi: 10.1172/JCI106279. [DOI] [PMC free article] [PubMed] [Google Scholar]
- 48.Guyton AC. Textbook of medical physiology. 11. New York: Elsevier; 2006. [Google Scholar]
Associated Data
This section collects any data citations, data availability statements, or supplementary materials included in this article.
Supplementary Materials
(PDF 285 kb)