

Abstract
Motivation: Identifying altered pathways in an individual is important for understanding disease mechanisms and for the future application of custom therapeutic decisions. Existing pathway analysis techniques are mainly focused on discovering altered pathways between normal and cancer groups and are not suitable for identifying the pathway aberrance that may occur in an individual sample. A simple way to identify individual’s pathway aberrance is to compare normal and tumor data from the same individual. However, the matched normal data from the same individual are often unavailable in clinical situation. Therefore, we suggest a new approach for the personalized identification of altered pathways, making special use of accumulated normal data in cases when a patient’s matched normal data are unavailable. The philosophy behind our method is to quantify the aberrance of an individual sample's pathway by comparing it with accumulated normal samples. We propose and examine personalized extensions of pathway statistics, overrepresentation analysis and functional class scoring, to generate individualized pathway aberrance score.
Results: Collected microarray data of normal tissue of lung and colon mucosa are served as reference to investigate a number of cancer individuals of lung adenocarcinoma (LUAD) and colon cancer, respectively. Our method concurrently captures known facts of cancer survival pathways and identifies the pathway aberrances that represent cancer differentiation status and survival. It also provides more improved validation rate of survival-related pathways than when a single cancer sample is interpreted in the context of cancer-only cohort. In addition, our method is useful in classifying unknown samples into cancer or normal groups. Particularly, we identified ‘amino acid synthesis and interconversion’ pathway is a good indicator of LUAD (Area Under the Curve (AUC) 0.982 at independent validation). Clinical importance of the method is providing pathway interpretation of single cancer, even though its matched normal data are unavailable.
Availability and implementation: The method was implemented using the R software, available at our Web site: http://bibs.snu.ac.kr/ipas.
Contact: tspark@stat.snu.ac.kr or namhuh@samsung.com
Supplementary information: Supplementary data are available at Bioinformatics online.
1 INTRODUCTION
Cancer arises from normal cells and can evolve to become malignant, metastatic and/or resistant to therapy. The analysis of altered pathways in an individual cancer patient may help to understand the disease status and suggest customized anticancer therapies.
It is straightforward to compare the molecular profile of an individual’s tumor and normal cells to discover molecular aberrances specific to his/her cancer. However, it may not be feasible in the current clinical practice environment to perform a metastatic tumor biopsy at the time of treatment resistance in patients with advanced cancer (Dancey et al., 2012). A case study of custom-tailored medicine based on an individual’s genome and transcriptome highlights this limitation (Jones et al., 2010). A patient’s tumor had metastasized to the lung after surgery at the primary site. A biopsy from his lung tumor was analyzed by mutation and transcription profiling; however, the patient’s normal lung tissue was not biopsied. Because there was no matched normal tissue, messenger RNA (mRNA) expression in the patient’s own blood and information collected from various normal tissues were used to identify differentially expressed genes (DEGs). The results of pathway analysis based on DEGs, integrated copy number variation and mutation information led the doctor to change the patient’s drug treatment, and the disease was stabilized for 3 months.
Although the personalized interpretation of pathways can be demanding, most current pathway analyses have been developed to investigate deregulated pathways between two phenotype groups. Khatri et al. (2012) classified these methods into three types: overrepresentation analysis (ORA), functional class scoring (FCS) and a pathway topology (PT)-based approach.
ORA approaches typically apply an arbitrary threshold value (e.g., fold change >2 or P < 0.05) on gene expression to assess whether the number of genes beyond threshold are significantly over- or underrepresented in the given pathway. There are two drawbacks to ORA. First, it uses only the most significant genes and discards others, thus resulting in information loss for marginally significant genes (Breitling et al., 2004). Second, it considers only the number of genes and does not consider the magnitude of expression changes, leading to information loss regarding the importance of genes (e.g. a gene with a fold change of 2.01 and a gene with a fold change of 4 are considered equally). Unlike ORA, FCS methods do not discard genes with an arbitrary threshold but use all available genes, which is an improvement over ORA (Tian et al., 2005). PT methods are essentially based on FCS methods with the addition that they consider network topology information. They compensate for the common limitation of ORA and FCS in reporting false-positive gene sets due to sets of overlapping genes. In our article, we focus on ORA and FCS methods, extending and implementing each for personalized pathway analysis.
There are two exceptional studies examining individualized pathway analysis (Drier et al., 2013; Vaske et al., 2010). PARADIGM is a tool that infers a pathway status by using known functional structures. The method models the functional structure of pathway as a set of interconnected variables, where the variables are omic objects such as DNA, mRNA and protein, where the interaction between variables describes the functional status of a pathway. PARADIGM may perform better with multiple omics, as it uses known functional relationships between a gene or inter-gene DNA and protein. Hence, it might not perform well with single layer omic data, such as from mRNA microarrays.
Drier et al. (2013) proposed a personal pathway deregulation score (PDS), which represents the distance of a single cancer sample from the median of normal samples on the principal curve. To calculate PDS, they reduced the dimensions by principal component analysis and found the best principal curve, using entire cohort samples containing both normal and/or different stages of cancers. Drier’s method performs better than PARADIGM in the mRNA only datasets of brain and colon cancers. Calculating PDS requires data dependent preprocessing steps, including selecting the number of principal components to be used and filtering out noisy gene data to obtain optimized principal curves. PDS fully uses whole cohort data to interpret an individual’s pathway, which can be a drawback in that it requires a number of cohort data to extract principal curve to interpret a single patient data. It has a limitation to interpret a single sample such as a patient’s recurrent tumor that is not accompanied with cohort dataset to extract the principal curve.
Our proposed method is based on the comparison of one cancer sample with many accumulated normal samples (we use ‘nRef’ to refer to the accumulated normal samples) that is different from the previous studies in following sense. The proposed method is suitable to adopt single-layer omics data and expendable to interpret a patient in the context of many published or user-defined pathway gene sets. PARADIGM has less freedom in terms of data and gene sets, as it prefers multi-layered omics data and requires predefined functional structure among omics objects. Unlike PDS, which extracts the principal curve from entire cohort data, our method does not assume an individual sample belongs to a cohort. We introduce using accumulated normal tissue data as a reference. This is a simple and biologically intuitive guideline in such a case to interpret a single sample that lack cohort data.
Our method provides a series of analysis steps, which consists of four parts: data processing, gene-level statistics, individualized pathway aberrance score (iPAS) and a significance test. To discover the most feasible method for iPAS, we extend existing pathway analysis techniques, namely, ORA and FCS, to properly reflect the nature of testing one cancer to many normal samples.
To demonstrate that iPAS captures biologically and clinically relevant information in a sensible, valid and useful manner, we apply it to samples of lung and colon adenocarcinoma. We show that our representation generates clinically relevant stratifications and outcome predictors, which would not have been achieved when the same data are analyzed by the conventional method that does not use accumulated normal data.
Our empirical study suggests two different strategies, depending on the biological question that iPAS is focused on. In the case of cancer diagnosis, a method that uses the inter-gene correlation structure of the accumulated normal samples performs best. In the case of cancer prognosis, a simple averaging of all member genes’ standardized gene expression values performs best.
2 METHODS AND MATERIALS
2.1 Gene expression data
We built nRef by the manual curation of data obtained from NCBI GEO (Barrett et al., 2012). Microarray data of adjacent normal tissues obtained from patients undergoing surgery were selected to serve as the nRef. Data from biopsied samples, primary cultures of normal tissues and post-mortem donors were not included in the nRef. We collected 120 nRef for lung, 60 from GSE19804 (Lu et al., 2011), 27 from GSE7670 (Su et al., 2007) and 33 from GSE10072 (Landi et al., 2008). Samples came from individuals with variable smoking histories and different ethnic backgrounds. We collected 101 nRef’ for colon, concentrating on normal mucosa tissue samples from six datasets available at GEO. To evaluate the effectiveness of our method in survival analysis, we used Beer’s data of 442 lung adenocarcinomas (LUADs) (Beer et al., 2002) to discover survival-related pathways and validated the associations of 61 LUAD samples of GSE8894 (Lee et al., 2008). The pathway based identification of LUAD were tested on 120 cancers and 120 normal samples of GSE19804, GSE7670 and GSE10071. Further validation was conducted with 48 cancers and 35 normal samples collected from GSE19188 (Hou et al., 2010) and GSE31547. For patient stratification by colon cancer differentiation status, we used 566 microarrays of GSE39582 (Marisa et al., 2013), which provided in a separate manner, 443 for discovery, 123 for validation. GSE17536 (Smith et al., 2010) was also used for validation.
2.2 Pathway data
Information from gene sets representing biological pathways were obtained from REACTOME (Croft et al., 2011), which are also provided in the Molecular Signature Database (Subramanian et al., 2005). Pathways with small number of genes are more easily understood by human experts. We decided to filter out pathways of which gene set size is >97. The cutoff covers at least 80% of contents of each public pathway resources. Of 674 pathways in REACTOME, 583 pathways (86.7%) remained after filtering by the gene set size.
2.3 Individualized analysis using the nRef
The aim of our approach is to identify altered pathways in an individual by making use of the nRef. A schematic diagram of our method of individualized pathway analysis is described in Figure 1, and the following sections describe each step.
Fig. 1.
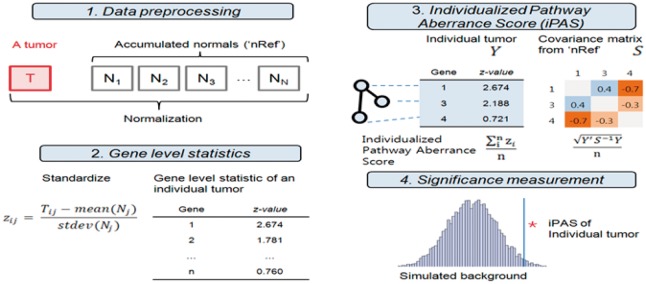
Schematic description of individualized pathway analysis using accumulated normal data (nRef). An individual’s tumor data are normalized with the nRef. Gene expression is standardized by mean and SD of the nRef. The iPAS is calculated from standardized gene expression values in the pathway. Null distribution calculated from the nRef provides significance
2.3.1 Data preprocessing and gene-level statistics
Expression level was defined by using the robust multichip average (Irizarry et al., 2003). For datasets using different microarrays, only those with probes in common from Affymetrix U133A to Affymetrix U133Plus 2.0 were used for further analysis. For individual tumor cases, we performed quantile normalization (Bolstad et al., 2003) after combining the single tumor microarray with all nRef samples. In cases of genes with multiple probes, gene expression level was summarized by averaging probe-level expression. Individual tumor sample gene expression was standardized using the mean and standard deviation of the reference.
2.3.2 Pathway-level statistics and significance test
We introduce five methods as candidates for iPAS. Each method is a modification of existing pathway analysis techniques, enabling us to test an individual tumor sample’s pathway aberrance by using the nRef. A summary is provided in Table 1.
Table 1.
Modification of existing pathway analysis methods for iPAS
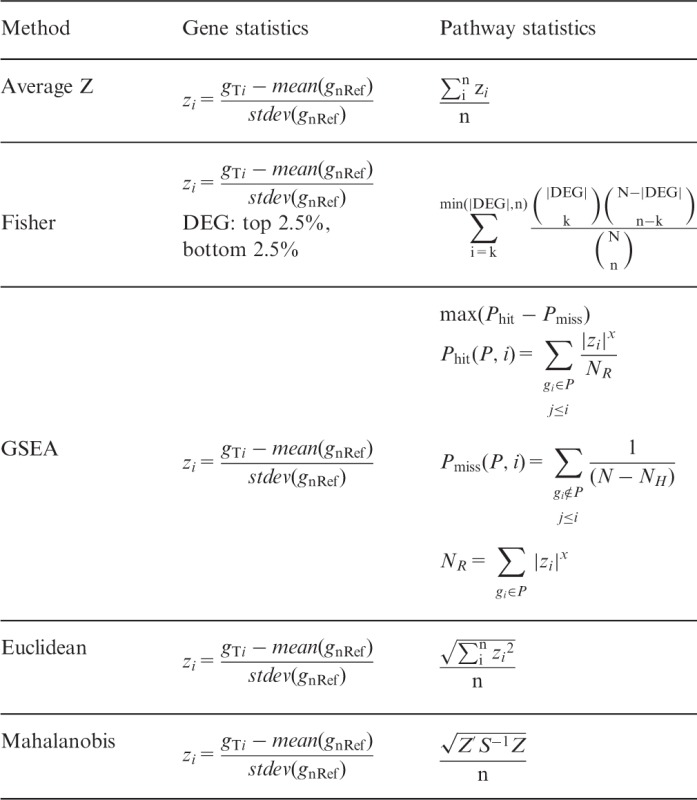 |
Note. Significance can be obtained against the null distribution generated from normal samples. All the collected normal samples for the nRef are one by one compared with the nRef to yield statistics of the null distribution. A statistic from a single cancer case is compared with this null distribution to yield P-value.
Average Z
Standardizing the gene expression by mean and standard deviation from datasets is often used in microarray analysis. A vector Z = (z1, z2, … , zn) denotes the expression status of a pathway where zi symbolizes the standardized expression value of i-th gene, where the number of genes belonging to the pathway is n. In typical settings, standardization is performed using the mean and SD of a given dataset, mostly the cancer-only cohort data, thus /n indicates how much the given sample’s overall pathway gene expression deviates from the center of the cancer samples. We made the simple modification, Z’ = (z1’, z2’, … , zn), where zi’ is derived from mean and SD of the nRef. In this case, /n gives the samples deviation from the nRef. We believe this modification is biologically valid because every cancer starts its malignancy from normal cell. Thus, the clinical characteristics of a single cancer can be captured by measuring the difference of it against common characteristic of normal cells, which is represented by the nRef in our study.
Fisher exact test
We generated a 2 × 2 contingency table for a given pathway (S) and DEGs (D) for the test. For individualized interpretation, we define D by the ranking of z-value, which is standardized gene expression for the mean and SD of the nRef. For each individual sample, 5% (highest 2.5% and lowest 2.5%) of the total genes are defined as D. We applied a two-tailed test to detect alteration of pathways due to enrichment or depletion of differential genes. The result of this statistic can be interpreted as how many DEGs are enriched in the given pathway, where the expression difference refers to how much a patient’s gene expression deviates from the nRef.
Gene set enrichment analysis
We adopted the original version of gene set enrichment analysis (GSEA) proposed by Subramanian et al. (2005). Typically, inputs for GSEA are generated by testing whole cohort samples using phenotype label; t-statistic, correlation coefficients and fold changes are usually used. In the personalized analysis setting, we use the z-value as an input for the GSEA algorithm, which is standardized gene expression by mean and SD of the nRef. The GSEA output enrichment score reflects the degree to which a gene set in the pathway is overrepresented at the extremes (low or high) of the entire ranked list of z-values from a single patient.
Non-parametric quadratic test
Gene expression in a pathway of a tumor sample is represented by vector Z = (z1, z2, … , zn), where zi is standardized expression level of i-th gene by mean and SD of the nRef, where n is the number of genes belonged to the pathway. A pathway characteristic of an individual patient’s pathway can be represented by the averaged Euclidean distance . This gives the distance of a single patient from the center of the nRef due to the square of standardized expression difference, and thus does not reflect increased or decreased expression, only the extent of the expression difference. Genes in the pathway are usually functionally correlated; therefore, use of the correlation structure of the normal samples may increase sensitivity enough to capture the aberrance of a single cancer case. We also consider the averaged Mahalanobis distance, which uses the covariance matrix calculated from the nRef. This value describes the statistical distance from the center of normal samples taking into account correlation among normal samples. The covariance matrix S is calculated for each pathway from the nRef.
3 RESULTS
3.1 Pathway-based identification and validation of cancer survival
To assess whether our method can sensitively detect pathway aberrances that are associated with a patient’s clinical outcome, a known survival pathway that showed strong association with patient survival from Beer’s data was tested. Bryant et al. (2010) reported that the ‘cell cycle stimulatory’ pathway of 51 genes is significantly associated with patient survival (Cox proportional hazards model, P = 0.000113). In that study, pathway gene expression was represented as an average of z-values, where the z-value indicates the standardized expression level, by the mean and SD, of all cancer samples. The high-risk group was defined as those in which pathway expressions were >0, and the pathway showed poor prognostic outcome. The association was significant with or without adjusted clinical covariates, and thus the pathway alone is a strong indicator of cancer prognosis. This finding was also validated in the Japanese LUAD cohort (n = 87, survival data are not provided to public) in Bryant’s study. As studies have shown a clear association between the cell cycle pathway and cancer, in terms of driving cancer proliferation, we considered this pathway as a pathway that should be detected. All of the methods proposed as candidates for iPAS showed significant associations of the ‘cell cycle stimulatory’ pathway from Beer’s data (Table 2). The same pathway analyzed using GSE8894 (n = 61) data yielded significant associations in all proposed methods with the marginal exception of Mahalanobis (P = 0.0549).
Table 2.
Survival analysis of ‘cell cycle stimulatory’ pathway reported by Bryant et al. (2010)
| Dataset | Pathway statistics | Coefficient | P-value |
|---|---|---|---|
| Beer (N = 432), Bryant et al., Overall survival | Average Za | 0.37 | 0.00011 |
| Beer (N = 442) Overall survival | Average Zb | 0.62 | 0.00003 |
| Fisher | 0.50 | 0.00068 | |
| GSEA | 0.65 | 0.00001 | |
| Euclidean | 0.65 | 0.00001 | |
| Mahalanobis | 0.67 | 0.00001 | |
| GSE8894 (N = 61) Recurrent free survival | Average Zb | 0.90 | 0.01163 |
| Fisher | 0.91 | 0.01076 | |
| GSEA | 0.78 | 0.02899 | |
| Euclidean | 0.87 | 0.01544 | |
| Mahalanobis | 0.68 | 0.05485 | |
aDerived from mean and SD of all cancer samples in the dataset, bDerived by mean and SD of the nRef.
Prognostic gene expression signatures for Stages II and III colon cancers have been reported in seven papers, yielding 207 genes in total (Bandres et al., 2007; Barrier et al., 2006, 2007; Eschrich et al., 2005; Kopetz and Abbruzzese, 2009; Lin et al., 2007; Wang et al., 2004). The genes are enriched in 32 REACTOME pathways (False Discovery Rate (FDR) < 0.05, pathway size < 96). We assumed the 32 pathways were valid as ground truth to be identified and analyzed in the colon cancer dataset GSE39585 (Stages II and III were only considered). Average Z provided best performer (sensitivity = 0.88) with 28 pathways deemed as significant. GSEA, Fisher, Euclidean and Mahalanobis gave the following values, 0.78, 0.66, 0.06 and 0.03, respectively.
These results satisfied us that our approach captures the fundamental knowledge of cancer, thus it is reasonably considered as iPAS.
To investigate which of the candidates for iPAS most robustly reflect phenotype association, we evaluated the proposed methods by determining whether survival-associated pathways are validated in datasets never used for discovery using LUAD and colon cancer [LUAD: Beer’s set n = 442 for discovery, GSE8894 (n = 61) GSE3141 (n = 58) for validation; colon cancer: GSE39582d (n = 443) for discovery, GSE39582v (n = 123) and GSE17536 (n = 109) for validation, logrank P < 0.05, comparing tumors in the top 50th percentile of aberrance scores to those in the bottom 50th percentile]. Validation rates varied depending on the dataset, and these were possibly affected by the small sample size compared with that of the discovery set. In these cases, we were not able to determine a superior method that outperformed the others. Average Z gave the highest validation rate in three of four dataset with validation rates of GSE8894 (43.6%, 92/211), GSE3141 (13.3%, 28/211) and GSE17536 (10.7%, 24/224). When validation rates from four datasets are averaged, Average Z gave the highest validation rate, (21.9%, Fig. 2, blue bars). Pathways validated as significantly associated with patient survival for each cancer are listed in the Supplementary Materials (Supplementary Tables S1 and S2).
Fig. 2.
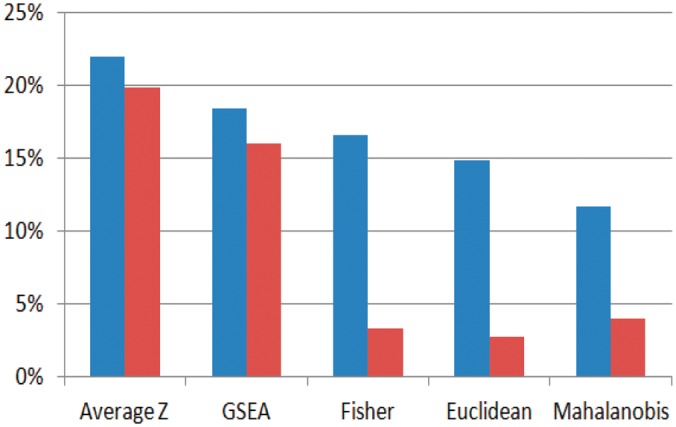
Averaged validation rate of discovered survival-related pathway at four datasets. Proposed approach using nRef (blue) versus conventional approach that standardizes individual sample by mean and SD of entire cohort dataset (red)
We also investigated the validation rate of iPAS candidates under the conditions where the same data are not standardized by the nRef but instead standardized by the mean and SD of the cohort dataset, which consists of only cancers (Fig. 2, red bars). It is noteworthy that use of the nRef increased the validation rate for every iPAS candidate investigated. This implies that the strategy of using accumulated normal samples as a reference is beneficial in terms of pathway-based survival analysis.
3.2 Identification of clinical importance
Cluster analysis of using Average Z as the iPAS method on Beer’s data identified 12 pathway clusters (denoted by 1∼12 in Fig. 3) and 3 sample clusters (S2∼S4; S1 is from the nRef; Fig. 3). Sample clusters S2 and S4 represent well the differentiation status of LUAD (Fisher exact test, P < 4.65 × 10⁻¹⁵). Well-differentiated adenocarcinoma resembles the normal glandular structure; therefore, it is a reasonable result that cluster S2 is close to the nRef. The survival outcome of S2 and S4 are significantly different (P < 0.0028), and this assures us that unbiased clustering-based iPAS has enough sensitivity to capture clinically important associations. This finding is concordant with prior knowledge that well-differentiated LUAD patients are likely to have better prognosis (Barletta et al., 2010). Pathway cluster P9 is distinguished as commonly upregulated in tumor samples. The pathways are transfer RNA aminoacylation, amino acid or purine synthesis, DNA elongation and the extension of telomeres.
Fig. 3.
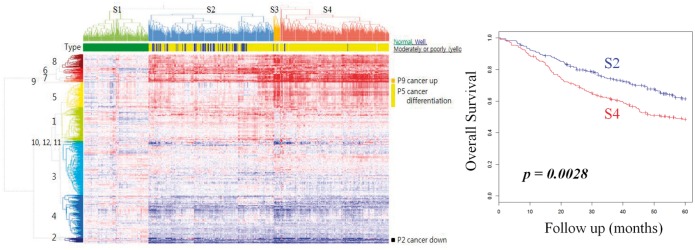
Clustered iPAS of LUAD dataset. Pathways (n = 583) and samples (n = 442) are clustered according to iPAS. Normal samples are clustered at left (S1). Tumors (S2∼S4) deviate from normal in both up- and downregulated directions (darker red and blue, respectively). Sample clusters are well-representing histopathological differentiation status (S2: for well-differentiated LUAD, P < 4.65 × 10⁻¹⁵) and overall survival
Unbiased pathway-based clustering of colon cancer data also captures clinically important associations by revealing sample clusters that are survival related (S2 and S3, P = 0.0037, Supplementary Fig. S1). It is important to note that iPAS is not only sensitive enough to identify clinically meaningful substructure of patients but also reveals common characteristics of a cancer at the same time. For example, pathways commonly up- or downregulated in all cancer samples, for example, P9 or P2, would have not been discovered if the analysis had been performed by a conventional approach that does not make use of ‘nRef’ (Supplementary Fig. S2).
3.3 Pathway-based identification of cancer
Cancer develops unique mechanisms for malignancy. Therefore, it is reasonable to believe that identifying the unique molecular aberrances of cancer will aid in cancer diagnosis. Our empirical study of iPAS-based clustering of LUAD revealed several pathways commonly up- or downregulated in all of the cancer samples. Further analysis was performed to determine whether iPAS could be successfully used in the accurate identification of cancer. We tested this in a simple unsupervised way by judging whether an unknown sample is significantly different against the nRef, as a tumor, if not as normal. We performed a 5-fold cross-validation one hundred times with the LUAD dataset, which consisted of 120 cancers and 120 normal samples. Microarray data from the normal samples was randomly divided into five groups, and four of the five served as the reference group. The remaining group was used as the true normal set for the test of pathway-based identification of cancer. To build true cancer set for the test, the same number of cancer sample was randomly picked. We considered 583 pathways in REACTOME, giving 293 500 (583 pathways × 5-fold × 100 repeats) AUCs and accuracy values. We averaged AUCs and accuracies from the five candidate methods for iPAS and used this as a representative AUC and accuracy of a given pathway.
By ranking the pathways by AUC, top pathways that marked averagely high performance by all iPAS candidates are listed (Supplementary Table S3). The ‘amino acid synthesis and interconversion and transamination’ pathway showed the highest classification performance. Unsurprisingly, this pathway was one of the commonly upregulated pathways in the analysis of the Beer’s data (Fig. 3, pathway cluster P9). Among the tested iPAS candidates for this pathway, Mahalanobis yielded the highest AUC (0.980), while Average Z gave 0.936, and Fisher’s exact test gave the lowest value (0.914). The standardized gene expression pattern for this pathway differed between tumor and normal. Many of the genes deviated from mean of the nRef, by more than two orders of sigma, contributing to its best performance out of all iPAS candidate methods, including ORA method like Fisher’s exact test (Fig. 4a).
Fig. 4.
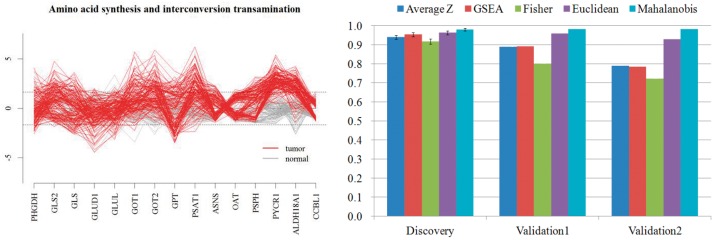
(a) Expression pattern of genes in the pathway. Each line represents sample. (gray: normal, red: tumor). Dashed line represents expression value deviated 1.96σ from the mean expression value of normal tissues. (b). Performance of classification of cancer by ‘amino acid synthesis and interconversion and transamination’. AUC of 0.980 has marked in discovery set (95% confidence interval provided as error bar), independent validation set results AUC of 0.982 (Validation 1: normal samples in validation set served as reference) and 0.982 (Validation 2: normal samples in discovery set served as reference)
We also analyzed the influence of using the subset of normal samples as nRef. We compared the pathway-based cancer identification results using the full set of normal samples (n = 120) against 100 different runs using 75% (n = 90), 50% (n = 60) of randomly chosen normal samples. Among the pathways that marked averagely high performance in the identification of cancer, the best and the second best pathways are considered, ‘amino acid synthesis and interconversion and transamination’ and ‘unwind of DNA’, respectively. The result shows little loss of performance, even though only a half of normal samples were used for the test (Fig. 5a and b).
Fig. 5.
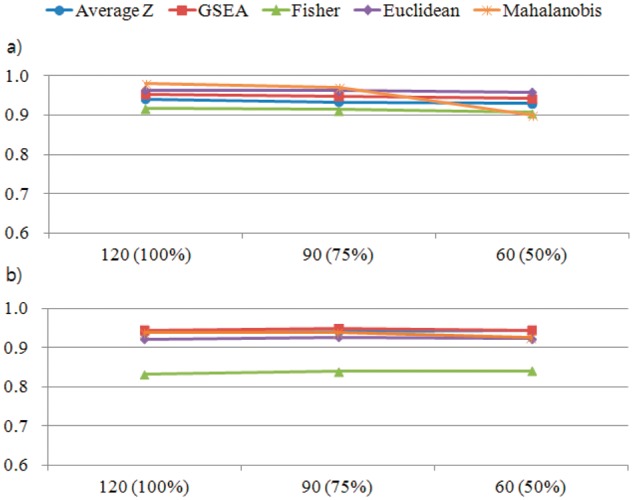
Performance of pathway-based identification of cancer (AUC) when only a subset of normal samples are served as nRef. (a) ‘amino acid synthesis and interconversion and transamination’ (b) ‘unwind of DNA’
3.4 Validation of the discovered pathway
The ‘amino acid synthesis and interconversion and transamination’ pathway consists of 17 genes involved in three major reactions, as it is described at REACTOME. The pathways are responsible for (i) synthesis of three amino acids (aspartate, asparagine, glutamate), (ii) the synthesis of glucose under fasting conditions by using carbon atoms from these four amino acids and (iii) conversion of amino acids to their corresponding alpha-keto acids, coupled to their conversion to glutamate, which is the first step in the catabolism of most amino acids.
This function makes sense in terms of the ‘glutamine addiction’ of cancer cells. The nutrients glucose and glutamine are specifically required by cancer cells as metabolites for growth and for production of adenosine triphosphate (Munoz-Pinedo et al., 2012). Myc and p53 have been revealed to be associated with this ‘addiction’ by upregulating glutamine synthesis in cancer cells. Thus, our finding is in accordance with prior knowledge regarding the upregulation of glutamine synthetase.
We further validated our findings with an independent set that were not used in the discovery set. We collected two more LUAD gene expression datasets with normal data at GEO (GSE19188, GSE31547). Aggregated datasets of 48 microarrays from tumor tissues and 35 microarrays from normal tissues were used for independent validation. The pathway was also altered in a cancer-specific way in a validation set yielding an AUC of 0.982 by Mahalanobis-based iPAS (Fig. 4b, Validation 1). We also assessed the same validation set in a different manner by using the nRef from the discovery set. Normal sample microarrays from the discovery sets (GSE10082, GSE7670, GSE10072) served as the nRef to classify samples in the independent validation set. The resulting AUC was 0.982 by the Mahalanobis method (Fig. 4b, Validation 2).
In our experiments using LUAD samples, the Mahalanobis distance, which used a pre-calculated covariance matrix from the ‘nRef,’ gave the best performance. The usage of covariance matrix empowers Mahalanobis to consider a cancer sample as an outlier, delivering higher accuracy in terms of pathway-based identification of cancer than other methods. One caution of using Mahalanobis method is that it requires a large number of normal samples to guarantee the estimation of covariance matrix. For a small sample size, a structured covariance matrix would be desirable to avoid the estimation issue.
The biological role of this identified pathway is to supply nutrients and energy to cancer cells. This may be the reason why this pathway is universally aberrant in all the LUAD samples we assessed. Our analysis of this pathway in other cancer types demonstrated less of a role for this pathway, suggesting that it is more LUAD specific. We believe that the common disruption of this pathway is a novel discovery, as this pathway, consisting of 17 genes, has not been reported as an indicator of LUAD in any of the studies we acquired datasets from (GSE10082, GSE7670, GSE10072), nor in a literature search with key words.
4 CONCLUSIONS
We have proposed personalized extensions to ORA- and FCS-based pathway analysis by introducing the concept of comparing an individual tumor with many normal samples. Exploratory analyses of our methods with previously published survival pathway signatures reproduced the correct survival outcomes. We have also demonstrated that using nRef improves the validation rate. Unbiased clustering with iPASs revealed sample clustering, which is indicative of the cancer differentiation status of LUAD and of different survival outcomes. Clustering also identifies pathway characteristics from patients displaying common up- or downregulations and subgroup-specific deregulations.
Pathways that are commonly deregulated across all cancer patients may be useful in identifying cancer from unknown samples. We explored the pathway-based identification of cancer with ‘amino acid synthesis and interconversion and transamination’ pathway, which is commonly upregulated in LUAD patients. Validation using independent datasets demonstrated that this pathway is useful in classifying LUAD and normal lung samples.
Based on our results, we conclude that individualized pathway scores using nRef can provide a sensitive measure of a patient’s clinical features and can be useful for identifying cancer.
In our empirical study, Average Z performed best in highlighting pathway aberrance and in further revealing clinical importance. It had the best statistical power when identifying a previously known survival-related pathway and the best averaged validation rate for LUAD and colon cancer. In the pathway-based identification of cancer, the Mahalanobis method performed best.
An important clinical aspect of our methods is that it enables the interpretation of a cancer case in a single patient, even if matched normal tissue data from the same individual are unavailable. Accumulated information of normal tissues from a data repository will take the place of data unavailable for a specific individual. As the data repository is growing rapidly, it is expected that more ‘nRef’ data will be available for many diseases in the near future. We hope that our proposed approach can help in the personalized interpretation of tumor data and can be a useful tool in the upcoming era of data-based personalized medicine.
Although we have shown our results in microarray platform, our method is applicable to different RNA expression platforms including next-generation sequencer. Our method is also supportive of various pathway resources such as KEGG, NCI cancer pathway and Biocarta provided in the gmt format. The R code for our methods, along with nRefs of LUAD and colon cancer used in our study, is available at http://bibs.snu.ac.kr/ipas.
Supplementary Material
ACKNOWLEDGEMENT
The authors thank Jaehoon Lee and Sungyoung Lee for discussion.
Funding: This work was supported by the National Research Foundation of Korea (NRF) grant (2012R1A3A2026438) and by the Bio & Medical Technology Development Program of the NRF grant (2013M3A9C4078158).
Conflict of interest: none declared.
REFERENCES
- Bandres E, et al. A gene signature of 8 genes could identify the risk of recurrence and progression in Dukes' B colon cancer patients. Oncol. Rep. 2007;17:1089–1094. [PubMed] [Google Scholar]
- Barletta JA, et al. Prognostic significance of grading in lung adenocarcinoma. Cancer. 2010;116:659–669. doi: 10.1002/cncr.24831. [DOI] [PMC free article] [PubMed] [Google Scholar]
- Barrett T, et al. NCBI GEO: archive for functional genomics data sets—update. Nucleic Acids Res. 2012;41:D991–D995. doi: 10.1093/nar/gks1193. [DOI] [PMC free article] [PubMed] [Google Scholar]
- Barrier A, et al. Stage II colon cancer prognosis prediction by tumor gene expression profiling. J. Clin. Oncol. 2006;24:4685–4691. doi: 10.1200/JCO.2005.05.0229. [DOI] [PubMed] [Google Scholar]
- Barrier A, et al. Prognosis of stage II colon cancer by non-neoplastic mucosa gene expression profiling. Oncogene. 2007;26:2642–2648. doi: 10.1038/sj.onc.1210060. [DOI] [PubMed] [Google Scholar]
- Beer DG, et al. Gene-expression profiles predict survival of patients with lung adenocarcinoma. Nat. Med. 2002;8:816–824. doi: 10.1038/nm733. [DOI] [PubMed] [Google Scholar]
- Bolstad BM, et al. A comparison of normalization methods for high density oligonucleotide array data based on variance and bias. Bioinformatics. 2003;19:185–193. doi: 10.1093/bioinformatics/19.2.185. [DOI] [PubMed] [Google Scholar]
- Breitling R, et al. Iterative Group Analysis (iGA): a simple tool to enhance sensitivity and facilitate interpretation of microarray experiments. BMC Bioinformatics. 2004;5:34. doi: 10.1186/1471-2105-5-34. [DOI] [PMC free article] [PubMed] [Google Scholar]
- Bryant CM, et al. Clinically relevant characterization of lung adenocarcinoma subtypes based on cellular pathways: an international validation study. PLoS One. 2010;5:e11712. doi: 10.1371/journal.pone.0011712. [DOI] [PMC free article] [PubMed] [Google Scholar]
- Croft D, et al. Reactome: a database of reactions, pathways and biological processes. Nucleic Acids Res. 2011;39:D691–D697. doi: 10.1093/nar/gkq1018. [DOI] [PMC free article] [PubMed] [Google Scholar]
- Dancey JE, et al. The genetic basis for cancer treatment decisions. Cell. 2012;148:409–420. doi: 10.1016/j.cell.2012.01.014. [DOI] [PubMed] [Google Scholar]
- Drier Y, et al. Pathway-based personalized analysis of cancer. Proc. Natl Acad. Sci. USA. 2013;110:6388–6393. doi: 10.1073/pnas.1219651110. [DOI] [PMC free article] [PubMed] [Google Scholar]
- Eschrich S, et al. Molecular staging for survival prediction of colorectal cancer patients. J. Clin. Oncol. 2005;23:3526–3535. doi: 10.1200/JCO.2005.00.695. [DOI] [PubMed] [Google Scholar]
- Hou J, et al. Gene expression-based classification of non-small cell lung carcinomas and survival prediction. PLoS One. 2010;5:e10312. doi: 10.1371/journal.pone.0010312. [DOI] [PMC free article] [PubMed] [Google Scholar]
- Irizarry RA, et al. Exploration, normalization, and summaries of high density oligonucleotide array probe level data. Biostatistics. 2003;4:249–264. doi: 10.1093/biostatistics/4.2.249. [DOI] [PubMed] [Google Scholar]
- Jones SJ, et al. Evolution of an adenocarcinoma in response to selection by targeted kinase inhibitors. Genome Biol. 2010;11:R82. doi: 10.1186/gb-2010-11-8-r82. [DOI] [PMC free article] [PubMed] [Google Scholar]
- Khatri P, et al. Ten years of pathway analysis: current approaches and outstanding challenges. PLoS Comput. Biol. 2012;8:e1002375. doi: 10.1371/journal.pcbi.1002375. [DOI] [PMC free article] [PubMed] [Google Scholar]
- Kopetz S, Abbruzzese JL. Barriers to integrating gene profiling for stage ii colon cancer. Clin. Cancer Res. 2009;15:7451–7452. doi: 10.1158/1078-0432.CCR-09-2523. [DOI] [PubMed] [Google Scholar]
- Landi MT, et al. Gene expression signature of cigarette smoking and its role in lung adenocarcinoma development and survival. PLoS One. 2008;3:e1651. doi: 10.1371/journal.pone.0001651. [DOI] [PMC free article] [PubMed] [Google Scholar]
- Lee ES, et al. Prediction of recurrence-free survival in postoperative non-small cell lung cancer patients by using an integrated model of clinical information and gene expression. Clin. Cancer Res. 2008;14:7397–7404. doi: 10.1158/1078-0432.CCR-07-4937. [DOI] [PubMed] [Google Scholar]
- Lin YH, et al. Multiple gene expression classifiers from different array platforms predict poor prognosis of colorectal cancer. Clin. Cancer Res. 2007;13:498–507. doi: 10.1158/1078-0432.CCR-05-2734. [DOI] [PubMed] [Google Scholar]
- Lu TP, et al. Integrated analyses of copy number variations and gene expression in lung adenocarcinoma. PLoS One. 2011;6:e24829. doi: 10.1371/journal.pone.0024829. [DOI] [PMC free article] [PubMed] [Google Scholar]
- Marisa L, et al. Gene expression classification of colon cancer into molecular subtypes: characterization, validation, and prognostic value. PLoS Med. 2013;10:e1001453. doi: 10.1371/journal.pmed.1001453. [DOI] [PMC free article] [PubMed] [Google Scholar]
- Munoz-Pinedo C, et al. Cancer metabolism: current perspectives and future directions. Cell Death Dis. 2012;3:e248. doi: 10.1038/cddis.2011.123. [DOI] [PMC free article] [PubMed] [Google Scholar]
- Smith JJ, et al. Experimentally derived metastasis gene expression profile predicts recurrence and death in patients with colon cancer. Gastroenterology. 2010;138:958–968. doi: 10.1053/j.gastro.2009.11.005. [DOI] [PMC free article] [PubMed] [Google Scholar]
- Su LJ, et al. Selection of DDX5 as a novel internal control for Q-RT-PCR from microarray data using a block bootstrap re-sampling scheme. BMC Genomics. 2007;8:140. doi: 10.1186/1471-2164-8-140. [DOI] [PMC free article] [PubMed] [Google Scholar]
- Subramanian A, et al. Gene set enrichment analysis: a knowledge-based approach for interpreting genome-wide expression profiles. Proc. Natl Acad. Sci. USA. 2005;102:15545–15550. doi: 10.1073/pnas.0506580102. [DOI] [PMC free article] [PubMed] [Google Scholar]
- Tian L, et al. Discovering statistically significant pathways in expression profiling studies. Proc. Natl Acad. Sci. USA. 2005;102:13544–13549. doi: 10.1073/pnas.0506577102. [DOI] [PMC free article] [PubMed] [Google Scholar]
- Vaske CJ, et al. Inference of patient-specific pathway activities from multi-dimensional cancer genomics data using PARADIGM. Bioinformatics. 2010;26:i237–i245. doi: 10.1093/bioinformatics/btq182. [DOI] [PMC free article] [PubMed] [Google Scholar]
- Wang Y, et al. Gene expression profiles and molecular markers to predict recurrence of Dukes' B colon cancer. J. Clin. Oncol. 2004;22:1564–1571. doi: 10.1200/JCO.2004.08.186. [DOI] [PubMed] [Google Scholar]
Associated Data
This section collects any data citations, data availability statements, or supplementary materials included in this article.