

Background: IRSp53 generates filopodia by coupling membrane protrusion with actin dynamics through SH3 domain binding partners.
Results: Dynamin1 interacts with IRSp53, and its GTPase and actin binding domains are required for filopodial formation.
Conclusion: Dynamin1 plays a role in filopodial initiation and assembly.
Significance: A novel role for dynamin1 in filopodial dynamics has implications for cell migration and wound healing.
Keywords: Actin, Cell Biology, Cell Migration, Fluorescence Resonance Energy Transfer (FRET), Imaging, IRSp53, TIRF, Dynamin, Filopodia
Abstract
Filopodia are dynamic actin-based structures that play roles in processes such as cell migration, wound healing, and axonal guidance. Cdc42 induces filopodial formation through IRSp53, an Inverse-Bin-Amphiphysins-Rvs (I-BAR) domain protein. Previous work from a number of laboratories has shown that IRSp53 generates filopodia by coupling membrane protrusion with actin dynamics through its Src homology 3 domain binding partners. Here, we show that dynamin1 (Dyn1), the large guanosine triphosphatase, is an interacting partner of IRSp53 through pulldown and Förster resonance energy transfer analysis, and we explore its role in filopodial formation. In neuroblastoma cells, Dyn1 localizes to filopodia, associated tip complexes, and the leading edge just behind the anti-capping protein mammalian enabled (Mena). Dyn1 knockdown reduces filopodial formation, which can be rescued by overexpressing wild-type Dyn1 but not the GTPase mutant Dyn1-K44A and the loss-of-function actin binding domain mutant Dyn1-K/E. Interestingly, dynasore, an inhibitor of Dyn GTPase, also reduced filopodial number and increased their lifetime. Using rapid time-lapse total internal reflection fluorescence microscopy, we show that Dyn1 and Mena localize to filopodia only during initiation and assembly. Dyn1 actin binding domain mutant inhibits filopodial formation, suggesting a role in actin elongation. In contrast, Eps8, an actin capping protein, is seen most strongly at filopodial tips during disassembly. Taken together, the results suggest IRSp53 partners with Dyn1, Mena, and Eps8 to regulate filopodial dynamics.
Introduction
Cell motility is driven by formation of filopodia and lamellipodia at the leading edge of cells. Filopodia are dynamic actin-based membrane protrusions that explore the environment and are thought to play roles in diverse cellular processes such as axon guidance, wound healing, and phagocytosis (1). Filopodia also play roles during development in such processes as dorsal closure in Drosophila embryogenesis (2). Over recent years, there has been increasing evidence demonstrating a link between morphogens/growth factors, filopodia, and cell fate decisions. For example, live imaging has revealed that sonic hedgehog uses filopodia for intercell communication during limb bud regeneration (3). In addition, evidence that filopodia play mechanical roles in development is also being reinforced (4). Thus, understanding the mechanisms for regulating filopodial dynamics becomes an important issue for developmental biology.
BAR2 superfamily proteins can generate different types of membrane curvature by oligomerizing following membrane attachment. BAR and most F-BAR domains sense and/or generate positive membrane curvature and hence induce plasma membrane invaginations (5). For example, incubation of BAR domains with liposomes led to tubule formation with diameter matching the curvature of the BAR domain crescent (6). However, the majority of I-BAR domains generate negative membrane curvature to induce plasma membrane protrusions. Uniquely, the I-BAR domain of Pinkbar generates flat membrane sheets (7, 8).
The insulin receptor tyrosine kinase substrate protein of 53 kDa (IRSp53) is the major Cdc42 effector that drives filopodial formation. Cdc42 binds to IRSp53 directly and is thought to induce filopodial formation by activating and localizing it to the membrane (2, 9). IRSp53 consists of an N-terminal I-BAR domain, a partial Cdc42/Rac interacting binding domain, Src homology 3 (SH3) domain, and a PDZ domain at the extreme C terminus. SH3 domains are protein-protein interaction sites that bind polyprolines. To date, the IRSp53 SH3 domain shows specificity for Wasp family verproline homologue (Wave) 1 and 2 (10), mammalian enabled (Mena) (9), neuronal Wiskott-Aldrich syndrome protein (N-WASP) (11), epidermal growth factor receptor pathway substrate 8 (Eps8) (12, 13), and mDia1 and mDia2 (14, 15). All of these IRSp53 SH3 domain partners have known roles in regulating actin dynamics. Wave1, -2, and N-WASP are activators of actin polymerization through the Arp2/3 complex (16, 17). Another Cdc42 effector, transducer of Cdc42-dependent actin assembly (Toca) protein 1, complexes with N-WASP and may be responsible for controlling N-WASP activity and the formation of short actin filaments (18, 19). Mena has actin anti-capping activity. Eps8 has actin capping and possibly F-actin bundling activity. mDia1 and -2 are thought to elongate actin filaments. The emerging view of filopodial formation through IRSp53 is that it couples membrane deformation through its I-BAR domain with actin dynamics through its SH3 domain. Thus, membrane deformation is a critical aspect of filopodial formation.
In mammals, there are three dynamins (Dyn), 1–3. Dyn1 is mainly expressed in the nervous system; Dyn2 is widely expressed, and Dyn3 is strongly expressed in testis but is also found in other tissues, including the nervous system (20). Dyn is a large 96-kDa GTPase involved in the process of endocytosis of clathrin-coated vesicles. Dyn functions in endocytosis by aiding in the cleavage of newly formed membrane vesicles through a scission activity (21). Dyn forms a spiral around the budding site, and through GTP-dependent protein conformational changes, it constricts the membrane until the membrane vesicle dissociates. During membrane vesicle budding, Dyn works with a variety of N- and F-BAR proteins such as amphiphysin (22) and FBP17 (23), respectively, which themselves couple to actin dynamics through SH3 domain interactions (24).
Using mass spectrometry analysis, the SH3 domain of IRSp53 was found to enrich significantly for Dyn1 from brain lysates (11). In this study, we show that IRSp53 interacts with Dyn1 using Förster resonance energy transfer (FRET) experiments. Moreover, we investigate the role of IRSp53-Dyn interaction in filopodial formation. Dyn1 knockdown inhibits filopodial formation. This reduction in filopodial number can be rescued with overexpression of wild-type Dyn1 but not with the GTPase mutant Dyn1-K44A as well as the loss-of-function actin binding domain (ABD) mutant Dyn1-K/E. The Dyn GTPase inhibitor dynasore also reduces filopodial numbers and has an effect on their lifetime. Dyn1 localizes to the filopodial shaft and a subset of tip complexes. Colocalization analysis suggests that Dyn lies just behind Mena at the leading edge and in tip complexes. Finally, we use rapid time-lapse total internal reflection fluorescence (TIRF) microscopy to investigate the temporal pattern of protein localization during filopodial assembly and disassembly. IRSp53 is present in both assembly and disassembly phases. Dyn1 and Mena have a strong preference for the assembly phase. Dyn1 dissociates from filopodia during elongation, whereas the majority of Mena dissociates at the beginning of disassembly. Eps8 has the opposite profile to Mena in that it appears most strongly during the disassembly phase. Taken together, the data suggest that the Cdc42 effector IRSp53 partners with Dyn1, Mena, and Eps8 to regulate filopodial dynamics.
EXPERIMENTAL PROCEDURES
Expression Constructs and Antibodies
pEGFP-N1-human Dyn1(aa) and EGFP-C1-human Dyn1(aa)PRD were the kind gifts from P. De Camilli (Yale University). pmCherry-N1-mouse Dyn1 was purchased from Addgene (27697). pQE-60-Dyn1 ABD mutants (i.e. Dyn1-E/K and -K/E) were the kind gifts from S. Sever (Harvard University). BamHI-HindIII fragments of the Dyn1 mutants were subcloned into the pEGFP-N1 vector between BglII and HindIII sites. pEGFP-N1-rat Dyn2(aa), pEGFP-N1-Dyn2(aa)K44A, pEGFP-N1-Dyn2(aa)ΔPRD, pEGFP-N1-rat Dyn3(aaa), and -(baa) were the kind gifts from M.A. McNiven (Mayo Clinic). HA-Dyn2 and HA-Dyn2K44A were obtained by subcloning Dyn2 and Dyn2K44A into the pXJ40-HA vector between HindIII and SmaI sites downstream of the HA sequence. EGFP-C1-IRSp53 was a kind gift from M. Masuda (National Cardiovascular Center Research Institute, Japan). mRFP-IRSp53 and IRSp53FP/AA were subcloned as described previously (11). GST-IRSp53 was obtained by subcloning IRSp53 from EGFP-C1-IRSp53 into pEBG-3X-HV vector (kind gifts from Haris Vikis and K.-L. Guan) between BamHI and NotI sites. pIRESpuro3-mCherry-Abp140p was a kind gift from Philippe Chavrier (CNRS, France). GFP-clathrin was provided by J. H. Keen. GFP-Rab5 was a generous gift from C. Bucci. All constructs were verified by sequencing.
The primary antibodies used in this study include the following: mouse monoclonal anti-Dyn1 (1:100 IF; 1:1000 WB, clone 4E67) and rabbit polyclonal anti-Dyn2 (1:200 IF; 1:1000 WB, NB300-617) from Novus Biologicals; mouse monoclonal anti-Dyn3 (1:100 IF, 1:1000 WB, clone 5H5, kind gift from P. De Camilli); mouse monoclonal anti-IRSp53 (1:100 IF, 1:1000 WB) (22); mouse monoclonal anti-HA (1:100 IF; 1:1000 WB, Millipore); mouse monoclonal anti-GFP (1:5000 WB, Santa Cruz Biotechnology); mouse monoclonal anti-GAPDH (1:500 WB, Chemicon); and mouse monoclonal anti-β-actin (1:10,000 WB, Sigma). The secondary antibodies used include the following: Alexa FluorTM 488 or 568 goat anti-mouse and goat anti-rabbit IgG (1:500 IF) from Molecular Probes (Invitrogen), and HRP-conjugated goat anti-mouse (1:10,000 WB, sc-2005) and goat anti-rabbit IgG (1:10,000 WB, sc-2004) from Santa Cruz Biotechnology.
Cell Culture, Transfection, and siRNA
N1E-115 neuroblastoma cells were cultured in Dulbecco's modified Eagle's medium (4500 mg/ml glucose) supplemented with 10% fetal bovine serum in a humidified 37 °C incubator with 5% CO2 (25). For transient expression of plasmids, N1E-115 cells were transfected 1 day after seeding using Lipofectamine 2000 (Invitrogen), as described previously (11), or JetPRIME (Polyplus transfection) according to the manufacturer's instructions.
High expression of Dyn-GFP gave rise to large protein aggregates with which IRSp53 colocalized, leading to a reduction of the IRSp53 phenotype. Hence, the level of Dyn-GFP expression was carefully controlled to ensure that its level did not exceed that of endogenous Dyn. The localization of Dyn-GFP and HA-Dyn in the cell was similar. Dyn-GFP was used for experiments that required live imaging and fluorescence techniques such as FRET, whereas HA-Dyn was used in biochemical and rescue experiments.
Pre-designed siRNA (Stealth RNAi, Invitrogen) were used for knockdown of Dyn1 (5′-AUCAGGUCCAACUUGGUGAUGACCC-3′ and 5′-AAGAAUUUGCGCUCUGCAGCCAAGG-3′), Dyn2 (5′-UAAUGUUGAGGGCCUCCUUCAGUGC-3′), and Dyn3 (5′-UUGUGAACCUGACUGCUCCUCUGCU-3′ and 5′-AUUAGCGUUAGAUUUAACACGUGGG-3′). These siRNAs were chosen on the basis of their specificity for endogenous mouse Dyn. Stealth RNAi negative control duplex (catalogue no. 12935-300, Invitrogen) at 10 nm was used as a nonsilencing control. siRNA at 10 nm were introduced into N1E-115 on the day of seeding by HiPerFect transfection reagent (Qiagen, Valencia, CA). Cells were harvested 24, 48, and 72 h after transfection to monitor Dyn levels by RT-PCR and Western blot (WB). Optimal knockdown of Dyn1 was achieved after 48 h in N1E-115 cells. For Dyn2 and -3, siRNA transfection was performed twice 24 h apart and assayed at 72 h. siGLO transfection indicator (Dharmacon, Lafayette, CO) was transfected alongside the siRNA to estimate transfection efficiency. This was determined by the percentage of cells that harbored fluorescent tagged-siRNA under a wide field microscope. Quantity One® analysis software (Bio-Rad) was used to calculate percentage knockdown, in which the protein target was normalized to β-actin or glyceraldehyde-3-phosphate dehydrogenase (GAPDH). Rescue experiments were performed by transfecting human Dyn1-GFP or rat Dyn2- or 3-GFP at 24 and 48 h after siRNA addition, respectively.
Immunofluorescence
N1E-115 cells, grown on glass coverslips pre-coated with 10 μg/ml laminin (Invitrogen), were fixed with 3.7% paraformaldehyde in PBS containing 1 mm CaCl2 and 2 mm MgCl2 for 20 min and extracted with 0.2% Triton X-100 for 5 min. After blocking with 5% bovine serum albumin (w/v) (Sigma) in PBS for 30 min, cells were incubated with primary antibodies in blocking buffer for 1 h, or overnight in a humidified chamber at 4 °C, and washed three times with PBS, each for 5 min. This was followed by incubation with fluorescent-tagged secondary antibodies in blocking buffer for 1 h and washing with PBS. For visualization of filopodia, F-actin was labeled with 5 units/ml of phalloidin (Alexa Fluor 488 or 647, Molecular Probes) in blocking buffer for 30 min in the dark. Finally, cells on coverslips were mounted onto glass slides with Hydromount (National Diagnostics). All steps were carried out at room temperature unless otherwise specified. Slides were imaged using an inverted confocal laser scanning microscope (Olympus FluoView (FV1000), Japan). Multichannel images were acquired with sequential scanning. To visualize punctate structures, images were acquired under a Kalman filter with averaging from three scans to increase signal to noise ratio.
GST Pulldown
N1E-115 cells on a 10-cm culture dish were transfected with HA-Dyn1 and GST-IRSp53 or GST alone in pEBG-3X-HV vector at 60% confluency. They were washed the next day with PBS and lysed in IP buffer (20 mm Tris, pH 7.5, 137 mm NaCl, 5 mm MgCl2, 2 mm CaCl2, 10% glycerol, 1% Nonidet P-40) containing protease inhibitor mixture (Roche Applied Science) for 20 min on ice. The whole cell lysate was centrifuged at 14,000 rpm for 15 min at 4 °C, followed by GST pulldown using glutathione-Sepharose beads (Amersham Biosciences) at 4 °C overnight. The pulldown was subjected to SDS-PAGE and WB with antibodies against GST, HA, Dyn1 and Dyn2. Bands were visualized by chemiluminescence (Supersignal West Pico Kit, Pierce) for detecting peroxidase-conjugated secondary antibodies, followed by exposure to x-ray film (Eastman Kodak Co.).
FRET
Fixed cells expressing similar and low levels of GFP and mRFP (average intensity of ∼1000 arbitrary units) were picked for analysis. FRET was measured by acceptor photobleaching method using a Zeiss LSM 510 confocal microscope with a C-Apochromat 63 × 1.2 watt objective lens, as described previously (11, 19). The fusion proteins of GFP/mRFP were excited using 488- and 561-nm lasers with a 405/488/561 dichroic mirror and 490 and 565 secondary dichroic mirrors for GFP and mRFP, and then emission filters BP 505–550 and LP 575 emission, respectively. A region of interest (ROI) was selected and photobleached using 70% of 561-nm laser power and 50 scan iterations. The increase in GFP fluorescence intensity following mRFP photobleaching was measured as FRET. % FRET efficiency was calculated using the change in background-subtracted fluorescence intensity as 100 × ((post-bleach intensity) − (pre-bleach intensity)/(post-bleach intensity)). Pearson correlation coefficient of the fluorescence intensity of FRET pair was calculated for each acquisition time point, and values between −0.7 and −1.0 was regarded to be an acceptable range of index, as elaborated in Ref. 11. Four cellular locations (i.e. cytosol, filopodium, lamellipodium, and neurite) were chosen, with one location for each cell. FRET images were corrected for background.
Statistical Analysis of Cell Morphology and Lamellipodial Formation
Morphological phenotypes were quantified using the following definitions. Filopodia were defined as GFP-actin-positive cell protrusions that are dynamic, with a width of 0.6 to 1.2 μm, and a length of at least 3 μm. Filopodia were quantified by their number per cell captured with time-lapse microscopy (see below). Lamellipodia were characterized by areas of expansion at the mobile edge of the cell with an actin mesh-like network. They may or may not contain actin ribs or microspikes. Neurites were defined as cell extensions greater than two cell body lengths. Neurites were further categorized into the following: 1) complex neurites, where multiple branch points exist, or 2) simple neurites, with no branch points. Extensions were descriptive of cell protrusions, greater than one cell body length, that were neither lamellipodia nor neurites. Therefore, neurites and extensions were mutually exclusive. Quantitative analysis of cell morphology was determined by the percentage of cells containing at least one of the above-named morphology in a field of phalloidin-stained cells under a ×20 objective. Three independent experiments were performed, and the scores for each were pooled for statistical analysis.
Time-lapse Microscopy
N1E-115 cells, cultured in 35-mm laminin-coated glass-bottom dishes (MatTek), were imaged on a 37 °C heated stage within a 5% CO2 atmosphere chamber with a monochromator on a wide-field microscope (Axiovert 200, Zeiss) enclosed within an incubator box and equipped with a Coolsnap charge-coupled device (Photometrics) camera. Images were acquired every 10 s for 5–10 min, and movies were generated from stack files with MetaMorph (Universal Imaging). Filopodial dynamics was determined by scoring of filopodia per live cell, and filopodial lifetime, defined as the duration between the emergence and retraction of a filopodium. The maximal length of the filopodium was also recorded. Cells from three separate experiments were analyzed.
Dynasore Treatment
Dynasore, an inhibitor of GTPase activity of Dyn, was purchased from Sigma and handled as described previously (26, 27). A stock solution of 200 mm in DMSO was prepared in the dark and stored as aliquots at −20 °C. On the day of the experiment, a working solution of 80 μm was made by dilution in serum-free culture medium. To determine the effect of dynasore on filopodial dynamics, N1E-115 cells were rinsed five times with serum-free DMEM before incubation with dynasore (80 μm) or vehicle alone (0.2% v/v DMSO) in serum-free DMEM at 37 °C and 5% CO2. Live-cell imaging was initiated 10 min before the addition of dynasore and terminated up to 30 min after dynasore treatment. To relieve the inhibition of GTPase activity, dynasore-containing medium was replaced with culture medium containing 10% FBS. Live-cell imaging was resumed 30 min after washout. To ascertain that dynasore was indeed inhibiting Dyn function under the experimental parameters above, transferrin (Tf) uptake was monitored with or without dynasore. Cells were serum-starved for 3 h before being incubated with dynasore (80 μm) or vehicle (0.2% v/v DMSO) for 30 min. They were then chilled on ice while being loaded with 25 μg/ml Alexa 488-Tf (Molecular Probes) and incubated at 37 °C and 5% CO2 for 10 min. The duration was selected, as Tf uptake reaches equilibrium after 15 min (19). Surface-bound Tf were removed by rinsing cells twice in ice-cold acid wash (0.2 m acetic acid and 0.5 m NaCl). Finally, cells were fixed for 5 min in 4% paraformaldehyde, mounted, and observed with confocal microscopy.
Live-cell TIRF Microscopy
To capture the rapid dynamics of actin-regulatory proteins, a DeltaVision OMX Version 4 microscope (Applied Precision), equipped with 405-, 488-, and 568-nm lasers for excitation and the BGR filter drawer (emission wavelengths 436/31 for DAPI, 528/48 for Alexa 488, and 609/37 for Alexa 568), was used with the addition of the live-cell apparatus (humidified CO2 at 5% and 37 °C). An Olympus Plan Apochromat 100×/1.49 TIRF oil immersion objective lens was used with the galvo-driven ring TIRF module for sequential two-channel TIRF imaging with different critical angles. Images were captured with a liquid-cooled Photometrics Evolve EM charge-coupled device camera for each channel. Exposure time, laser power, and camera EM gain were all adjusted to achieve intensities between 3000 and 10,000 counts above background while minimizing photobleaching. A total of 150 frames were taken with a 2–3-s interval for 5–10 min. Post-acquisition alignment was carried out with an ImageJ macro.
Image analysis was performed in MetaMorph and ImageJ. To measure the fluorescence intensity of actin-regulatory proteins over time, the integrated intensity of a background-subtracted ROI between 25 and 30 square pixels at filopodial tips was determined at different frames. Given the varying expression levels of proteins in cells, the grayscale intensity value of each frame was normalized to the maximum value in each data set and plotted over time for comparison. For each protein, normalized intensity plots of four filopodia over their lifetimes were presented. To generate a kymograph, a line, 10–15 pixels in width, was drawn from the base to the tip of filopodia. Care was taken to ensure that the lateral movement of filopodia was captured within the line, and no other filopodia crossed into the line. Fluorescence in a kymograph represented the movement of puncta along the length of filopodia with time, and the slope of the path represented the speed of movement.
Statistical Analysis
All quantitative results were obtained from at least three independent experiments and expressed as the mean ± S.D. Experimental data were analyzed by Student's t test and one-way analysis of variance. Intergroup differences were determined by post-hoc Tukey test. Differences among samples were considered statistically significant when p < 0.05.
RESULTS
Dyn1–3 Localized to Lamellipodia and Filopodia in N1E-115 Neuroblastoma Cells
In our previous work on filopodial formation and neuronal morphology, we detailed the lengths and lifetimes of filopodia in N1E-115 neuroblastoma cells as a model neuronal cell (11, 15, 25). We took a similar approach using N1E-115 neuroblastoma cells in this study to investigate the role of Dyn in filopodial formation. To demonstrate the expression of Dyn1–3 in N1E-115 neuroblastoma cells, we used RT-PCR (data not shown), and the results were similar to the Dyn expression found in brain (28). Next, we investigated protein expression using antibodies specific to Dyn1–3 isoforms. Endogenous Dyn isoforms were stained by IF and visualized as punctate spots (Fig. 1A). Dyn1–3 localized strongly to the cell body and lamellipodia. Dyn1 was readily detected at the cell membrane; Dyn2 localized preferentially to the Golgi network, and Dyn3 appeared diffuse in the cytoplasm. Filopodia contained faint signals of all three forms of endogenous Dyn.
FIGURE 1.

Dyn1–3 localize to lamellipodia and filopodia and colocalize with IRSp53. A, lamellipodia (panels i, iii, and v) and filopodia (panels ii, iv, and vi) were imaged by confocal microscopy. F-actin (red) and endogenous Dyn1 (panels i and ii), Dyn2 (panels iii and iv), and Dyn3 (panels v and vi) (green) were localized as shown. Bar, 5 μm. Filopodia in boxed areas (panels ii, iv, and vi) are shown enlarged as inserts. Bar, 1 μm. The panels show merged and single channel fluorescence images of N1E-115 cells cultured on laminin-coated glass coverslips, immunostained for endogenous Dyn, and counter-stained with A568-phalloidin, as described under “Experimental Procedures.” B, fluorescence images of HeLa and COS-7 cells transfected with Dyn1-GFP (panel i) and Dyn3-GFP (panel ii), respectively, and imaged by confocal microscopy. Bar, 5 μm. Filopodia-like protrusions (arrowheads) induced by ectopic expression of Dyn1-GFP are shown enlarged as inserts. Bar, 1 μm. Membrane ruffles induced by Dyn3-GFP are indicated by arrows. C, representative single channel and merged fluorescence images of cells, transfected to express Dyn1-GFP (panel i), Dyn2-GFP (panel iv), or Dyn3-GFP (panel vii) (green) and mRFP-IRSp53 (panels ii, v, and viii) (red), under ring-TIRF microscopy. Filopodia in boxed areas (panels iii, vi, and ix) are shown enlarged as inserts. Areas of colocalization are indicated by arrowheads. Bar, 1 μm.
Dyn1–3 Colocalized with IRSp53
Expression of Dyn1–3 alone or in the presence of IRSp53 induced changes in cell morphology. Dyn1 and Dyn3, but not Dyn2, induced and localized to multiple neurite-like outgrowths and filopodia. Upon expression in HeLa and COS-7 cells, Dyn1-GFP localized to the leading edge and filopodia-like protrusions, whereas Dyn3-GFP localized to membrane ruffles and, to a lesser extent, filopodia-like protrusions (Fig. 1B).
The IRSp53 phenotype in N1E-115 neuroblastoma cells was characterized by the formation of filopodia, lamellipodia, and neurite outgrowth (11, 25). mRFP-IRSp53 colocalized with GFP-tagged Dyn in lamellipodia, microspikes and occasionally in IRSp53-enriched filopodial tips (Fig. 1C). Colocalization was not observed when Dyn1–3 were co-expressed with mRFP-IRSp53 F428A/P429A, an SH3 domain mutant unable to bind Mena (9) and incapable of inducing filopodial formation (11). The degree of colocalization between Dyn1–3 and IRSp53 at various cell regions was determined by Pearson's coefficient, as described previously (19). A value of 0.5 and above indicates colocalization. Dyn1–3 exhibited a high degree of colocalization with IRSp53 in cell protrusions such as lamellipodia and neurites, with partial colocalization in the cytosol (Table 1). To find out whether Dyn1 is involved in endocytosis in lamellipodia and filopodia, we transfected cells with Dyn1-mCherry and the known endocytosis markers GFP-clathrin or GFP-Rab5. GFP-clathrin and GFP-Rab5 were absent from lamellipodia and filopodia. However, Dyn1-mCherry colocalized with GFP-clathrin in the cell body and neurites (Pearson's coefficient of 0.5–0.6) but did not colocalize with GFP-Rab5 (Pearson's coefficient of 0.3–0.4).
TABLE 1.
Colocalization analysis of IRSp53 and Dyn in cells
N1E-115 cells were transfected to express Dyn-GFP and mRFP-IRSp53, fixed 24–28 h later, and acquired with confocal microscopy. Colocalization was determined using FluoView software (Olympus) and expressed as correlation coefficient (CC) ± S.D. (n = 5). A value of <0.25 indicates no colocalization, 0.25–0.5 indicates potential colocalization, 0.5–0.7 indicates partial colocalization, and >0.7 indicates high colocalization.
| Sample (n = 5) | CC |
||
|---|---|---|---|
| Cytosol | Lamellipodium | Neurite | |
| Dyn1-GFP + mRFP-IRSp53 | 0.595 ± 0.142 | 0.819 ± 0.044 | 0.822 ± 0.045 |
| Dyn2-GFP + mRFP-IRSp53 | 0.669 ± 0.153 | 0.915 ± 0.062 | 0.810 ± 0.061 |
| Dyn3-GFP + mRFP-IRSp53 | 0.799 ± 0.048 | 0.876 ± 0.055 | 0.867 ± 0.075 |
Dyn1 Interacts with the SH3 Domain of IRSp53
To determine whether Dyn1 interacted with IRSp53 in vivo, FRET experiments by acceptor photobleaching (AP-FRET) were performed. Expression levels of Dyn-GFP and mRFP-IRSp53 in N1E-115 cells were kept to the minimum that was required for fluorescence microscopy. Intensity timelines of AP-FRET experiments performed in filopodium, lamellipodium, and neurite are shown in Fig. 2A. mRFP-IRSp53 interacted with Dyn1-GFP preferentially at areas of active actin polymerization (Table 2). Positive FRET is defined as % FRET efficiency of at least 3% and correlation coefficient between −0.7 and −1.0. Negative controls consisting of mRFP-IRSp53 and GFP did not produce a positive FRET. The greatest FRET reading was obtained for lamellipodium and filopodium at 12.8 ± 4.0 and 10.8 ± 2.9%, respectively, closely mirroring that of mRFP-GFP tandem fusion positive control. This was followed closely by FRET in neurites at 9.3 ± 4.0%. However, % FRET efficiency was relatively low in cytosol at 6.1 ± 0.6% compared with 17.8 ± 3.9% for positive control. This trend was similar to colocalization data analyzed by Pearson's coefficient. Positive FRET was also observed between mRFP-IRSp53 and Dyn2-GFP/Dyn3-GFP (data not shown). In addition, HA-Dyn1 was detected in pulldown assays from whole cell lysates using full-length GST-IRSp53 as bait (Fig. 2B). Finally, Dyn1-GFP interacted with the SH3 domain of mRFP-IRSp53 in vivo because there was positive FRET between Dyn1 and IRSp53 but not between Dyn1 and the SH3 (F428A/P429A) mutant of IRSp53.
FIGURE 2.

Dyn1 interacts with the SH3 domain of IRSp53. A, N1E-115 cells were fixed 24 h post-transfection. Filopodium (panel i), lamellipodium (panel iv), and neurite (panel vii) containing similar levels of Dyn1-GFP and mRFP-IRSp53 (average intensity of ∼1000 arbitrary units) were selected for AP-FRET experiments. An ROI (indicated by boxed area) was selected, and both GFP and RFP channels were monitored over the time course of the experiment. Once baseline signals for both GFP and mRFP channels were obtained, mRFP signal was bleached using a 561-nm laser, and the intensity levels on green and red channels followed. Fluorescence intensity of the regions of interest before and after photobleaching were shown enlarged (panels ii, v, and viii). Dual channel intensity timelines of AP-FRET experiments of filopodium (panel iii), lamellipodium (panel vi), and neurite (panel ix) are shown with Dyn1-GFP (green line) and mRFP-IRSp53 (red line). Bar, 5 μm. B, GST pulldown of Dyn1. GST pulldown was performed on whole cell lysates of N1E-115 cells and transfected to express HA-Dyn1 and GST-IRSp53 or GST tag alone, using glutathione-Sepharose beads. The pulldown was subjected to SDS-PAGE and WB with antibodies against GST (upper panel) and HA (lower panel). Lanes 1 and 2 are inputs for GST and GST-IRSp53, respectively. Lane 3 is input for GST and HA-Dyn1. Lane 4 is input for GST-IRSp53 and HA-Dyn1. Lanes 5 and 6 are GST pulldowns of GST and GST-IRSp53, respectively. Lane 7 is GST pulldown of HA-Dyn1. Lane 8 is GST-IRSp53 pulldown of HA-Dyn1.
TABLE 2.
Dyn1 showed positive FRET with IRSp53
ROIs for AP-FRET experiments were chosen at cellular locations as follows: cytosol, filopodium, lamellipodium, and neurite. FRET efficiency and correlation coefficient (CC) values were calculated as described under “Experimental Procedures.” Positive FRET is defined as % FE >3% and Pearson's correlation coefficient values between −0.7 and −1.0. Data presented are averages ± S.D. from three experiments, with n = 6 or 9 per experiment. NA means not applicable.
| Sample | Location | % FE | CC |
|---|---|---|---|
| Positive control (n = 6) | |||
| RFP-GFP fusion | Cytosol | 17.8 ± 3.9 | −0.999 ± 0.001 |
| Filopodium | 10.2 ± 2.1 | −0.885 ± 0.082 | |
| Lamellipodium | 11.3 ± 4.9 | −0.860 ± 0.138 | |
| Neurite | NA | NA | |
| Negative control (n = 6) | |||
| GFP + mRFP-IRSp53 | Cytosol | 2.79 ± 3.68 | −0.265 ± 0.531 |
| Filopodium | 2.01 ± 3.87 | −0.028 ± 0.798 | |
| Lamellipodium | 2.95 ± 3.64 | 0.003 ± 0.733 | |
| Neurite | 3.26 ± 3.52 | −0.252 ± 0.653 | |
| Sample (n = 9) | |||
| Dyn1-GFP + mRFP-IRSp53 | Cytosol | 6.1 ± 0.6 | −0.833 ± 0.106 |
| Filopodium | 10.8 ± 2.9 | −0.836 ± 0.123 | |
| Lamellipodium | 12.8 ± 4.0 | −0.840 ± 0.114 | |
| Neurite | 9.3 ± 4.0 | −0.864 ± 0.076 | |
| Dyn1-GFP + mRFP-IRSp53FP/aa | Cytosol | 0.0 ± 2.3 | −0.190 ± 0.522 |
| Filopodium | 1.3 ± 3.3 | 0.234 ± 0.340 | |
| Lamellipodium | 1.0 ± 3.7 | −0.078 ± 0.616 | |
| Neurite | 0.6 ± 4.6 | −0.033 ± 0.435 | |
Dyn1 Is Required for IRSp53 Phenotype
To investigate which Dyn was required for the IRSp53 phenotype, we carried out knockdown experiments using small interfering RNA (siRNA) specific for each of the three isoforms (Fig. 3A). The siRNA transfection and knockdown efficiencies were estimated to be ∼60–70 and 70–80%, respectively. The siRNA sequences were specific for the endogenous mouse species and did not target the exogenously transfected Dyn-GFP forms. IRSp53 was transfected at 24 and 48 h after siRNA introductions for Dyn1 and Dyn2 and Dyn3, respectively. WB showed that IRSp53 expression was not perturbed under knockdown (Fig. 3B).
FIGURE 3.

Dyn1 is required for the IRSp53 phenotype. A, Dyn1–3 expression was monitored with siRNA addition. The rescued cDNA constructs encoding for exogenous Dyn-GFP were resistant against knockdown (KD) by the mouse Dyn-specific siRNA sequences. N1E-115 cells, with or without Dyn-GFP transfection, were subjected to KD with negative control (Neg ctl) siRNA (lanes 1, 3, and 5) or Dyn-specific siRNA (lanes 2, 4, and 6). Rescue experiments were performed by transfecting cells human Dyn1-GFP cDNA for 24 h and rat Dyn2- or 3-GFP for 48 h after siRNA addition. B, IRSp53 expression was not significantly perturbed under Dyn KD. The cDNA encoding for IRSp53 was transfected at 24 and 48 h after siRNA introductions (lanes 2–4) for Dyn1, and Dyn2 or Dyn3, respectively. C, bar charts show quantitative analysis of lamellipodia (panels i, iii, v, and vii) and outgrowths (panels ii, iv, vi, and viii) upon Dyn KD, with or without IRSp53 transfection. Quantitative analysis of cell morphology was determined by the percentage of cells containing neurites (extensions greater than one body length) and/or complex neurites (extensions with multiple branch points). Values were expressed as average ± S.D., n as indicated. Three independent experiments were performed, and the scores for each were pooled for statistical analysis with Student's t test. Asterisk denotes values with significant difference, i.e. *, p < 0.05; **, p < 0.01; ***, p < 0.001.
Single knockdown of Dyn1 and Dyn2, but not Dyn3, lessened cell spreading and lamellipodia formation without perturbing the overall cell morphology (Fig. 3C, panels i–iv). The importance of Dyn2 in Rac-mediated formation of lamellipodia and focal complexes has been previously reported (29). Upon IRSp53 expression, knockdown of Dyn1 and Dyn2, but not Dyn3, led to a significant reduction of lamellipodia formation, neurite outgrowth, and complexity (Fig. 3C, panels v–viii). Neurite complexity is defined by the presence of multiple branch points. This perturbation of IRSp53 phenotype was more strongly seen in knockdown of Dyn1 (p < 0.001) than that of Dyn2 (p < 0.01). Given the greater impact of Dyn1 knockdown on the IRSp53 phenotype, we focused on Dyn1 in subsequent analyses.
Dyn1 Is Required for IRSp53-induced Filopodial Formation
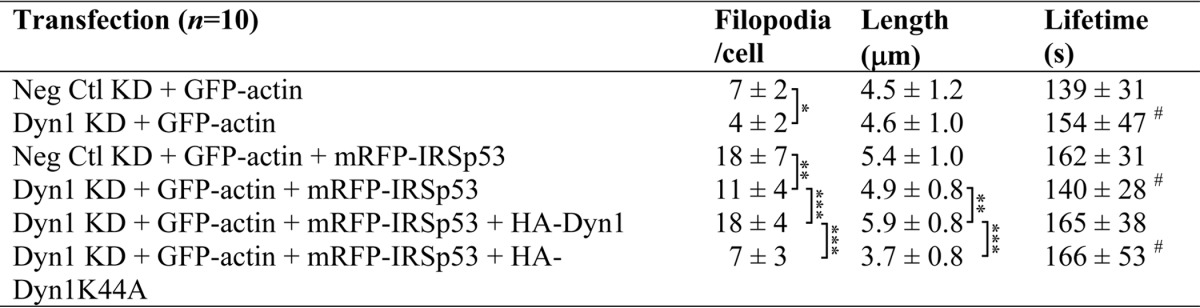
We next examined the effects of knockdown of Dyn1 on filopodia. Cells with moderate IRSp53 expression were imaged. Dyn1 knockdown led to a decrease in filopodial numbers in wild-type (p < 0.05) and IRSp53-transfected cells (p < 0.01) (Table 3). HA-Dyn1 expression rescued filopodial numbers (p < 0.001) and enhanced their length (p < 0.01), but dominant negative HA-Dyn1K44A GTPase mutant did not restore either of the above. Furthermore, Dyn1 knockdown appeared to have a negative impact on filopodial dynamics, with some protrusions exhibiting increased lifetime beyond the imaging duration of 5 min. In line with the definition of bona fide filopodia, static protrusions were excluded from the scoring. We observed that the expression of Dyn1 GTPase mutant (K44A) exacerbated the effects of Dyn1 knockdown.
TABLE 3.
Dyn1 is required for filopodia formation
N1E-115 cells, cultured in 35-mm laminin-coated glass-bottom dishes, were subjected to siRNA and then transfected with the cDNA constructs as shown. Differential interference contrast and fluorescence images of cells were acquired every 10 s at 24–32 h post-transfection. Time-lapse movies, generated from stack files with MetaMorph, were analyzed for cell morphology. Filopodia were defined as described under “Experimental Procedures,” and the numbers per cell were scored. Lifetime was measured by following filopodia from emergence to when it is no longer visible. Cells from three separate experiments were analyzed. Values were expressed as average ± S.D., (n = 10). Alphabets denote values with significant difference. * denotes values with significant difference as follows: *, p < 0.05; **, p < 0.01; ***, p < 0.001; #, filopodia with abnormal kinetics and increased lifetime were observed. Protrusions with lifetimes longer than 5 min were excluded from analysis.
Given that Dyn1 is capable of interacting directly with actin via an ABD (30), we tested whether the gain-of-function and loss-of-function ABD mutants of Dyn1 would be able to rescue the effects of Dyn1 knockdown on the IRSp53 phenotype (Fig. 4A). In the absence of background wild-type Dyn1, gain-of-function Dyn1E/K-GFP rescued the formation of both lamellipodia and filopodia to levels similar to rescue by Dyn1WT-GFP. In contrast, loss-of-function Dyn1K/E-GFP expression did not rescue, as seen by a significant reduction in filopodial numbers (p < 0.001) (Fig. 4, A and B).
FIGURE 4.

Dyn1 ABD mutants affect filopodial formation. A, differential interference contrast (DIC) and fluorescence images of N1E-115 cells transfected with mRFP-IRSp53 and reconstituted with wild-type Dyn1-GFP (panels i–v), gain-of-function mutant Dyn1E/K-GFP (panels vi–x), and loss-of-function mutant Dyn1K/E-GFP (panels xi–xv) upon Dyn1 knockdown. Bar, 10 μm. Boxed areas are shown enlarged as inserts. Filopodia were indicated by lines on differential interference contrast images. Bar, 5 μm. B, bar chart shows quantitative analysis of filopodia per cell of each group (A). Values were expressed as average ± S.D. (n = 10). Statistical analysis was carried out with Student's t test. Asterisk denotes values with significant difference, i.e. ***, p < 0.001.
To further evaluate whether a direct interaction with IRSp53 is important for Dyn1 function in filopodial formation, we examined the effects of Dyn1 knockdown on filopodia induced by the overexpression of I-BAR domain of IRSp53. I-BAR domain overexpression induced nondynamic filopodia (lifetime exceeds 5 min), some with aberrant branches, and numbered 33 ± 6 and 34 ± 8 without and with Dyn1 knockdown, respectively (n = 5). Hence, knockdown of Dyn1 did not have an effect on the number or stability of filopodia induced by I-BAR domain alone. Taken together, these data are consistent with the view that Dyn1 is required for IRSp53-induced filopodial formation and dynamics.
Dynasore Affects Filopodial Number and Dynamics
Next, we used dynasore, a noncompetitive inhibitor of Dyn1, that interferes specifically with its GTPase activity (26) to study the role of Dyn1 in filopodial dynamics. Dynasore action in cells could be observed within minutes after addition. Pretreatment with 80 μm dynasore effectively blocked Alexa Fluor 488-Tf uptake in N1E-115 cells (data not shown). Dual-channel time-lapse imaging was then carried out on cells subjected to either dynasore (80 μm) or vehicle (0.2% v/v DMSO) for 30 min. Five minutes after dynasore treatment, the filopodial numbers per cell were almost halved, and lamellipodia had almost completely withdrawn (Fig. 5A). The reduction in filopodial number was greatest in the first 5 min (p < 0.001), as compared with subsequent time points (p < 0.05 and p > 0.05) (n = 7) (Fig. 5B). In comparison, the filopodial lifetime increased drastically, with the greatest increase occurring between 5 and 10 min after dynasore treatment. By 30 min, lamellipodia and dorsal ruffles, two well characterized Dyn-dependent processes (31, 32), disappeared completely, whereas filopodial assembly and disassembly both ceased. These effects of dynasore on both filopodial number and dynamics were similar to those observed with Dyn1 knockdown (Table 3).
FIGURE 5.
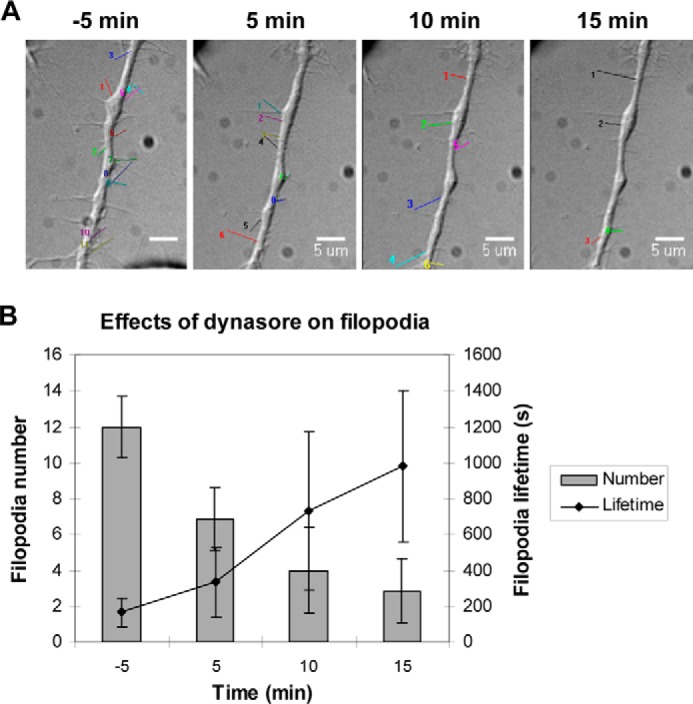
Dynasore affects filopodial number and dynamics. A, representative differential interference contrast images of cells before and after dynasore treatment obtained at 5-min intervals. N1E-115 cells, cultured in 35-mm laminin-coated glass-bottom dishes, were rinsed and incubated with dynasore (80 μm) or vehicle alone (0.2% v/v DMSO) in serum-free DMEM. Wide-field time-lapse imaging was initiated 10 min before the addition of dynasore and terminated up to 30 min after. Dynamic filopodia were highlighted in the time-lapse movies, and their number and lifetime were determined for quantitative analysis. Bar, 5 μm. B, bar chart showing filopodial numbers per cell and lifetime before and after dynasore treatment. Values were expressed as average ± S.D. (n = 7).
Dyn1 Accumulates at the Leading Edge Behind Mena
The data with dynasore suggest that Dyn1 plays a role in filopodial initiation. In addition, in vitro experiments have shown that Dyn binds actin at the barbed end and has the ability to extend actin filaments (30). To investigate this possibility, we transfected cells with GFP-Mena and HA-Dyn1 and imaged the location of both proteins at the leading edge and in filopodia-like protrusions. Mena is an early marker for filopodia and is found clustered at the leading edge of lamellipodia and as filopodia emerge. HA-Dyn1 was localized to areas where GFP-Mena was enriched, including areas of lamellipodia (Fig. 6A), filopodial shafts, and a subset of filopodial tip complexes (arrowheads, Fig. 6B). Fig. 6B shows a montage with a filopodial extension series (inserts 1–6). Mena concentrates at the filopodial tip throughout the series of panels, whereas Dyn1 marks the tip at early stages but not at late stages. Dyn1 extends into the filopodial shaft just behind Mena (Fig. 6B).
FIGURE 6.
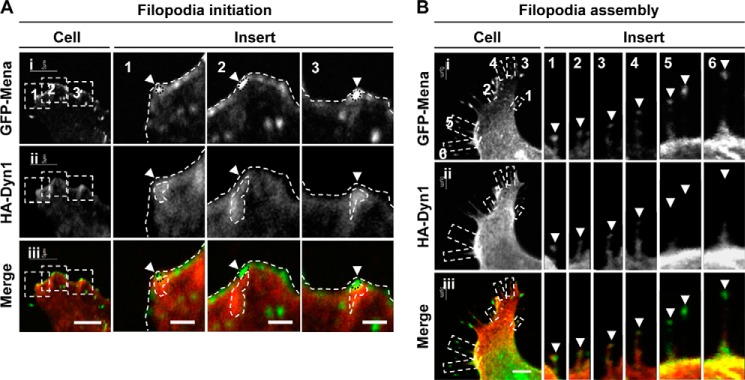
Dyn1 localizes with Mena during filopodia initiation and assembly. N1E-115 cells cultured on laminin-coated glass coverslips were transfected to express GFP-Mena (green) (panel i) and HA-Dyn1 (panel ii) and immunostained with anti-HA antibodies (red). A, HA-Dyn1 localized with bright puncta of GFP-Mena at the leading edge (arrowheads). Bar, 5 μm. Boxed areas in panels i–iii are shown enlarged as inserts 1–3. Bar,= 1 μm. B, HA-Dyn1 localized with GFP-Mena at filopodia tips (arrowheads) during filopodia assembly. Six filopodia were montaged to show the localization of Dyn relative to Mena. Bar, 5 μm.
Dyn1, Mena, and Eps8 Regulate Filopodial Dynamics
To investigate the role of Dyn1 further, we followed its location during filopodial lifetimes. The idea for the next set of experiments was to correlate initiation, extension (assembly), and retraction (disassembly) of filopodia with the presence of IRSp53 and partners Dyn1, Mena, and Eps8 (Fig. 7). The GFP fusion protein fluorescence signals in filopodia are weak, and time-lapse observations are difficult in standard wide-field fluorescence microscopy. We turned to rapid time-lapse ring-TIRF microscopy (a TIRF variant with more even illumination across the evanescent plane) for these experiments. TIRF microscopy is useful for imaging dynamic processes that occur within 200 nm of the coverslip. Filopodia are well suited for TIRF microscopy because they emerge from the leading edge of the cell that is attached to the coverslip.
FIGURE 7.

Live cell imaging of IRSp53, Dyn1, Mena, and Eps8, during filopodia assembly and disassembly. N1E-115 cells were transfected with mCherry-lifeact cDNA and cDNA for GFP (A), GFP-IRSp53 (B), Dyn1-GFP (C), GFP-Mena (D) and GFP-Eps8 (E), and filopodia were followed using time-lapse microscopy. Three frames (assembly, mid-assembly, and disassembly) with green (protein) and red (lifeact) channels are shown for each protein. Filopodia dynamics were captured with the ring-TIRF microscope at 2–3-s intervals for 5–10 min, as described under “Experimental Procedures.” Post-acquisition alignment and measurements were performed using ImageJ. The integrated intensity of an ROI between 25 and 30 square pixels at the filopodia tip was determined at each frame. Grayscale intensity value of each frame was normalized to the maximum value (set arbitrarily to 100%) in each data set and plotted over the course of filopodial lifetime. For each protein, normalized intensity plots of four filopodia are shown in B for IRSp53 (panel ii), C for Dyn1 (panel ii), D for Mena (panel ii), and E for Eps8 (panel ii). Asterisk indicates one of the traces showed photobleaching.
The intensity of the negative control, GFP, was extremely low during filopodial initiation and essentially absent from the shaft and tip complex during the entire lifetime of filopodia (Fig. 7A and supplemental Video 1). GFP-IRSp53 was concentrated at the leading edge and tips of filopodia, in addition to the shaft (Fig. 7B, panel i, and supplemental Video 2). The normalized intensity plot of IRSp53 decreased over the lifetime of filopodia, but an IRSp53 signal was maintained throughout the lifetime of filopodia (Fig. 7B, panel ii). Dyn1-GFP was present along the shaft during filopodial initiation, but its signal disappeared midway in the extension phase (Fig. 7C, panel i, and supplemental Video 3). The highest intensity of Dyn1-GFP corresponded to the initiation phase of filopodial assembly. Yet faint signals of the filopodial lifetime (Fig. 7C, panel ii). In the course of TIRF imaging, novel forms of intra-filopodial movement were observed for Dyn1. Dyn1-GFP was often observed as bright spots colocalized with F-actin or IRSp53 in rearward movements at ∼30 nm/s (Fig. 8). This was similar to the rearward movement of Myo10, corresponding to retrograde flow (33, 34). Furthermore, the fluorescence intensity of retreating spots was strong, suggestive of complex formation. It is possible that IRSp53·Dyn1 complexes, like Myo10 (35), might associate with F-actin undergoing actin retrograde flow in filopodia. GFP-Mena was localized to the leading edge and concentrated at the tips of filopodial precursors. Its highest intensity correlated with filopodial emergence from the leading edge (Fig. 7D, panel i, and supplemental Video 4). Over the time course of filopodial extension, the tip intensity of GFP-Mena gradually decreased (Fig. 7D, panel ii) and was barely detectable during disassembly. High Mena expression led to long, persistent filopodia with increased lifetime (supplemental Video 5), in agreement with its actin anti-capping function. In contrast, GFP-Eps8 signal was low or absent at the stage of filopodial precursors and initiation at the leading edge (Fig. 7E, panel i, and supplemental Video 6). It was present at low amounts along the shaft during the extension phase and at high amounts at the tips during the retraction phase (Fig. 7E, panels i and ii). Interestingly, the intensity trace of Eps8 during the filopodial lifetime was opposite that of Mena, which is consistent with its role in capping of actin barbed ends. Of the proteins investigated, Mena and Eps8 are the clearest in filopodia, as they are concentrated at filopodial tips and are weakly expressed in the cell body. In contrast, Dyn and IRSp53 have a more general distribution in filopodia and are strongly expressed within the cell body.
FIGURE 8.
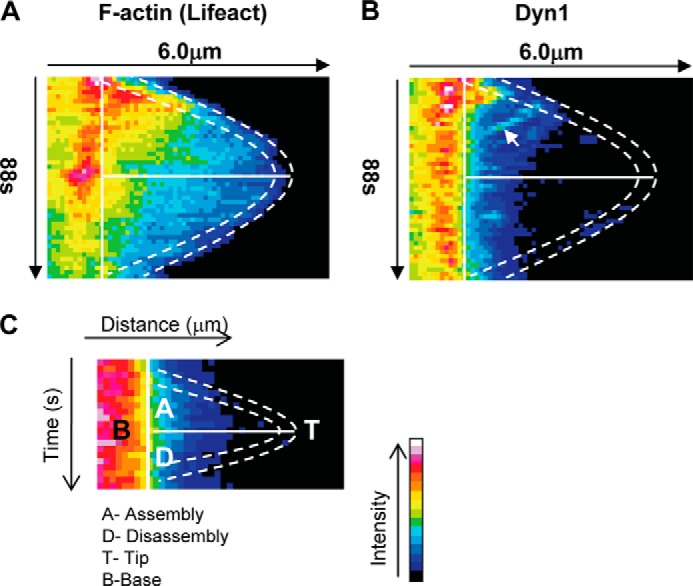
Intra-filopodial movements of Dyn1 during filopodial assembly and disassembly. A, kymographs are dual channel analysis of lifeact marking F-actin (A) and Dyn1(B). Kymographs of filopodial assembly and disassembly were generated by plotting intensity (color-coded) as a function of time (top to bottom) and distance (left to right) using ImageJ, as described under “Experimental Procedures.” The dashed lines trace the filopodial tip, and this position is determined by the end of the lifeact signal. The solid vertical lines demarcate the base of the filopodia. The solid horizontal lines separate the assembly phase from the disassembly phase. C, key to the figure. Rearward movement of Dyn1 is indicated by an arrow.
To compare directly the location of IRSp53, Dyn1, Mena, and Eps8 during the filopodial lifetimes, we turned to kymograph analysis. GFP/mRFP intensities were color-coded (with red/white, high; blue/black, low) and then plotted as a function of distance (left to right) and time (top to bottom; Fig. 9A). The dashed lines in Fig. 9A are superimposed in the kymograph mark out the position of the filopodial tip, and the solid lines denote the transition between assembly (A) and disassembly (D) phases. The key for the kymograph analysis is shown in Fig. 9C. The data suggest functional roles for Dyn1 in initiation and assembly, for Mena in assembly and Eps8 in disassembly. IRSp53 is present throughout the filopodial lifetime which is consistent with the idea that it functions in filopodial initiation, assembly, and disassembly (Fig. 9B).
FIGURE 9.

Kymograph analysis of IRSp53, Dyn1, Mena, and Eps8 during filopodia assembly and disassembly. A, filopodia were followed as described in Fig. 6. The kymographs are dual channel analysis of one filopodia from each cDNA transfection, with lifeact marking F-actin (panels i–v) and GFP (panel vi), IRSp53 (panel vii), Dyn1 (panel viii), Mena (panel ix), Eps8 (panel x). B, schematic of the tip complex is shown with the circle representing the diameter of the filopodia. IRSp53 dimers with the I-BAR forming a zeppelin shape (gray) (50) with two SH3 domains per dimer attracting protein partners to the barbed end of actin filaments. Cdc42 (filled circles) brings IRSp53 to membrane sites and activates the protein exposing I-BAR and SH3 domains. Oligomerization of IRSp53 I-BAR domain in vitro induces the protrusion of membranes in the shape of a cylinder with a specified diameter (51). The IRSp53 SH3 domains attract partners to membrane sites associated with short actin filaments. Our previous work suggests the short actin filaments may be generated by IRSp53-N-Wasp·Toca-1 complex (19). The kymograph analysis shows that IRSp53 levels remain relatively constant through the lifetime of a filopodia. In contrast, Dyn1, Mena, and Eps8 arrive in sequence marking initiation, assembly, and disassembly phases (circles and arrows in A). This timeline of protein arrival fits with the role of Dyn1 in extending barbed ends (30), Mena in preventing actin capping (52), and Eps8 in capping actin (53). Thus, we hypothesize that filopodial dynamics are regulated by switching of IRSp53 partners, Dyn1, Mena, and Eps8. Further work will be required to establish how these IRSp53 partners (Dyn, Mena, and Eps8) compete with each other and modulate actin dynamics during filopodia formation. C, key to A and B.
DISCUSSION
Dyn has a well established role in fission of clathrin-coated vesicles that occurs at the actin-membrane interface during endocytosis. During this process, Dyn appears to coordinate groups of proteins involved in membrane deformation and actin dynamics, including N- and F-BAR proteins, to achieve vesicle budding. Dyn is also thought to regulate actin filaments coordinately with its function in remodeling lipid membranes during endocytic trafficking, cell morphogenesis, and migration (36). The GTPase domain, in addition to being correlated with membrane fission, has been associated with the dynamics of actin filament. Dyn is localized at invadopodia, where endocytic activity is not known to occur (37). It was speculated that a main role for Dyn in invadopodia was to coordinate actin assembly and disassembly, to facilitate breaches in the cortical cytoskeleton, and to allow protease secretion in a highly polarized manner (38).
Recently, Dyn1 was found to be recruited at two distinct phases of clathrin-mediated endocytosis as follows: a low amplitude phase in the early stages of clathrin-coated structure formation and a spike that ends in scission (24). Even though Dyn is not essential for early stages of clathrin-mediated endocytosis (39), the ability of the Dyn GTPase cycle to regulate its own recruitment and the kinetics of invagination via F-actin and N-BAR assembly (24) allude to an important regulatory role in actin polymerization.
IRSp53 couples membrane deformation through its I-BAR domain with actin dynamics through its SH3 domain to generate filopodia. The IRSp53 SH3 domain binding partners include Mena (9) and Eps8 (13), which are well known for their actin anti-capping and actin capping activities, respectively. In addition, the SH3 domain of IRSp53 links to N-WASP (11) and indirectly to Toca1. These latter two proteins work together to generate short actin filaments at the base of filopodia (19, 40). IRSp53, N-WASP, and Toca1 are all capable of inducing filopodial formation, and their knockdown inhibits filopodial formation (11, 19, 41).
In this study, we show that Dyn1 localizes and interacts with IRSp53 in filopodia. Because the IRSp53 SH3 (FP/AA) mutant does not interact with Dyn1, we conclude that the SH3 domain is essential for the interaction. Next we used knockdown of Dyn1 and showed effects on the IRSp53 phenotypes of neurite outgrowth, neurite complexity, and lamellipodia formation. Dyn1 knockdown strongly inhibits the IRSp53 phenotype. Dyn1 knockdown also inhibits IRSp53-mediated filopodial formation, and this can be rescued by wild-type Dyn1 expression but not by Dyn1-K44A. Taken together, these data show that Dyn1 is a novel partner of IRSp53 involved in regulating cell morphology and more specifically filopodial formation.
Dyn1 is involved in the extension of short actin filaments via ABD in vitro (30). To investigate the role of the ABD in filopodial formation, we used two ABD mutations as follows: the gain-of-function (E/K) and loss-of-function (K/E). When gain-of-function Dyn1E/K-GFP was expressed together with mRFP-IRSp53 in a Dyn1 knockdown background, lamellipodial and filopodial formations were restored to wild-type levels. In contrast, loss-of-function Dyn1K/E-GFP expression did not rescue lamellipodial formation and filopodial number. This further strengthens the idea that Dyn1 is involved in filopodial formation and that, in addition to the known role of GTPase domain in actin remodeling (42), the ABD is also required.
We explored the function of IRSp53 and Dyn1 and Eps8 and Mena in filopodial formation by following their intensity and localization during filopodial assembly and disassembly. We found Dyn1 to localize behind Mena during filopodial initiation. Furthermore, Dyn1 could be seen in the filopodial shaft and tip in early stages of assembly. Dyn1 was lost in later stages of filopodial assembly, although Mena was still prominent. These data suggest that Dyn1 is involved in initiation of filopodial formation. To follow the dynamics of filopodial turnover and protein localization, we used rapid time-lapse TIRF microscopy. These are difficult experiments because filopodia are small structures with consequently weak fluorescence, which sometimes go out of focus. Although the intensities for each protein varied from filopodia to filopodia, there were clear trends. IRSp53, Dyn1, and Mena had a high intensity initially at the leading edge and in early protrusions. As the filopodia extended, Dyn1 intensity was lost first, followed by Mena, with IRSp53 remaining relatively stable throughout the lifetime of the filopodia. Dyn1 was seen to fall away after the establishment of a filopodial shaft. Mena remained in the tip complex until the assembly phase was complete. In contrast to these trends, Eps8 was present at low intensity during filopodial assembly and reached high intensity at the tip complex during the disassembly phase and remained at the tip. We also noticed a correlation between expression levels of Mena and Eps8 and filopodial length, i.e. longer for Mena and shorter for Eps8 (compare supplemental Videos 5 and 6), which is consistent with actin anti-capping and actin capping activities, respectively.
Based on the finding that Dyn1 localized to F-actin bundles in filopodia by IF and immunoelectron microscopy, it was suggested that a Dyn1·cortactin ring complex mechanically stabilizes F-actin bundles in growth cone filopodia by GTP hydrolysis (43). We find that Dyn1 exhibits dynamic movement in filopodia and is detected at the highest level at the early phase of filopodial formation. During late assembly, the Dyn1 signal is lost from filopodia. Thus, these results do not support the model of Yamada et al. (43). Furthermore, in vitro data suggest that GTP activates Dyn2 to unbundle F-actin filaments making them available to actin-severing proteins (44). However, we cannot exclude the possibility that there exists cell type-specific filopodial architecture. In N1E-115 cells, filopodial tip complex activity may be the prime regulator, although in other cell types, F-actin bundling via Dyn1 (43), fascin (45), or Eps8 (13) may be involved.
The effects of dynasore are evident within 1–2 min of treatment, and clathrin-mediated endocytosis completely ceased after 10 min (26). Dynasore caused a reduction in growth cone filopodial number in neuroblastoma cell line SH-SY5Y (43), as we also found here in N1E-115 cells. However, when we looked more carefully at the effects of dynasore on filopodia using time-lapse microscopy, we observed that their lifetime was increased through decreased rates of disassembly. Thus, dynasore caused a “freezing” effect on filopodia by reducing rates of both assembly and disassembly. What is the mechanism for the reduction in rates of disassembly? One possibility is that the effect on filopodial disassembly may be indirect. Dynasore inhibited lamellipodial formation, and this may affect severing proteins such as cofilin leading to reduced rates of cellular actin depolymerization. Hence, we speculate that the dynasore-mediated increase in filopodial lifetime might be attributed to an increased cofilin phosphorylation, seen in cells unable to generate lamellipodia (46), which leads to its inactivation and subsequent stabilization of actin filaments.
The time-lapse analysis of IRSp53, Dyn1, Mena, and Eps8 in live N1E-115 cells presented here gives us novel insight into mechanisms of filopodial formation and dynamics. Previous work has suggested that the tip complex activity determines the dynamics of filopodia (47, 48). As shown in Fig. 9B, we define protein complexes that control three phases in filopodial dynamics, initiation, assembly and disassembly, through F-actin barbed end activity. Initiation begins by activation and localization of IRSp53 by Cdc42 (13, 25, 40, 49). Activated IRSp53 through N-WASP and possibly Toca1 induces the formation of short actin filaments (19). IRSp53 then partners with Dyn and Mena to induce elongation of actin filaments into early protrusions. Dyn1 falls away, and Mena is the main driver for filopodial assembly. Finally, IRSp53 partners with Eps8, which prevents actin addition at the barbed end, and with actin depolymerization at the pointed end the filopodia disassembles. In full agreement with our data on Mena having a role in initiation, Disanza et al. (49) showed that activated IRSp53 induces clustering of Mena at the barbed end of actin filaments leading to filament elongation (in vitro) and filopodial formation (in vivo). Thus, we hypothesize that the IRSp53 SH3 domain partner switching underlies filopodial dynamics. Further work will be required to establish how these IRSp53 partners (Dyn, Mena, and Eps8) compete with each other and modulate actin dynamics during filopodial formation.
Supplementary Material
Acknowledgments
We thank D. Schafer for advice, Srivats Hariharan and John Soon Yew Lim for their technical assistance on microscopy and image analysis, and Fong Ming Koh for preliminary experiments.
This work was supported by A-STAR.

This article contains supplemental Videos 1–6.
- BAR
- Bin-Amphiphysins-Rvs
- ABD
- actin binding domain
- AP-FRET
- Förster resonance energy transfer by acceptor photobleaching
- Dyn
- dynamin
- Mena
- mammalian enabled
- N-WASP
- neuronal Wiskott-Aldrich syndrome protein
- SH3
- Src homology 3
- Tf
- transferrin
- TIRF
- total internal reflection fluorescence
- Toca
- transducer of Cdc42-dependent actin assembly
- ROI
- region of interest
- mRFP
- monomeric red fluorescence protein
- IF
- immunofluorescence
- WB
- Western blot.
REFERENCES
- 1. Gupton S. L., Gertler F. B. (2007) Filopodia: the fingers that do the walking. Sci. STKE 2007, re5. [DOI] [PubMed] [Google Scholar]
- 2. Millard T. H., Martin P. (2008) Dynamic analysis of filopodial interactions during the zippering phase of Drosophila dorsal closure. Development 135, 621–626 [DOI] [PMC free article] [PubMed] [Google Scholar]
- 3. McMahon A. P., Hasso S. M. (2013) Filopodia: the cellular quills of hedgehog signaling? Dev. Cell 25, 328–330 [DOI] [PubMed] [Google Scholar]
- 4. Fierro-González J. C., White M. D., Silva J. C., Plachta N. (2013) Cadherin-dependent filopodia control preimplantation embryo compaction. Nat. Cell Biol. 15, 1424–1433 [DOI] [PubMed] [Google Scholar]
- 5. Qualmann B., Koch D., Kessels M. M. (2011) Let's go bananas: revisiting the endocytic BAR code. EMBO J. 30, 3501–3515 [DOI] [PMC free article] [PubMed] [Google Scholar]
- 6. Peter B. J., Kent H. M., Mills I. G., Vallis Y., Butler P. J., Evans P. R., McMahon H. T. (2004) BAR domains as sensors of membrane curvature: the amphiphysin BAR structure. Science 303, 495–499 [DOI] [PubMed] [Google Scholar]
- 7. Pykäläinen A., Boczkowska M., Zhao H., Saarikangas J., Rebowski G., Jansen M., Hakanen J., Koskela E. V., Peränen J., Vihinen H., Jokitalo E., Salminen M., Ikonen E., Dominguez R., Lappalainen P. (2011) Pinkbar is an epithelial-specific BAR domain protein that generates planar membrane structures. Nat. Struct. Mol. Biol. 18, 902–907 [DOI] [PMC free article] [PubMed] [Google Scholar]
- 8. Zhao H., Pykäläinen A., Lappalainen P. (2011) I-BAR domain proteins: linking actin and plasma membrane dynamics. Curr. Opin. Cell Biol. 23, 14–21 [DOI] [PubMed] [Google Scholar]
- 9. Krugmann S., Jordens I., Gevaert K., Driessens M., Vandekerckhove J., Hall A. (2001) Cdc42 induces filopodia by promoting the formation of an IRSp53:Mena complex. Curr. Biol. 11, 1645–1655 [DOI] [PubMed] [Google Scholar]
- 10. Miki H., Yamaguchi H., Suetsugu S., Takenawa T. (2000) IRSp53 is an essential intermediate between Rac and WAVE in the regulation of membrane ruffling. Nature 408, 732–735 [DOI] [PubMed] [Google Scholar]
- 11. Lim K. B., Bu W., Goh W. I., Koh E., Ong S. H., Pawson T., Sudhaharan T., Ahmed S. (2008) The Cdc42 effector IRSp53 generates filopodia by coupling membrane protrusion with actin dynamics. J. Biol. Chem. 283, 20454–20472 [DOI] [PubMed] [Google Scholar]
- 12. Funato Y., Terabayashi T., Suenaga N., Seiki M., Takenawa T., Miki H. (2004) IRSp53/Eps8 complex is important for positive regulation of Rac and cancer cell motility/invasiveness. Cancer Res. 64, 5237–5244 [DOI] [PubMed] [Google Scholar]
- 13. Disanza A., Mantoani S., Hertzog M., Gerboth S., Frittoli E., Steffen A., Berhoerster K., Kreienkamp H. J., Milanesi F., Di Fiore P. P., Ciliberto A., Stradal T. E., Scita G. (2006) Regulation of cell shape by Cdc42 is mediated by the synergic actin-bundling activity of the Eps8-IRSp53 complex. Nat. Cell Biol. 8, 1337–1347 [DOI] [PubMed] [Google Scholar]
- 14. Fujiwara T., Mammoto A., Kim Y., Takai Y. (2000) Rho small G-protein-dependent binding of mDia to an Src homology 3 domain-containing IRSp53/BAIAP2. Biochem. Biophys. Res. Commun. 271, 626–629 [DOI] [PubMed] [Google Scholar]
- 15. Goh W. I., Lim K. B., Sudhaharan T., Sem K. P., Bu W., Chou A. M., Ahmed S. (2012) mDia1 and WAVE2 proteins interact directly with IRSp53 in filopodia and are involved in filopodium formation. J. Biol. Chem. 287, 4702–4714 [DOI] [PMC free article] [PubMed] [Google Scholar]
- 16. Suetsugu S., Miki H., Takenawa T. (1999) Identification of two human WAVE/SCAR homologues as general actin regulatory molecules which associate with the Arp2/3 complex. Biochem. Biophys. Res. Commun. 260, 296–302 [DOI] [PubMed] [Google Scholar]
- 17. Rohatgi R., Ma L., Miki H., Lopez M., Kirchhausen T., Takenawa T., Kirschner M. W. (1999) The interaction between N-WASP and the Arp2/3 complex links Cdc42-dependent signals to actin assembly. Cell 97, 221–231 [DOI] [PubMed] [Google Scholar]
- 18. Ho H. Y., Rohatgi R., Lebensohn A. M., Le Ma, Li J., Gygi S. P., Kirschner M. W. (2004) Toca-1 mediates Cdc42-dependent actin nucleation by activating the N-WASP-WIP complex. Cell 118, 203–216 [DOI] [PubMed] [Google Scholar]
- 19. Bu W., Chou A. M., Lim K. B., Sudhaharan T., Ahmed S. (2009) The Toca-1-N-WASP complex links filopodial formation to endocytosis. J. Biol. Chem. 284, 11622–11636 [DOI] [PMC free article] [PubMed] [Google Scholar]
- 20. Ferguson S. M., De Camilli P. (2012) Dynamin, a membrane-remodelling GTPase. Nat. Rev. Mol. Cell Biol. 13, 75–88 [DOI] [PMC free article] [PubMed] [Google Scholar]
- 21. Takei K., McPherson P. S., Schmid S. L., De Camilli P. (1995) Tubular membrane invaginations coated by dynamin rings are induced by GTPγS in nerve terminals. Nature 374, 186–190 [DOI] [PubMed] [Google Scholar]
- 22. Mundigl O., Ochoa G. C., David C., Slepnev V. I., Kabanov A., De Camilli P. (1998) Amphiphysin I antisense oligonucleotides inhibit neurite outgrowth in cultured hippocampal neurons. J. Neurosci. 18, 93–103 [DOI] [PMC free article] [PubMed] [Google Scholar]
- 23. Tsujita K., Suetsugu S., Sasaki N., Furutani M., Oikawa T., Takenawa T. (2006) Coordination between the actin cytoskeleton and membrane deformation by a novel membrane tubulation domain of PCH proteins is involved in endocytosis. J. Cell Biol. 172, 269–279 [DOI] [PMC free article] [PubMed] [Google Scholar]
- 24. Taylor M. J., Lampe M., Merrifield C. J. (2012) A feedback loop between dynamin and actin recruitment during clathrin-mediated endocytosis. PLoS Biol. 10, e1001302. [DOI] [PMC free article] [PubMed] [Google Scholar]
- 25. Govind S., Kozma R., Monfries C., Lim L., Ahmed S. (2001) Cdc42Hs facilitates cytoskeletal reorganization and neurite outgrowth by localizing the 58-kD insulin receptor substrate to filamentous actin. J. Cell Biol. 152, 579–594 [DOI] [PMC free article] [PubMed] [Google Scholar]
- 26. Macia E., Ehrlich M., Massol R., Boucrot E., Brunner C., Kirchhausen T. (2006) Dynasore, a cell-permeable inhibitor of dynamin. Dev. Cell 10, 839–850 [DOI] [PubMed] [Google Scholar]
- 27. Kirchhausen T., Macia E., Pelish H. E. (2008) Use of dynasore, the small molecule inhibitor of dynamin, in the regulation of endocytosis. Methods Enzymol. 438, 77–93 [DOI] [PMC free article] [PubMed] [Google Scholar]
- 28. Cao H., Garcia F., McNiven M. A. (1998) Differential distribution of dynamin isoforms in mammalian cells. Mol. Biol. Cell 9, 2595–2609 [DOI] [PMC free article] [PubMed] [Google Scholar]
- 29. Schlunck G., Damke H., Kiosses W. B., Rusk N., Symons M. H., Waterman-Storer C. M., Schmid S. L., Schwartz M. A. (2004) Modulation of Rac localization and function by dynamin. Mol. Biol. Cell 15, 256–267 [DOI] [PMC free article] [PubMed] [Google Scholar]
- 30. Gu C., Yaddanapudi S., Weins A., Osborn T., Reiser J., Pollak M., Hartwig J., Sever S. (2010) Direct dynamin-actin interactions regulate the actin cytoskeleton. EMBO J. 29, 3593–3606 [DOI] [PMC free article] [PubMed] [Google Scholar]
- 31. McNiven M. A., Kim L., Krueger E. W., Orth J. D., Cao H., Wong T. W. (2000) Regulated interactions between dynamin and the actin-binding protein cortactin modulate cell shape. J. Cell Biol. 151, 187–198 [DOI] [PMC free article] [PubMed] [Google Scholar]
- 32. Krueger E. W., Orth J. D., Cao H., McNiven M. A. (2003) A dynamin-cortactin-Arp2/3 complex mediates actin reorganization in growth factor-stimulated cells. Mol. Biol. Cell 14, 1085–1096 [DOI] [PMC free article] [PubMed] [Google Scholar]
- 33. Vallotton P., Danuser G., Bohnet S., Meister J. J., Verkhovsky A. B. (2005) Tracking retrograde flow in keratocytes: news from the front. Mol. Biol. Cell 16, 1223–1231 [DOI] [PMC free article] [PubMed] [Google Scholar]
- 34. Kerber M. L., Jacobs D. T., Campagnola L., Dunn B. D., Yin T., Sousa A. D., Quintero O. A., Cheney R. E. (2009) A novel form of motility in filopodia revealed by imaging myosin-X at the single-molecule level. Curr. Biol. 19, 967–973 [DOI] [PMC free article] [PubMed] [Google Scholar]
- 35. Watanabe T. M., Tokuo H., Gonda K., Higuchi H., Ikebe M. (2010) Myosin-X induces filopodia by multiple elongation mechanism. J. Biol. Chem. 285, 19605–19614 [DOI] [PMC free article] [PubMed] [Google Scholar]
- 36. Schafer D. A. (2004) Regulating actin dynamics at membranes: a focus on dynamin. Traffic 5, 463–469 [DOI] [PubMed] [Google Scholar]
- 37. Baldassarre M., Pompeo A., Beznoussenko G., Castaldi C., Cortellino S., McNiven M. A., Luini A., Buccione R. (2003) Dynamin participates in focal extracellular matrix degradation by invasive cells. Mol. Biol. Cell 14, 1074–1084 [DOI] [PMC free article] [PubMed] [Google Scholar]
- 38. McNiven M. A., Baldassarre M., Buccione R. (2004) The role of dynamin in the assembly and function of podosomes and invadopodia. Front. Biosci. 9, 1944–1953 [DOI] [PubMed] [Google Scholar]
- 39. Ferguson S. M., Ferguson S., Raimondi A., Paradise S., Shen H., Mesaki K., Ferguson A., Destaing O., Ko G., Takasaki J., Cremona O., O'Toole E., De Camilli P. (2009) Coordinated actions of actin and BAR proteins upstream of dynamin at endocytic clathrin-coated pits. Dev. Cell 17, 811–822 [DOI] [PMC free article] [PubMed] [Google Scholar]
- 40. Lee K., Gallop J. L., Rambani K., Kirschner M. W. (2010) Self-assembly of filopodia-like structures on supported lipid bilayers. Science 329, 1341–1345 [DOI] [PMC free article] [PubMed] [Google Scholar]
- 41. Miki H., Sasaki T., Takai Y., Takenawa T. (1998) Induction of filopodium formation by a WASP-related actin-depolymerizing protein N-WASP. Nature 391, 93–96 [DOI] [PubMed] [Google Scholar]
- 42. Mooren O. L., Kotova T. I., Moore A. J., Schafer D. A. (2009) Dynamin2 GTPase and cortactin remodel actin filaments. J. Biol. Chem. 284, 23995–24005 [DOI] [PMC free article] [PubMed] [Google Scholar]
- 43. Yamada H., Abe T., Satoh A., Okazaki N., Tago S., Kobayashi K., Yoshida Y., Oda Y., Watanabe M., Tomizawa K., Matsui H., Takei K. (2013) Stabilization of actin bundles by a dynamin 1/cortactin ring complex is necessary for growth cone filopodia. J. Neurosci. 33, 4514–4526 [DOI] [PMC free article] [PubMed] [Google Scholar]
- 44. Schafer D. A., Weed S. A., Binns D., Karginov A. V., Parsons J. T., Cooper J. A. (2002) Dynamin2 and cortactin regulate actin assembly and filament organization. Curr. Biol. 12, 1852–1857 [DOI] [PMC free article] [PubMed] [Google Scholar]
- 45. Vignjevic D., Kojima S., Aratyn Y., Danciu O., Svitkina T., Borisy G. G. (2006) Role of fascin in filopodial protrusion. J. Cell Biol. 174, 863–875 [DOI] [PMC free article] [PubMed] [Google Scholar]
- 46. Jovceva E., Larsen M. R., Waterfield M. D., Baum B., Timms J. F. (2007) Dynamic cofilin phosphorylation in the control of lamellipodial actin homeostasis. J. Cell Sci. 120, 1888–1897 [DOI] [PubMed] [Google Scholar]
- 47. Mallavarapu A., Mitchison T. (1999) Regulated actin cytoskeleton assembly at filopodium tips controls their extension and retraction. J. Cell Biol. 146, 1097–1106 [DOI] [PMC free article] [PubMed] [Google Scholar]
- 48. Ahmed S., Goh W. I., Bu W. (2010) I-BAR domains, IRSp53 and filopodium formation. Semin. Cell Dev. Biol. 21, 350–356 [DOI] [PubMed] [Google Scholar]
- 49. Disanza A., Bisi S., Winterhoff M., Milanesi F., Ushakov D. S., Kast D., Marighetti P., Romet-Lemonne G., Müller H. M., Nickel W., Linkner J., Waterschoot D., Ampè C., Cortellino S., Palamidessi A., Dominguez R., Carlier M. F., Faix J., Scita G. (2013) CDC42 switches IRSp53 from inhibition of actin growth to elongation by clustering of VASP. EMBO J. 32, 2735–2750 [DOI] [PMC free article] [PubMed] [Google Scholar]
- 50. Millard T. H., Bompard G., Heung M. Y., Dafforn T. R., Scott D. J., Machesky L. M., Fütterer K. (2005) Structural basis of filopodia formation induced by the IRSp53/MIM homology domain of human IRSp53. EMBO J. 24, 240–250 [DOI] [PMC free article] [PubMed] [Google Scholar]
- 51. Saarikangas J., Zhao H., Pykäläinen A., Laurinmäki P., Mattila P. K., Kinnunen P. K., Butcher S. J., Lappalainen P. (2009) Molecular mechanisms of membrane deformation by I-BAR domain proteins. Curr. Biol. 19, 95–107 [DOI] [PubMed] [Google Scholar]
- 52. Barzik M., Kotova T. I., Higgs H. N., Hazelwood L., Hanein D., Gertler F. B., Schafer D. A. (2005) Ena/VASP proteins enhance actin polymerization in the presence of barbed end capping proteins. J. Biol. Chem. 280, 28653–28662 [DOI] [PMC free article] [PubMed] [Google Scholar]
- 53. Menna E., Disanza A., Cagnoli C., Schenk U., Gelsomino G., Frittoli E., Hertzog M., Offenhauser N., Sawallisch C., Kreienkamp H. J., Gertler F. B., Di Fiore P. P., Scita G., Matteoli M. (2009) Eps8 regulates axonal filopodia in hippocampal neurons in response to brain-derived neurotrophic factor (BDNF). PLoS Biol. 7, e1000138. [DOI] [PMC free article] [PubMed] [Google Scholar]
Associated Data
This section collects any data citations, data availability statements, or supplementary materials included in this article.